Market Minds Advisory
Cancer Tissue Diagnostics Market

Cancer Tissue Diagnostics Market: Molecular Pathology, Digital Imaging, and Precision Oncology Workflows Through 2036

Pathology labs are running out of trained staff faster than tumour board turnaround times can absorb, pushing hospitals toward digital slide scanning even as immunohistochemistry stays the daily workhorse behind most cancer diagnoses.

Lead Analyst

Alice Ballenger

Published

September 2026

Make Smarter Decisions with Customized Research Insights

Request a free sample report and evaluate market opportunities, growth trends, and competitive dynamics relevant to your business needs.

2025 MARKET VALUE$9.8BMarket Size 2025
2036 FORECAST VALUE$26.9BBase Case , 2026 to 2036
CAGR 2026 TO 20369.6 %Bull 10.9% / Bear 8.4%
INCREMENTAL OPPORTUNITY$16.1BNet 10- year value creation
EXPANSION MULTIPLE2.50x2036 value over 2026 base
Strategic Levers
M&A Pipeline
Regional Outlook
Country Rankings
Competitive Intelligence
Segmental Deep-dive
Call-Us : 91 93563 13602

Executive Snapshot and Market Trajectory

Pathology departments are running out of trained subspecialists faster than tumour board turnaround expectations are shrinking, forcing hospitals to lean on digital slide scanning and AI triage tools just to keep diagnostic queues moving. That staffing pressure is reshaping which vendors win laboratory contracts right now.
Digital pathology and AI-assisted image analysis is pulling ahead of every other technology, growing at nearly twice the market's blended rate as labs digitise slide workflows to cope with persistent subspecialist shortages affecting hospitals worldwide. East Asia now holds the largest single regional share, reflecting both China's expanding cancer diagnostic testing volume and the region's rapidly scaling molecular pathology infrastructure investment across its largest urban hospital systems.
A concentrated group of diagnostics majors, Roche, Agilent, Thermo Fisher, Illumina, and Leica Biosystems among them, still set the pace on reagent chemistry and platform integration, while digital pathology AI software remains a faster-moving, more fragmented competitive front populated by smaller specialist software developers. Companion diagnostic approval pathways and reimbursement recognition for next-generation sequencing panels are both shaping how quickly precision oncology testing displaces older single-marker assays across major health systems worldwide.
Market Definition
The cancer tissue diagnostics market covers assays, instruments, and software used to analyse tumour tissue specimens for cancer diagnosis, subtyping, and treatment selection, including immunohistochemistry, in situ hybridization, molecular pathology, next-generation sequencing tissue panels, and digital pathology image analysis. It excludes liquid biopsy and blood-based diagnostics and excludes cancer screening tests performed outside a tissue specimen context.
Base Year Value
$9.8B in 2025 (MMA Primary Research Dataset, August 2026)
Forecast Period
2026 to 2036, eleven discrete annual values
CAGR
9.6% base case. Bull 10.9%. Bear 8.4%.
Fastest Growth Segment
Digital Pathology and AI-Assisted Image Analysis: 17.2% CAGR
Fastest Growth Country
India: 12.8% CAGR
Fastest Growth Region
South Asia and Pacific: 11.6% CAGR
Largest Region
East Asia: 28% of 2025 global value
Market Leaders
Roche Diagnostics, Agilent Technologies, Thermo Fisher Scientific, Illumina Inc., Leica Biosystems. Source: MMA Analysis based on company annual reports.
Primary Survey
n=3,800 procurement and R&D decision-makers, Q4 2025, six countries
Methodology
Demand-side build-up, cross-validated against public data, 47 expert interviews

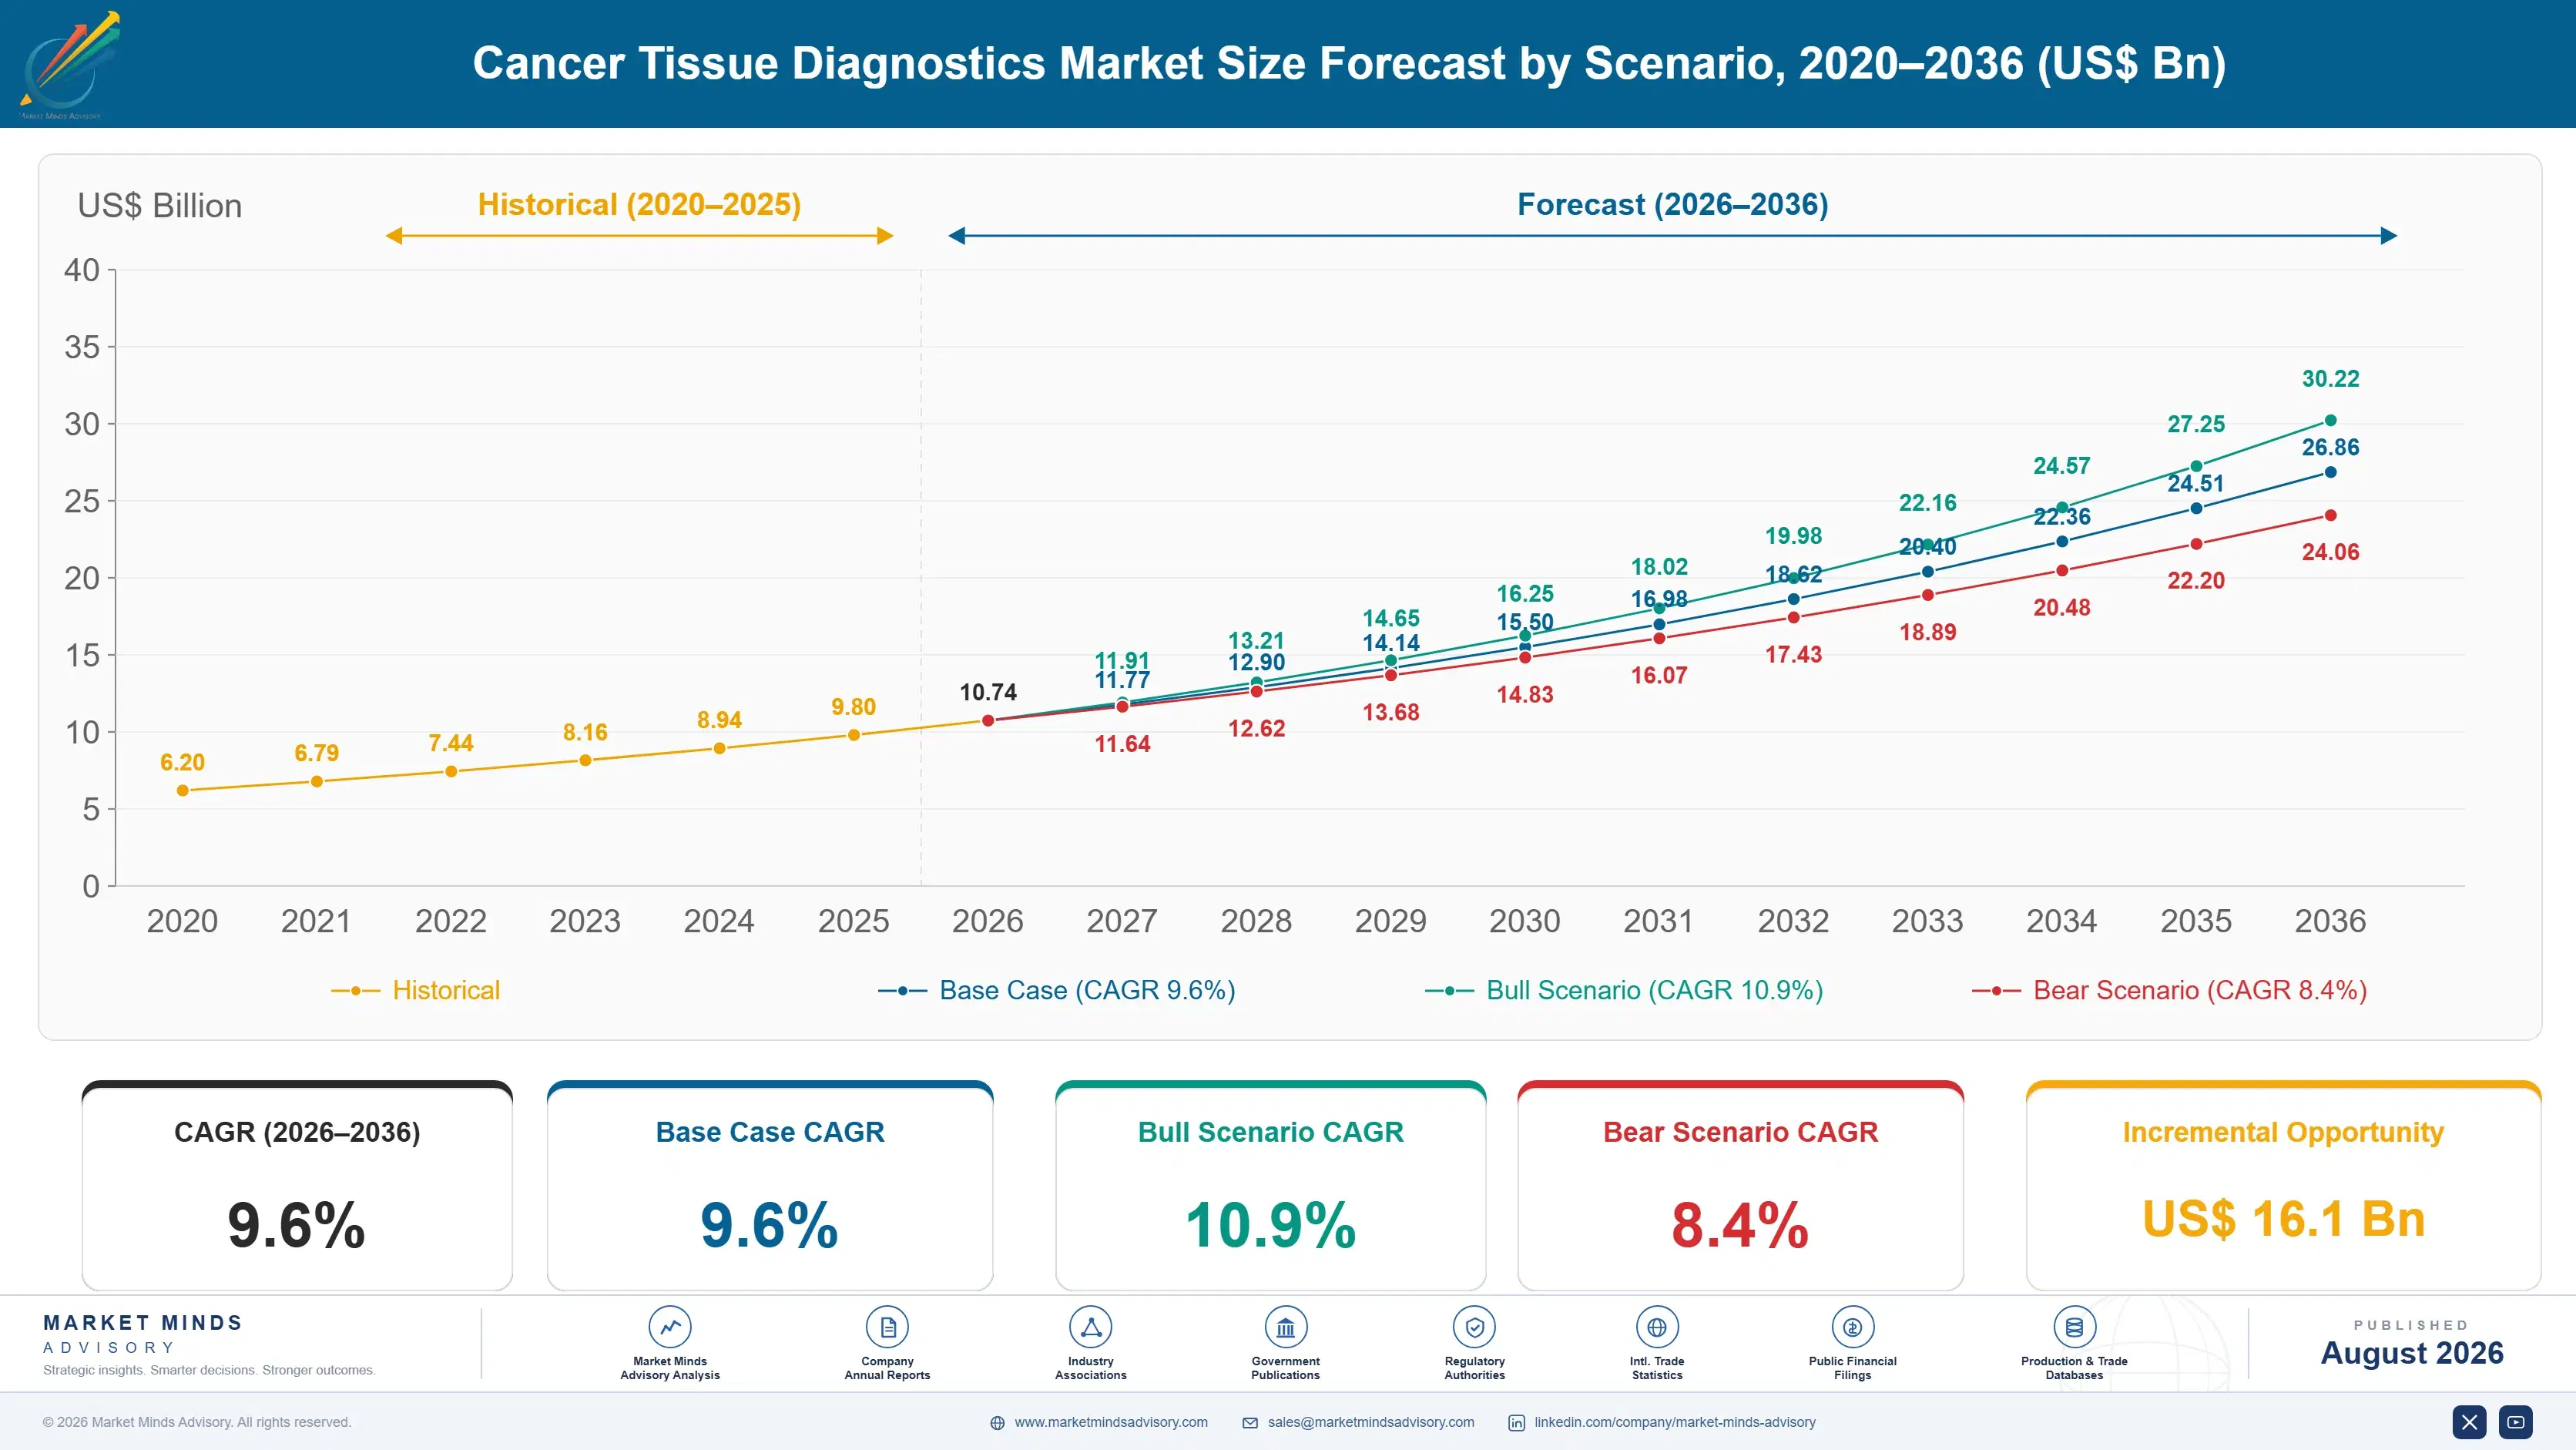
Cancer Tissue Diagnostics Market Forecast Scenarios

cancer-tissue-diagnostics-market-size-forecast-scenario-1787304065020
Between 2020 and 2025 the market grew steadily as precision oncology expanded the number of biomarkers routinely tested per tumour, a trend that accelerated once next-generation sequencing panels began replacing sequential single-marker testing at larger academic centres. Tissue-based biomarker testing volume across the MMA-tracked laboratory network sample rose meaningfully across that five-year stretch, concentrated heavily at comprehensive cancer centres.
The base case through 2036 rests on three mechanisms: continued expansion of targeted therapy approvals that require companion diagnostic tissue testing before treatment can begin, pathology departments adopting digital slide scanning and AI triage to offset a persistent subspecialist shortage affecting laboratories worldwide across nearly every developed health system, and diagnostics makers bundling reagent consumables with recurring software and instrument service contracts that lock in multi-year laboratory relationships rather than one-off equipment purchases.
A bull scenario turns on faster regulatory approval and reimbursement recognition for next-generation sequencing panels across more national health systems, pulling adoption forward at laboratories currently rationing molecular testing to complex cases only. The bear case is continued reimbursement fragmentation and pathologist shortages severe enough to slow testing volume growth regardless of how many new biomarkers become clinically actionable.

Where Routine Staining Meets Precision Oncology Testing

Cancer tissue diagnostics spans a wide technology spectrum, from a routine immunohistochemistry stain costing a few dollars per slide to a several-hundred-dollar next-generation sequencing panel covering dozens of biomarkers in a single tissue specimen at once. That spread means blended average selling price tells you almost nothing about where the actual commercial opportunity and margin concentration genuinely sit across the full testing continuum, and treating this as one undifferentiated ass
MARKET CONCENTRATIONCR5 52%top five diagnostics makers hold just over half combined share
AVERAGE SELLING PRICE$185 per biomarker testblended price spanning IHC, molecular, and sequencing panel formats
TOP PRODUCING COUNTRYUSA, 24% shareleads global reagent development and companion diagnostic approval volume
CAPACITY UTILISATION81%reagent and instrument manufacturers running near available production throughput
TRADE INTENSITY38% cross-bordershare of finished reagents and instruments shipped across national borders
FEEDSTOCK COST SHARE33% of COGSantibody and reagent raw materials within total assay production cost
Immunohistochemistry remains a scale business won on reagent reliability and instrument service contracts, where established makers compete mostly on turnaround time and pathologist trust built over decades of daily use. Molecular and sequencing-based testing behaves completely differently, priced on biomarker coverage and clinical validation depth, and sold through direct relationships with comprehensive cancer centres and companion diagnostic partnerships with pharmaceutical sponsors, a sales motion closer to specialty biopharma than routine lab supply.
Over the next decade, companion diagnostic approval pathways, pathologist workforce shortages driving digital and AI adoption, and rising testing volume in fast-growing Asian health systems will keep reshaping who competes profitably at each end of this technology spectrum.
"Every lab still budgets for immunohistochemistry like it's a commodity, but the molecular and sequencing side of the bench is where pharma partnerships and platform lock-in actually decide who wins the account."
Director, Oncology Diagnostics and Precision Medicine Practice · MMA Healthcare

Market Trends

Pathologist Shortage Drives Digital Slide Adoption

Pathology departments are digitising slide workflows specifically to offset a subspecialist shortage that has left many hospitals unable to recruit fellowship-trained oncologic pathologists fast enough to match rising testing volume. Roughly 46% of United States academic pathology departments reported using digital slide scanning as part of routine diagnostic workflow in 2025, up from under 18% four years earlier, largely driven by staffing pressure rather than diagnostic accuracy differences alone. Device makers are responding by bundling AI-assisted triage tools directly into scanning platforms, since faster case prioritisation increasingly decides which system a pathology department adopts first.
Market Impact: 27% rise in testing volume tracked
Companion Diagnostics Increasingly Bundled With Drug Approval

Targeted therapy approvals increasingly arrive bundled with a mandatory companion diagnostic requirement, meaning a tissue test must return a specific biomarker result before a patient can access the matched therapy at all under current prescribing guidelines. Roughly 62% of new oncology drug approvals since 2022 carried a companion diagnostic requirement, up meaningfully from prior years, embedding diagnostics revenue directly into the drug launch timeline itself rather than as an afterthought. Diagnostics makers are responding by co-developing tests alongside pharmaceutical sponsors earlier in the drug development pipeline rather than waiting until after approval is granted.
Market Impact: Saves roughly $2,400 per patient

Market Opportunities and Growth Drivers

Expanding Targeted Therapy Pipeline Drives Biomarker Testing

Targeted and immuno-oncology therapy approvals keep expanding the number of biomarkers routinely tested per tumour, since matching a patient to the correct therapy increasingly requires confirming a specific mutation, expression level, or fusion event before treatment begins under current clinical guidelines. Biomarker testing volume across the MMA-tracked laboratory network sample rose roughly 27% since 2021, a trend oncology associations expect to continue as more targeted therapies reach approval each year. Each newly approved targeted therapy effectively adds another biomarker to standard testing panels, multiplying diagnostic demand directly alongside pharmaceutical pipeline growth rather than trailing it.
Market Impact: Rations panel use to roughly 40%

Comprehensive Panels Cut Repeat Biopsy and Delay Costs

Comprehensive next-generation sequencing panels that test dozens of biomarkers simultaneously are replacing sequential single-marker testing at larger cancer centres, since sequential testing wastes limited tissue specimens and delays treatment decisions considerably for patients awaiting results. Laboratory economics data shows comprehensive panel testing saves an estimated $2,400 per patient in reduced repeat biopsy and delayed treatment costs versus sequential single-marker testing still used at many smaller facilities, a figure hospital administrators increasingly cite directly when approving sequencing platform capital purchases at budget committee meetings held each and every single fiscal quarter.
Market Impact: Cited by 44% of laboratories survey

Market Restraints and Challenges

Reimbursement Coding Lag Slows Comprehensive Panel Adoption

Reimbursement coding for comprehensive next-generation sequencing panels still lags single-marker testing in several health systems, with payers treating broad panels as an optional upgrade rather than a distinct, clinically necessary intervention deserving separate reimbursement. The root cause is coding frameworks that predate widespread panel testing adoption and have not been updated to reflect current treatment guidelines favouring comprehensive testing. Laboratories in cost-constrained systems ration panel testing to only the most complex cases as a result, and several diagnostics makers are now funding health economics studies specifically to support updated coding proposals with major payers.
Market Impact: 46% of academic departments now dig

Pathologist Shortage Caps Laboratory Testing Capacity

Pathologist and molecular technologist shortages limit how quickly laboratories can scale testing volume regardless of instrument capacity, since interpreting complex molecular results still requires trained specialists that many regions simply cannot recruit fast enough. Roughly 44% of community hospital laboratories surveyed by MMA cited staffing shortage as the primary constraint on expanding molecular testing capacity, ahead of budget or instrument availability. Diagnostics makers are responding with AI-assisted interpretation tools and centralised reference laboratory partnerships that let smaller hospitals send complex cases out rather than build in-house capability from scratch each time.
Market Impact: 62% of new approvals require testin
3 additional market trends, 2 additional growth drivers, and 4 additional restraints and challenges are covered in the full report. Contact sales@marketmindsadvisory.com to access the complete intelligence.

Segment CAGR and Growth Architecture

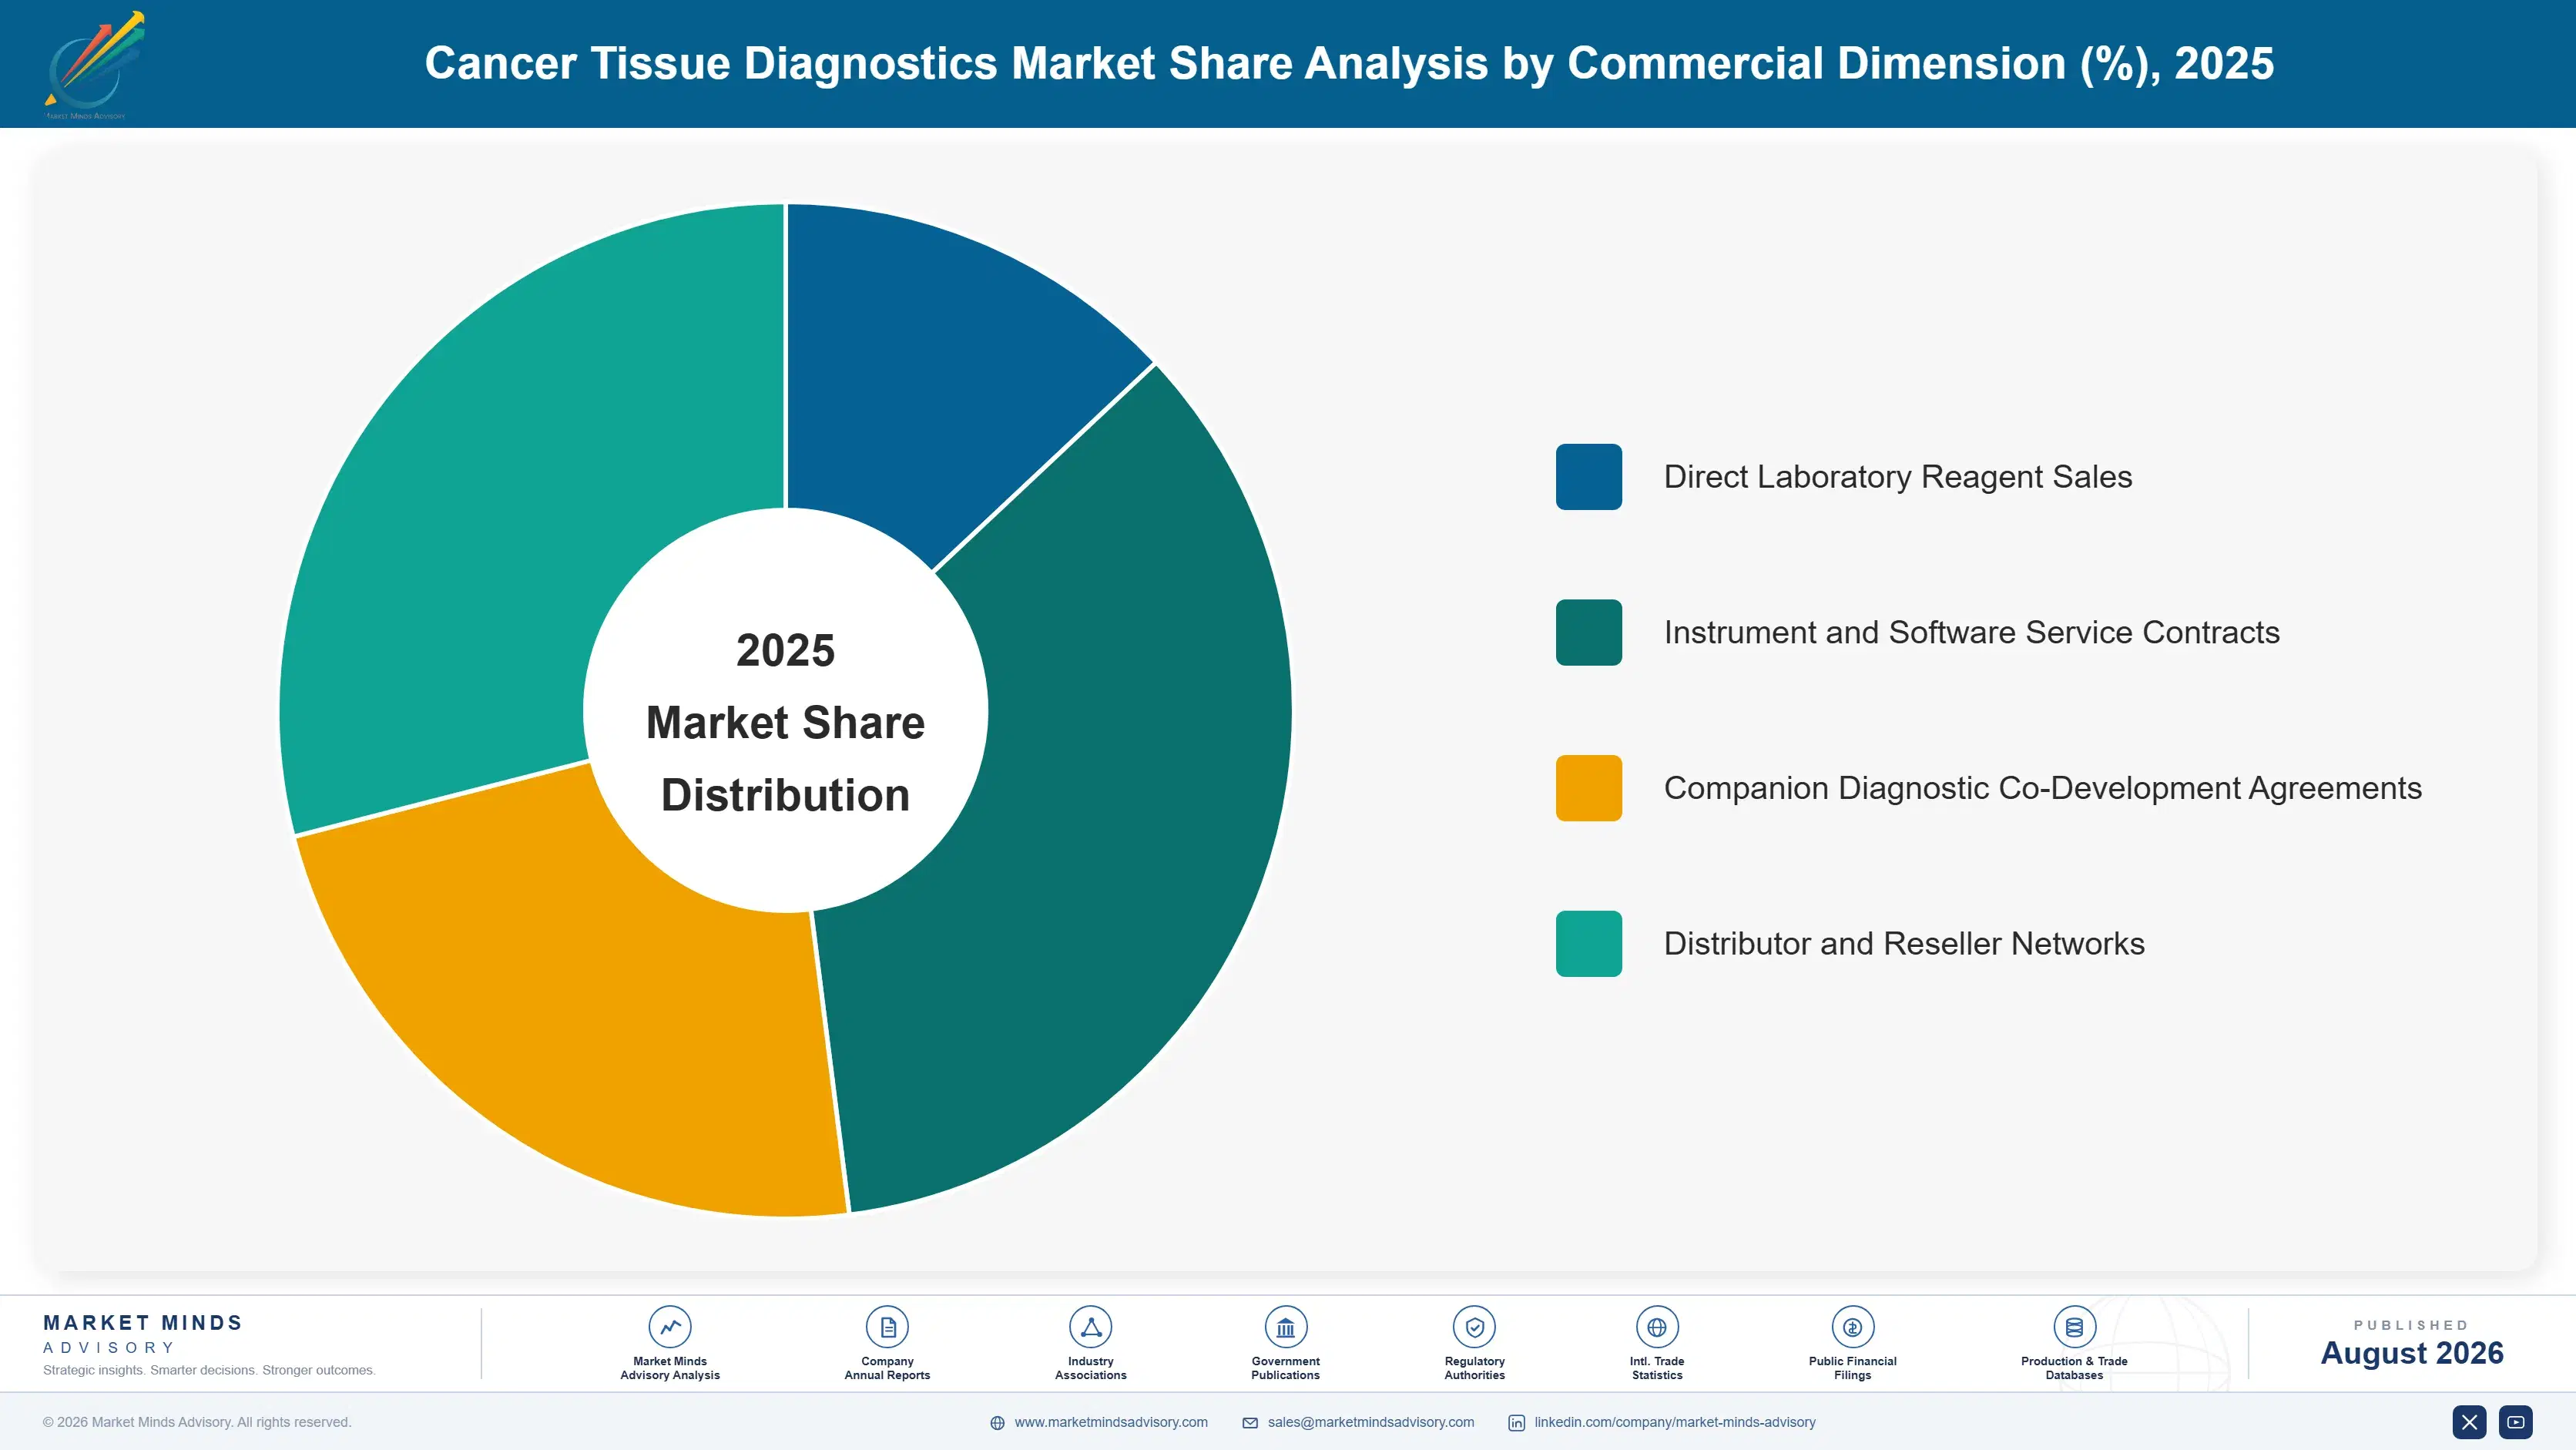
Segmentation follows testing technology, the dimension pathology laboratories themselves use to justify purchase, since immunohistochemistry, molecular pathology, sequencing, and digital pathology systems each demand distinct instrumentation, staff training programs, and reimbursement coding pathways that rarely overlap with one another in daily laboratory operations across most large healthcare institutions studied closely in this entire report.
cancer-tissue-diagnostics-market-market-share-analysis-1787304065566

Digital Pathology and AI-Assisted Image Analysis

Digital pathology and AI-assisted image analysis is the fastest-growing technology category today, adopted specifically to offset pathologist shortages by triaging cases, flagging likely malignancies, and letting subspecialists review scanned slides remotely rather than requiring physical presence at a microscope in a shared reading room. Laboratories value the workflow flexibility this creates, since digital slides can be routed to any credentialed pathologist regardless of physical location, expanding effective staffing capacity without new hires or relocation costs. Growth concentrates among larger hospital systems with the capital budget to invest in scanning infrastructure and archival storage, while smaller community laboratories remain slower to adopt given the upfront equipment cost relative to their annual case volume and staffing budget.
CAGR 17.2%

Next-Generation Sequencing Tissue Panels

Next-generation sequencing tissue panels are the second-fastest category, propelled by targeted therapy approvals that increasingly require comprehensive biomarker profiling before treatment selection can even begin. Panels covering dozens of genes in a single run are replacing sequential single-marker tests, conserving limited tissue specimens and shortening the time between biopsy and treatment decision considerably for patients and their treating oncologists. Purchasing typically runs through capital equipment budgets at comprehensive cancer centres, reflecting the sequencing instrument investment required alongside the ongoing per-panel reagent cost that accrues with every patient tested across the calendar year. Adoption is concentrated among academic and comprehensive cancer centres with the bioinformatics staff needed to interpret complex sequencing output accurately.
CAGR 14.8%
Full segment breakdown across 6 segments available in the complete report.

Regional Architecture and Country Demand Map

East Asia holds the largest single share, reflecting China's expanding cancer diagnostic testing volume and the region's rapidly scaling molecular pathology infrastructure. South Asia and the Pacific is growing fastest as cancer diagnosis rates and testing infrastructure expand from a comparatively small installed base across the region.

North America

United States comprehensive cancer centres carry the highest biomarker testing depth per patient globally, driven by dense concentration of targeted therapy approvals and companion diagnostic requirements built up over more than a decade of precision oncology development. Reimbursement recognition for next-generation sequencing panels has expanded steadily since 2023, though coverage still varies meaningfully by state and individual insurer, leaving some laboratories to absorb testing cost without full reimbursement offset. Canadian provincial health systems trail US adoption by several years, largely due to slower molecular pathology reimbursement recognition across provincial plans. Community hospital laboratories remain the last meaningful pocket of single-marker testing holdouts across the region, constrained mainly by capital cost and testing volume relative to larger academic centres nearby.
Share: 27% | CAGR: 9.9% (2026 to 2036)

Western Europe

German and British pathology departments were early adopters of digital slide scanning standards, publishing much of the clinical workflow data other regions now cite when justifying their own laboratory modernisation investments before local trial data existed. United Kingdom National Health Service procurement still favours centrally negotiated reagent contracts, concentrating purchasing among fewer diagnostics makers than the more fragmented US laboratory market currently allows for. French and Italian cancer centres have invested heavily in next-generation sequencing infrastructure specifically, pulling adoption forward faster than reimbursement policy alone would otherwise support. Premium platform makers concentrate marketing spend here given the region's high average testing volume per comprehensive cancer centre relative to most emerging markets tracked worldwide.
Share: 21% | CAGR: 8.2% (2026 to 2036)
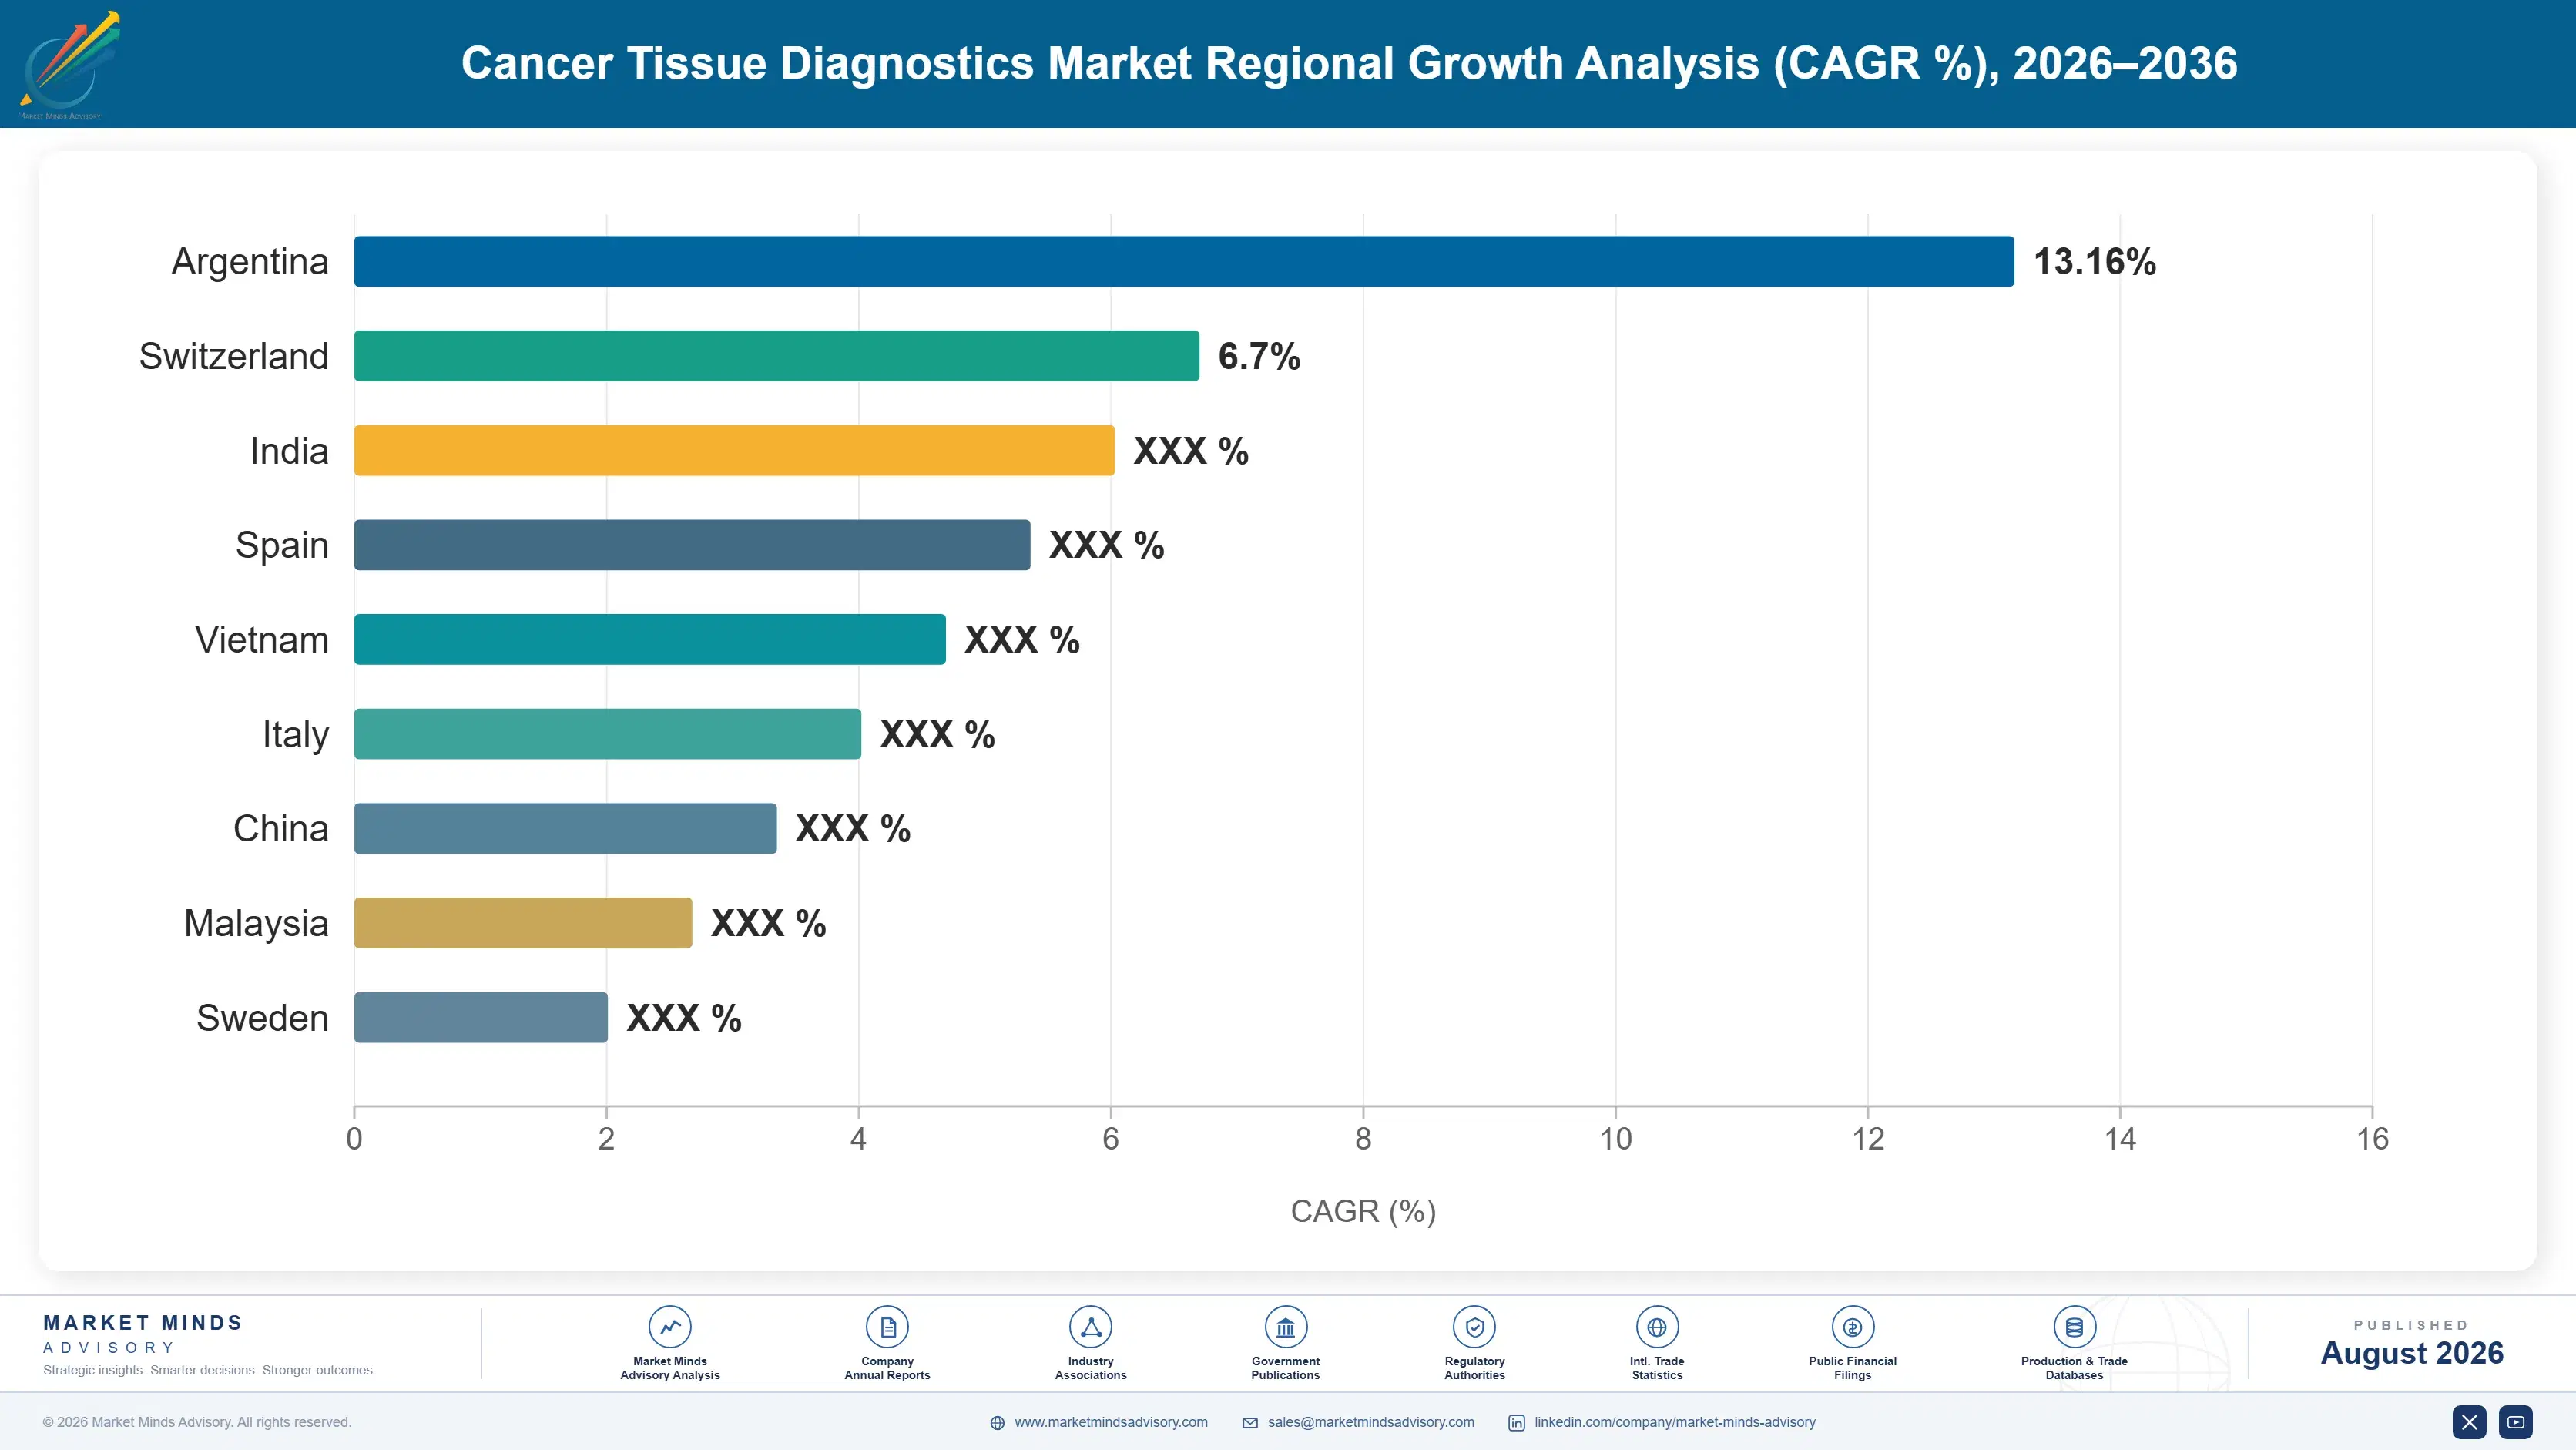
Regional intelligence for 5 additional markets available in the complete report: East Asia, South Asia and Pacific, Latin America, Middle East and Africa, Eastern Europe. Contact sales@marketmindsadvisory.com.
cancer-tissue-diagnostics-market-country-cagr-analysis-1787304066082

Where Tissue Diagnostics Margin Actually Sits

Margin in cancer tissue diagnostics concentrates wherever a manufacturer can attach recurring reagent and software revenue to its instrument placement, not wherever reagent volume alone is largest. Four commercial moves separate makers capturing durable precision oncology margin from those still competing on commodity immunohistochemistry stain price alone against interchangeable regional suppliers with very little real differentiation.

Co-Developing Companion Diagnostics With Pharma Sponsors

Co-developing companion diagnostic assays alongside pharmaceutical sponsors earlier in the drug development pipeline embeds a manufacturer's test directly into the drug's regulatory approval and launch materials, creating a durable revenue stream tied to prescription volume rather than laboratory purchasing decisions alone. Manufacturers with co-development partnerships report companion diagnostic revenue growing roughly 40% faster than reagent sales sold independently of a drug launch, since the sponsor's own sales force effectively pre-sells the paired diagnostic test to prescribing oncologists during launch. That direct tie to drug approval timelines gives co-development partners a revenue visibility advantage few independent reagent sales can match.
Market Impact: Grows revenue roughly 40% faster ov

Bundling Instruments With Recurring Reagent Contracts

Bundling instrument placement with recurring reagent and software service contracts converts a single capital sale into years of consumable revenue that dwarfs the instrument's own price by a wide margin over time. Manufacturers with placed instrument bases report reagent attachment rates above 90%, since a laboratory that has already validated its assay workflow around a specific platform rarely switches vendors for a single reagent lot's cost difference. That switching cost compounds over an instrument's multi-year service life into meaningfully larger total contract value than any single placement would suggest at the time of sale.
Market Impact: Locks in reagent attachment rates a

Funding Health Economics Data to Speed Approval

Funding health economics studies that quantify reduced repeat biopsy costs, faster treatment initiation, and fewer delayed diagnoses gives a manufacturer a defensible basis for capital equipment approval that competitors without comparable data cannot match quickly or cheaply. Manufacturers with published workflow economics data report hospital approval cycles roughly 30% faster than those relying purely on analytical accuracy claims alone, since hospital finance committees increasingly weight operational savings as heavily as clinical performance in capital purchase decisions each budget cycle. That approval speed advantage compounds across hospital accounts, since published data travels faster than any single sales call.
Market Impact: Cuts hospital approval cycles by 30

Building AI Interpretation Partnerships for Smaller Labs

Expanding AI-assisted interpretation partnerships that let smaller community laboratories send complex digital slides to centralised reference pathologists removes a real staffing barrier that otherwise excludes an entire hospital segment from advanced testing entirely and permanently. Manufacturers marketing directly against pathologist shortage report meaningfully faster community hospital adoption than those competing purely on instrument specification, cutting the effective sales cycle by roughly 25% in markets where staffing shortages have historically excluded smaller facilities from advanced diagnostics of any kind, regardless of that technology's underlying clinical accuracy or performance record over time.
Market Impact: Cuts the onboarding sales cycle by

Who Controls the Margin Pool

Concentration sits moderate at CR5 52%, evaluated on global reagent, instrument, and software revenue combined, the basis that best captures scale across commodity IHC stain lines and premium sequencing platforms alike. Roche and Thermo Fisher lead the immunohistochemistry and molecular sequencing segments respectively, while the gap down to mid-tier specialty challengers is narrower than the headline CR5 figure alone suggests.
Competitive activity now runs across three fronts simultaneously. Precision oncology incumbents compete on companion diagnostic co-development relationships and comprehensive panel breadth, since that combination increasingly decides which platform a comprehensive cancer centre standardises on. Commodity IHC reagent makers compete mainly on turnaround time and distribution reach, where price still dominates purchasing decisions at smaller laboratories. A third front has opened around digital pathology AI software, as specialist developers compete for integration partnerships with the instrument majors.

Emerging pressure is coming from Chinese sequencing and reagent manufacturers scaling domestic production fast enough to threaten import-led supply models across East Asia specifically. Rankings could shift if reimbursement coding reform resolves the current parity gap between single-marker and comprehensive panel testing, removing one barrier protecting early movers from cheaper challengers.
cancer-tissue-diagnostics-market-company-positioning-matrix-1787304066607

Competitive Moat and Risk Dimensions

ROCHE DIAGNOSTICS

Moat: Companion Diagnostic Portfolio Depth

Roche's dual position as both a major pharmaceutical developer and a diagnostics maker gives it companion diagnostic co-development relationships that standalone diagnostics competitors cannot easily replicate, anchoring its premium immunohistochemistry and molecular testing formulary placement across major cancer centres worldwide, reinforced by decades of accumulated regulatory experience.
ROCHE DIAGNOSTICS

Risk: Reagent Franchise Concentration Risk

A meaningful share of Roche's diagnostics revenue depends on continued reagent consumable sales tied to its installed instrument base and closed platform design. Any accelerated shift toward open, multi-vendor laboratory platforms would erode the closed-system advantage that currently protects its recurring reagent revenue from cheaper third-party alternatives.
THERMO FISHER SCIENTIFIC

Moat: Sequencing Platform Scale and Breadth

Thermo Fisher's broad instrument portfolio spanning sequencing, sample preparation, and laboratory informatics gives it integration depth beyond any single assay that newer entrants cannot replicate quickly, anchoring its position across the full molecular testing workflow from specimen intake through final report generation and delivery to the treating oncologist.
THERMO FISHER SCIENTIFIC

Risk: Illumina Sequencing Competition Risk

Thermo Fisher's sequencing platforms compete directly against Illumina's dominant installed base in comprehensive panel testing, and any meaningful share loss in sequencing would ripple into its broader consumable and informatics revenue tied to that same installed base across every affected laboratory account and geography served.

Players Tracked

Prominent Players

Roche Diagnostics
Agilent Technologies Inc.
Thermo Fisher Scientific Inc.
Illumina Inc.
Leica Biosystems

Other Key Players

Abbott Laboratories
Bio-Rad Laboratories Inc.
Myriad Genetics Inc.
Exact Sciences Corporation
Guardant Health Inc.
NeoGenomics Laboratories Inc.
Sakura Finetek USA Inc.
Revvity Inc.
Qiagen N.V.
Bio-Techne Corporation
PathAI Inc.
Paige.AI Inc.
Indica Labs Inc.
3DHistech Ltd.
Visiopharm A/S

Recent Developments

JANUARY 2025

Illumina Launches Next-Generation Tissue Oncology Panel

Illumina launched an updated tissue-based next-generation sequencing oncology panel featuring expanded biomarker coverage and faster turnaround time for busy clinical laboratories serving comprehensive cancer centres. The launch was an organic product introduction rather than an acquisition, reflecting continued internal investment in the comprehensive panel testing category.
Signal: Expanded biomarker coverage is becoming th
MAY 2025

Roche Signs Major Reference Laboratory Supply Agreement

Roche Diagnostics signed a multi-year supply agreement with a large United States reference laboratory network to provide immunohistochemistry and companion diagnostic reagents across its testing operations. The agreement is a commercial supply contract rather than a joint venture or acquisition, securing volume ahead of anticipated testing demand growth.
Signal: Large reference laboratory networks are in
SEPTEMBER 2025

Thermo Fisher Acquires Digital Pathology AI Developer

Thermo Fisher Scientific acquired a digital pathology AI software developer to expand its companion diagnostic image analysis capability beyond its existing instrument portfolio and into adjacent software territory. The transaction was structured as a full acquisition rather than a licensing arrangement or minority equity stake.
Signal: Instrument incumbents are acquiring their

Antibody and Sequencing Reagent Exposure

Monoclonal antibodies and specialty reagent chemistry account for roughly 33% of total assay production cost, sourced mainly from specialty biologics manufacturers in the United States, Germany, and Switzerland who supply most of the industry's qualified antibody clones. Sequencing consumables and flow cell components add a second, growing cost layer specific to next-generation sequencing panels sold at scale.
Thermo Fisher Scientific's 2024 annual report cited elevated costs for specialty antibody and sequencing reagent production as a meaningful drag on diagnostics margins, tracing much of it to biologics manufacturing supply disruptions that lingered from 2022 into 2023. Reagent prices rose double digits at the peak of that disruption before partially easing through 2024, and several manufacturers reported extending supplier qualification to additional antibody producers to reduce single-source dependency going forward.

Smaller regional diagnostics makers without diversified reagent sourcing absorb these cost swings directly, a disadvantage that compounds for challengers concentrated in a single country's antibody supply base. Established majors with diversified, multi-region sourcing can smooth these swings across a broader supplier base, while sequencing-based technologies carry the added exposure of sourcing both specialty reagents and flow cell components simultaneously.
cancer-tissue-diagnostics-market-cost-volatility-analysis-1787304066803

Qualifying Multiple Antibody Suppliers Across Regions

Extending supplier qualification to additional specialty antibody producers across the United States, Germany, and Switzerland reduces reliance on any single supplier's capacity or pricing power. Several manufacturers accelerated this diversification after 2022's disruption exposed how concentrated their sourcing had become across too few qualified vendors regionally, adding redundancy across multiple countries and several newly qualified sources.

Long-Term Reagent and Consumable Supply Contracts

Locking in multi-year supply agreements with antibody and sequencing consumable manufacturers protects production schedules from shortages that periodically affect the broader biologics supply chain and its many contract manufacturers. This approach requires forecasting demand further out than manufacturers traditionally have, but it has paid off reliably during past shortage episodes across the wider industry.

Vertical Integration Into Antibody Manufacturing

Owning specialty antibody production rather than outsourcing it reduces exposure to supplier pricing swings and gives manufacturers priority access during periods of tight capacity across the sector. The approach requires significant capital but has paid off for majors that invested early, insulating margins better than pure formulators eventually managed to achieve across comparable product lines.

Portfolio Architecture for Margin Defence

Three margin tiers coexist within this single diagnostics category. Volume-grade immunohistochemistry stains run thin margins set largely by hospital purchasing contracts and direct price competition among many regional reagent suppliers competing almost entirely on cost. Certified molecular pathology assays sit meaningfully higher, while comprehensive sequencing panels with companion diagnostic status command the richest margin of the three because clinical validation and pharma co-development
The volume-versus-premium tension shows up clearly in capital allocation. Manufacturers that keep reinvesting in IHC reagent production capacity are chasing a shrinking margin pool relative to those redirecting capital toward sequencing and companion diagnostic platforms, even though IHC reagents still generate meaningful revenue for most companies today. Boards increasingly favour the specialty side when allocating the next dollar of capital investment, despite its smaller current revenue base.

High-value margin pools concentrate specifically in companion diagnostic assays co-developed with pharmaceutical sponsors and in comprehensive sequencing panels carrying published clinical validation data across multiple independent studies. Everything else in the portfolio behaves closer to a commodity laboratory reagent than a differentiated diagnostic product, priced on distribution reach rather than clinical performance, and that gap shows no sign of narrowing soon.

Volume / Commodity-Adjacent Tier

Routine immunohistochemistry stains sold through hospital purchasing contracts, priced largely on distribution reach and delivery reliability rather than clinical differentiation of any kind, with thin room to compete on anything else.
Gross Margin: 22-28%

Premium / Certified Tier

Molecular pathology assays carrying clinical validation and standardised interpretation protocols, sold at a real, defensible premium over unbranded reagent alternatives across most major markets studied closely in this entire report today.
Gross Margin: 36-44%

Sustainability / Regulatory / Next-Generation Tier

Comprehensive sequencing panels and companion diagnostic assays co-developed with pharmaceutical sponsors, requiring sustained clinical investment that thins the competitive field sharply and protects incumbent pricing for years at a stretch.
Gross Margin: 46-56%
cancer-tissue-diagnostics-market-portfolio-architecture-1787304067298

Assay-Validated Laboratory Loyalty

Cancer tissue diagnostics is not a subscription business by default, but instrument-integrated platforms increasingly behave like one. Once a laboratory validates its assay workflow around a specific instrument and reagent system, switching costs run high enough that repeat reagent purchasing continues for years without a full vendor re-evaluation each cycle.
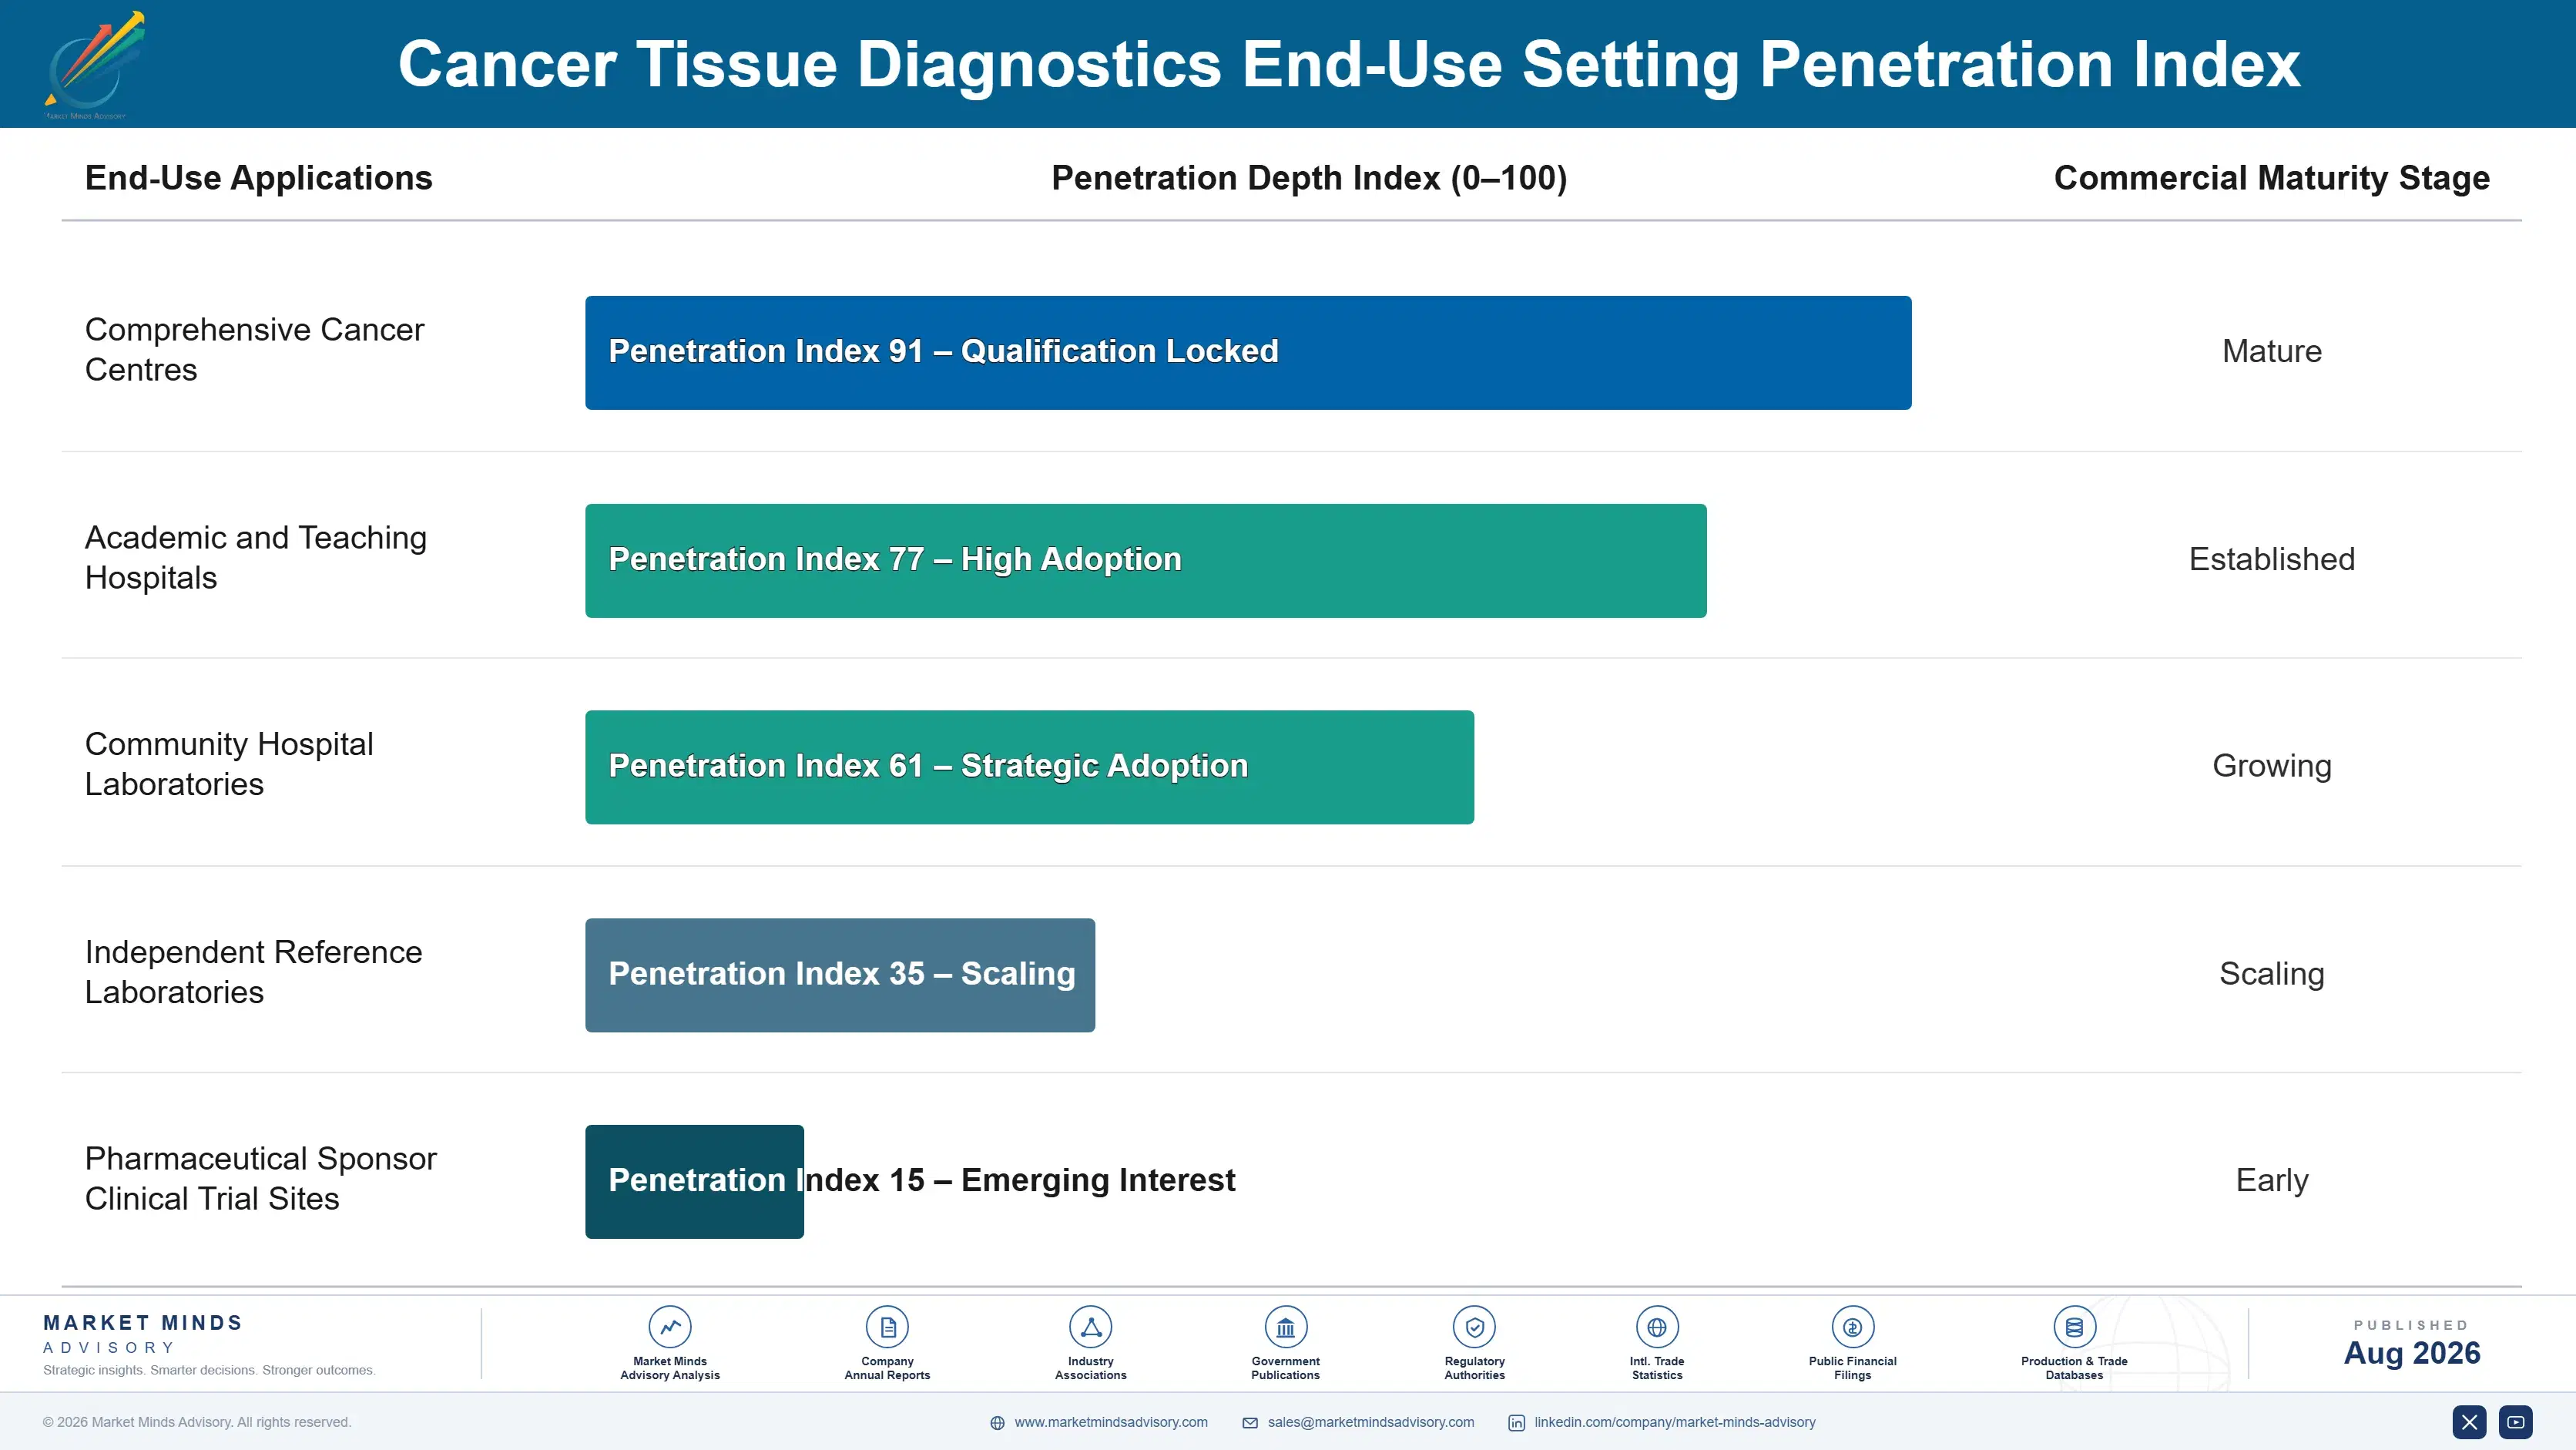
Adoption depth varies sharply by laboratory type. Comprehensive cancer centres and academic laboratories, once validated on a specific platform, rarely switch unless quality or companion diagnostic support genuinely slips, since re-validating an assay workflow carries real regulatory and operational cost. Smaller community laboratories without sequencing capability behave completely differently, remaining on immunohistochemistry far longer since no comparable validation investment has been made. Companion diagnostic co-development relationships increasingly separate sticky accounts from price-sensitive ones across most laboratory systems tracked.

A generational shift is underway in who specifies diagnostics purchases. Decisions once made almost entirely by cost-conscious hospital procurement officers chasing lowest delivered cost are increasingly shaped by pathology department leadership and precision medicine directors who weight biomarker coverage and clinical outcomes data well above unit price alone. That shift favours manufacturers who invested early in companion diagnostic evidence over those still competing purely on reagent price.
cancer-tissue-diagnostics-market-end-use-penetration-index-1787304067790

Where Tissue Diagnostics Margin Concentrates

These are among the four positions where our research anticipates prominent divergence between winners and laggards over the coming forecast period. Each is grounded in the demand model, the regulatory perimeter, and the announced capacity pipeline.
01 / COMPANION DIAGNOSTIC INVESTMENT PRIORITY

Prioritise pharma co-development partnerships over commodity IHC expansion.

Targeted therapy approvals are bundling mandatory companion diagnostic testing faster than commodity reagent makers can realistically catch up on pharma relationships and clinical validation depth, which means investment made today captures demand that IHC stains cannot reach at comparable margin. Manufacturers that keep expanding commodity reagent capacity are chasing a shrinking margin pool relative to those building companion diagnostic partnerships instead. Co-development itself functions as a moat, since a rival cannot simply undercut price once a sponsor has already selected a diagnostic partner for a drug launch.
02 / DIGITAL PATHOLOGY SOFTWARE STRATEGY

Build AI interpretation capability before pathologist shortages deepen further.

Pathology departments are digitising slide workflows specifically to offset a subspecialist shortage that shows no sign of easing across most developed health systems tracked in this study. Manufacturers that invest early in AI-assisted triage and interpretation infrastructure build a durable advantage that outlasts any single product cycle or short-term pricing pressure from smaller rivals entering the category over time. Underinvesting here cedes the richest margin tier of the market to whichever competitor solves the staffing problem first for a given hospital account.
03 / REGIONAL MARKET ENTRY

Enter East Asian and South Asian markets ahead of infrastructure build-out.

East Asia already leads on testing volume and manufacturing scale, and South Asia and the Pacific is growing fastest as cancer diagnosis rates and testing infrastructure expand from a comparatively small installed base across the wider region today. Manufacturers without local clinical education relationships risk missing multi-year laboratory contracts already being awarded to early movers with established local presence and physician trust built over years. Establishing regional training capability now positions a manufacturer well ahead of the next wave of diagnostic infrastructure investment.
04 / REIMBURSEMENT ADVOCACY STRATEGY

Fund coding parity advocacy before comprehensive panel adoption plateaus.

Reimbursement coding for comprehensive sequencing panels still lags single-marker testing in several health systems, and manufacturers who fund health economics evidence and coding advocacy early earn payer trust that reactive lobbying alone cannot replicate at comparable cost. Waiting until coding reform becomes urgent means competing for policy attention against manufacturers who built these relationships years earlier and already hold regulatory credibility. Building that advocacy foundation now, rather than reacting once adoption plateaus, is the cheaper path by a wide margin over time.

Engagement Snapshot From the Field

A live engagement with an industry participant carrying material or product regulatory and market exposure ahead of a defining policy shift, showing how our research translates into a defensible multi-year portfolio strategy.
MARKET MINDS ADVISORY · CLIENT ENGAGEMENT SUMMARY
Cancer Tissue Diagnostics Producer Strategic Portfolio Review and Transition Roadmap 2026·Investment Scenario on Cancer Tissue Diagnostics Exposure Evaluation 2025-26
CLIENT PROFILE
The client is an eleven-hospital regional health system in the southeastern United States, anchored by two comprehensive cancer centres. The system reported annual pathology and molecular testing spend of approximately $22 million (client-reported, unverified by MMA) and was evaluating whether to standardise on a single sequencing platform across all eleven laboratories rather than the fragmented multi-vendor testing mix it had used historically.
STRATEGIC CHALLENGE
The system's eleven laboratories used three different molecular testing platforms and sent complex cases to four different reference laboratories, creating inconsistent turnaround times, duplicated validation costs, and inconsistent outcomes documentation that made system-wide quality reporting to hospital leadership nearly impossible to assemble accurately, weakening its position in annual vendor negotiations.
MMA APPROACH
MMA benchmarked three sequencing platform vendors on biomarker coverage, turnaround time, and total cost per case across all eleven laboratories. The engagement combined vendor interviews with laboratory-level testing data analysis to model the total cost and clinical impact of standardising on a single platform system-wide across every pathology department involved.
KEY FINDINGS
  1. One vendor's comprehensive panel cut average turnaround time by roughly 35% versus the system's current sequential single-marker testing approach used previously overall.
  2. Standardising on a single platform would reduce annual validation and quality assurance costs by an estimated $780,000 across all eleven laboratories combined each year.
  3. Two of the three platforms lacked sufficient bioinformatics support to reliably interpret complex results without meaningful turnaround delay during peak testing volume.
  4. Bundled reagent procurement combined with reference laboratory consolidation could lower blended per-case testing cost by roughly 21% system-wide within the first year.
CLIENT PROFILE
The client is an eleven-hospital regional health system in the southeastern United States, anchored by two comprehensive cancer centres. The system reported annual pathology and molecular testing spend of approximately $22 million (client-reported, unverified by MMA) and was evaluating whether to standardise on a single sequencing platform across all eleven laboratories rather than the fragmented multi-vendor testing mix it had used historically.
STRATEGIC CHALLENGE
The system's eleven laboratories used three different molecular testing platforms and sent complex cases to four different reference laboratories, creating inconsistent turnaround times, duplicated validation costs, and inconsistent outcomes documentation that made system-wide quality reporting to hospital leadership nearly impossible to assemble accurately, weakening its position in annual vendor negotiations.
MMA APPROACH
MMA benchmarked three sequencing platform vendors on biomarker coverage, turnaround time, and total cost per case across all eleven laboratories. The engagement combined vendor interviews with laboratory-level testing data analysis to model the total cost and clinical impact of standardising on a single platform system-wide across every pathology department involved.
KEY FINDINGS
  1. One vendor's comprehensive panel cut average turnaround time by roughly 35% versus the system's current sequential single-marker testing approach used previously overall.
  2. Standardising on a single platform would reduce annual validation and quality assurance costs by an estimated $780,000 across all eleven laboratories combined each year.
  3. Two of the three platforms lacked sufficient bioinformatics support to reliably interpret complex results without meaningful turnaround delay during peak testing volume.
  4. Bundled reagent procurement combined with reference laboratory consolidation could lower blended per-case testing cost by roughly 21% system-wide within the first year.
RECOMMENDED STRATEGY
Phase 1: Phase 1 (Months 1 to 3): Finalise vendor selection and negotiate a system-wide multi-year platform and reagent supply agreement package. Phase 2: Phase 2 (Months 4 to 8): Roll out standardised testing protocols and staff training across all eleven laboratories in staged waves. Phase 3: Phase 3 (Months 9 to 12): Consolidate reference laboratory relationships and renegotiate vendor contracts using the unified system-wide volume data.
OUTCOME
The system completed platform standardisation across nine of eleven laboratories within twelve months and reported an 18% reduction in blended testing cost per case (client-reported, unverified by MMA), alongside meaningfully faster turnaround times system-wide following the switch to a single integrated testing platform system overall.

Frequently Asked Questions

Foundational context covering the market sizes, CAGR, scope, country, region and competition that inform every finding below. This section is provided to cover basics and most often pre-purchase conversations, answered from the MMA Primary Research Dataset.

What is the current size of the Cancer Tissue Diagnostics Market?

The global cancer tissue diagnostics market was valued at approximately $9.8 billion in 2025. This spans immunohistochemistry, molecular pathology, sequencing panels, and digital pathology technologies.

How large will the Cancer Tissue Diagnostics Market be by 2036?

The market is projected to reach approximately $26.87 billion by 2036. Growth is led by digital pathology and next-generation sequencing rather than routine immunohistochemistry alone.

What is the CAGR for the Cancer Tissue Diagnostics Market 2026 to 2036?

The market is expected to grow at a compound annual growth rate of 9.6% across the forecast period. Bull and bear scenarios range from roughly 8.4% to 10.9% depending on reimbursement policy.

Which segment is growing fastest?

Digital pathology and AI-assisted image analysis is the fastest-growing segment, expanding at nearly twice the market's blended rate. Next-generation sequencing tissue panels follow as the second-fastest segment.

Who are the major companies in the Cancer Tissue Diagnostics Market?

Leading participants include Roche Diagnostics, Agilent Technologies, Thermo Fisher Scientific, Illumina, and Leica Biosystems. Assessments are based on global reagent, instrument, and software revenue combined.

Which country is growing fastest?

India is the fastest-growing country tracked, driven by rapid private hospital cancer diagnostic capacity expansion. Its growth rate sits well above the region's already elevated average.

Report Segmentation Architecture

The full report scope spans multiple orthogonal segmentation dimensions, with cross-tabulated demand data provided for each dimension pair. Coverage extends further to regional breakdowns, trend trajectories, and the competitive detail needed to support segment-level decision-making.

By Testing Technology

  • Immunohistochemistry (IHC) Testing
  • In Situ Hybridization (ISH/FISH) Testing
  • Molecular Pathology and PCR-Based Testing
  • Next-Generation Sequencing Tissue Panels
  • Digital Pathology and AI-Assisted Image Analysis
  • Companion Diagnostic Tissue Assays

By End-Use Setting

  • Comprehensive Cancer Centres
  • Academic and Teaching Hospitals
  • Community Hospital Laboratories
  • Independent Reference Laboratories
  • Pharmaceutical Sponsor Clinical Trial Sites

By Commercial Dimension

  • Direct Laboratory Reagent Sales
  • Instrument and Software Service Contracts
  • Companion Diagnostic Co-Development Agreements
  • Distributor and Reseller Networks

By Region

  • North America
  • Western Europe
  • East Asia
  • South Asia and Pacific
  • Latin America
  • Middle East and Africa
  • Eastern Europe

Scope, Methodology, and Coverage

Every figure in this report is reproducible from documented input assumptions. The scope below maps the historical period, the forecast horizon, the segmentation dimensions, and the countries covered, alongside the underlying primary and qualitative methodology.
Historical Period
2020 to 2025
Forecast Period
2026 to 2036
Base Year
2025 (USD billions; MMA Primary Research Dataset, August 2026)
Market Definition
The cancer tissue diagnostics market covers assays, instruments, and software used to analyse tumour tissue specimens for cancer diagnosis, subtyping, and treatment selection, including immunohistochemistry, in situ hybridization, molecular pathology, next-generation sequencing tissue panels, and digital pathology image analysis. It excludes liquid biopsy and blood-based diagnostics and excludes cancer screening tests performed outside a tissue specimen context.
Quantitative Units
USD billions (current prices); units of biomarker tests and panels performed
Segmentation Dimensions
By Testing Technology; By End-Use Setting; By Commercial Dimension; By Region
Regions Covered
North America, Western Europe, East Asia, South Asia and Pacific, Latin America, Middle East and Africa, Eastern Europe
Countries Covered
USA, China, Germany, France, UK, Japan, South Korea, India, Australia, Canada, Brazil, Mexico, Indonesia, Vietnam, Thailand, Malaysia, UAE, Saudi Arabia, South Africa, Nigeria, Turkey, Poland, Netherlands, Italy, Spain, Sweden, Switzerland, Argentina, Colombia, Singapore, and additional markets relevant to this sector
Key Companies Profiled
Roche Diagnostics, Agilent Technologies Inc., Thermo Fisher Scientific Inc., Illumina Inc., Leica Biosystems, Abbott Laboratories, Bio-Rad Laboratories Inc., Myriad Genetics Inc., Exact Sciences Corporation, Guardant Health Inc., NeoGenomics Laboratories Inc., Sakura Finetek USA Inc., Revvity Inc., Qiagen N.V., Bio-Techne Corporation, PathAI Inc., Paige.AI Inc., Indica Labs Inc., 3DHistech Ltd., Visiopharm A/S
Quantitative Methodology
Primary survey, n=3,800 respondents, Q4 2025, six countries; demand-side model with trade association cross-validation
Qualitative Methodology
47 expert interviews, Q4 2025; applied to validate demand model assumptions, identify emerging dynamics, and assess competitive positioning
Report Format
PDF and XLSX data workbook (Word format preview document)
Publisher
Market Minds Advisory
Report Code
MMA-2026-HLT-204
Published
August 2026
Contact
sales@marketmindsadvisory.com | www.marketmindsadvisory.com

Purchase the full Cancer Tissue Diagnostics Market Report (2026 to 2036).

The full report delivers a complete quantitative and qualitative assessment of the global cancer tissue diagnostics market across IHC, molecular, sequencing, and digital pathology product categories. It includes detailed segmentation by testing technology, end-use setting, and commercial channel, alongside country-level sizing across thirty-plus individual markets worldwide. Competitive profiling covers twenty companies assessed on global reagent, instrument, and software revenue, with primary research drawn from MMA's expert interview program and its quantitative industry survey. Buyers receive fully editable data files supporting internal strategic planning, investment screening, and supplier qualification decisions each quarter.
Segment-level sizing and 2026 to 2036 forecasts
Full seven-region breakdown with country-level detail
Twenty-company competitive revenue benchmarking data set
Editable data tables delivered in Excel format
Primary survey and expert interview findings included
Quarterly market update subscription option available

Built For The People Who Decide

From boardroom strategy to bench-side execution, this report is read cover-to-cover by leaders shaping the next decade of their industry, turning demand scenarios, market dynamics and valuation benchmarks into decisions.
CXOs/ Presidents/ VPs/ Managers
M&A and Corporate Development
Strategy Teams and R&D Heads
Procurement and Product Directors
Regulatory and Compliance Leaders
Investor Relations and Equity Analysts