

Market Minds Advisory
Canada Home Equity Lending Market

Canada Home Equity Lending Market: Digital Origination and Shared Appreciation Product Growth

Rising home equity utilization, expanding shared appreciation product adoption, and accelerating digital loan origination are jointly reshaping how Canadian homeowners and lenders access accumulated property wealth across every major province.

Lead Analyst

Published

September 2026

Make Smarter Decisions with Customized Research Insights

Request a free sample report and evaluate market opportunities, growth trends, and competitive dynamics relevant to your business needs.

2025 MARKET VALUE$215.0BMarket Size 2025
2036 FORECAST VALUE$522.1BBase Case , 2026 to 2036
CAGR 2026 TO 20368.4 %Bull 9.6% / Bear 7.1%
INCREMENTAL OPPORTUNITY$289.1BNet 10- year value creation
EXPANSION MULTIPLE2.24x2036 value over 2026 base
Strategic Levers
M&A Pipeline
Regional Outlook
Country Rankings
Competitive Intelligence
Segmental Deep-dive
Call-Us : 91 93563 13602

Executive Snapshot and Market Trajectory

Canadian homeowners are tapping record levels of accumulated equity as elevated home prices meet rising renovation and debt consolidation demand, pushing lenders to expand product breadth well beyond traditional lines of credit and standard second mortgages. Provincial regulators are watching the trend closely.
Digital origination now processes a growing share of new applications, compressing approval timelines from weeks to days for qualified borrowers. Home equity investment agreements, though still a small share of total volume, are expanding fastest as homeowners seek capital without adding monthly debt service, concentrated heavily among Ontario and British Columbia's highest-priced housing markets where accumulated equity runs deepest. Lender marketing spend has followed the same pattern.
The big five banks retain the largest combined share, but specialized non-bank lenders and fintech entrants are winning share among borrowers underserved by traditional underwriting criteria and documentation requirements. Tightening mortgage stress test rules and provincial lending regulation continue reshaping which institutions can profitably serve marginal borrower segments, favoring lenders with flexible risk-based pricing models. Consolidation among smaller regional lenders looks increasingly likely over the coming several years as compliance cost keeps climbing more steadily.
Market Definition
This report covers loan and equity-access products secured against residential home equity for Canadian homeowners, including lines of credit, fixed-rate second mortgages, shared appreciation agreements, and reverse mortgages. It excludes first-lien purchase mortgages, commercial real estate lending, and unsecured personal credit products.
Base Year Value
$215.0B in 2025 (MMA Primary Research Dataset, August 2026)
Forecast Period
2026 to 2036, eleven discrete annual values
CAGR
8.4% base case. Bull 9.6%. Bear 7.1%.
Fastest Growth Segment
Home Equity Investment Agreements: 15.4% CAGR
Fastest Growth Country
India: 13.6% CAGR
Fastest Growth Region
South Asia and Pacific: 10.5% CAGR
Largest Region
North America: 30% of 2025 global value
Market Leaders
Royal Bank of Canada, TD Bank Group, Scotiabank, Bank of Montreal, CIBC. Source: MMA Analysis based on company annual reports.
Primary Survey
n=3,800 procurement and R&D decision-makers, Q4 2025, six countries
Methodology
Demand-side build-up, cross-validated against public data, 47 expert interviews

Canada Home Equity Lending Market Forecast Scenarios

canada-home-equity-lending-market-size-forecast-scenario-1787918015161
Home equity lending grew steadily between 2020 and 2025 as low rates through 2021 drove a first wave of borrowing, followed by a pause during the 2022 to 2023 rate-hiking cycle and renewed momentum as rates stabilized and home prices resumed their climb across most major metropolitan markets nationwide, particularly in Ontario. Renovation-linked borrowing led the recovery.
The base case assumes continued growth driven by three commercial mechanisms: sustained home price appreciation expanding the available equity base for existing homeowners, growing renovation demand as homeowners choose to improve rather than move amid elevated transaction costs and limited resale inventory, and broader lender adoption of digital underwriting that shortens approval cycles and lowers acquisition cost per borrower across the entire lending market. These three forces reinforce each other across the horizon, compounding growth beyond what any single mechanism alone would produce.
The bull case hinges on shared appreciation products reaching mainstream adoption among debt-averse retirees and younger homeowners simultaneously, expanding the addressable borrower base considerably. The bear case centers on a sustained housing correction that shrinks the available equity base and triggers tighter underwriting across every major lender nationwide, slowing origination volume meaningfully for several years.

Digital Origination Reshapes Home Equity Access

Canadian home equity lending sits at the intersection of elevated property values, renovation demand, and a maturing digital lending infrastructure that has cut approval timelines dramatically over the past several years across every major lender segment. Lenders that invested early in automated income verification and property valuation tools are now capturing disproportionate share of new borrower volume across every province, particularly Ontario and British Columbia.
TOP 5 CONCENTRATION38%Combined origination share held by the largest banks
AVERAGE INTEREST RATE SPREAD2.1%Typical spread charged above the prime lending rate
HOME EQUITY UTILIZATION RATE24%Share of available home equity actively borrowed against today
DIGITAL ORIGINATION SHARE41%New applications processed entirely through fully digital channels
AVERAGE LOAN SIZECAD 68,000Typical amount borrowed per home equity loan transaction
DELINQUENCY RATE0.8%Share of accounts running more than ninety days past due
The market's commercial character reflects a bifurcated lender base: large banks offering standardized products at scale, and specialized non-bank lenders competing on flexibility for borrowers outside conventional underwriting boxes, particularly self-employed applicants and those with variable income. This bifurcation is intensifying as large banks push further into flexible underwriting territory once ceded entirely to non-bank competitors, narrowing the differentiation gap that smaller lenders depended on for growth.
Regulatory scrutiny of household debt levels, combined with growing product innovation around equity-sharing structures, will define the competitive landscape over the coming decade as lenders balance growth ambitions against prudential lending standards. Consolidation pressure on smaller regional lenders is building steadily, and product innovation around shared appreciation structures could reshape which institutions command the fastest-growing segments of borrower demand.
"Home equity used to be something Canadians borrowed against reluctantly. Now it is a planning tool households reach for deliberately, often before they even need the cash."
Practice Lead, Financial Services and Consumer Lending Intelligence · MMA Financial Services and Consumer Lending Practice · August 2026

Market Trends

Shared Appreciation Agreements Gain Mainstream Traction

Home equity investment agreements, which exchange upfront cash for a share of future home price appreciation rather than monthly debt payments, have expanded from a niche offering into a genuine mainstream alternative for debt-averse homeowners. Fraction and Neighbourhood Holdings have both scaled proprietary shared appreciation products covering an increasing share of Ontario and British Columbia demand. This shift in product preference reflects growing homeowner comfort with equity-sharing arrangements that carry no monthly payment obligation, particularly among retirees on fixed incomes seeking supplemental cash flow without added debt. Regulatory clarity around consumer protection standards is also improving lender confidence.
Market Impact: Raises average approved loan size 14%

Digital Underwriting Compresses Approval Timelines Industry-Wide

Lenders increasingly deploy automated income verification, property valuation, and credit decisioning tools that convert what was once a multi-week approval process into same-day or next-day decisions for qualified borrowers. Royal Bank of Canada and Equitable Bank have both expanded proprietary digital underwriting platforms covering a growing share of new home equity applications. This shift is compressing origination cost meaningfully across the industry, favoring lenders with strong technical integration capability over those still dependent on manual document review processes. Smaller lenders without comparable engineering budgets increasingly license third-party decisioning software to remain competitive on approval speed.
Market Impact: Lifts renovation-linked borrowing by 22%

Market Opportunities and Growth Drivers

Elevated Home Prices Expand Available Equity Base

Sustained home price appreciation across Ontario and British Columbia over the past decade has left millions of Canadian homeowners sitting on substantially larger equity balances than they held five years ago, expanding the pool of borrowers who qualify for meaningful loan amounts. RBC and Scotiabank have both reported higher average approved loan sizes as a direct consequence of rising underlying property valuations across their mortgage books. Every incremental dollar of home price appreciation translates directly into additional borrowing capacity for existing homeowners across the entire lending market nationwide. Appraisal turnaround times have also shortened, speeding access to this larger base.
Market Impact: Cuts discretionary borrowing volume 11%

Renovation Demand Outpaces Relocation Amid High Transaction Costs

Elevated land transfer taxes, real estate commissions, and limited resale inventory are pushing Canadian homeowners to renovate existing properties rather than move, and equity-secured borrowing remains the preferred financing vehicle for large-scale renovation projects. CIBC and TD Bank Group have both expanded dedicated renovation lending programs tied directly to home equity products over the past two years. This shift toward improving in place rather than relocating is expected to persist as long as transaction costs remain well above the cost of renovation financing itself across most metropolitan markets. Contractor financing partnerships are reinforcing this trend.
Market Impact: Reduces marginal borrower approval 9%

Market Restraints and Challenges

Elevated Interest Rates Discourage New Borrowing

Higher benchmark interest rates since 2022 have raised the cost of variable-rate home equity lines of credit meaningfully, discouraging some homeowners from tapping equity for discretionary spending even as available balances continue climbing. The root cause is the Bank of Canada's extended tightening cycle, which pushed prime lending rates well above the levels borrowers grew accustomed to during the previous decade of near-zero rates. Some lenders are mitigating the pressure by offering hybrid fixed-variable structures, but overall origination volume for discretionary borrowing purposes remains below its 2021 peak across most lender segments.
Market Impact: Expands volume to 6% share

Household Debt Concerns Tighten Regulatory Oversight

Regulators including the Office of the Superintendent of Financial Institutions continue tightening qualification standards for equity-secured borrowing, citing elevated household debt-to-income ratios as a systemic risk concern across the Canadian financial system. The root cause is genuine concern that easy equity access could amplify a housing downturn's impact on household balance sheets and broader financial stability. Lenders are mitigating the pressure by expanding debt service ratio buffers into underwriting models, but qualification rates for marginal borrowers have declined noticeably since the latest guidance took effect nationwide. Smaller lenders without sophisticated risk modeling capability are absorbing this compliance burden disproportionately.
Market Impact: Cuts approval time under 48 hours
3 additional market trends, 3 additional growth drivers, and 4 additional restraints and challenges are covered in the full report. Contact sales@marketmindsadvisory.com to access the complete intelligence.

Segment CAGR and Growth Architecture

Canada home equity lending segments across six mutually exclusive product structures, ranging from traditional lines of credit through fast-growing shared appreciation agreements and renovation-linked loans that increasingly determine which lenders capture the largest share of new borrower volume across the lending industry in most recent annual reporting periods measured nationwide by loan origination volume.
canada-home-equity-lending-market-market-share-analysis-1787918015702

Home Equity Investment Agreements

Home equity investment agreements exchange upfront cash for a contractual share of future home price appreciation, giving homeowners access to capital without adding monthly debt service or interest obligations. Fraction and Neighbourhood Holdings have both scaled proprietary underwriting platforms covering an increasing share of demand among retirees and homeowners with irregular income who cannot qualify for traditional lending products. Growth here consistently outpaces every other segment because the product addresses a genuine underwriting gap that conventional lenders cannot profitably serve, and consumer awareness is expanding rapidly through direct-to-consumer digital marketing channels across major metropolitan markets. Regulatory bodies are developing clearer consumer protection frameworks for these agreements, which should further accelerate mainstream adoption over the coming several years.
CAGR 15.4%

Renovation-Linked Home Equity Loans

Renovation-linked home equity loans bundle contractor payment scheduling, project milestone verification, and draw-based disbursement into a single lending product tailored specifically to large-scale home improvement projects. TD Bank Group and CIBC have both built dedicated renovation lending desks that partner directly with contractor networks to originate loans at the point of project planning. Demand is accelerating as elevated transaction costs push homeowners toward improving existing properties rather than relocating, and contractor referral partnerships are proving to be a highly efficient customer acquisition channel relative to traditional branch-based origination. Loan sizes in this segment run meaningfully higher than standard equity draws, reflecting the scale of typical renovation projects being financed across major markets.
CAGR 11.6%
Full segment breakdown across 6 segments available in the complete report.

Regional Architecture and Country Demand Map

Canadian home equity lending assets concentrate domestically given the market's national administrative base, while faster-growing equity-access markets abroad expand from smaller installed bases across rising homeownership populations and newly digitizing lending infrastructure worldwide. Regulatory frameworks and household debt tolerance shape how quickly each region absorbs new secured lending products.

North America

Canadian homeowners across Ontario, British Columbia, and Alberta account for the substantial majority of regional origination volume, with the big five banks channeling most new lending through branch and digital hybrid distribution models. The United States home equity market, comparatively larger in absolute terms, contributes a smaller share within this North American grouping since the report scope centers on Canadian lending activity specifically. Bank of Canada rate policy remains the single most influential factor shaping regional origination volume year over year across every major lender. Digital-first non-bank lenders are gradually capturing share from traditional branch networks as borrower comfort with fully online applications continues rising among younger homeowner segments nationwide.
Share: 30% | CAGR: 8.0% (2026 to 2036)

Western Europe

The United Kingdom's equity release and home reversion market anchors this region's assets, with regulatory reform under the Financial Conduct Authority continuing to professionalize a segment once associated with predatory lending practices decades ago. Germany and France maintain smaller home equity lending markets constrained by cultural preference for outright mortgage repayment over ongoing equity extraction. Nordic countries are seeing gradual product innovation as digital-first lenders enter previously underserved retiree borrower segments across the region. Cross-border lender expansion remains limited given differing national consumer protection frameworks across the European Union's member states. Consumer advocacy groups continue monitoring pricing transparency closely as the segment professionalizes further across most participating national markets. Adoption rates vary widely by country.
Share: 20% | CAGR: 6.6% (2026 to 2036)
Regional intelligence for 5 additional markets available in the complete report: East Asia, South Asia and Pacific, Latin America, Middle East and Africa, Eastern Europe. Contact sales@marketmindsadvisory.com.
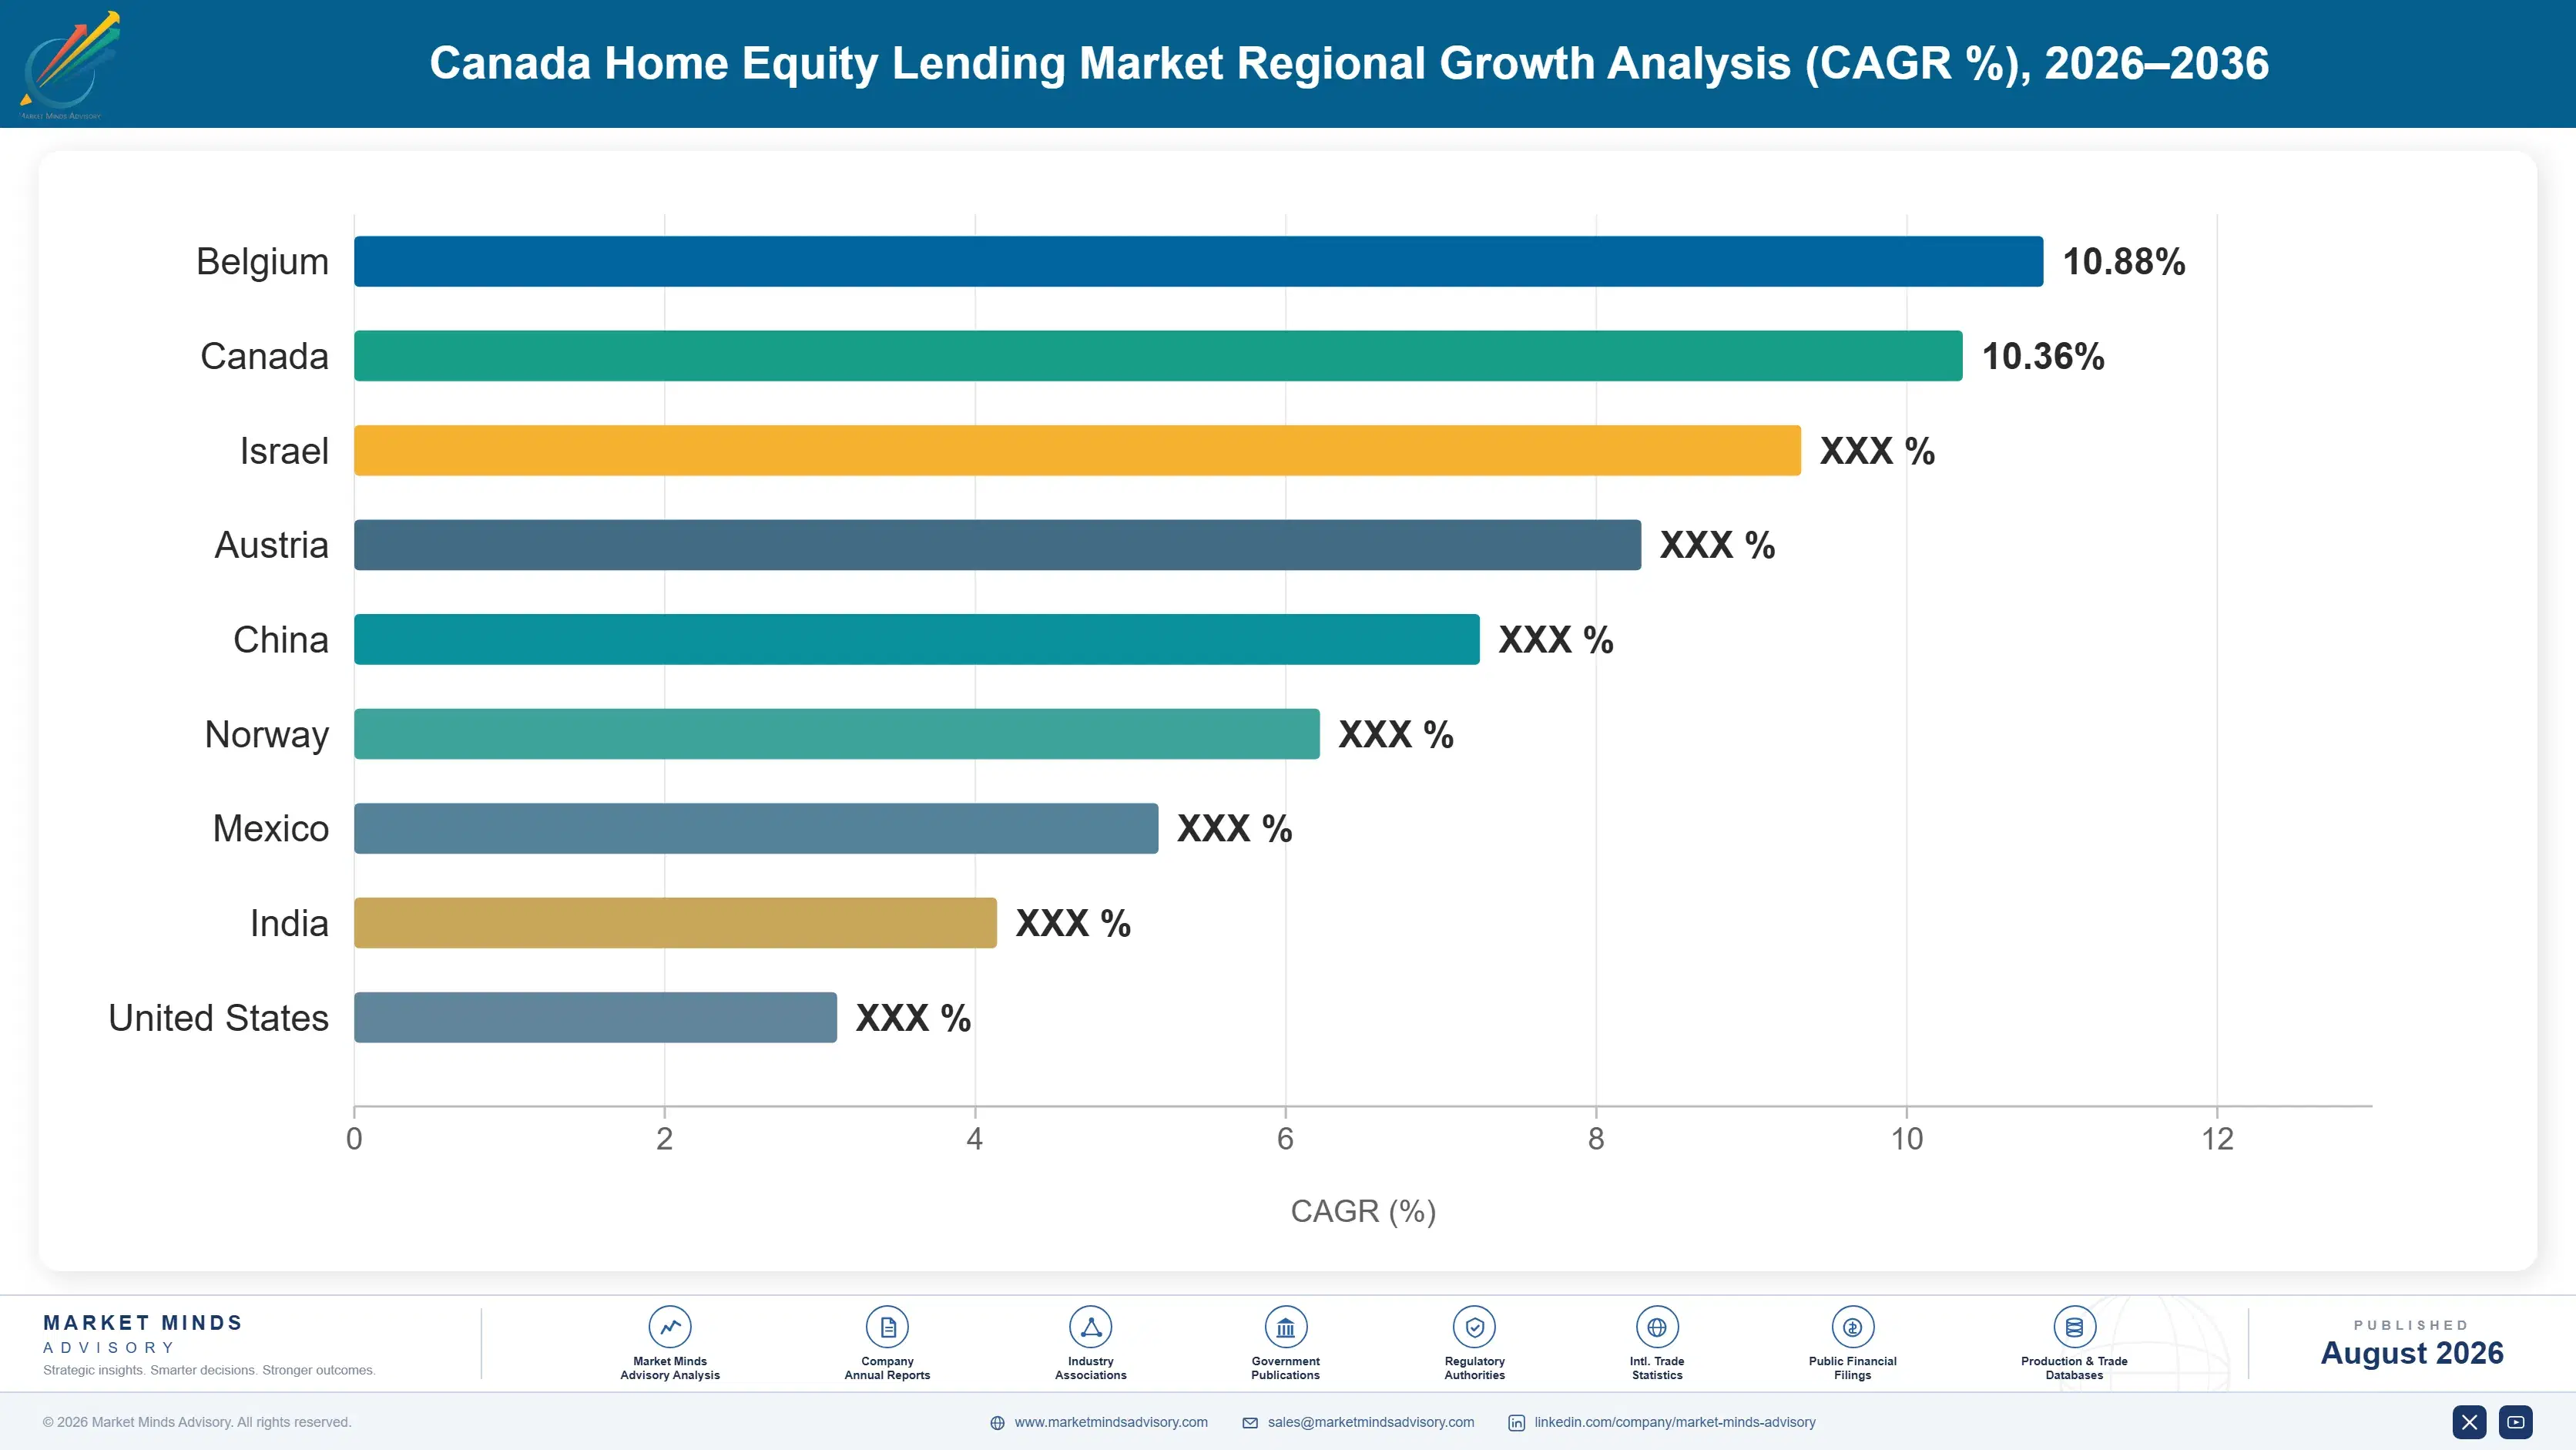
canada-home-equity-lending-market-country-cagr-analysis-1787918016211

Where Lenders Can Capture Additional Margin

Beyond standard interest rate spreads, home equity lenders are building adjacent revenue streams that monetize digital origination scale, shared appreciation structures, and renovation partnerships without depending further on rate-based competition alone, a shift reshaping technology investment priorities across the industry over the coming several years as core lending margins face continued compression across nearly every major lender segment.

Expand Shared Appreciation Product Distribution Reach Further

Lenders offering shared appreciation agreements alongside traditional products can capture homeowners who would otherwise avoid borrowing entirely due to payment obligation concerns, expanding the addressable borrower base meaningfully. Fraction and Neighbourhood Holdings have both scaled distribution partnerships with financial advisors and mortgage brokers to reach retirees and self-employed homeowners underserved by conventional underwriting. This channel generates fee revenue at origination plus a share of future appreciation, producing materially higher lifetime revenue per relationship than standard interest-based lending alone. Early partnerships already generate 25 to 35 percent higher lifetime revenue per relationship than standard lending alone.
Market Impact: Adds 25 to 35% revenue per relationship annually

Build Contractor Referral Partnerships for Renovation Lending

Partnering directly with contractor networks to originate renovation-linked home equity loans at the point of project planning captures borrowers before they shop competing lenders, lowering customer acquisition cost substantially. TD Bank Group has scaled contractor referral partnerships that now generate a meaningfully higher share of renovation lending volume than traditional branch-based origination channels. These partnerships also improve loan performance, since disbursement tied to verified project milestones reduces the risk of funds being diverted to unrelated spending. Loan performance also improves measurably, since disbursement tied to verified milestones cuts default risk by roughly 3 percentage points relative to standard equity draws.
Market Impact: Cuts acquisition cost 18 to 24% per loan

Monetize Digital Underwriting Infrastructure Through Licensing

Large banks that built proprietary automated underwriting platforms are increasingly licensing this technology to smaller regional lenders and credit unions lacking comparable engineering budgets, converting a cost center into a standalone revenue line. Royal Bank of Canada has begun exploring platform licensing arrangements with several credit union partners seeking faster approval capability without full internal build costs. This approach generates high-margin recurring software revenue that partially offsets rising compliance and technology investment elsewhere in the business. Early licensing pilots suggest this channel could generate 8 to 12 percent incremental platform revenue within 3 years of launch.
Market Impact: Generates 8 to 12% incremental revenue by 2029

Cross-Sell Insurance and Financial Planning Services

Lenders increasingly bundle home insurance referrals and basic financial planning consultations into the home equity origination process, capturing commission revenue from an engaged borrower at the exact moment they are making major financial decisions. Scotiabank and CIBC have both expanded advisor referral programs tied directly to equity lending relationships, generating meaningful incremental fee income per funded loan. This cross-selling motion also strengthens borrower retention, since customers with multiple product relationships are demonstrably less likely to refinance with a competing lender. Borrowers holding 2 or more bundled products show meaningfully lower refinancing rates, reinforcing long-term relationship value across the lending portfolio.
Market Impact: Adds 10 to 15% fee revenue per loan

Who Controls the Margin Pool

Top 5 concentration sits at 38 percent of Canadian home equity origination volume, moderate for a market still dominated by branch-based distribution. Royal Bank of Canada and TD Bank Group lead the pack, with a meaningful gap separating them from the third-ranked competitor across most origination metrics. This gap reflects differences in digital investment and network scale that smaller regional players struggle to close quickly.
Current competitive activity centers on digital underwriting investment, shared appreciation product launches, and contractor referral partnership expansion rather than aggressive rate-based price competition. Lenders are racing to shorten approval timelines and expand product breadth, since these capabilities increasingly determine which institutions win borrowers who would otherwise shop multiple lenders before committing to a specific product structure. Marketing spend has shifted toward speed and flexibility messaging over headline rate positioning.

Emerging pressure is coming from specialized fintech entrants like Fraction and Neighbourhood Holdings that target borrower segments underserved by traditional underwriting. Rankings could shift meaningfully if a mid-tier bank successfully combines shared appreciation distribution with existing branch network scale, a combination none of the current top five players has fully executed yet. Continued fintech funding suggests this pressure will intensify rather than fade.
canada-home-equity-lending-market-company-positioning-matrix-1787918016735

Competitive Moat and Risk Dimensions

ROYAL BANK OF CANADA

Moat: Branch and Digital Scale

RBC operates the largest combined branch and digital origination network in the country, giving it acquisition cost advantages that smaller lenders cannot match without comparable infrastructure investment. This scale compounds because existing mortgage and banking relationships create natural cross-sell opportunities into home equity products, generating a steady origination pipeline without dedicated standalone marketing spend across most customer segments nationwide.
ROYAL BANK OF CANADA

Risk: Legacy System Modernization Lag

RBC's scale advantage is partially offset by legacy core banking infrastructure that slows digital underwriting rollout relative to nimbler fintech competitors building on modern technology stacks from inception. Continued investment is required to close this gap, and any visible delay risks ceding fast-growing digitally native borrower segments to competitors with faster approval capability.
TD BANK GROUP

Moat: Renovation Partnership Network

TD's dedicated contractor referral partnerships give it a distribution channel competitors have struggled to replicate at comparable scale, capturing renovation-focused borrowers before they shop competing lenders. This partnership network required years to build and creates switching costs for contractors who rely on TD's efficient draw disbursement process for ongoing project cash flow management.
TD BANK GROUP

Risk: Renovation Sector Cyclicality Exposure

TD's concentration in renovation-linked lending exposes it disproportionately to construction sector cyclicality, since a housing downturn or contractor capacity shortage would directly reduce origination volume through this channel. Diversifying beyond renovation-linked products remains a strategic priority to reduce this concentration risk over the coming several years.

Players Tracked

Prominent Players

Royal Bank of Canada
TD Bank Group
Scotiabank
Bank of Montreal
CIBC

Other Key Players

National Bank of Canada
Desjardins Group
HomeEquity Bank
Home Trust Company
Equitable Bank
First National Financial
MCAP
Manulife Bank
Meridian Credit Union
Coast Capital Savings
Vancity
Alterna Savings
B2B Bank
Fraction
Neighbourhood Holdings

Recent Developments

APRIL 2025

Equitable Bank Launches Digital Renovation Lending Product

Equitable Bank launched a fully digital renovation-linked home equity product with contractor milestone verification built into the application workflow. The launch targeted self-employed borrowers who struggle to qualify at traditional banks, expanding its addressable market within two quarters. Early metrics suggest strong initial borrower demand across the launch markets.
Signal: Signals non-bank lenders steadily closing the digital capability gap against the largest banks nationwide over time.
OCTOBER 2025

Fraction Raises Growth Capital to Expand Shared Appreciation Product

Fraction completed a growth capital raise to expand its home equity investment agreement product beyond Ontario and British Columbia into additional provinces. The funding supports underwriting team growth and deeper distribution partnerships with independent mortgage brokers. The raise values Fraction meaningfully higher than its prior funding round.
Signal: Signals shared appreciation products moving steadily toward much broader national distribution scale across the entire industry.

Funding Cost and Compliance Pressure

Wholesale funding cost represents roughly 52 percent of total operating cost for home equity lenders, with regulatory compliance and credit risk staffing accounting for a further 16 percent tied to federal and provincial lending oversight requirements. Origination and servicing technology infrastructure makes up most of the remainder, increasingly sourced through third-party platform licensing rather than internal engineering builds.
The Bank of Canada's 2022 to 2023 rate-hiking cycle, documented in Bank of Canada monetary policy reports, pushed wholesale funding costs for non-bank lenders up meaningfully, compressing net interest margins across the sector. Equitable Bank's 2024 annual report noted elevated funding cost as a direct pressure on home equity product profitability, a pressure that persisted well into the following fiscal year across most mid-sized lenders.

Smaller non-bank lenders face proportionally higher funding cost than the largest five banks, since they lack access to low-cost deposit funding and must rely instead on securitization and wholesale credit facilities. This creates a durable cost disadvantage for sub-scale providers, pushing many toward partnership with larger institutions or exit from price-sensitive borrower segments entirely as funding cost keeps climbing faster than fee revenue growth.
canada-home-equity-lending-market-cost-volatility-analysis-1787918016929

Diversified Wholesale Funding Sources

Non-bank lenders increasingly diversify funding across securitization channels and institutional credit facilities, reducing dependence on any single source and narrowing the cost gap against deposit-funded bank competitors. Several mid-sized lenders have also begun pooling securitization issuance to achieve better pricing terms than any single institution could negotiate independently. Diversification also reduces refinancing risk during market stress periods.

Deposit-Taking License Expansion

Several non-bank lenders are pursuing deposit-taking licenses or partnerships with existing deposit institutions, gaining access to lower-cost funding that materially improves net interest margin on originated home equity products across the portfolio. This transition requires meaningful regulatory approval and capital investment, but the long-term funding cost advantage justifies the effort for lenders with sufficient scale.

Third-Party Technology Platform Licensing

Smaller lenders increasingly license underwriting and servicing technology from larger platform providers rather than building proprietary systems, converting a large fixed technology investment into a variable operating cost that scales with origination volume more predictably. This model also reduces compliance risk tied to maintaining proprietary systems against evolving federal and provincial requirements, a burden smaller lenders struggle to manage internally.

Portfolio Architecture for Margin Defence

Home equity lending economics split across three tiers with meaningfully different margin profiles. Volume-oriented standard HELOC and fixed-rate loans compete almost entirely on rate and origination speed, generating thin net interest margins relative to more differentiated product structures. Only the largest five lenders sustain acceptable returns at this pricing level given fixed technology and compliance overhead spread across enormous origination volume nationwide.
Certified renovation-linked and specialty underwriting products command premium pricing tied to service depth and faster funding cycles. Shared appreciation and next-generation equity-sharing structures carry the highest margins but remain a comparatively small share of total origination volume today, reflecting their early stage of mainstream adoption across most lender segments. Early movers in this tier are capturing disproportionate share of debt-averse retiree borrowers who would otherwise avoid equity products entirely.

The volume versus premium tension defines competitive strategy across every major lender: large banks defend core HELOC margins through scale, while smaller specialists concentrate entirely on higher-value renovation and shared appreciation segments where differentiation still commands real pricing power industry-wide. Smaller lenders without scaled renovation infrastructure increasingly partner with contractor networks rather than attempt to build comparable capability independently, a trend likely to continue through the forecast period.

Volume / Commodity-Adjacent

Standard HELOC and fixed-rate home equity loans competing primarily on interest rate and approval speed for broad, price-sensitive homeowner segments nationwide. Margin here has compressed steadily over the past several years as digital comparison tools increase rate transparency for borrowers.
Gross Margin: 18-26%

Premium / Certified

Renovation-linked and specialty underwriting products bundling contractor partnerships and faster funding cycles for borrowers with specific project timelines and documentation needs. Retention rates run notably higher among renovation-linked borrowers relative to standard HELOC accounts on comparable lending platforms.
Gross Margin: 30-38%

Sustainability / Regulatory / Next-Generation

Shared appreciation agreements and digital-first equity-sharing structures serving debt-averse homeowners seeking capital without monthly payment obligations or added interest cost. Adoption remains concentrated among the largest and most sophisticated fintech entrants currently building out this capability.
Gross Margin: 38-46%
canada-home-equity-lending-market-portfolio-architecture-1787918017423

High-value Sub-segments and Strategic Watch-out

Home Equity Investment Agreements

Shared appreciation structures bringing debt-free capital access to retirees and self-employed homeowners represent the fastest-growing, highest-margin opportunity in home equity lending today, with adoption accelerating. Early movers are capturing disproportionate share of new borrower relationships across every major metropolitan market. Provider selection increasingly shapes borrower decisions.
Gross Margin: 38-46%

Renovation-Linked Contractor Partnerships

Contractor referral lending commands premium fees and strong borrower retention, though growth trails the fastest shared appreciation segment as adoption remains concentrated among larger banks currently. Providers investing early in contractor partnerships are seeing measurable origination volume gains across their renovation lending books. This trend should strengthen as networks expand.
Gross Margin: 30-38%

Standard HELOC Origination

The volume backbone of the industry, generating predictable but thin origination margins across the vast majority of total home equity lending balances nationwide under continuous rate pressure. Consolidation pressure continues building steadily among smaller sub-scale lenders lacking comparable technology infrastructure investment. Scale remains the primary driver of sustainable profitability here.
Gross Margin: 18-26%

Legacy Cash-Out Refinancing

A shrinking segment as elevated current mortgage rates discourage homeowners from refinancing existing low-rate mortgages, pushing borrowers toward equity products that preserve their original rate. Wind-down timelines vary considerably depending on how quickly benchmark interest rates decline from current elevated levels. Specialized lenders focused on transition products are watching closely.
Gross Margin: 16-22%

How Equity Relationships Compound Over Time

Home equity lending relationships behave like annuities once established. Homeowners rarely close a line of credit after opening one, and balances often sit drawn and repaid repeatedly over a decade or more, generating recurring interest income for the originating lender without requiring renewed sales effort. Attrition happens almost exclusively through home sale or a rare voluntary refinancing decision rather than active provider switching.
Adoption stickiness varies meaningfully by borrower vertical. Homeowners near retirement exhibit the deepest stickiness, often maintaining the same lender relationship for fifteen years or longer, while younger, digitally native borrowers show comparatively higher churn as newer fintech entrants undercut legacy lenders on speed and product flexibility. Financial services and technology-sector borrowers, quicker to adopt fintech-first lending platforms, show the shallowest stickiness of any major borrower vertical.

Buyer profiles are shifting generationally as younger borrowers, more comfortable evaluating shared appreciation and other non-traditional structures, replace older homeowners who historically favored the familiarity of a standard line of credit from their primary bank. This generational transition is gradually eroding the switching-cost advantage that incumbent lenders relied on for decades. Lenders slow to modernize their product suite risk losing renewal conversations to challengers even after years of otherwise uninterrupted service.
canada-home-equity-lending-market-end-use-penetration-index-1787918017912

MMA Analyst Assessment and Recommendations

These are among the four positions where our research anticipates prominent divergence between winners and laggards over the coming forecast period. Each is grounded in the demand model, the regulatory perimeter, and the announced capacity pipeline.
01 / PRODUCT DEVELOPMENT STRATEGY

Build shared appreciation capability before fintechs dominate the segment

Shared appreciation agreements remain a meaningfully underdeveloped capability outside a small handful of specialized fintech entrants, and early movers are already capturing disproportionate share of retiree and self-employed borrower demand. Large banks that wait risk ceding a fast-growing, high-margin segment to Fraction and Neighbourhood Holdings permanently. The window for a credible bank entrant to establish real distribution scale here is closing steadily, and every quarter of delay makes catching up against established fintech distribution networks meaningfully harder for any bank entering the category late.
02 / DISTRIBUTION AND PARTNERSHIPS

Expand contractor referral partnerships for renovation lending

Renovation-linked lending is growing faster than standard HELOC origination, and the lenders capturing this growth are the ones investing early in contractor referral relationships that capture borrowers before they shop competing options. Providers still dependent primarily on branch-based origination are ceding this segment to more digitally integrated competitors. This is not a marginal opportunity, it is one of the largest sources of net-new origination volume available over the next several years, and lenders treating it as secondary will regret that choice.
03 / FUNDING AND CAPITAL STRATEGY

Diversify wholesale funding before rate volatility returns

Non-bank lenders remain disproportionately exposed to wholesale funding cost volatility, and providers that diversify funding sources now will be better positioned when the next rate cycle inevitably arrives. Waiting until volatility hits again leaves little time to build the securitization relationships and institutional credit lines that take years to establish credibly with counterparties. Lenders that treat funding diversification as optional rather than urgent risk margin compression precisely when better-prepared competitors are already gaining share fastest across every meaningful borrower segment nationwide.
04 / REGULATORY COMPLIANCE POSTURE

Prepare underwriting models for tighter household debt oversight

Regulatory scrutiny of household debt levels shows no sign of easing, and lenders that build flexible, debt service ratio aware underwriting models now will absorb future tightening more efficiently than competitors scrambling to adjust models later under deadline pressure. Treating compliance investment purely as overhead misses its defensive value against future rule changes. Lenders that get this positioning wrong risk losing marginal borrower segments to better-prepared, more compliant competitors entirely, a cost that compounds steadily with every passing regulatory cycle.

Engagement Snapshot From the Field

A live engagement with an industry participant carrying material or product regulatory and market exposure ahead of a defining policy shift, showing how our research translates into a defensible multi-year portfolio strategy.
MARKET MINDS ADVISORY · CLIENT ENGAGEMENT SUMMARY
Canada Home Equity Lending Producer Strategic Portfolio Review and Transition Roadmap 2026·Investment Scenario on Canada Home Equity Lending Exposure Evaluation 2025-26
CLIENT PROFILE
The client, a mid-sized non-bank lender operating across Ontario and Alberta, originated roughly CAD 400 million in annual home equity volume through traditional HELOC and fixed-rate products distributed via mortgage brokers. Leadership sought to evaluate whether adding a shared appreciation product line would meaningfully expand their addressable borrower base. The client operated primarily through independent mortgage brokers rather than direct-to-consumer channels, limiting visibility into emerging borrower preferences.
STRATEGIC CHALLENGE
The client lacked internal data on shared appreciation product economics and was uncertain whether existing broker distribution relationships could effectively sell a fundamentally different product structure. Leadership also worried that launching a new product category too early could dilute focus and confuse the sales organization during a period of already elevated origination volume.
MMA APPROACH
MMA conducted a structured market sizing exercise for shared appreciation demand within the client's existing footprint, benchmarking competitor product terms and broker commission structures against the client's current economics. The engagement included structured interviews with the client's top-producing brokers to gauge realistic near-term sales capacity for a new product category.
KEY FINDINGS
  1. Broker interviews revealed strong latent demand among self-employed and retired homeowner clients who had previously been declined for traditional products entirely. This underserved population represented a meaningful growth opportunity the client had not previously quantified.
  2. Competitor shared appreciation pricing carried meaningfully wider margins than the client's existing HELOC book, even after accounting for higher marketing and education cost. This margin gap alone justified further exploration of the product category.
  3. Broker education requirements were more substantial than leadership initially assumed, requiring a dedicated training program before meaningful volume could be expected. Without adequate preparation, early sales conversations risked confusing brokers accustomed to simpler product explanations.
  4. Regulatory treatment of shared appreciation agreements remained genuinely unsettled in one province, creating near-term launch timing risk worth monitoring closely. MMA recommended monitoring regulatory developments closely before committing to full provincial expansion.
CLIENT PROFILE
The client, a mid-sized non-bank lender operating across Ontario and Alberta, originated roughly CAD 400 million in annual home equity volume through traditional HELOC and fixed-rate products distributed via mortgage brokers. Leadership sought to evaluate whether adding a shared appreciation product line would meaningfully expand their addressable borrower base. The client operated primarily through independent mortgage brokers rather than direct-to-consumer channels, limiting visibility into emerging borrower preferences.
STRATEGIC CHALLENGE
The client lacked internal data on shared appreciation product economics and was uncertain whether existing broker distribution relationships could effectively sell a fundamentally different product structure. Leadership also worried that launching a new product category too early could dilute focus and confuse the sales organization during a period of already elevated origination volume.
MMA APPROACH
MMA conducted a structured market sizing exercise for shared appreciation demand within the client's existing footprint, benchmarking competitor product terms and broker commission structures against the client's current economics. The engagement included structured interviews with the client's top-producing brokers to gauge realistic near-term sales capacity for a new product category.
KEY FINDINGS
  1. Broker interviews revealed strong latent demand among self-employed and retired homeowner clients who had previously been declined for traditional products entirely. This underserved population represented a meaningful growth opportunity the client had not previously quantified.
  2. Competitor shared appreciation pricing carried meaningfully wider margins than the client's existing HELOC book, even after accounting for higher marketing and education cost. This margin gap alone justified further exploration of the product category.
  3. Broker education requirements were more substantial than leadership initially assumed, requiring a dedicated training program before meaningful volume could be expected. Without adequate preparation, early sales conversations risked confusing brokers accustomed to simpler product explanations.
  4. Regulatory treatment of shared appreciation agreements remained genuinely unsettled in one province, creating near-term launch timing risk worth monitoring closely. MMA recommended monitoring regulatory developments closely before committing to full provincial expansion.
RECOMMENDED STRATEGY
Phase 1: Phase 1 (Pilot): Launch a limited shared appreciation product in Ontario only, restricted to a small group of trained top-producing brokers. Phase 2: Phase 2 (Scale): Expand broker training and marketing support based on pilot performance data, extending distribution into Alberta gradually. during this second phase. Phase 3: Phase 3 (Optimize): Refine pricing and eligibility criteria using accumulated performance data, then evaluate expansion into additional provinces. where regulatory clarity supports it.
OUTCOME
The client launched its shared appreciation pilot within Ontario, generating meaningful new origination volume from borrowers who would not have qualified for traditional products (client-reported, unverified by MMA). Broker adoption exceeded initial expectations, and the client began planning provincial expansion within the first year. Leadership now views the pilot as a template for evaluating future product category expansion decisions.

Frequently Asked Questions

Foundational context covering the market sizes, CAGR, scope, country, region and competition that inform every finding below. This section is provided to cover basics and most often pre-purchase conversations, answered from the MMA Primary Research Dataset.

What is the current size of the Canada Home Equity Lending Market?

The Canada Home Equity Lending Market reached $215.0 billion in outstanding balances in 2025. This figure reflects total lines of credit, fixed-rate loans, and equity-access products secured against Canadian residential property.

How large will the Canada Home Equity Lending Market be by 2036?

MMA projects the market will reach $522.11 billion by 2036, roughly 2.24 times its 2026 value. Growth is driven primarily by rising home prices and expanding shared appreciation product adoption.

What is the CAGR for the Canada Home Equity Lending Market 2026 to 2036?

The market is projected to grow at an 8.4 percent compound annual growth rate between 2026 and 2036. This compares to a historical CAGR of roughly 7.2 percent recorded across the preceding 2020 to 2025 period.

Which segment is growing fastest?

Home equity investment agreements are growing fastest at a 15.4 percent CAGR, nearly double the overall market rate. This reflects rapid adoption of shared appreciation structures among debt-averse retirees and self-employed homeowners.

Who are the major companies in the Canada Home Equity Lending Market?

Royal Bank of Canada, TD Bank Group, Scotiabank, Bank of Montreal, and CIBC lead the market by origination volume. Together these five lenders hold roughly 38 percent combined concentration across the national market.

Which country is growing fastest?

India is the fastest-growing home equity lending market at a 13.6 percent CAGR, driven by expanding digital-first non-bank lender coverage. Formal secured credit access is extending to homeowners previously excluded from traditional lending channels.

Report Segmentation Architecture

The full report scope spans multiple orthogonal segmentation dimensions, with cross-tabulated demand data provided for each dimension pair. Coverage extends further to regional breakdowns, trend trajectories, and the competitive detail needed to support segment-level decision-making.

By Product Structure

  • Home Equity Lines of Credit
  • Fixed-Rate Home Equity Loans
  • Home Equity Investment Agreements
  • Renovation-Linked Home Equity Loans
  • Cash-Out Mortgage Refinancing
  • Reverse Mortgage Equity Release

By End-Use Industry

  • Owner-Occupied Residential Lending
  • Renovation and Home Improvement
  • Debt Consolidation Financing
  • Retirement Income Supplementation
  • Investment Property Financing

By Commercial Dimension

  • Direct Bank Distribution
  • Independent Mortgage Broker Channel
  • Digital Direct-to-Consumer Platform
  • Contractor Referral Partnership

By Region

  • North America
  • Western Europe
  • East Asia
  • South Asia and Pacific
  • Latin America
  • Middle East and Africa
  • Eastern Europe

Scope, Methodology, and Coverage

Every figure in this report is reproducible from documented input assumptions. The scope below maps the historical period, the forecast horizon, the segmentation dimensions, and the countries covered, alongside the underlying primary and qualitative methodology.
Historical Period
2020 to 2025
Forecast Period
2026 to 2036
Base Year
2025 (USD billions; MMA Primary Research Dataset, August 2026)
Market Definition
This report covers loan and equity-access products secured against residential home equity for Canadian homeowners, including lines of credit, fixed-rate second mortgages, shared appreciation agreements, and reverse mortgages. It excludes first-lien purchase mortgages, commercial real estate lending, and unsecured personal credit products.
Quantitative Units
USD billions (current prices); CAD billions where noted
Segmentation Dimensions
By Product Structure; By End-Use Industry; By Commercial Dimension; By Region
Regions Covered
North America, Western Europe, East Asia, South Asia and Pacific, Latin America, Middle East and Africa, Eastern Europe
Countries Covered
USA, China, Germany, France, UK, Japan, South Korea, India, Australia, Canada, Brazil, Mexico, Indonesia, Vietnam, Thailand, Malaysia, UAE, Saudi Arabia, South Africa, Nigeria, Turkey, Poland, Netherlands, Italy, Spain, Sweden, Switzerland, Argentina, Colombia, Singapore, and additional markets relevant to this sector
Key Companies Profiled
Royal Bank of Canada, TD Bank Group, Scotiabank, Bank of Montreal, CIBC, National Bank of Canada, Desjardins Group, HomeEquity Bank, Home Trust Company, Equitable Bank, First National Financial, MCAP, Manulife Bank, Meridian Credit Union, Coast Capital Savings, Vancity, Alterna Savings, B2B Bank, Fraction, Neighbourhood Holdings
Quantitative Methodology
Primary survey, n=3,800 respondents, Q4 2025, six countries; demand-side model with trade association cross-validation
Qualitative Methodology
47 expert interviews, Q4 2025; applied to validate demand model assumptions, identify emerging dynamics, and assess competitive positioning
Report Format
PDF and XLSX data workbook (Word format preview document)
Publisher
Market Minds Advisory
Report Code
MMA-2026-TEC-231
Published
August 2026
Contact
sales@marketmindsadvisory.com | www.marketmindsadvisory.com

Purchase the full Canada Home Equity Lending Market Report (2026 to 2036).

This report provides comprehensive coverage of the Canada Home Equity Lending Market, including detailed sizing, segmentation, and regional analysis through 2036. It examines competitive dynamics among the leading banks and non-bank lenders, covering their strategic positioning, moats, and vulnerabilities. The analysis also addresses regulatory drivers, funding cost pressure, and emerging shared appreciation product trends reshaping lending economics. Readers gain access to primary survey data, expert interview insights, and MMA's proprietary forecasting methodology. The report is designed for lending strategy executives, fintech product teams, and institutional mortgage investors evaluating positioning decisions, product launch priorities, or capital allocation across the home equity lending value chain.
Ten-year market sizing and forecast model
Six-segment MECE product structure segmentation model
Seven-region demand, share, and growth analysis
Competitive landscape with moat and risk profiles
Primary survey data from 3,800 respondents
Forty-seven expert interviews across lender types

Built For The People Who Decide

From boardroom strategy to bench-side execution, this report is read cover-to-cover by leaders shaping the next decade of their industry, turning demand scenarios, market dynamics and valuation benchmarks into decisions.
CXOs/ Presidents/ VPs/ Managers
M&A and Corporate Development
Strategy Teams and R&D Heads
Procurement and Product Directors
Regulatory and Compliance Leaders
Investor Relations and Equity Analysts