Market Minds Advisory
Calcium Ammonium Nitrate Market

Calcium Ammonium Nitrate Market: Feedstock Economics in a Regulatory Efficiency Cycle

European nitrate leaching regulations are pushing farmers toward calcium ammonium nitrate over urea, even as natural gas price volatility keeps squeezing the ammonia-based production economics that determine whether European producers can compete with cheaper imports.

Lead Analyst

Bilal Shaikh

Published

September 2026

Make Smarter Decisions with Customized Research Insights

Request a free sample report and evaluate market opportunities, growth trends, and competitive dynamics relevant to your business needs.

2025 MARKET VALUE$11.2BMarket Size 2025
2036 FORECAST VALUE$17.6BBase Case , 2026 to 2036
CAGR 2026 TO 20364.2 %Bull 5.2% / Bear 3.2%
INCREMENTAL OPPORTUNITY$5.9BNet 10- year value creation
EXPANSION MULTIPLE1.51x2036 value over 2026 base
Strategic Levers
M&A Pipeline
Regional Outlook
Country Rankings
Competitive Intelligence
Segmental Deep-dive
Call-Us : 91 93563 13602

Executive Snapshot and Market Trajectory

Calcium ammonium nitrate has moved from a regionally preferred nitrogen source into a regulatory-favored one, since its lower nitrate leaching and volatilization losses compared to urea increasingly align with tightening European water quality and greenhouse gas accounting rules that farmers can no longer simply ignore.
Coated and stabilized CAN formulations are pulling demand fastest, since nitrification inhibitor coatings further reduce nitrogen loss and align directly with the EU's nutrient efficiency targets under its broader Green Deal agricultural framework. Western Europe anchors the largest share of global demand given decades of agronomic preference and regulatory reinforcement, while East Asia's expanding compound fertilizer manufacturing base, anchored by China, is closing the gap as farmers there adopt more efficiency-focused nitrogen sources.
Competitive position tracks integrated ammonia production cost and distribution network depth more than brand strength, since CAN is fundamentally a commodity nitrogen product where feedstock gas pricing determines most of the margin outcome. Yara and CF Industries lead through different cost structures, European integrated scale against North American low-cost gas access, while Eastern European and Russian producers compete aggressively on price in markets where regulatory nitrogen-efficiency premiums matter less.
Market Definition
The calcium ammonium nitrate market covers granular, prilled, coated, and liquid CAN fertilizer products containing approximately 27 percent nitrogen in combined nitrate and ammonium form, sold for agricultural and specialty horticultural use. It excludes urea, ammonium sulfate, and other single-nutrient nitrogen fertilizers not formulated as calcium ammonium nitrate.
Base Year Value
$11.2B in 2025 (MMA Primary Research Dataset, August 2026)
Forecast Period
2026 to 2036, eleven discrete annual values
CAGR
4.2% base case. Bull 5.2%. Bear 3.2%.
Fastest Growth Segment
Coated and Stabilized CAN Formulations: 6.8% CAGR
Fastest Growth Country
Australia: 6.6% CAGR
Fastest Growth Region
South Asia and Pacific: 6.2% CAGR
Largest Region
Western Europe: 26% of 2025 global value
Market Leaders
Yara International ASA, CF Industries Holdings, Inc., Grupa Azoty S.A., OCI N.V., EuroChem Group AG. Source: MMA Analysis based on company annual reports.
Primary Survey
n=3,800 procurement and R&D decision-makers, Q4 2025, six countries
Methodology
Demand-side build-up, cross-validated against public data, 47 expert interviews

Calcium Ammonium Nitrate Market Forecast Scenarios

calcium-ammonium-nitrate-market-size-forecast-scenario-1787300723018
Between 2020 and 2025 the market grew at an estimated 3.7% CAGR, a period shaped by extreme natural gas price volatility following the 2022 European energy crisis that temporarily disrupted ammonia production economics across the continent. Demand growth remained modest but steady throughout, reflecting CAN's status as an established agronomic staple rather than a category experiencing meaningful volume expansion.
The base case assumes 4.2% CAGR through 2036, driven by three mechanisms: tightening European nitrate leaching and greenhouse gas accounting regulation that reinforces CAN's agronomic advantage over urea, growing adoption of nitrification-inhibitor-coated formulations that command premium pricing while meeting nutrient efficiency targets, and expanding compound fertilizer manufacturing capacity across East Asia and South Asia as regional agricultural intensification continues. Together these mechanisms sustain modest but durable growth in a mature category unlikely to see dramatic volume expansion.
The bull case, 5.2% CAGR, assumes faster EU nutrient efficiency regulation adoption pulls coated CAN conversion forward across more member states simultaneously. The bear case, 3.2% CAGR, reflects the risk that persistent natural gas price volatility keeps European ammonia production costs elevated enough that import volumes from lower-cost regions capture a growing share of European demand.

Feedstock Gas Economics and Regulatory Nitrogen Efficiency

Calcium ammonium nitrate behaves less like a differentiated specialty product and more like a regulated commodity whose margin economics trace directly back to natural gas pricing, since ammonia synthesis consumes gas as both feedstock and energy source in roughly equal measure. Producers with integrated ammonia capacity and access to comparatively cheap feedstock gas hold a durable cost advantage that pure CAN blenders lacking upstream ammonia production simply cannot match regardless of their
MARKET CONCENTRATION (CR5)34%Moderately fragmented despite several large integrated global producers
AVERAGE SELLING PRICE$310/tonCoated formulations command a meaningful premium over standard
TOP PRODUCING COUNTRY SHAREGermany, 14%reflects the region's dense integrated ammonia production base
CAPACITY UTILIZATION76%Production runs below full nameplate amid gas price swings
TRADE INTENSITY48% cross-borderNearly half of finished tonnage crosses a border
FEEDSTOCK COST SHARE62%Natural gas dominates total nitrogen fertilizer production cost
Commercially, the category splits between mature, high-volume standard granular CAN sold largely on price into established agricultural markets, and a smaller but faster-growing coated and stabilized segment sold into regulatory-driven nutrient efficiency programs at meaningful premium pricing. Producers exposed to both segments manage a genuinely different margin profile across their portfolio, since coated formulations require real technology investment that standard granular products do not.
The next decade favors producers who can pair low-cost ammonia feedstock access with coated formulation technology fastest, since regulatory nitrogen efficiency requirements increasingly reward documented nutrient loss reduction rather than nitrogen content alone, and that combination is genuinely difficult for any single producer to assemble quickly.
"This is a category where the real competitive battle happens upstream, in gas contracts and ammonia plant efficiency, long before a single bag of CAN reaches a farm. Everything downstream is largely a function of that feedstock position."
Director, Agricultural Inputs and Fertilizer Practice · MMA Agriculture / Nitrog

Market Trends

EU Nutrient Efficiency Rules Favor Coated CAN

The European Union's Green Deal agricultural framework increasingly requires documented nutrient use efficiency and nitrate leaching reduction from farmers receiving common agricultural policy payments, and nitrification-inhibitor-coated CAN formulations directly address both requirements by slowing the conversion of ammonium to more leaching-prone nitrate forms in soil. This regulatory alignment is pulling demand toward coated formulations faster than standard granular CAN, since farmers increasingly need documented efficiency improvements to maintain subsidy eligibility. Yara and other European producers with established coated formulation technology are capturing disproportionate share of this premium segment ahead of competitors still selling only standard granular product.
Market Impact: Adds 340,000 tons nitrate-zone demand
Natural Gas Price Volatility Reshapes Production Geography

The 2022 European energy crisis exposed how directly ammonia production economics depend on natural gas pricing, and European producers with the highest gas cost exposure curtailed production meaningfully during the peak crisis period while producers with access to lower-cost North American or Middle Eastern gas maintained normal output. This has permanently shifted some European buyers toward import volumes from lower-cost production regions, particularly for standard, non-differentiated granular CAN. European producers are responding by pursuing longer-term gas supply contracts and, in some cases, direct investment in lower-cost production capacity outside Europe.
Market Impact: Lifts Asian CAN demand 9 percent

Market Opportunities and Growth Drivers

Water Quality Regulation Reinforces CAN's Agronomic Advantage

European nitrates directive compliance requirements increasingly favor calcium ammonium nitrate over urea in nitrate-vulnerable zones, since CAN's combined ammonium and nitrate nitrogen form produces measurably lower nitrate leaching losses than urea's more volatile ammonium-only breakdown pathway under typical field conditions. Farmers operating in officially designated nitrate-vulnerable zones, covering a substantial share of intensively farmed European cropland, face genuine pressure to document nitrogen source selection as part of nutrient management planning. This reinforcement gives CAN a durable agronomic and compliance advantage over cheaper urea alternatives that shows no sign of weakening.
Market Impact: Cuts margins by 180 points

Compound Fertilizer Manufacturing Expansion Across East Asia

Rising agricultural intensification across China and other East Asian markets is driving expansion of compound fertilizer manufacturing capacity that increasingly incorporates CAN as a nitrogen source alongside phosphate and potassium components in blended granular products. Domestic Chinese fertilizer manufacturers are scaling CAN production and blending capacity to serve this growing compound fertilizer demand, while regional agricultural extension programs increasingly promote balanced nutrient application practices that favor combined nitrate-ammonium nitrogen sources over straight urea application. This sustains CAN demand growth in a region that historically favored cheaper, simpler urea-based nitrogen fertilization almost exclusively.
Market Impact: Urea undercuts CAN pricing 15 percent

Market Restraints and Challenges

Natural Gas Price Volatility Squeezes Production Margins

Ammonia production, the upstream feedstock for calcium ammonium nitrate, consumes natural gas as both energy source and chemical feedstock, and the extreme gas price volatility following the 2022 European energy crisis pushed production costs at some European facilities high enough that continued operation became temporarily uneconomical relative to importing finished product instead. The cause is Europe's continued dependence on natural gas imports rather than domestic production, leaving European producers more exposed to global gas price swings than competitors with domestic access. Producers are mitigating this through longer-term supply contracts and relocating incremental capacity toward lower-cost gas regions.
Market Impact: Adds $180 million coated CAN demand

Urea Price Competition Limits Premium Capture

Urea remains meaningfully cheaper per unit of nitrogen than calcium ammonium nitrate in most markets, since urea's simpler production process and higher nitrogen concentration per ton give it a persistent cost advantage that CAN's agronomic benefits do not always fully offset, particularly outside regulated nitrate-vulnerable zones. The cause is that urea's 46 percent nitrogen content against CAN's roughly 27 percent means transportation and handling costs per unit of nitrogen delivered favor urea meaningfully where regulatory or agronomic reasons to prefer CAN are absent. Producers are mitigating this by emphasizing CAN's lower volatilization losses and predictable release profile.
Market Impact: Import share rose 11 percentage points
3 additional market trends, 2 additional growth drivers, and 2 additional restraints and challenges are covered in the full report. Contact sales@marketmindsadvisory.com to access the complete intelligence.

Segment CAGR and Growth Architecture

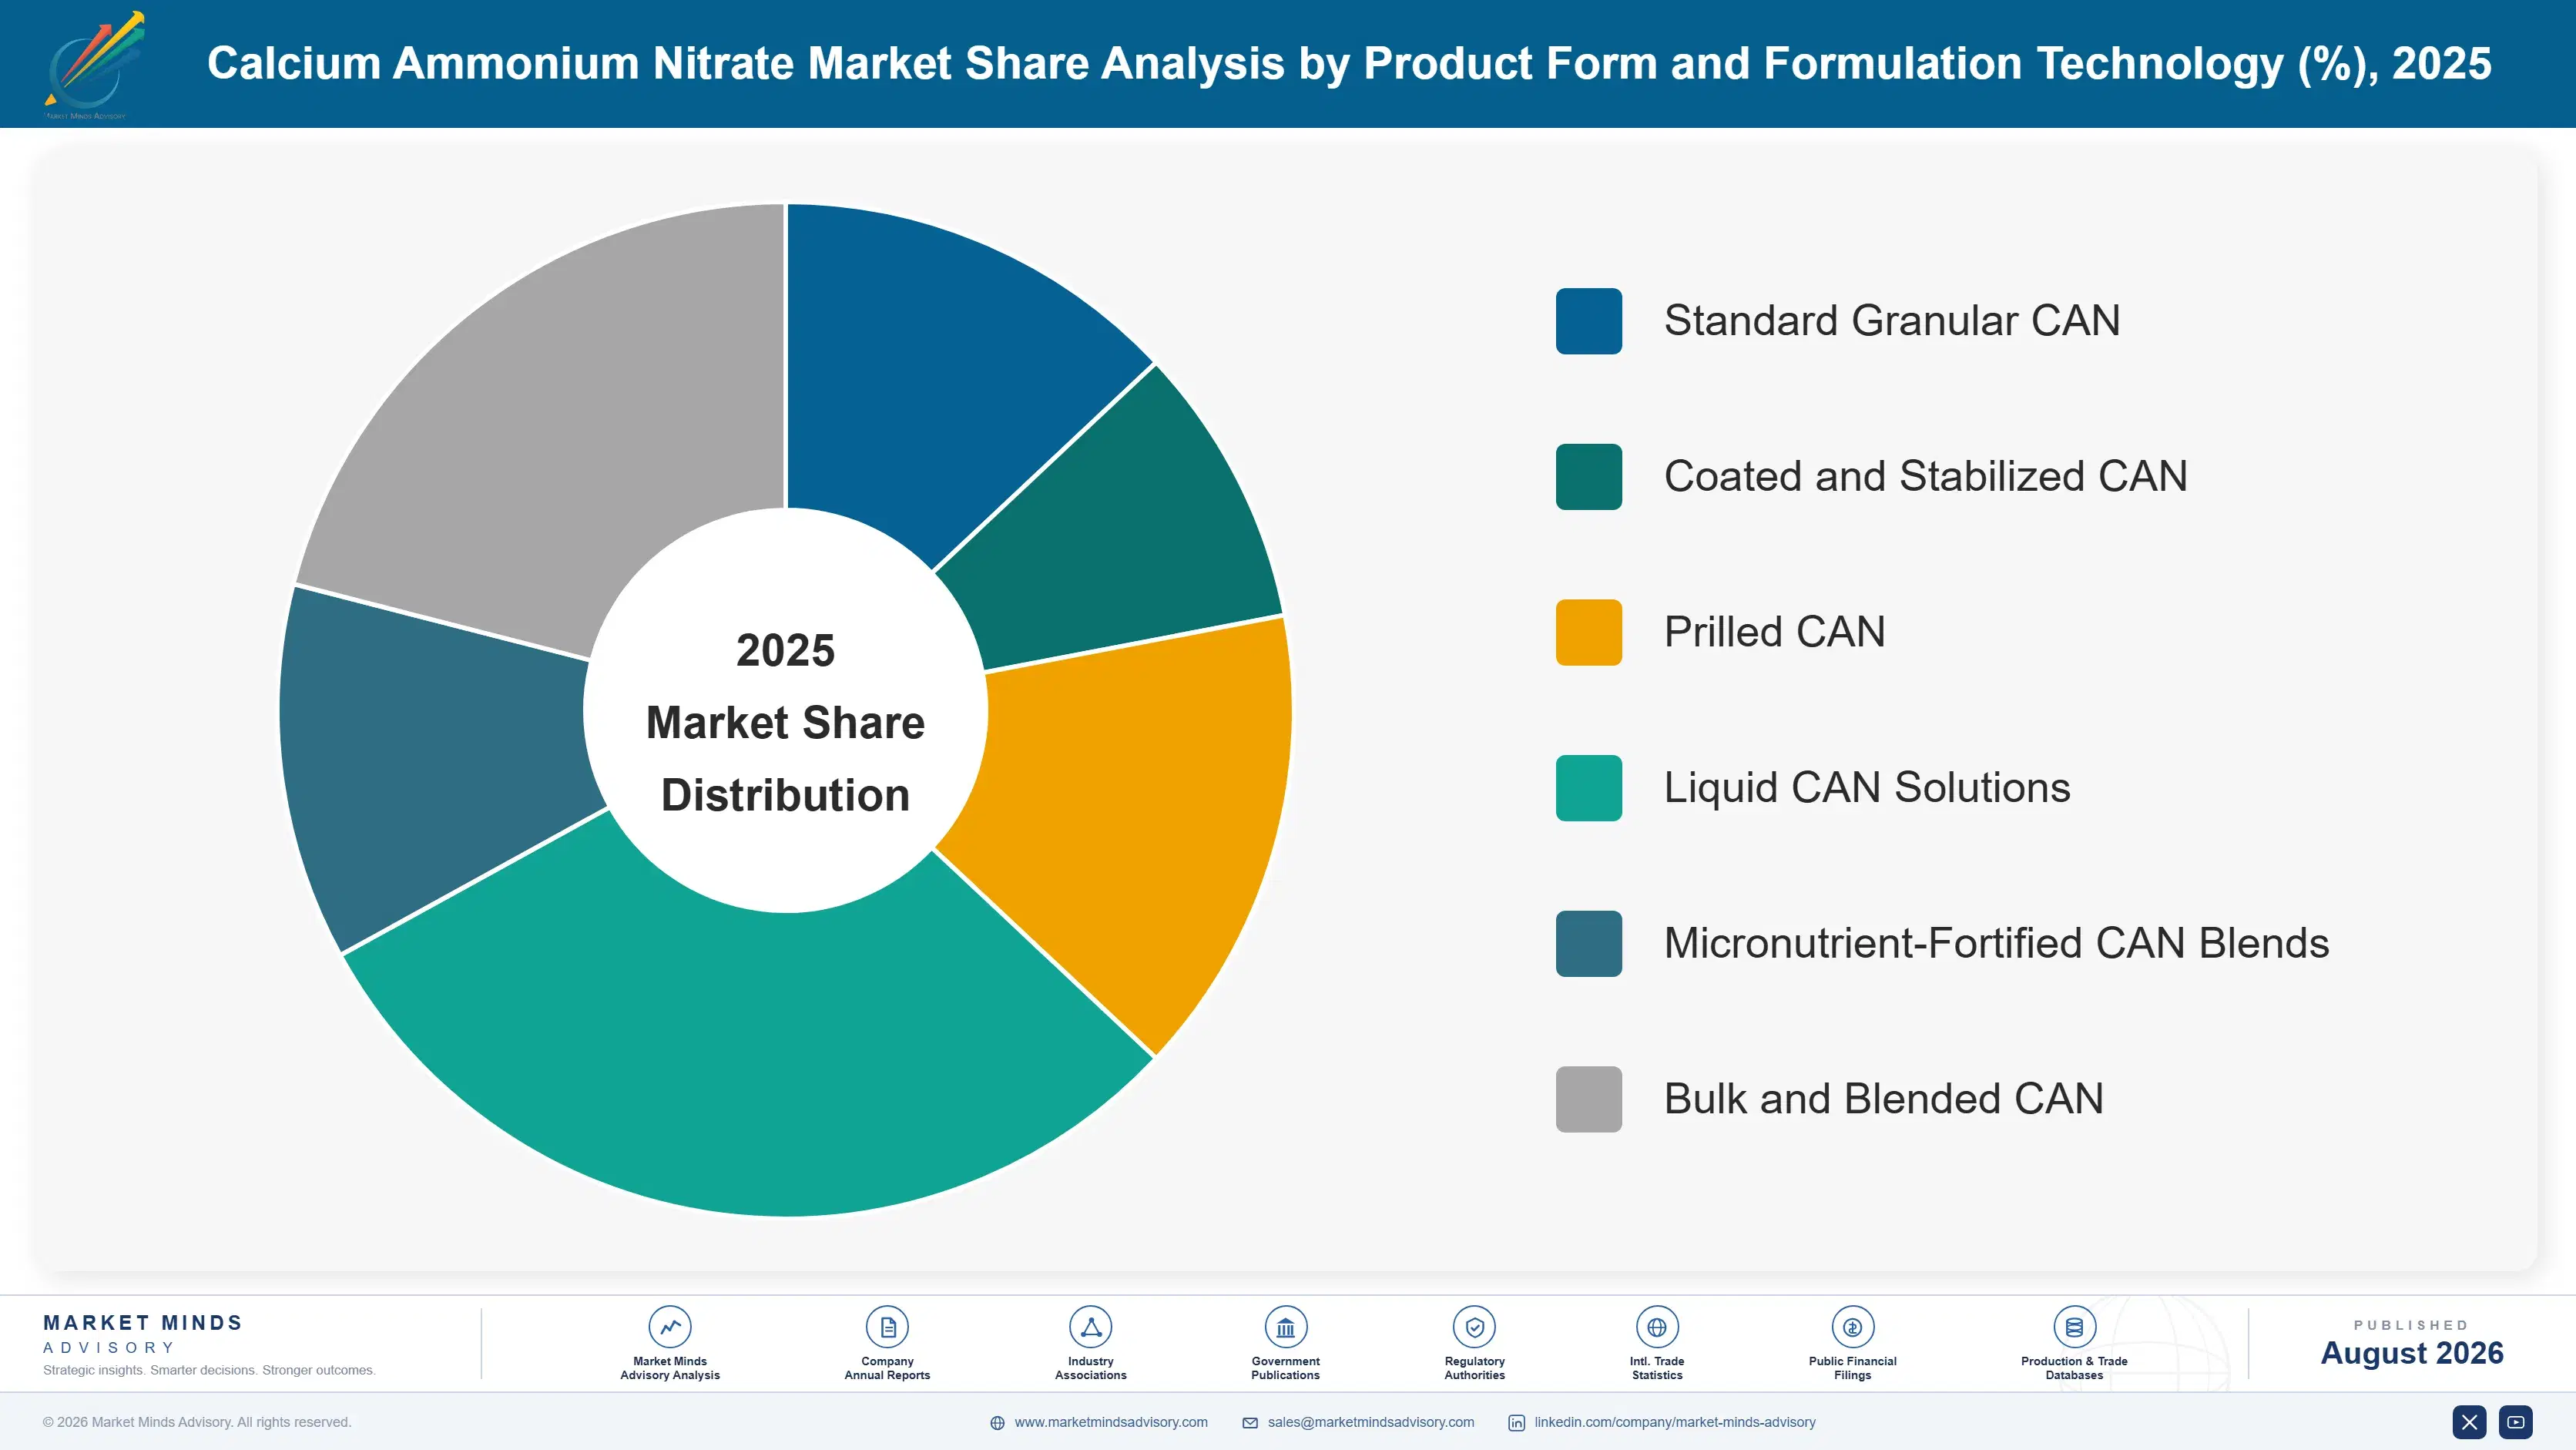
MMA segments the calcium ammonium nitrate market by product form and formulation technology, the dimension that determines nutrient release profile, regulatory compliance value, and pricing tier a buyer actually pays each season. This framing separates standard granular and prilled CAN from coated, stabilized, and micronutrient-fortified formulations increasingly specified under nutrient efficiency regulation across major markets.
calcium-ammonium-nitrate-market-market-share-analysis-1787300723586

Coated and Stabilized CAN Formulations

Coated and stabilized CAN formulations, incorporating nitrification inhibitor technology that slows nitrogen conversion in soil, are growing fastest as European Union nutrient efficiency regulation under the broader Green Deal agricultural framework increasingly rewards documented nitrogen loss reduction. This segment commands the steepest pricing premium in the category, since coating technology requires real manufacturing investment beyond standard granular production and delivers measurable environmental compliance benefits farmers increasingly need to maintain subsidy eligibility. Yara currently holds the deepest coated formulation technology and distribution network in this segment, having invested years in nitrification inhibitor research and field validation. Adoption remains concentrated in Western Europe for now, though regulatory pressure is beginning to extend coated CAN demand into Eastern European markets.
CAGR 6.8%

Micronutrient-Fortified CAN Blends

Micronutrient-fortified CAN blends form the second-fastest-growing segment, pulled by precision agriculture adoption and growing farmer interest in addressing specific soil nutrient deficiencies alongside standard nitrogen application in a single combined product. These blends incorporate boron, sulfur, or other micronutrients directly into the CAN granule, reducing the number of separate field applications a farmer needs to make and commanding a meaningful premium over standard unfortified product as a result. Growth concentrates in intensively farmed regions where soil testing increasingly reveals specific micronutrient deficiencies that standard nitrogen-phosphorus-potassium fertilization alone does not address adequately. Regional agricultural extension programs promoting soil testing and precision nutrient management are accelerating adoption of these blended products across both Western Europe and parts of East Asia.
CAGR 5.9%
Full segment breakdown across 6 segments available in the complete report.

Regional Architecture and Country Demand Map

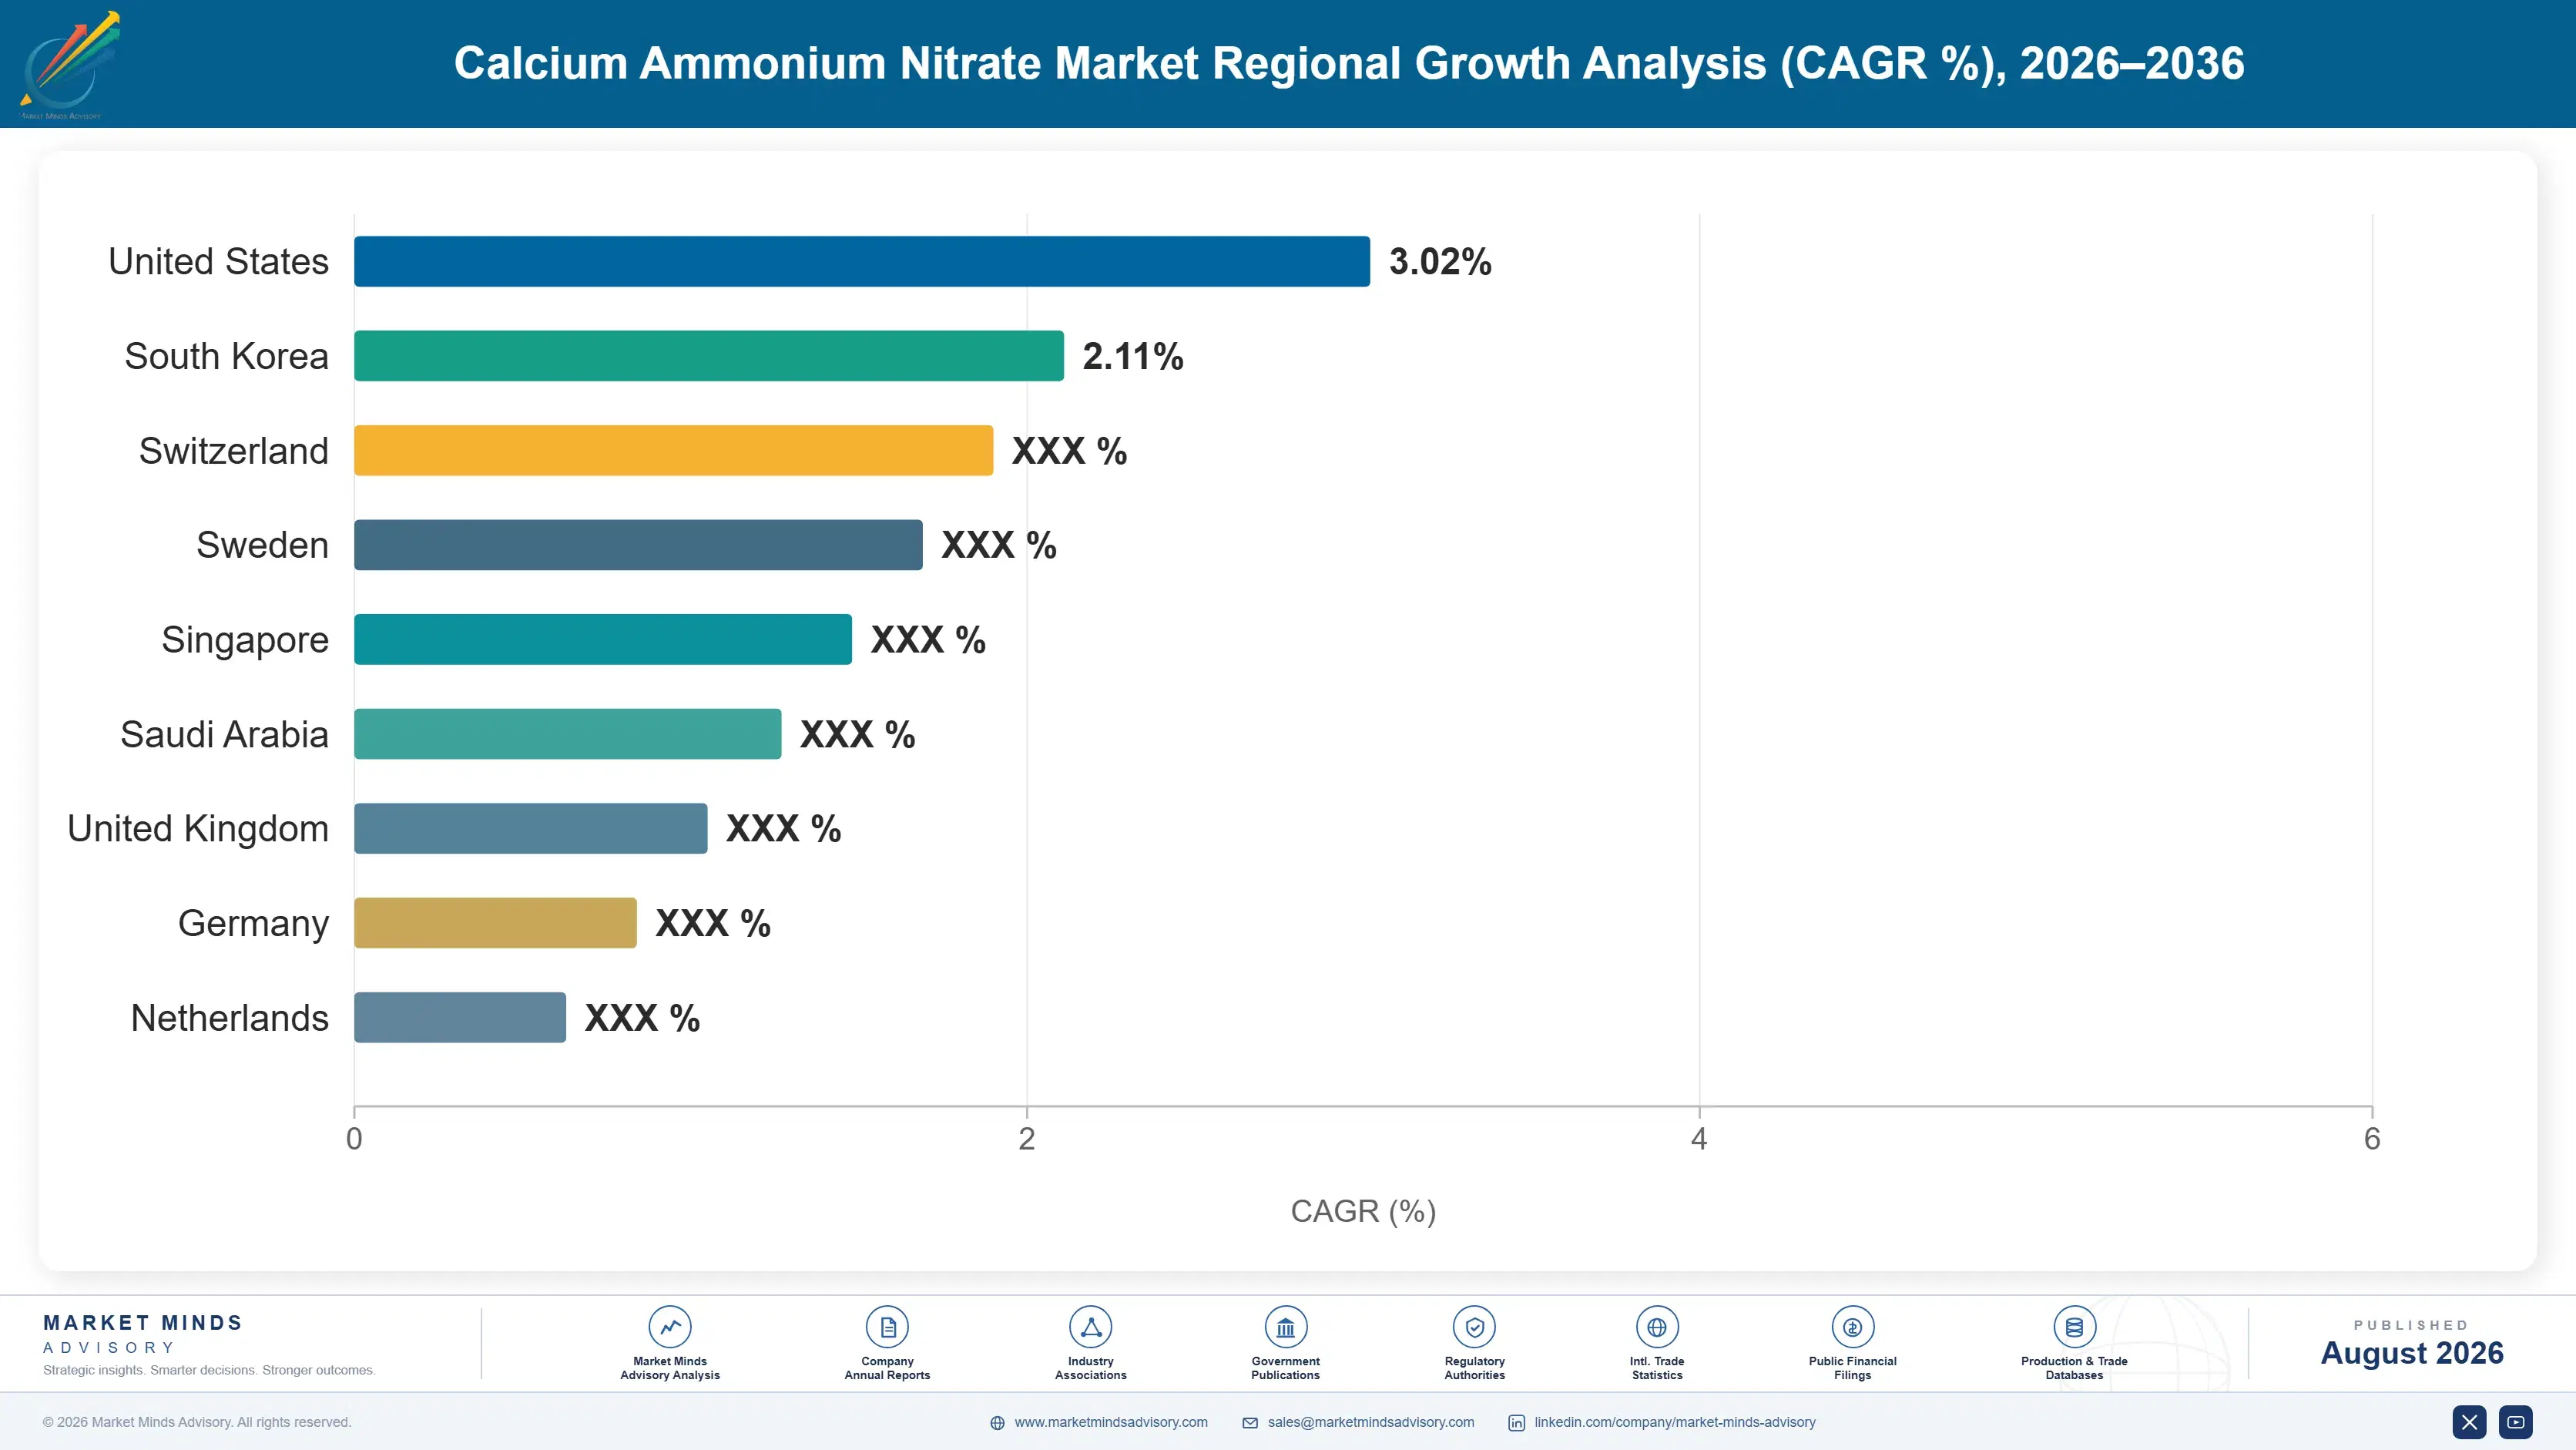
Calcium ammonium nitrate demand concentrates where regulatory nitrogen efficiency requirements and integrated ammonia production capacity intersect. Western Europe leads on decades of agronomic preference reinforced by nitrate leaching regulation, East Asia follows on expanding compound fertilizer manufacturing, and North America anchors steady demand from lower-cost domestic gas feedstock access.

North America

North America's demand reflects steady agricultural application supported by the region's comparatively low-cost domestic natural gas feedstock, which gives North American ammonia producers a durable cost advantage over European competitors reliant on higher-priced imported gas. CF Industries and other North American producers have expanded ammonia and nitrate production capacity to capture this feedstock cost advantage, serving both domestic agricultural demand and growing export volume into gas-constrained markets elsewhere. US farmers use CAN less intensively than European counterparts given different regulatory frameworks and a historical preference for urea and ammonium nitrate-based products in many regions. Canada's smaller agricultural sector contributes additional steady demand, particularly across its grain-growing prairie provinces where nitrogen fertilization timing flexibility matters given the shorter growing season.
Share: 23% | CAGR: 4.7% (2026 to 2036)

Western Europe

Western Europe leads global calcium ammonium nitrate demand, anchored by decades of agronomic preference reinforced directly by European nitrates directive compliance requirements that favor CAN's lower leaching losses over urea in nitrate-vulnerable zones covering much of the region's intensively farmed cropland. German, French, and UK farmers represent the largest concentration of regional demand, and German producers including Yara and SKW Piesteritz maintain the deepest integrated ammonia and CAN-specific distribution infrastructure. The 2022 European energy crisis temporarily disrupted regional production economics, pushing some buyers toward import volumes, though most demand has since normalized as gas prices moderated. Coated and stabilized formulation adoption is advancing fastest here given the EU's leading regulatory position.
Share: 26% | CAGR: 3.0% (2026 to 2036)
Regional intelligence for 5 additional markets available in the complete report: East Asia, South Asia and Pacific, Latin America, Middle East and Africa, Eastern Europe. Contact sales@marketmindsadvisory.com.
calcium-ammonium-nitrate-market-country-cagr-analysis-1787300724107

Monetizing Nitrogen Efficiency and Compliance Value

Producers are shifting from commodity tonnage sales toward compliance-led commercial models: premium pricing for coated formulations that deliver documented nutrient efficiency, long-term gas supply agreements that stabilize production cost, micronutrient blending services that increase revenue per ton, and agronomic advisory support that deepens farmer relationships well beyond a single seasonal purchase transaction each year.

Premium Pricing for Coated Nitrification-Inhibitor Formulations

Producers increasingly price coated and stabilized CAN formulations at a meaningful premium over standard granular product, reflecting both the real technology investment required and farmers' willingness to pay for documented nutrient efficiency that supports subsidy compliance under evolving EU regulation. This premium is most defensible in nitrate-vulnerable zones and other regulated areas where farmers face direct compliance requirements rather than voluntary environmental preference alone. Coated CAN currently commands premiums of 18 to 28 percent over standard granular product across most European markets, a gap producers expect to persist as regulatory requirements continue tightening.
Market Impact: Commands an 18 to 28 percent price premium

Long-Term Gas Supply Agreements Stabilizing Production Cost

Facing recurring natural gas price volatility that repeatedly disrupted production economics during the 2022 European energy crisis, producers increasingly negotiate long-term gas supply agreements that lock in more predictable feedstock pricing rather than relying entirely on spot market purchasing exposed to sudden price spikes. This model requires real negotiating scale and creditworthiness that favor larger integrated producers over smaller regional blenders lacking comparable leverage with major suppliers. Producers with secured long-term agreements report roughly 40 percent more stable production economics through recent volatility than competitors buying gas primarily on the spot market.
Market Impact: Stabilizes roughly 40 percent of gas costs annually

Micronutrient Blending Services Increasing Revenue Per Ton

Producers increasingly offer micronutrient blending services that incorporate boron, sulfur, or other nutrients directly into CAN granules, capturing revenue per ton roughly 25 percent higher than standard unfortified product while reducing the number of separate field applications farmers need to make each season. This service requires additional blending infrastructure investment but generates margin well above standard granular CAN, since farmers pay for the convenience and precision of combined nutrient delivery rather than the nitrogen content alone. Producers offering micronutrient blending report growing adoption among precision agriculture-focused farmers specifically, a customer segment increasingly willing to pay for measurable soil health benefits.
Market Impact: Adds roughly 25 percent revenue per ton sold

Agronomic Advisory Support Deepening Farmer Relationships

Producers increasingly bundle agronomic advisory services, including soil testing interpretation and nitrogen application timing recommendations, with CAN sales, positioning themselves as a trusted seasonal nutrient management partner rather than a simple commodity fertilizer supplier competing purely on price. This deepens the producer relationship beyond a single transactional sale into an ongoing seasonal advisory relationship that farmers increasingly value as regulatory nutrient management planning requirements grow more complex. Producers offering this bundled advisory support report seasonal customer retention roughly 17 percent higher than competitors selling CAN as an undifferentiated commodity product without comparable support.
Market Impact: Improves seasonal customer retention by 17 full points

Who Controls the Margin Pool

CR5 sits at 34 percent, moderate concentration reflecting a category where several large integrated producers compete alongside a long tail of regional blenders and importers. Yara and CF Industries lead through fundamentally different cost structures, European integrated scale against North American low-cost gas access, and the gap to mid-tier challengers is real but narrower than the headline concentration figure suggests.
Current activity centers on three fronts: development of coated and stabilized formulation technology to capture regulatory-driven premium pricing, negotiation of long-term gas supply agreements to stabilize production economics against recurring volatility, and geographic capacity expansion or repositioning toward lower-cost gas regions following the lessons of the 2022 European energy crisis.

Emerging pressure comes from Eastern European and Russian producers with access to comparatively lower-cost regional gas supply, competing aggressively on price in standard granular segments where regulatory nitrogen-efficiency premiums matter less than in Western Europe specifically. Expect ranking shifts as these lower-cost producers capture a growing share of price-sensitive standard CAN volume, gradually pushing established Western European leaders further toward the specialty coated and micronutrient-fortified segments where technology and compliance value matter more than raw production cost.
calcium-ammonium-nitrate-market-company-positioning-matrix-1787300724628

Competitive Moat and Risk Dimensions

YARA INTERNATIONAL ASA

Moat: European CAN Production Scale

Yara operates the largest integrated European nitrogen fertilizer production and distribution network, with deep agronomic relationships built over a century of continuous European agricultural market presence that newer entrants cannot easily replicate. This scale gives Yara unmatched CAN market access across the EU's largest agricultural markets and the technical credibility to lead coated formulation adoption.
YARA INTERNATIONAL ASA

Risk: European Natural Gas Cost Exposure

Yara's European ammonia and nitrate production is heavily exposed to natural gas price volatility, since gas is the primary feedstock, and European gas prices have historically run well above North American levels during periods of market stress. Competitors with access to cheaper feedstock gas argue this creates a persistent cost disadvantage Yara must continuously manage through hedging and supply diversification.
CF INDUSTRIES HOLDINGS, INC.

Moat: Low-Cost Gas Feedstock Access

CF Industries benefits from access to abundant, comparatively low-cost North American natural gas feedstock, giving it a durable production cost advantage over European competitors reliant on higher-priced imported gas during periods of market volatility. This cost position lets CF Industries compete aggressively on price even in export markets far from its domestic production base.
CF INDUSTRIES HOLDINGS, INC.

Risk: Limited Direct CAN Portfolio Depth

CF Industries' portfolio skews toward UAN and ammonia rather than CAN specifically, meaning its direct CAN market share and agronomic relationships trail European specialists who have built CAN-specific distribution networks over decades of dedicated regional investment. Competitors with deeper CAN-specific technical and commercial infrastructure argue this limits CF Industries' ability to capture the coated formulation premium segment fully.

Key Players

Yara International ASA
CF Industries Holdings, Inc.
Grupa Azoty S.A.
OCI N.V.
EuroChem Group AG

Others

Nutrien Ltd.
K+S Aktiengesellschaft
SKW Stickstoffwerke Piesteritz GmbH
Lovochemie, a.s.
Fertiberia S.A.
Uralchem JSC
Acron Group
BASF SE
Sasol Limited
Omnia Holdings Limited
Kemira Oyj
AB Achema
ICL Group Ltd.
Borealis AG
GrowHow UK Limited

Recent Developments

MAY 2025

Yara Launches Nitrification-Inhibitor-Coated CAN Product Line

Yara launched a new nitrification-inhibitor-coated calcium ammonium nitrate product line specifically designed to help European farmers meet tightening nutrient efficiency requirements under the EU's Green Deal agricultural framework, featuring documented nitrogen loss reduction data intended to support both agronomic decision-making and regulatory subsidy compliance conversations.
Signal: Signals established producers racing to capture regulatory-driven premium pricing before smaller competitors develop comparable coating technology.
OCTOBER 2025

OCI Signs Multi-Year CAN Supply Agreement With European Farm Cooperative

OCI signed a multi-year supply agreement with a major European farm cooperative to provide calcium ammonium nitrate across the cooperative's member farms, securing predictable volume commitments while guaranteeing members stable pricing during a period of continued natural gas market volatility affecting the broader agricultural industry.
Signal: Shows both producers and farm cooperatives prioritizing supply and pricing stability over transactional spot purchasing today.
DECEMBER 2025

Grupa Azoty Acquires Regional Eastern European CAN Blending Facility

Grupa Azoty acquired a regional Eastern European CAN blending and distribution facility, expanding its production and logistics footprint closer to growing regional demand as EU nutrient efficiency regulation increasingly extends into Eastern European agricultural markets following the bloc's broader regulatory framework and enforcement timeline now underway.
Signal: Extends Grupa Azoty's Eastern European footprint precisely as EU regulatory alignment begins reaching newer member states.

Natural Gas Feedstock Sourcing and Price Risk

Natural gas, consumed as both energy source and chemical feedstock in ammonia synthesis, accounts for an estimated 62 percent of production cost for calcium ammonium nitrate, with the remainder split between raw materials, coating technology, and labor. Gas supply concentrates among a small number of major pipeline and LNG providers, exposing European producers to global gas price cycles beyond their direct control.
European natural gas prices spiked dramatically in 2022 following the disruption of Russian pipeline gas supply after the invasion of Ukraine, according to IEA gas market reporting, pushing some ammonia facilities to curtail output temporarily as costs exceeded the price of importing finished product instead. Producers without long-term gas agreements or diversified sourcing absorbed the spike directly into thinning margins, while larger producers with hedging capability and North American or Middle Eastern gas access maintained more stable economics.

Exposure varies by player type: European producers reliant on imported gas faced steeper cost exposure during the 2022 crisis than North American producers with abundant, low-cost domestic shale gas reserves. Exposure also differs within Europe, since producers with longer-term contracts negotiated before the crisis weathered the disruption considerably better than those exposed to spot pricing.
calcium-ammonium-nitrate-market-cost-volatility-analysis-1787300724824

Long-Term Gas Supply Contracts With Suppliers

Larger producers are signing multi-year natural gas supply agreements directly with pipeline operators and LNG suppliers, securing more predictable feedstock pricing even during periods of broader market volatility. This requires substantial creditworthiness and negotiating scale that smaller regional blenders often cannot match, given their comparatively limited purchasing volume and balance sheet capacity relative to larger integrated producers.

Geographic Production Diversification Toward Lower-Cost Gas

Several European producers are diversifying production capacity toward lower-cost gas regions, including direct investment in North American or Middle Eastern ammonia production, reducing overall exposure to European gas price volatility. This requires substantial capital investment and takes years to materially shift a producer's cost structure, but has become an increasingly common strategic response following the 2022 crisis.

Ammonia Import Substitution During Price Spikes

Some European producers now maintain flexibility to import finished ammonia rather than producing it domestically when gas prices make domestic synthesis uneconomical, effectively arbitraging between production and import on real-time cost comparison. This requires import infrastructure investment but has proven valuable during recent volatility, letting producers maintain supply without absorbing the full cost of uneconomical production.

Portfolio Architecture for Margin Defence

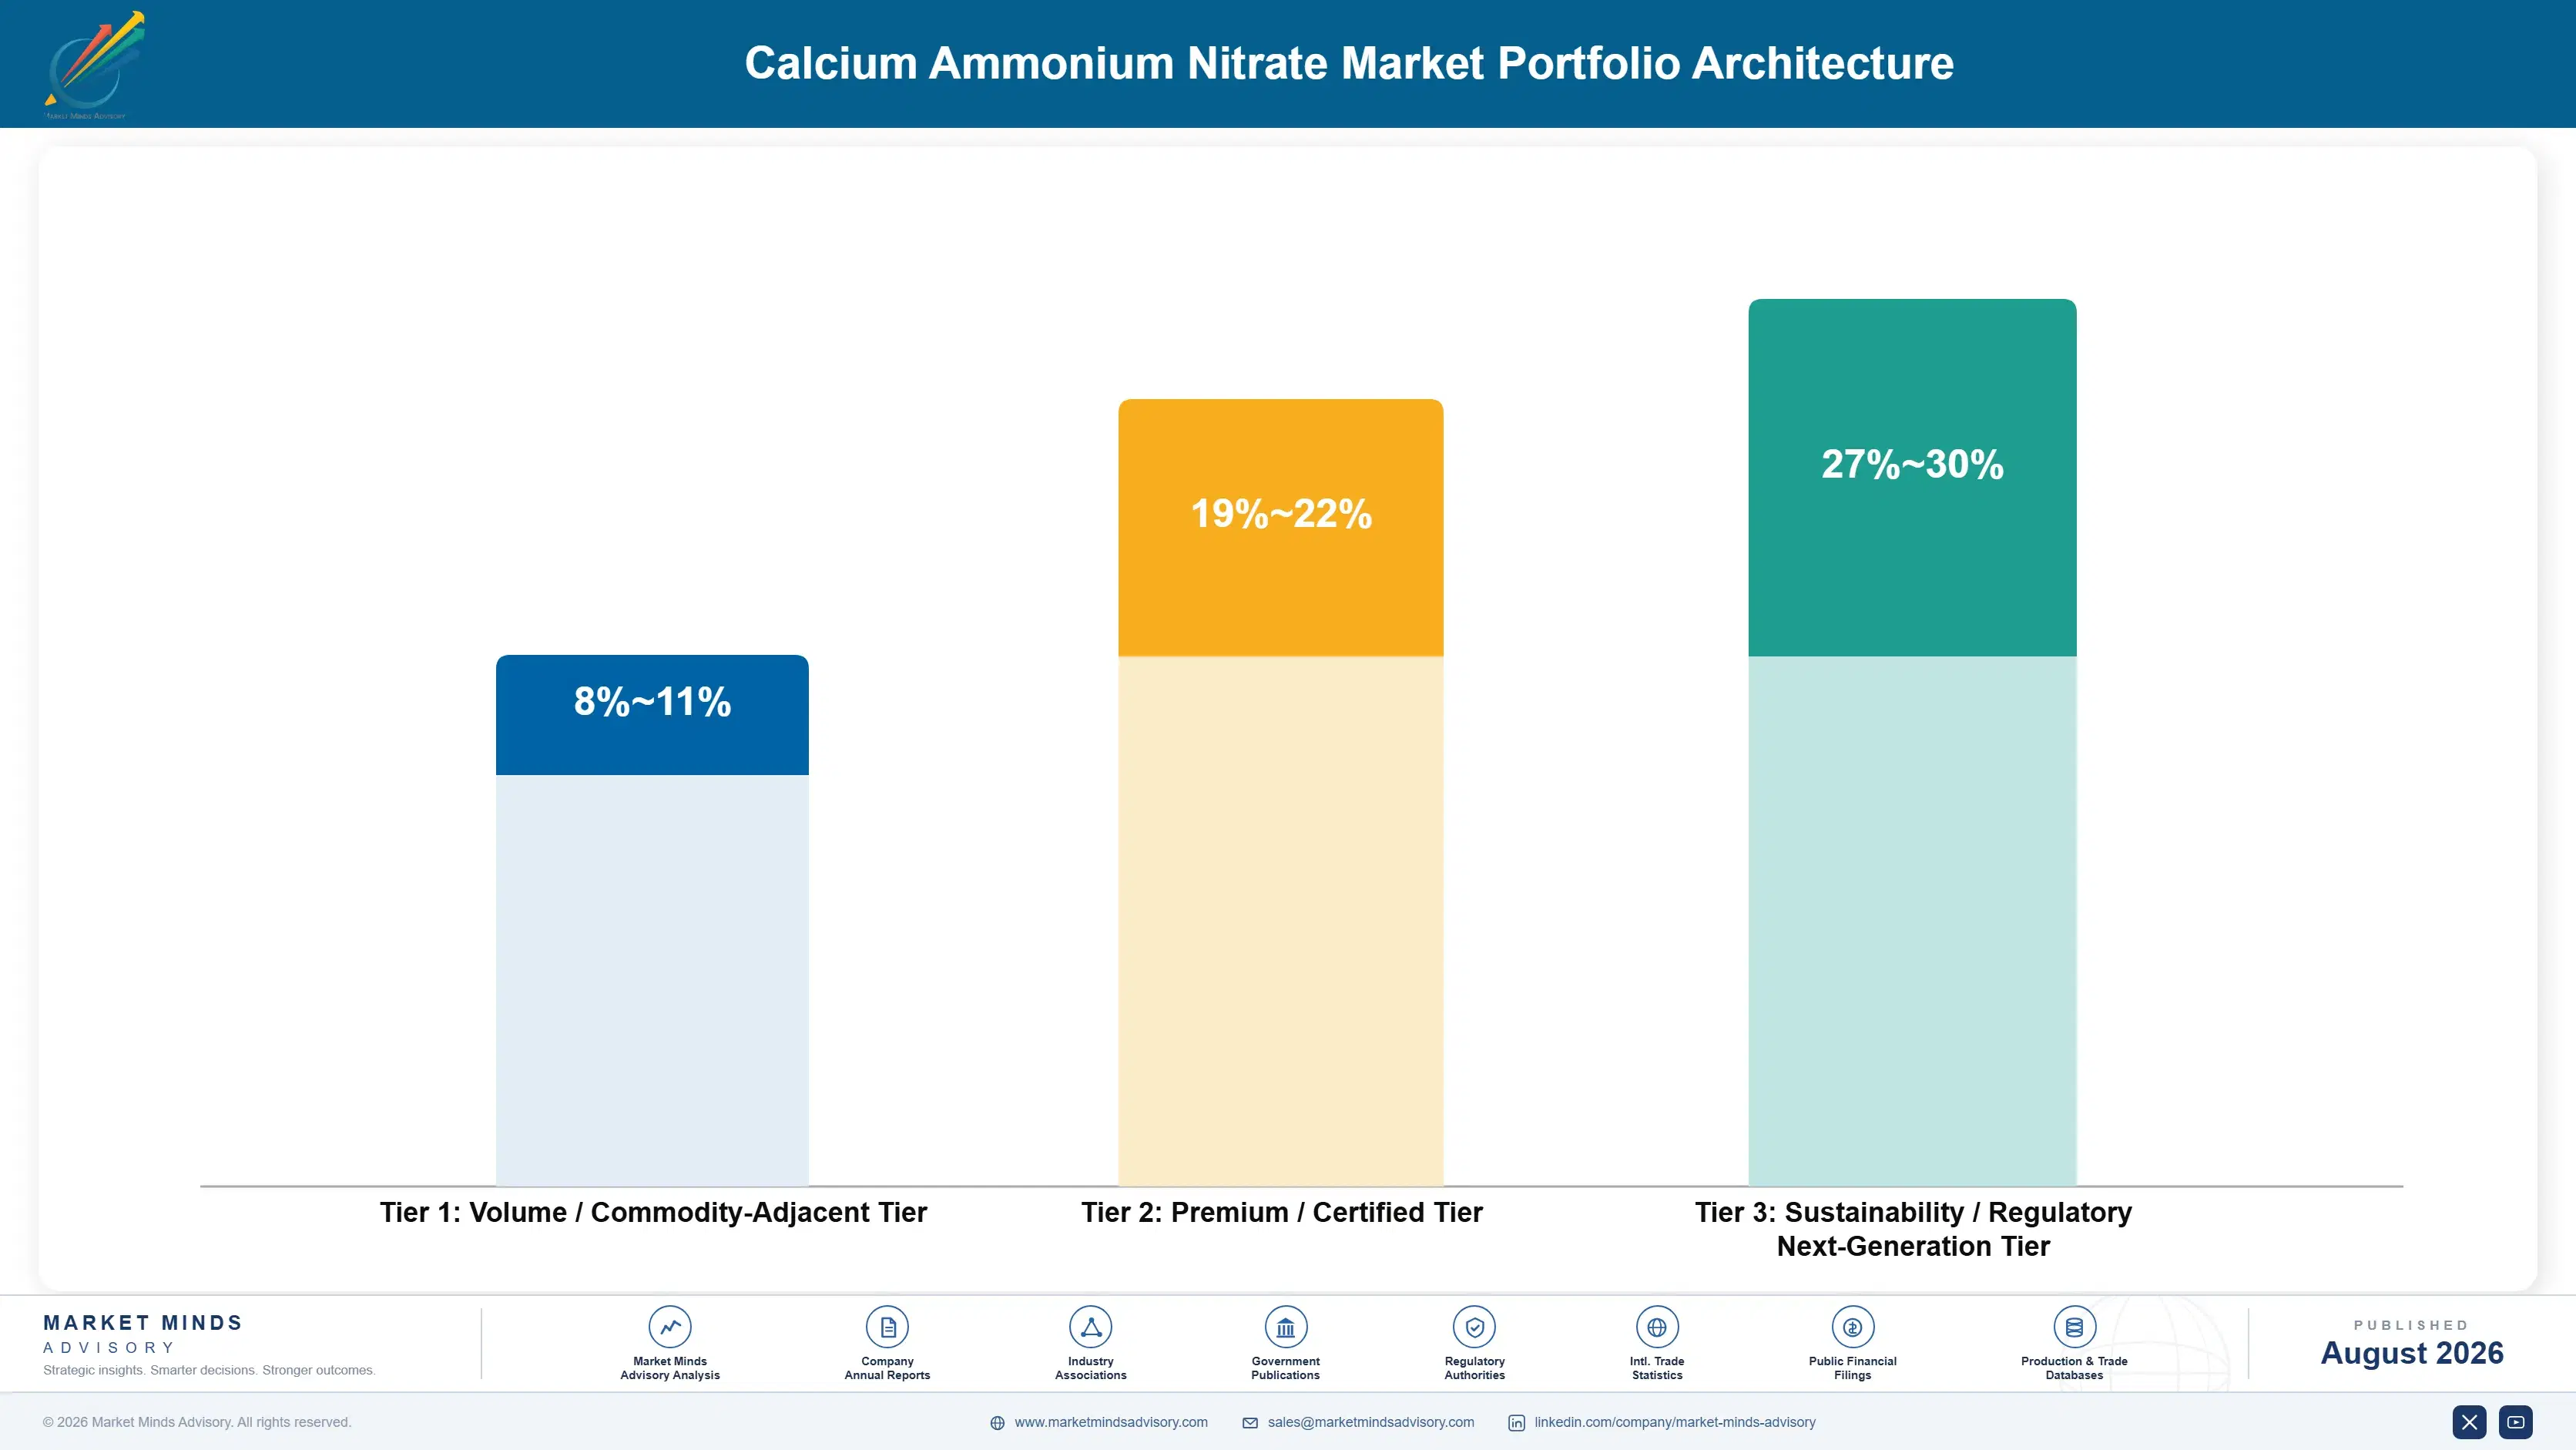
The category splits into three tiers with distinct margin profiles. Commodity standard granular and prilled CAN, sold on price into established agricultural markets, generates the thinnest margins despite representing the bulk of total volume. Premium coated and stabilized formulations command materially better margins tied to nitrification inhibitor technology and documented regulatory compliance value rather than nitrogen content alone. The sustainability and next-generation tier, covering mic
Volume and premium tiers pull producers toward different investments. Commodity volume rewards integrated ammonia scale and low-cost gas access, favoring large diversified producers who spread fixed costs across enormous production volumes. Premium and next-generation tiers reward sustained investment in coating technology and agronomic advisory infrastructure, favoring producers willing to commit years to building the compliance credibility and farmer relationships these products require.

High-value pools concentrate in coated and micronutrient-fortified formulations purchased by farmers under direct regulatory compliance pressure, where formulation technology, not production cost, increasingly sets pricing power. Producers positioned in these segments capture disproportionate margin relative to volume share, a pattern MMA expects to persist while EU nutrient efficiency regulation continues tightening across the bloc's policy framework.

Volume / Commodity-Adjacent Tier

Standard granular and prilled CAN sold largely on price into established agricultural markets where regulatory nutrient efficiency requirements do not yet create a meaningful premium for coated alternatives over standard product.
Gross Margin: 8-11%

Premium / Certified Tier

Nitrification-inhibitor-coated and stabilized CAN formulations sold into regulated nitrate-vulnerable zones and other markets requiring documented nutrient efficiency compliance for agricultural subsidy eligibility under current and evolving EU regulatory rules and enforcement.
Gross Margin: 19-22%

Sustainability / Regulatory / Next-Generation Tier

Micronutrient-fortified blends and precision agriculture-oriented CAN products developed for farmers pursuing soil health optimization beyond standard nitrogen application requirements alone across their entire farming operations and crop rotations each season.
Gross Margin: 27-30%
calcium-ammonium-nitrate-market-portfolio-architecture-1787300725328

High-value Sub-segments and Strategic Watch-out

Coated and Stabilized CAN Formulations

Coated formulations command the category's highest margins as EU nutrient efficiency regulation increasingly rewards documented nitrogen loss reduction over standard granular product. Supplier base remains comparatively limited today given the coating technology investment required, but regulatory tailwinds are driving the steepest percentage growth of any segment MMA tracks.
Gross Margin: 20-23%

Micronutrient-Fortified CAN Blends

Micronutrient-fortified blends carry strong, improving margins tied to precision agriculture adoption rather than scarcity alone, growing steadily as soil testing increasingly reveals specific nutrient deficiencies across intensively farmed regions. Growth is more moderate than coated formulations since the supplier base here is comparatively less constrained today.
Gross Margin: 24-27%

Standard Granular CAN

This segment anchors category volume across established European and North American agricultural markets, delivering thin but dependable margins on high, recurring seasonal order volumes tied to annual planting and fertilization cycles nationwide. Growth tracks broader agricultural nitrogen demand rather than any single regulatory catalyst specifically.
Gross Margin: 8-11%

Gas-Exposed Non-Integrated Blenders

Blenders without integrated ammonia production or long-term gas supply agreements face repeated margin compression whenever natural gas prices spike, a vulnerability that intensified sharply during the 2022 European energy crisis and has not fully eased since across most affected European markets today even now, years later.
Gross Margin: 3-6%

Regulatory-Anchored Seasonal Purchasing Cycles

Once a farmer establishes a nitrogen program built around calcium ammonium nitrate, particularly within a regulatory framework requiring documented nutrient planning, the relationship typically continues across many seasons, since switching sources requires reworking established timing and compliance records farmers rarely revisit without a compelling reason. This gives producers who win the initial relationship durable revenue difficult for competitors to dislodge without a genuine price or com
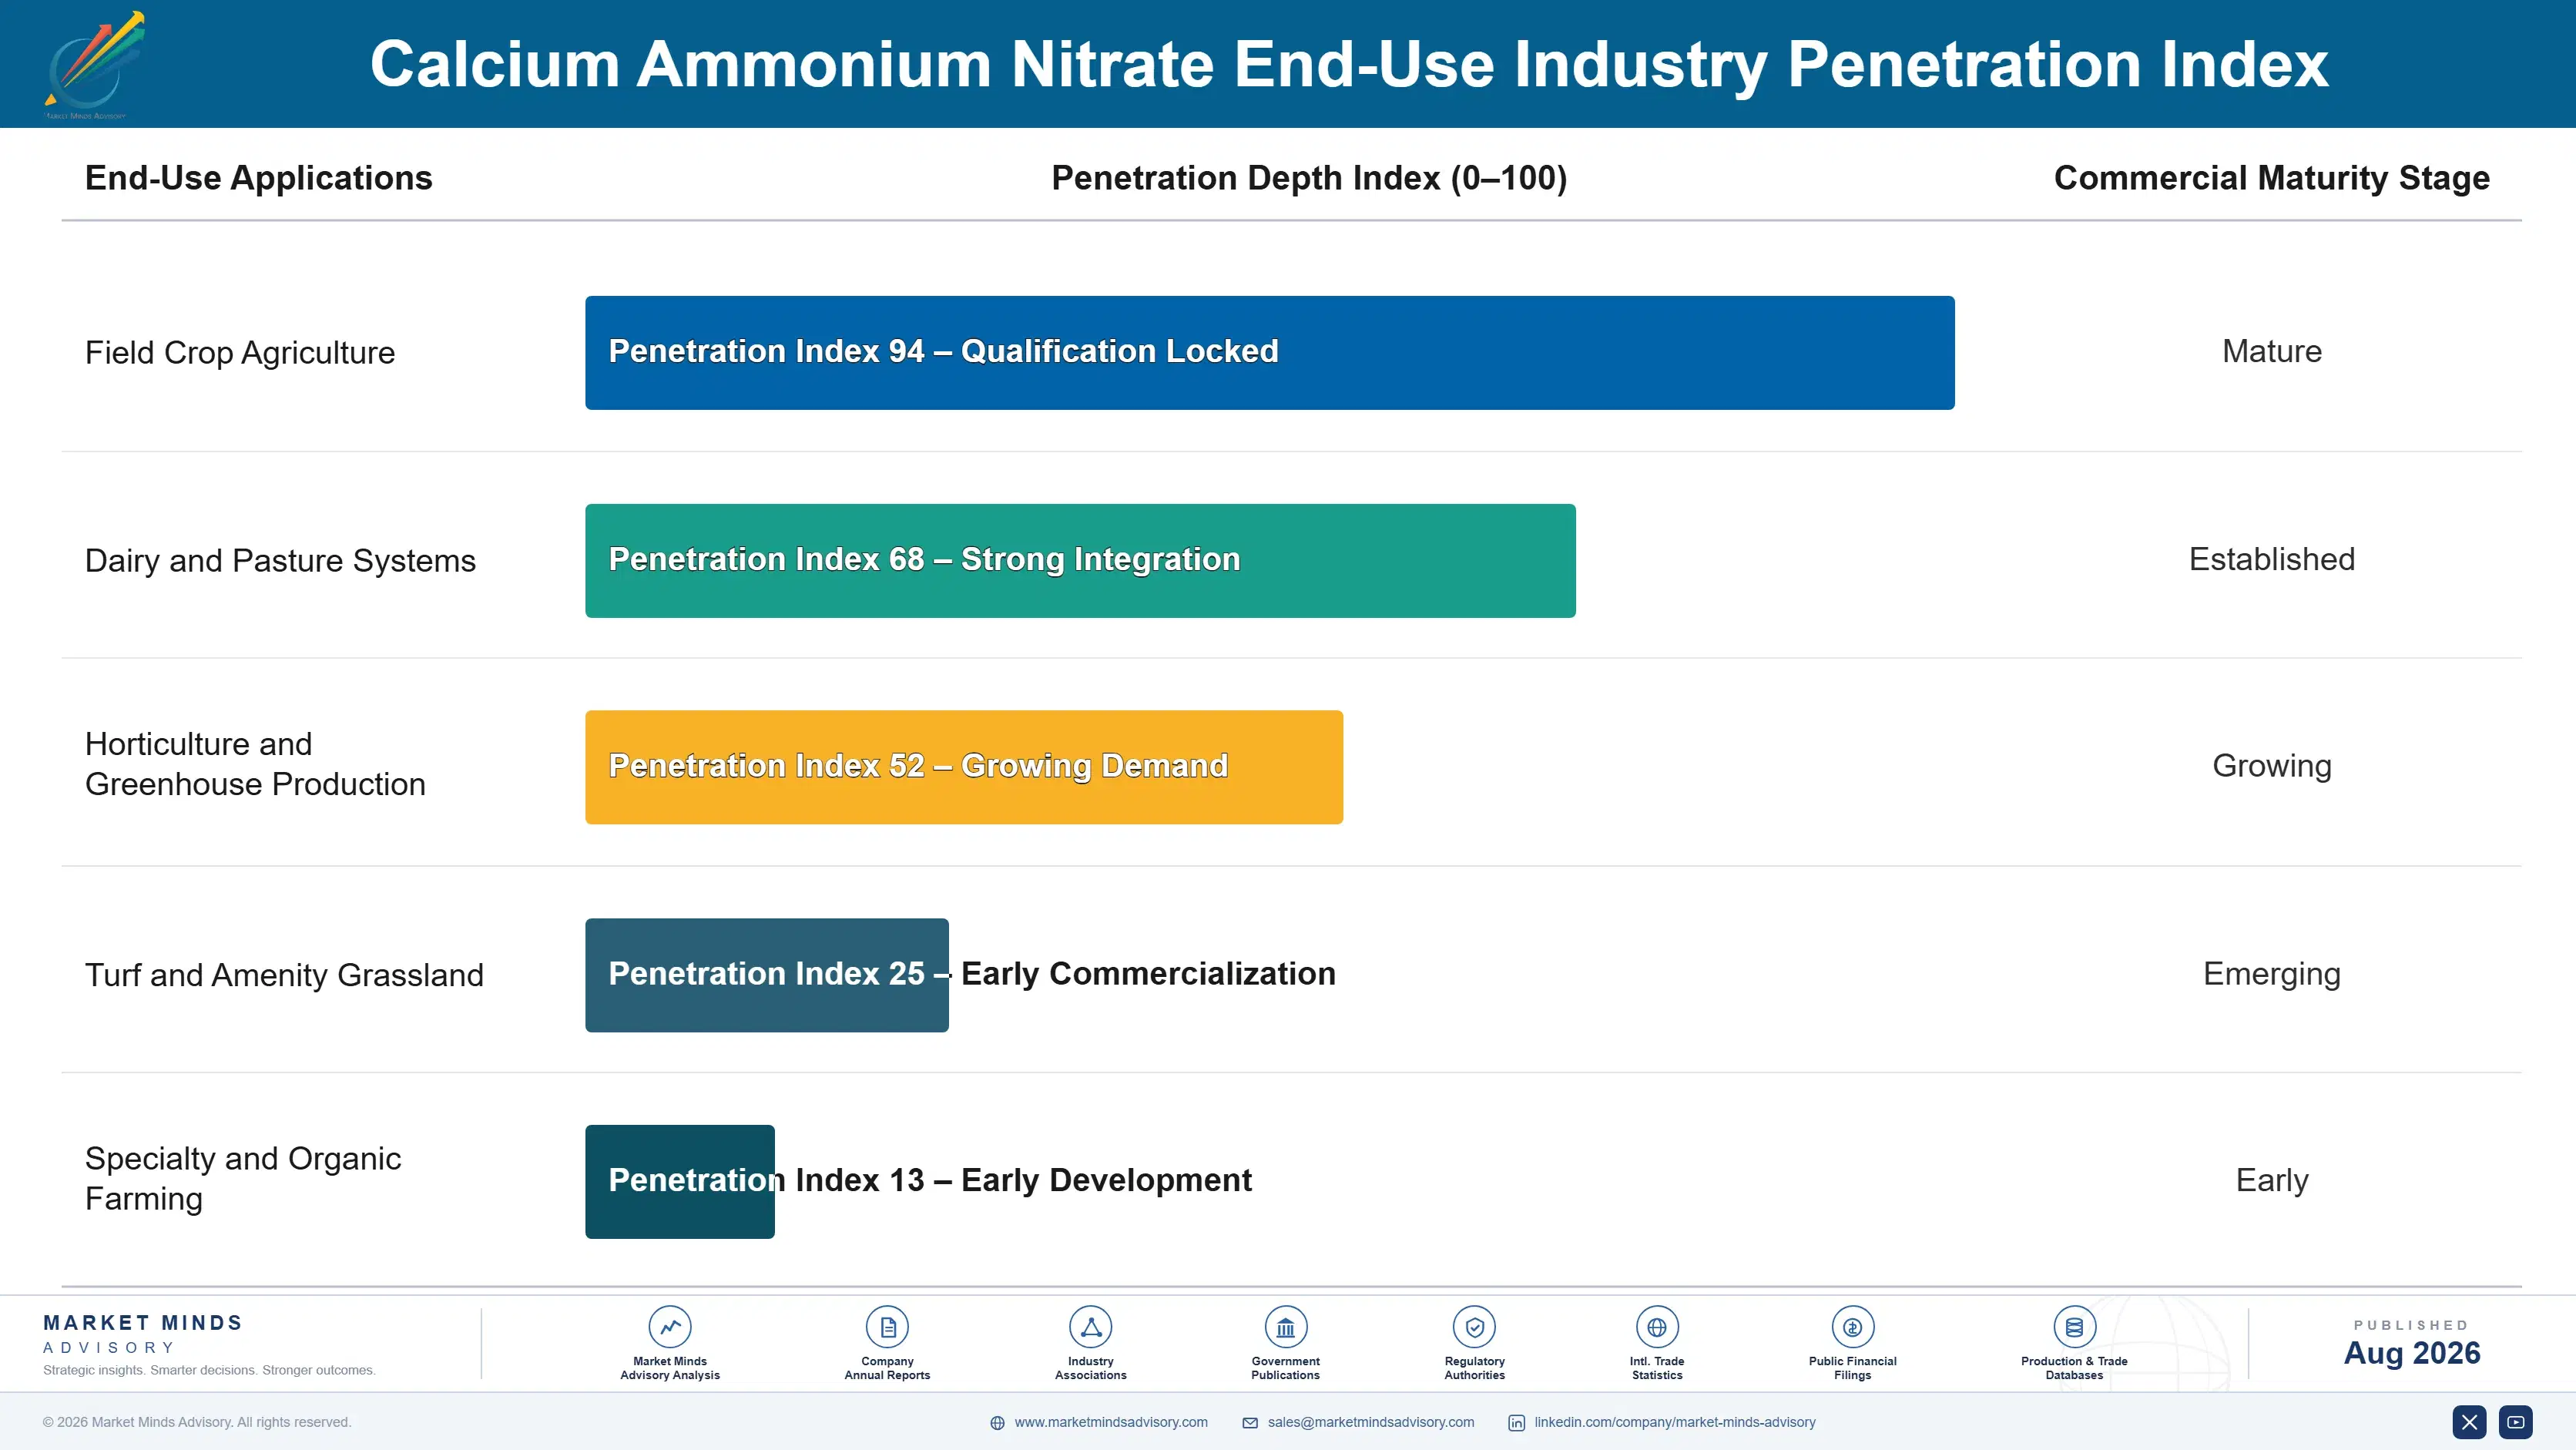
Adoption depth varies by end-use vertical. Intensive dairy and horticultural operations in nitrate-vulnerable zones have moved fastest toward coated CAN, since their concentrated application and direct regulatory scrutiny make documented efficiency compliance most consequential. Extensive field crop operations outside regulated zones adopt more selectively, often continuing standard granular CAN or urea where regulatory pressure remains limited and cost per unit of nitrogen matters more than efficiency credentials.

Buyer profiles are shifting generationally as younger farmers, increasingly trained in precision agriculture and digital soil tools, treat nutrient source selection as a data-driven decision rather than following practices their parents used by habit. This opens real doors for producers who can demonstrate strong agronomic data and documented compliance value, even against incumbents with deep legacy relationships that carry comparatively less weight with this newer generation.
calcium-ammonium-nitrate-market-end-use-penetration-index-1787300725820

Where Regulatory Compliance Creates Value

These are among the four positions where our research anticipates prominent divergence between winners and laggards over the coming forecast period. Each is grounded in the demand model, the regulatory perimeter, and the announced capacity pipeline.
01 / COATED FORMULATION INVESTMENT

Build coating technology before regulation makes it mandatory

EU nutrient efficiency regulation is converting from a voluntary agronomic preference into an increasingly hard compliance requirement across nitrate-vulnerable zones covering much of Europe's most intensively farmed cropland, and producers without credible coated formulation technology risk losing share as requirements tighten further. Yara currently holds the deepest coated formulation technology and field validation data, drawing on years of nitrification inhibitor research newer entrants cannot easily replicate on short notice. MMA expects producers who delay this investment now to find themselves locked out of the fastest-growing, highest-margin segment of this category.
02 / GAS SUPPLY SECURITY

Secure long-term gas contracts before the next price spike

Natural gas price volatility since the 2022 European energy crisis has repeatedly compressed margins for producers without long-term supply agreements or diversified feedstock sourcing already in place before each price spike began. Producers with dedicated gas procurement capability weathered the disruption considerably better than smaller specialists forced to buy feedstock on short-term contracts at the worst possible moments during the crisis. MMA expects the margin gap between gas-secured and gas-exposed producers to widen further as gas markets remain exposed to ongoing geopolitical disruption risk.
03 / NITRATE-VULNERABLE ZONE TARGETING

Prioritize regulated zones where CAN's advantage is most valuable

Farmers operating within officially designated nitrate-vulnerable zones face direct regulatory pressure to document nitrogen source selection, making CAN's lower leaching profile a genuine compliance asset rather than simply an agronomic preference in these specific, well-defined geographic areas. Producers who concentrate commercial and agronomic support resources on these regulated zones capture disproportionate value relative to producers spreading effort evenly across regulated and unregulated markets alike. MMA views nitrate-vulnerable zone targeting as a more efficient growth strategy than broad-based market expansion for producers with limited commercial resources to deploy.
04 / GAS-EXPOSED PORTFOLIO RISK

Diversify feedstock exposure before the next European gas crisis

The 2022 European energy crisis demonstrated how quickly natural gas price volatility can turn a profitable ammonia facility into a temporarily uneconomical one, a risk that remains real given Europe's continued dependence on imported gas rather than domestic sources. Producers who diversified production toward lower-cost gas regions or secured long-term supply agreements are meaningfully better positioned to weather the next disruption than those still concentrated in spot-exposed production. MMA expects diversification to remain a defining strategic priority for European producers through at least the decade's end.

Engagement Snapshot From the Field

A live engagement with an industry participant carrying material or product regulatory and market exposure ahead of a defining policy shift, showing how our research translates into a defensible multi-year portfolio strategy.
MARKET MINDS ADVISORY · CLIENT ENGAGEMENT SUMMARY
Calcium Ammonium Nitrate Producer Strategic Portfolio Review and Transition Roadmap 2026·Investment Scenario on Calcium Ammonium Nitrate Exposure Evaluation 2025-26
CLIENT PROFILE
The client is a farm cooperative representing several hundred member farms across a nitrate-vulnerable region of northern Europe, with combined annual fertilizer procurement spending in the tens of millions of dollars (client-reported, unverified by MMA). The cooperative had historically allowed individual member farms to select their own nitrogen fertilization approach, resulting in inconsistent regulatory compliance documentation and missed opportunities for bulk purchasing pricing advantages.
STRATEGIC CHALLENGE
Facing tightening nitrate leaching regulation that increasingly ties agricultural subsidy eligibility to documented nutrient efficiency, the cooperative needed to evaluate whether standardizing member farms onto coated CAN formulations would deliver sufficient compliance and cost benefits to justify the transition from the fragmented, farm-by-farm purchasing approach the cooperative had used for decades.
MMA APPROACH
MMA conducted a comparative analysis across three CAN suppliers, benchmarking coated formulation nitrogen efficiency data, bulk pricing under consolidated cooperative purchasing volume, and agronomic advisory support quality. The engagement produced a phased standardization roadmap sequencing member farms by nitrate-vulnerable zone designation, prioritizing farms facing the most immediate regulatory compliance deadlines first before extending to less urgently affected members.
KEY FINDINGS
  1. Consolidated cooperative purchasing volume across all member farms would deliver meaningful pricing improvement compared to the current fragmented, farm-by-farm purchasing approach previously used.
  2. Coated formulation adoption on nitrate-vulnerable zone farms delivered documented nitrogen efficiency improvements sufficient to support continued full agricultural subsidy eligibility under current requirements.
  3. Bulk purchasing agreements with a single primary supplier generated meaningfully better pricing than the cooperative's previous approach of allowing each member farm to purchase independently.
  4. Sequencing standardization by regulatory deadline urgency allowed the cooperative to prioritize compliance-critical farms before extending the program to less urgently affected members.
CLIENT PROFILE
The client is a farm cooperative representing several hundred member farms across a nitrate-vulnerable region of northern Europe, with combined annual fertilizer procurement spending in the tens of millions of dollars (client-reported, unverified by MMA). The cooperative had historically allowed individual member farms to select their own nitrogen fertilization approach, resulting in inconsistent regulatory compliance documentation and missed opportunities for bulk purchasing pricing advantages.
STRATEGIC CHALLENGE
Facing tightening nitrate leaching regulation that increasingly ties agricultural subsidy eligibility to documented nutrient efficiency, the cooperative needed to evaluate whether standardizing member farms onto coated CAN formulations would deliver sufficient compliance and cost benefits to justify the transition from the fragmented, farm-by-farm purchasing approach the cooperative had used for decades.
MMA APPROACH
MMA conducted a comparative analysis across three CAN suppliers, benchmarking coated formulation nitrogen efficiency data, bulk pricing under consolidated cooperative purchasing volume, and agronomic advisory support quality. The engagement produced a phased standardization roadmap sequencing member farms by nitrate-vulnerable zone designation, prioritizing farms facing the most immediate regulatory compliance deadlines first before extending to less urgently affected members.
KEY FINDINGS
  1. Consolidated cooperative purchasing volume across all member farms would deliver meaningful pricing improvement compared to the current fragmented, farm-by-farm purchasing approach previously used.
  2. Coated formulation adoption on nitrate-vulnerable zone farms delivered documented nitrogen efficiency improvements sufficient to support continued full agricultural subsidy eligibility under current requirements.
  3. Bulk purchasing agreements with a single primary supplier generated meaningfully better pricing than the cooperative's previous approach of allowing each member farm to purchase independently.
  4. Sequencing standardization by regulatory deadline urgency allowed the cooperative to prioritize compliance-critical farms before extending the program to less urgently affected members.
RECOMMENDED STRATEGY
Phase 1: Phase 1 (Months 1-2): Benchmark three CAN suppliers on coated formulation efficiency data, consolidated bulk pricing, and agronomic advisory support quality available. Phase 2: Phase 2 (Months 3-8): Standardize nitrate-vulnerable zone member farms onto coated CAN formulations first, prioritizing farms facing the nearest compliance deadlines. Phase 3: Phase 3 (Months 9-12): Extend standardization across all remaining member farms, finalizing consolidated purchasing agreements and compliance documentation cooperative-wide for every farm.
OUTCOME
The cooperative completed standardization across its nitrate-vulnerable zone member farms within eight months, ahead of the relevant regulatory compliance deadline (client-reported, unverified by MMA). Consolidated purchasing reportedly delivered meaningful cost savings compared to the cooperative's prior fragmented approach, while member farms maintained full agricultural subsidy eligibility under the new documentation standard (client-reported, unverified by MMA).

Frequently Asked Questions

Foundational context covering the market sizes, CAGR, scope, country, region and competition that inform every finding below. This section is provided to cover basics and most often pre-purchase conversations, answered from the MMA Primary Research Dataset.

What is the current size of the Calcium Ammonium Nitrate Market?

The global calcium ammonium nitrate market is valued at $11.2 billion in 2025. It is forecast to reach $11.67 billion in 2026 as regulatory-driven demand continues.

How large will the Calcium Ammonium Nitrate Market be by 2036?

MMA forecasts the market will reach $17.61 billion by 2036, roughly 1.5 times its 2026 value. Coated formulation adoption and Asian demand growth both contribute to that expansion.

What is the CAGR for the Calcium Ammonium Nitrate Market 2026 to 2036?

The base case CAGR is 4.2 percent across the 2026 to 2036 forecast period. Bull and bear scenarios range from 3.2 to 5.2 percent depending on gas prices.

Which segment is growing fastest?

Coated and stabilized CAN formulations are growing fastest at a 6.8 percent CAGR, well ahead of standard granular product. That is roughly 1.62 times the overall market growth rate.

Who are the major companies in the Calcium Ammonium Nitrate Market?

Leading producers include Yara, CF Industries, Grupa Azoty, OCI, and EuroChem, spanning both European and North American production. Together they hold an estimated 34 percent of a moderately fragmented global market.

Which country is growing fastest?

Australia is the fastest-growing major market, expanding at an estimated 6.6 percent CAGR. Growth is driven by water quality regulation in dairy and horticultural regions.

Report Segmentation Architecture

The full report scope spans multiple orthogonal segmentation dimensions, with cross-tabulated demand data provided for each dimension pair. Coverage extends further to regional breakdowns, trend trajectories, and the competitive detail needed to support segment-level decision-making.

By Product Form and Formulation Technology

  • Standard Granular CAN
  • Coated and Stabilized CAN
  • Prilled CAN
  • Liquid CAN Solutions
  • Micronutrient-Fortified CAN Blends
  • Bulk and Blended CAN

By End-Use Industry

  • Field Crop Agriculture
  • Dairy and Pasture Systems
  • Horticulture and Greenhouse Production
  • Turf and Amenity Grassland
  • Specialty and Organic Farming

By Commercial Dimension

  • Direct Farm Cooperative Contracts
  • Agricultural Distributor Channels
  • Bulk Blender Supply Agreements
  • Government and Subsidized Programs

By Region

  • North America
  • Western Europe
  • East Asia
  • South Asia and Pacific
  • Latin America
  • Middle East and Africa
  • Eastern Europe

Scope, Methodology, and Coverage

Every figure in this report is reproducible from documented input assumptions. The scope below maps the historical period, the forecast horizon, the segmentation dimensions, and the countries covered, alongside the underlying primary and qualitative methodology.
Historical Period
2020 to 2025
Forecast Period
2026 to 2036
Base Year
2025 (USD billions; MMA Primary Research Dataset, August 2026)
Market Definition
This report defines the calcium ammonium nitrate market as granular, prilled, coated, and liquid CAN fertilizer products containing combined nitrate and ammonium nitrogen sold for agricultural and horticultural use. It excludes urea, ammonium sulfate, and other single-form nitrogen fertilizers not formulated as calcium ammonium nitrate.
Quantitative Units
USD billions (current prices); metric tons of product volume where applicable
Segmentation Dimensions
By Product Form and Formulation Technology; By End-Use Industry; By Commercial Dimension; By Region
Regions Covered
North America, Western Europe, East Asia, South Asia and Pacific, Latin America, Middle East and Africa, Eastern Europe
Countries Covered
USA, China, Germany, France, UK, Japan, South Korea, India, Australia, Canada, Brazil, Mexico, Indonesia, Vietnam, Thailand, Malaysia, UAE, Saudi Arabia, South Africa, Nigeria, Turkey, Poland, Netherlands, Italy, Spain, Sweden, Switzerland, Argentina, Colombia, Singapore, and additional markets relevant to this sector
Key Companies Profiled
Yara International ASA, CF Industries Holdings, Inc., Grupa Azoty S.A., OCI N.V., EuroChem Group AG, Nutrien Ltd., K+S Aktiengesellschaft, SKW Stickstoffwerke Piesteritz GmbH, Lovochemie, a.s., Fertiberia S.A., Uralchem JSC, Acron Group, BASF SE, Sasol Limited, Omnia Holdings Limited, Kemira Oyj, AB Achema, ICL Group Ltd., Borealis AG, GrowHow UK Limited
Quantitative Methodology
Primary survey, n=3,800 respondents, Q4 2025, six countries; demand-side model with trade association cross-validation
Qualitative Methodology
47 expert interviews, Q4 2025; applied to validate demand model assumptions, identify emerging dynamics, and assess competitive positioning
Report Format
PDF and XLSX data workbook (Word format preview document)
Publisher
Market Minds Advisory
Report Code
MMA-2026-AGR-107
Published
August 2026
Contact
sales@marketmindsadvisory.com | www.marketmindsadvisory.com

Purchase the full Calcium Ammonium Nitrate Market Report (2026 to 2036).

The full report provides a comprehensive assessment of the global calcium ammonium nitrate market, including detailed sizing and ten-year forecasts across all seven regions and six product form segments. It profiles twenty leading producers, benchmarking integrated ammonia production cost, coated formulation technology, and gas feedstock exposure across the five largest players in particular. The analysis includes primary research drawn from MMA's Q4 2025 survey of 3,800 agricultural and fertilizer distribution respondents across six countries and 47 expert interviews with agronomic and procurement leaders. Regional sections cover regulatory drivers, gas sourcing risk, and competitive dynamics specific to each market, supported by a standalone input cost and mitigation framework.
Ten-year market sizing and growth forecasts
Profiles of twenty leading CAN producers
Regional nutrient efficiency and demand regulation analysis
Natural gas sourcing risk and mitigation framework
Primary survey data from 3,800 industry respondents
Forty-seven expert interviews with agronomic procurement leaders

Built For The People Who Decide

From boardroom strategy to bench-side execution, this report is read cover-to-cover by leaders shaping the next decade of their industry, turning demand scenarios, market dynamics and valuation benchmarks into decisions.
CXOs/ Presidents/ VPs/ Managers
M&A and Corporate Development
Strategy Teams and R&D Heads
Procurement and Product Directors
Regulatory and Compliance Leaders
Investor Relations and Equity Analysts