Market Minds Advisory
Buy Now Pay Later Services Market

Buy Now Pay Later Services Market: A Payments Product Being Regulated As Credit

The shopper pays nothing and the retailer pays about 4.4% of the basket. That works while money is cheap and stops working the moment funding costs anything at all any more.

Lead Analyst

Published

September 2026

Make Smarter Decisions with Customized Research Insights

Request a free sample report and evaluate market opportunities, growth trends, and competitive dynamics relevant to your business needs.

2025 MARKET VALUE$11.6BMarket Size 2025
2036 FORECAST VALUE$40.4BBase Case , 2026 to 2036
CAGR 2026 TO 203612.0 %Bull 13.2% / Bear 10.8%
INCREMENTAL OPPORTUNITY$27.4BNet 10- year value creation
EXPANSION MULTIPLE3.11x2036 value over 2026 base
Strategic Levers
M&A Pipeline
Regional Outlook
Country Rankings
Competitive Intelligence
Segmental Deep-dive
Call-Us : 91 93563 13602

Executive Snapshot and Market Trajectory

The consumer is not the customer here. A six week instalment charges the shopper nothing and the merchant around 4.4% of basket value, which makes this a payment acceptance product that happens to involve lending money. That single distinction explains almost everything else here.
North America carries 31% of revenue and Western Europe 26%, with South Asia and Pacific at 17% above its usual band because Australia originated the model and Southeast Asian volumes keep climbing. Longer tenor interest-bearing instalments grow at 18.0%, half again the market rate of 12.0%, because that is the only structure where the borrower actually pays anything toward the funding cost. Everybody else is simply running an acquisition funnel on borrowed money.
Concentration reaches 58% and every major jurisdiction is now reclassifying these arrangements as consumer credit. Interpretive rules, statutory regimes and directive transposition arrived within roughly eighteen months of one another, bringing affordability assessment and disclosure to a product designed around having neither. Every question asked at a checkout reduces the completion rate that justified the merchant fee, which is the argument the whole proposition was originally built on.
Market Definition
The market covers revenue earned by buy now pay later providers, spanning longer tenor interest-bearing instalments, business-to-business deferred payment, merchant-subsidised zero interest longer terms, in-store and card-linked instalments, virtual card and anywhere instalments, and pay-in-four short tenor instalments. Revenue comprises merchant discount fees, consumer interest, late and account fees, and interchange on virtual cards. General-purpose credit cards, store cards, unsecured personal loans, motor and mortgage finance, and merchant acquiring unconnected to instalment offers are excluded.
Base Year Value
$11.6B in 2025 (MMA Primary Research Dataset, August 2026)
Forecast Period
2026 to 2036, eleven discrete annual values
CAGR
12.0% base case. Bull 13.2%. Bear 10.8%.
Fastest Growth Segment
Longer Tenor Interest-Bearing Instalments: 18.0% CAGR
Fastest Growth Country
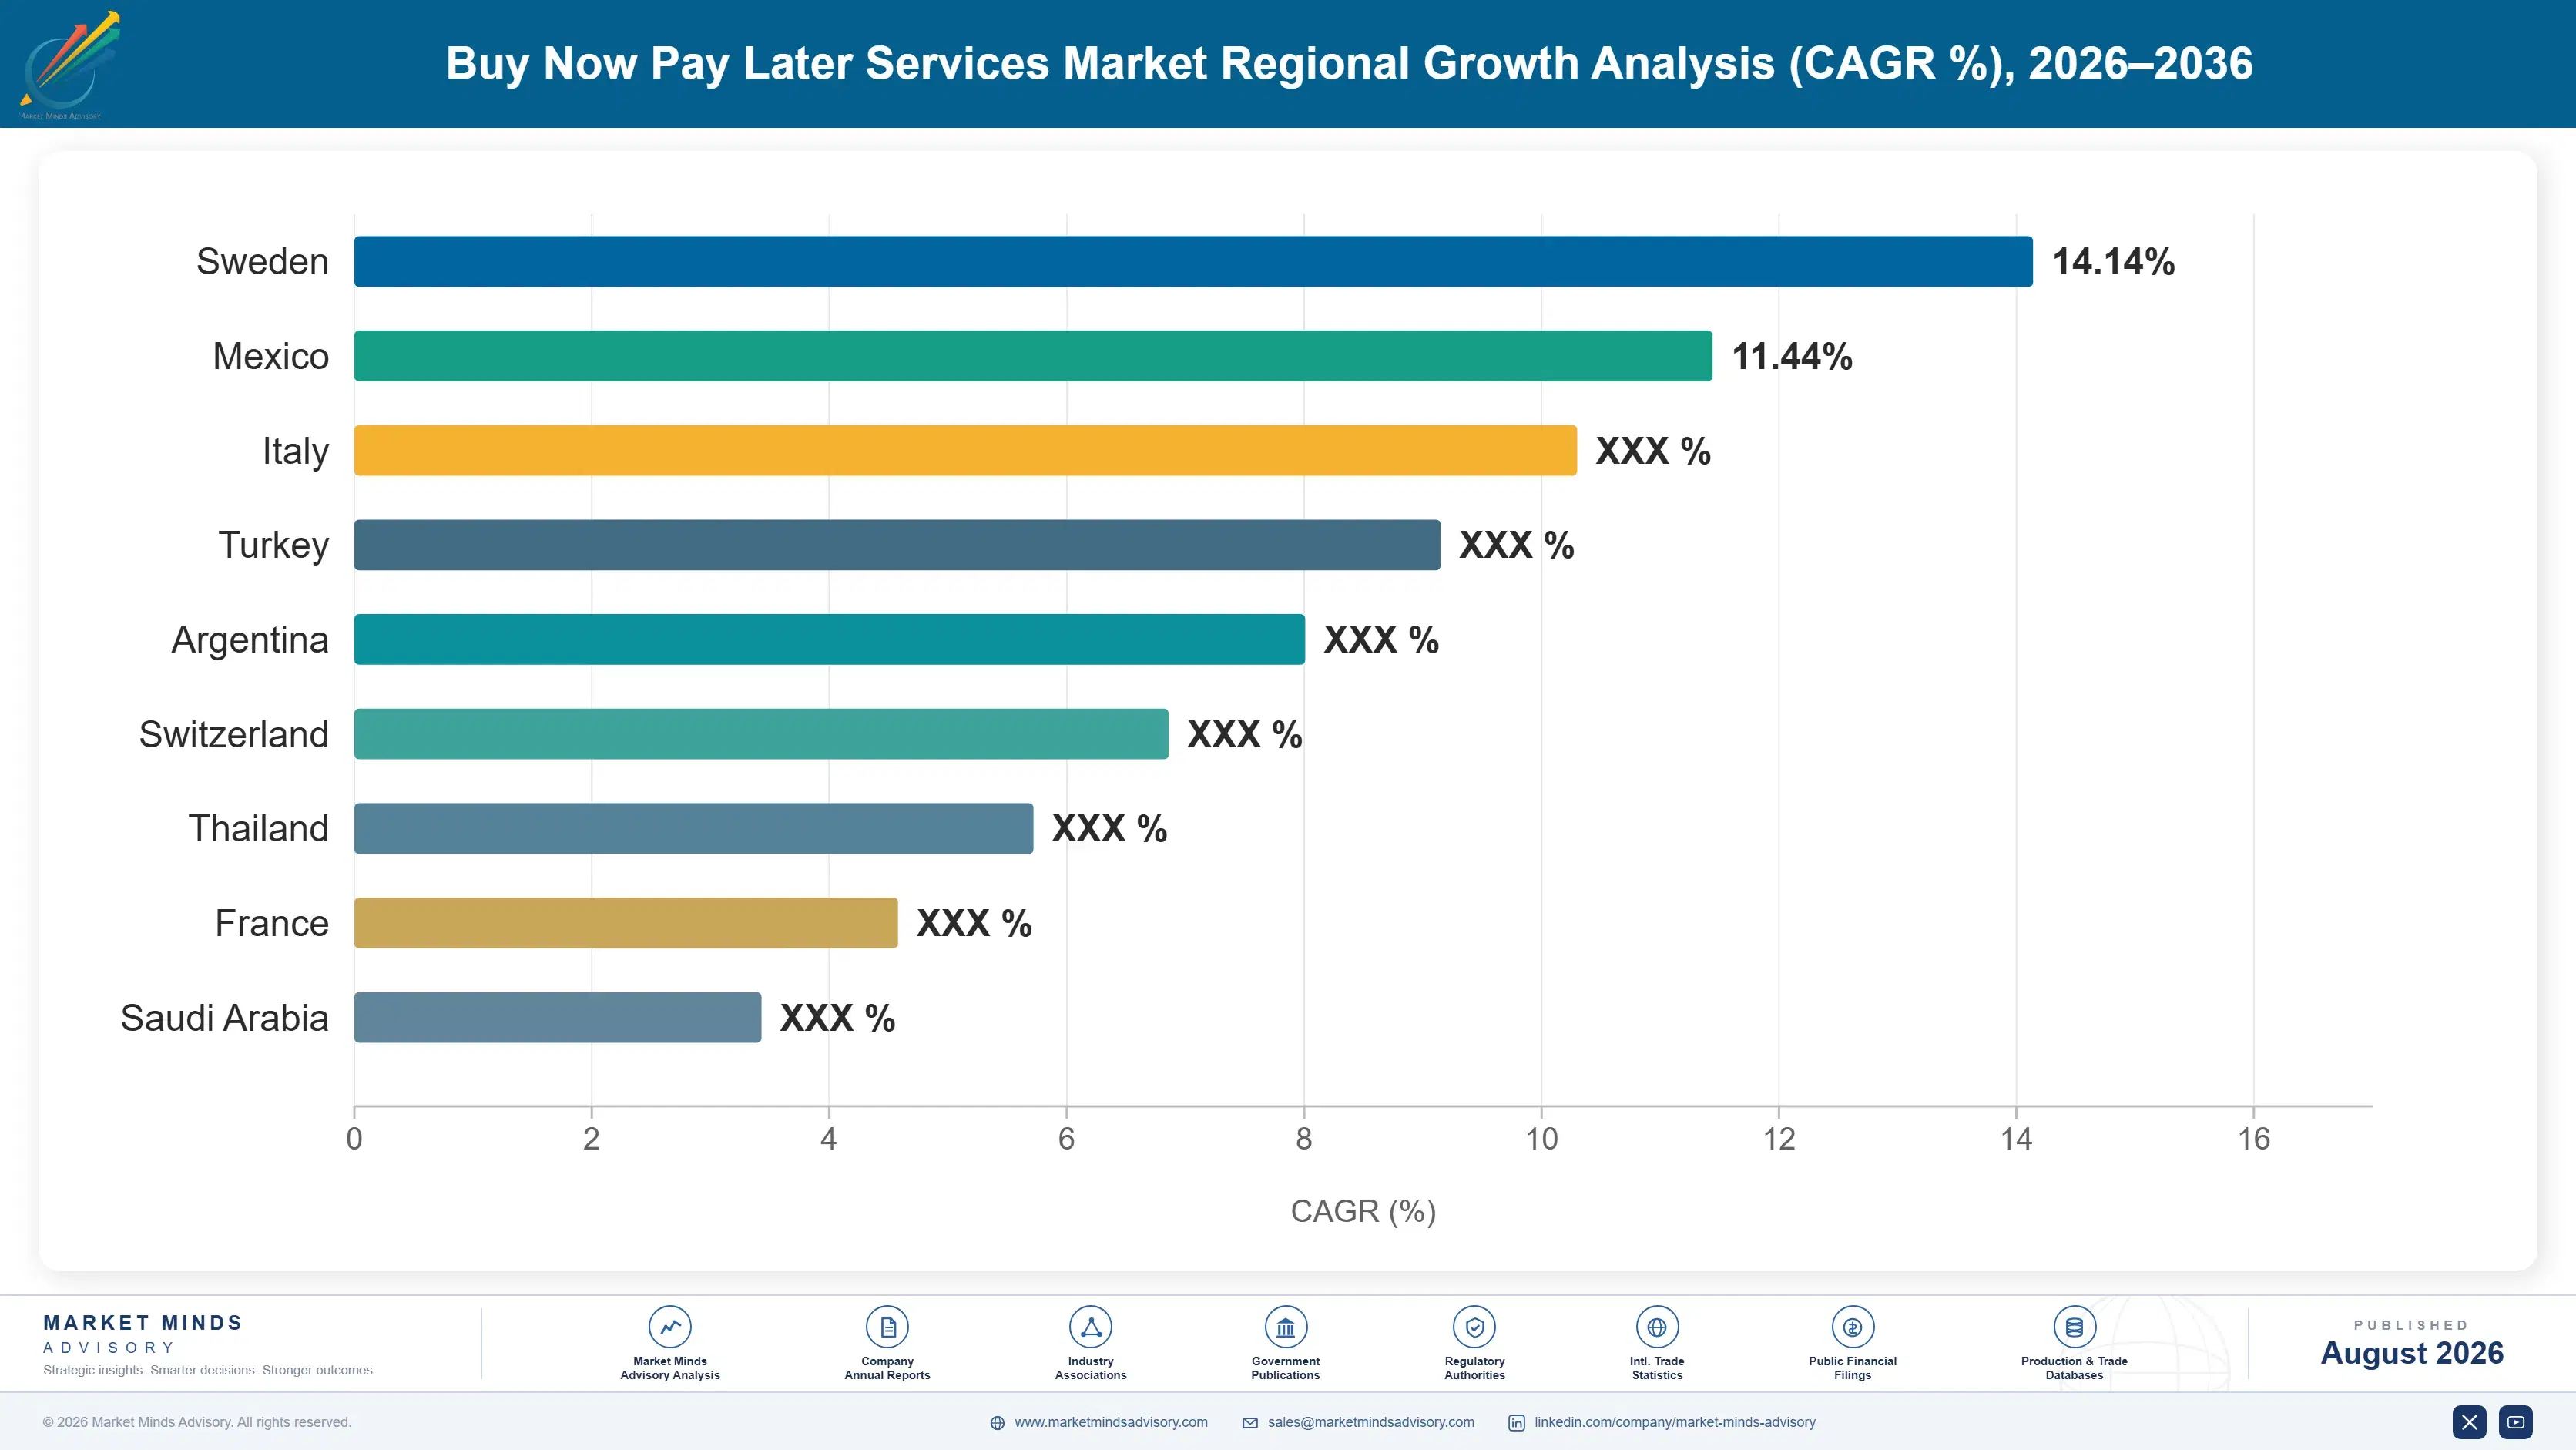
Indonesia: 14.0% CAGR
Fastest Growth Region
South Asia and Pacific: 14.2% CAGR
Largest Region
North America: 31% of 2025 global value
Market Leaders
Klarna, Affirm, Block, PayPal, Zip Co. Source: MMA Analysis based on disclosed buy now pay later revenue including merchant fees, consumer interest and account fees, company annual reports 2025.
Primary Survey
n=3,800 procurement and R&D decision-makers, Q4 2025, six countries
Methodology
Demand-side build-up, cross-validated against public data, 47 expert interviews

Buy Now Pay Later Services Market Forecast Scenarios

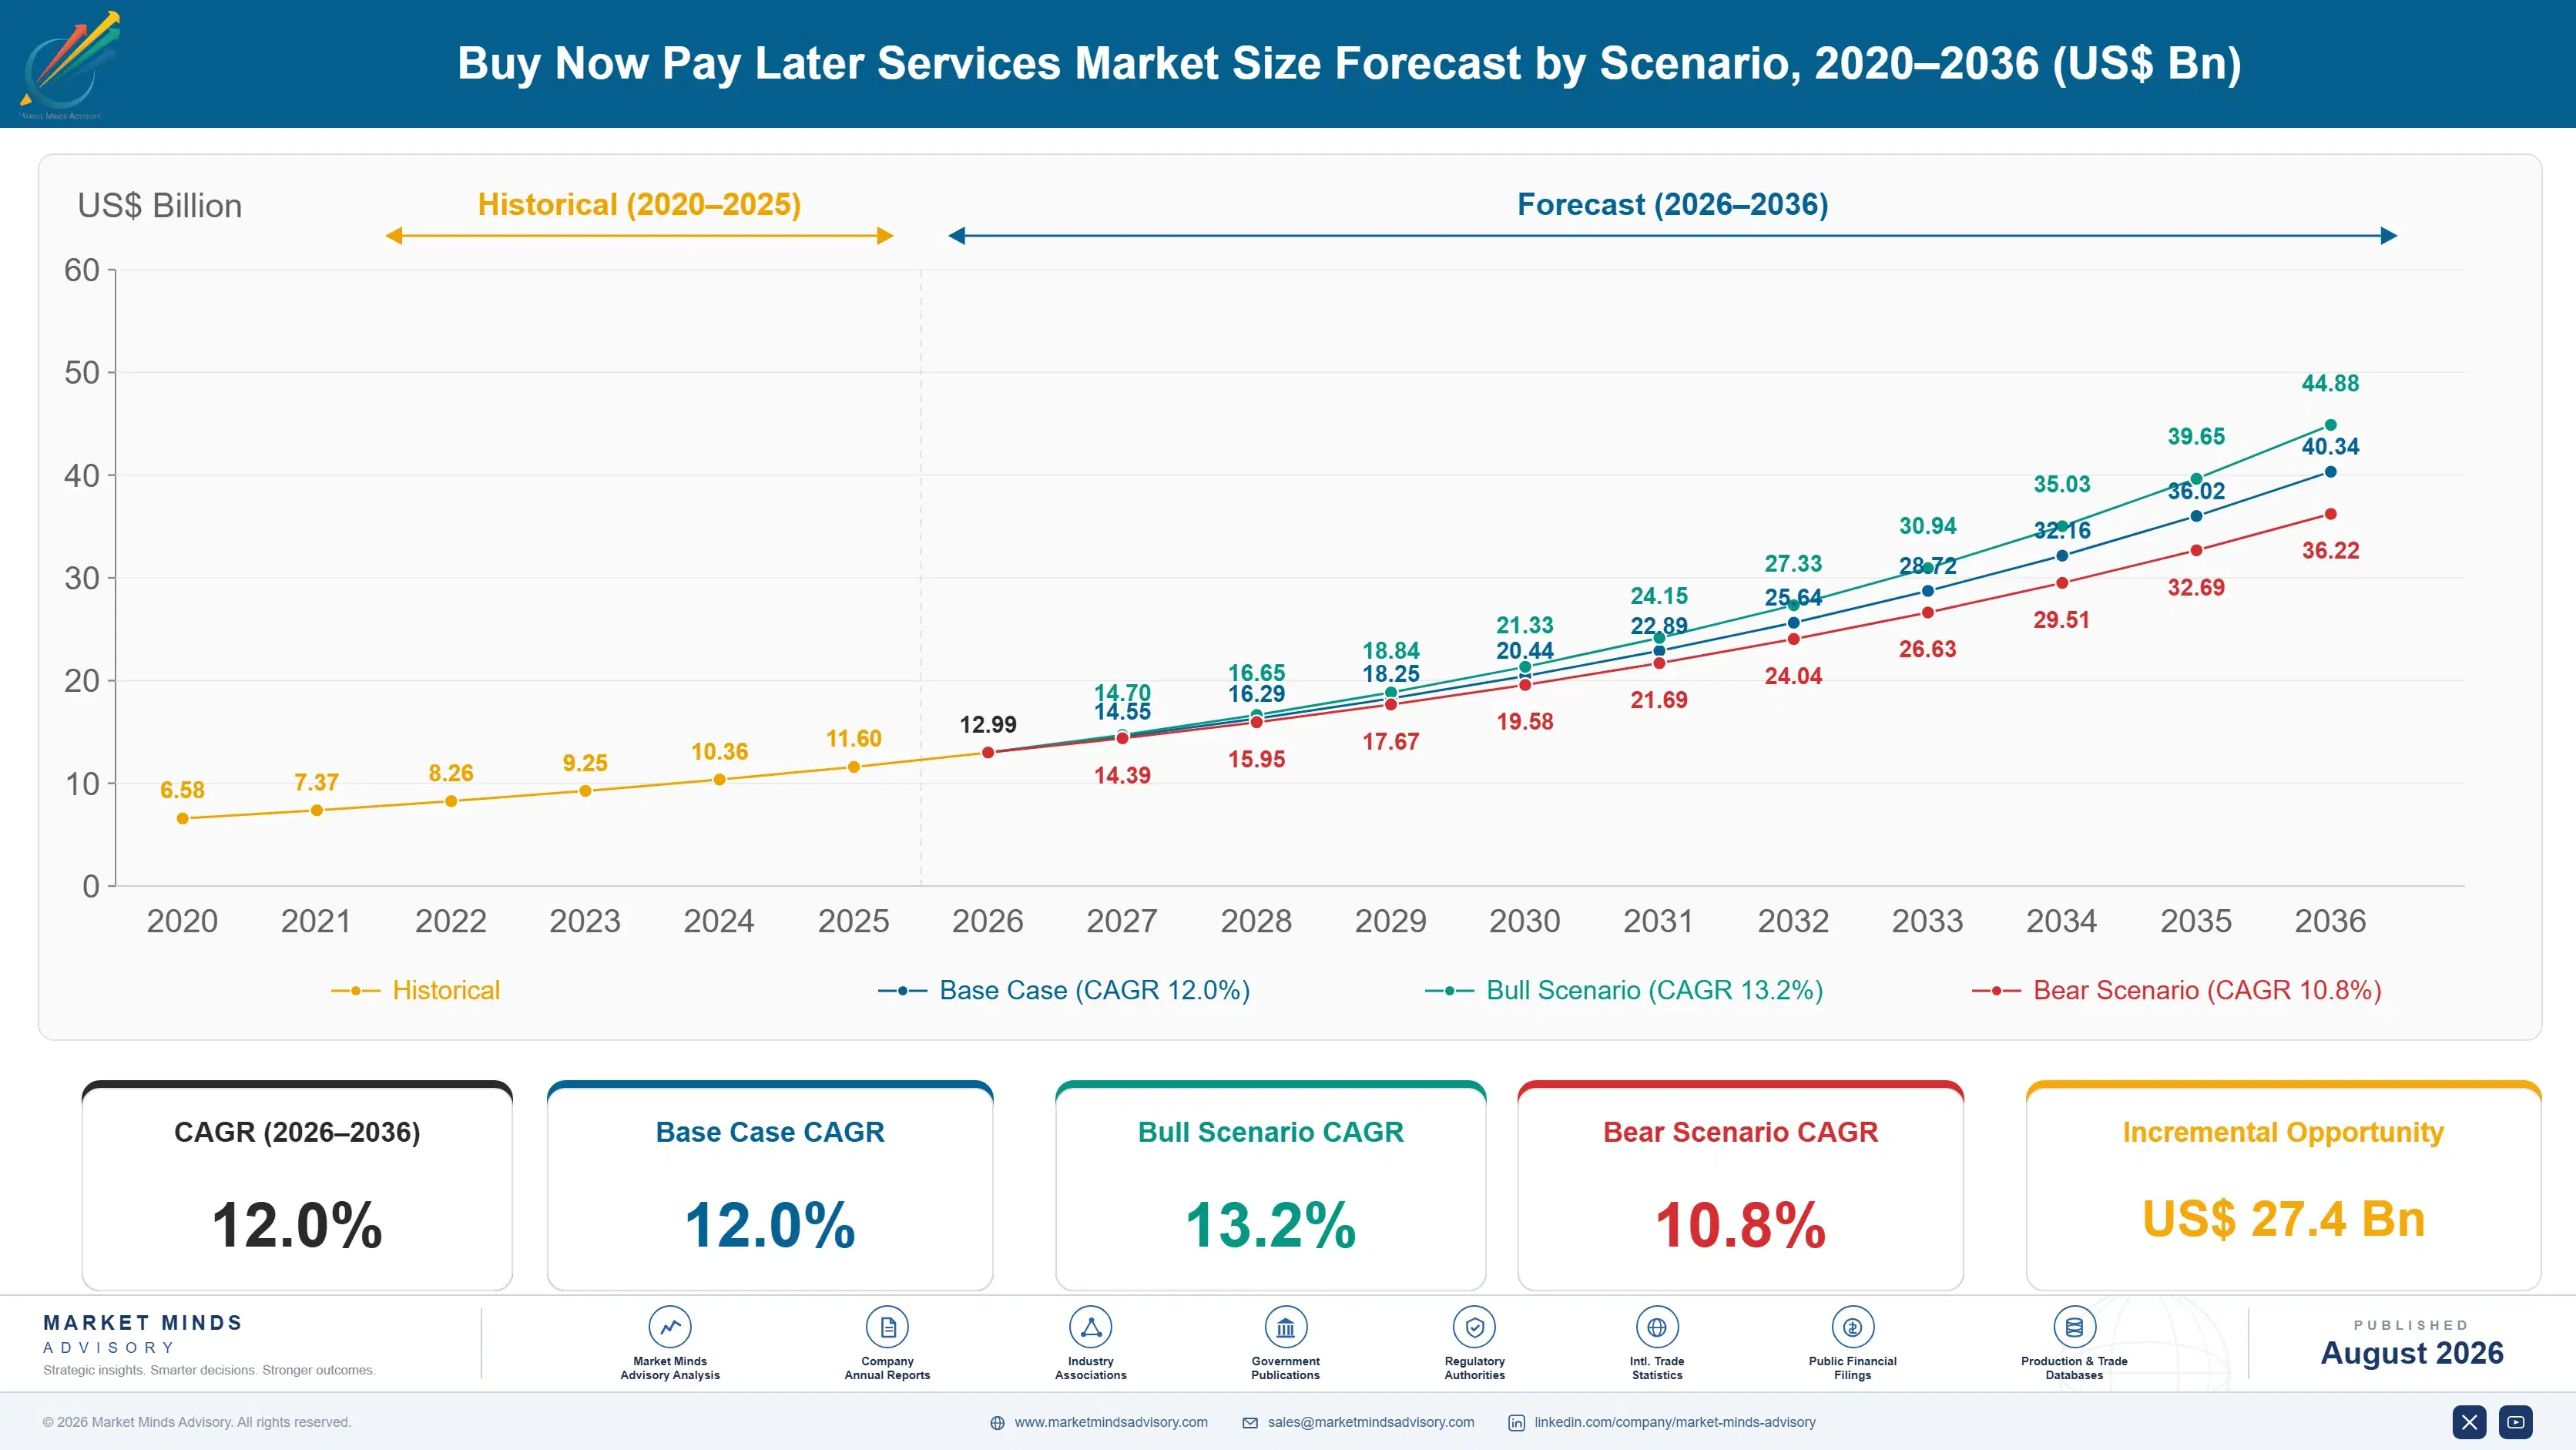
buy-now-pay-later-services-market-size-forecast-scenario-1787914694509
Growth from 2020 to 2025 ran at 10.8% and the middle of that period nearly broke the model. Volumes exploded through 2020 and 2021 while funding cost almost nothing. Then policy rates rose sharply and providers discovered they had no lever at all, since the consumer pays nothing and merchant fees are negotiated annually. Losses followed, valuations collapsed and the survivors pivoted toward products where somebody actually pays interest.
The 12.0% base case rests on three mechanisms. Longer tenor interest-bearing lending keeps growing because it is the only structure that funds itself when rates are anything above zero. Business-to-business deferred payment keeps expanding into trade credit that suppliers previously extended themselves. And Southeast Asian volumes keep climbing from bases where card penetration was never high enough to defend. None of the three depends on funding ever getting cheap again.
The bull case at 13.2% assumes regulatory clarity settles quickly and interest-bearing conversion accelerates from the short tenor funnel. The bear case at 10.8% is affordability assessment adding enough checkout friction to suppress conversion materially, since the entire merchant proposition rests on removing friction, alongside bureau visibility making consumers cautious about balances other lenders can now see.

The Shopper Pays Nothing

Nobody buying this product is the customer, which explains almost everything about how it behaves. A merchant pays roughly 4.4% of basket value, against something closer to 2% for cards, in exchange for higher conversion and larger baskets. The shopper pays nothing and therefore compares nothing. Providers compete for merchant integration rather than for consumers, who mostly do not know which company they borrowed from.
FIVE-FIRM CONCENTRATION58%Share of category revenue held by the largest global providers
MERCHANT DISCOUNT RATE4.4%Charge applied to a retailer per instalment transaction
AVERAGE LOAN TENOR6 weeksRepayment period across the shortest instalment product offered
CAPITAL TURNOVER RATE8.2Times a funded balance recycles across twelve months
CONSUMER INTEREST CHARGED0%Cost to a shopper on the shortest instalment structure
BUREAU REPORTING COVERAGE41%Instalment balances now visible to other lenders checking
The rate cycle exposed what that structure actually costs. A six week loan carries no consumer interest, so the entire spread is merchant fee less funding, credit loss and acquisition. When policy rates rose through 2022 and 2023 the funding leg moved and nothing else could. Merchant fees are negotiated annually and large retailers push them down. Providers had no repricing lever and several very nearly ran out of road.
Short tenor numbers mislead everybody in both directions. A six week loan turning over around 8.2 times a year means a modest loss rate looks catastrophic annualised and looks fine per dollar of capital deployed. Commentators quote whichever version supports their argument. What matters is that balances recycle constantly, so a provider with disciplined credit and cheap funding compounds fast and one without fails quickly.
"Everyone argues about whether this is lending or payments. It is a merchant marketing budget dressed as a loan, and the day funding stopped being free was the day everybody found out which one they were actually running."
Director, Digital Payments Practice · MMA Digital Payments and Consumer Credit Practice · August 2026

Market Trends

Interest-Bearing Products Become The Actual Business

Short tenor instalments increasingly function as an acquisition funnel into longer arrangements where the consumer pays interest, which is the only structure that funds itself once rates sit above zero. That segment grows at 18.0%, faster than anything else here. Providers describe the free product as the proposition and earn from the paid one behind it. Conversion between them is the metric that now decides which providers actually reach profitability. Nobody in this category reaches profitability on the free product alone, and everybody says otherwise for as long as they can.
Market Impact: Grows business deferred payment 15.6%

Three Jurisdictions Reclassified This As Credit At Once

An interpretive rule treating short instalments as credit card arrangements, a statutory regime bringing providers under conduct supervision, and directive transposition explicitly covering these products all landed within roughly eighteen months of each other. Affordability assessment, disclosure and dispute rights now attach to a product designed around having none of them. Compliance cost falls on transactions where the provider earns 4.4% once and never sees the customer again. Nobody designing this product ten years ago imagined it would be supervised as consumer lending, and almost everybody building one now assumes it will be.
Market Impact: Grows Indonesian volume at 14.0%

Market Opportunities and Growth Drivers

Suppliers Hand Trade Credit To Somebody Else

Business-to-business deferred payment lets a supplier offer thirty or sixty day terms while being paid immediately, transferring both the funding and the credit assessment to a provider that specialises in it. That segment grows at 15.6%. Suppliers have extended trade credit reluctantly for a century and generally price it badly. Ticket sizes are far larger than consumer instalments and the credit work is genuinely different, which suits specialists rather than consumer providers. Suppliers have never enjoyed being unpaid lenders and have rarely been any good at doing it either anyway.
Market Impact: Leaves 0% consumer pricing lever

Card Penetration Gaps Open Southeast Asian Volume

Markets where credit card penetration never reached Western levels have adopted instalment payment at checkout quickly, because there was no incumbent product defending the position and mobile commerce arrived before card habits formed. Indonesia grows fastest at 14.0%. Local providers hold strong positions and regional platforms distribute at acquisition costs Western providers cannot approach, which makes entry considerably harder than the growth figures suggest. Western providers arriving late find local platforms already holding the merchant integrations and the consumer habit, which is a considerably harder position to attack than any growth figure suggests.
Market Impact: Threatens the 4.4% merchant fee

Market Restraints and Challenges

No Consumer Price Means No Repricing Lever

Charging the shopper 0% leaves merchant discount as the only revenue on short tenor business, and merchant fees are negotiated annually with large retailers pushing them downward rather than upward. Root cause is a product designed when funding cost nothing. Commercial impact appeared immediately when rates rose and providers could not respond. Mitigation runs through interest-bearing conversion and business-to-business lending, both of which restore a borrower who actually pays something. Nobody in this business anticipated needing any repricing mechanism at all, because nobody expected money to cost anything ever again afterwards.
Market Impact: Grows interest-bearing at 18.0%

Affordability Checks Attack The Only Real Proposition

The merchant proposition is entirely conversion, and every affordability question inserted at checkout reduces the completion rate that justifies a 4.4% fee in the first place. Root cause is consumer protection rules applied to a product built around frictionlessness. Commercial impact falls on the merchant relationship rather than on compliance budgets. Mitigation involves pre-approval and background assessment, which shifts the friction earlier without removing it from the process. Merchants here notice their completion rates falling within days, and no explanation about consumer protection improves that particular conversation with them either.
Market Impact: Reclassified within 18 months
3 additional market trends, 4 additional growth drivers, and 2 additional restraints and challenges are covered in the full report. Contact sales@marketmindsadvisory.com to access the complete intelligence.

Segment CAGR and Growth Architecture

Segmentation follows product structure and tenor, since revenue source, funding requirement and regulatory treatment all differ by structure rather than by merchant category or geography. Six categories cover the market without overlap. Merchant sector, consumer segment and integration route are treated as separate commercial dimensions throughout this report rather than as segmentation logic here.
buy-now-pay-later-services-market-market-share-analysis-1787914695042

Longer Tenor Interest-Bearing Instalments

Interest-bearing instalments grow at 18.0%, half again the market rate of 12.0%, because a borrower paying interest is the only arrangement that funds itself once policy rates sit meaningfully above zero. Short tenor products increasingly serve as the acquisition funnel into these, and conversion between the two now decides which providers reach profitability at all. Credit assessment matters far more here than on six week exposures, and several providers built consumer bases faster than they built the underwriting capability to lend to them properly. A consumer instalment history supplies far less underwriting signal than most providers assumed, which is why several arrived here with a large user base and no ability to lend to it.
CAGR 18.0%

Business-to-Business Deferred Payment

Deferred payment for business buyers grows at 15.6% by taking trade credit that suppliers have extended reluctantly for a century and generally priced badly, paying the supplier immediately while carrying both funding and credit risk. Ticket sizes run far above consumer instalments and the underwriting question is entirely different, turning on company financials and payment behaviour rather than on consumer scores. That suits specialists, and consumer providers moving into it have found the transition considerably harder than expected. Accounting platform integration is the distribution route that works here, since a buyer already inside a purchasing workflow accepts deferred terms without any separate decision being required of them at all anywhere.
CAGR 15.6%
Full segment breakdown across 6 segments available in the complete report.

Regional Architecture and Country Demand Map

Adoption follows the strength of whatever payment habit already existed, which is why several markets with weak card penetration moved faster than wealthy ones with entrenched alternatives. What already existed before any of this arrived matters considerably more than income levels ever do at all.

North America

The largest revenue pool by some distance, built on enormous online retail volume and merchant willingness to pay for conversion, though card rewards culture gives shoppers a genuine alternative that most other markets lack. Interpretive rulemaking bringing short instalments under credit card provisions arrived here first and set the direction others followed. Interest-bearing conversion is furthest advanced, with the largest providers now earning most of their revenue from borrowers who actually pay something. Card issuers offering instalment repayment on existing credit lines at no merchant cost compete directly here with a proposition retailers currently pay a premium rate for, which is the clearest threat to fee levels anywhere in this market.
Share: 31% | CAGR: 10.8% (2026 to 2036)

Western Europe

Nordic markets created this product and adoption there remains among the highest anywhere, with invoice-based deferred payment predating anything the rest of the world calls buy now pay later by a considerable margin. German adoption is similarly deep for the same cultural reasons around paying after receipt. Directive transposition now brings the whole region under consumer credit rules simultaneously, which removes the regulatory arbitrage that lighter-touch markets briefly enjoyed against one another. Merchant fee tolerance is lower here than in North America, partly because deferred payment was normal long before anybody charged a premium for it and partly because retailers have alternatives that predate the entire category by several decades.
Share: 26% | CAGR: 10.4% (2026 to 2036)
Regional intelligence for 5 additional markets available in the complete report: East Asia, South Asia and Pacific, Latin America, Middle East and Africa, Eastern Europe. Contact sales@marketmindsadvisory.com.
buy-now-pay-later-services-market-country-cagr-analysis-1787914695564

Find A Borrower Who Pays

Merchants pay 4.4% while shoppers pay 0%, tenors run six weeks with capital turning 8.2 times, and bureau reporting now covers 41% of balances. Four levers here work on interest-bearing conversion, business lending, funding structure and merchant evidence rather than on consumer pricing, which across most of this transaction volume still remains exactly zero.

Convert The Free Funnel Into Paid Lending

Short tenor instalments charging the consumer 0% cannot fund themselves once rates rise, which is why the survivors of the last cycle all earn from longer interest-bearing arrangements behind the free product. Conversion between the two decides profitability entirely. Providers treating the free product as the business rather than as acquisition are running a marketing service on borrowed money and calling it a lending company to their investors. Investors were told one story about this category and the survivors are now all quietly running a rather different one entirely instead.
Market Impact: Grows the 18.0% interest-bearing revenue line properly instead

Move Into Business Trade Credit Deliberately

Business deferred payment grows at 15.6% by taking credit that suppliers have extended reluctantly and priced badly for a century, with ticket sizes far above consumer instalments and underwriting that turns on company behaviour rather than consumer scores. The work is genuinely different. Consumer providers assuming their existing credit capability transfers have generally discovered that it does not, and specialists have taken the positions while they were finding out. Accounting platform integration is the distribution that works, since the buyer is already inside a purchasing workflow when the offer appears.
Market Impact: Enters into a 15.6% growth business lending segment

Secure Funding That Survives A Rate Cycle

With capital turning over roughly 8.2 times a year and no consumer pricing lever available, funding cost translates almost directly into margin on short tenor business. Providers dependent on a single warehouse facility or wholesale line discovered that in 2022. Diversified committed funding costs undrawn fees continuously and it is the difference between compressing through a cycle and stopping origination entirely partway through one. Nobody who stopped originating in 2022 did so because their credit book had deteriorated, which is the part of that period most commentary managed to get comprehensively wrong.
Market Impact: Funds the capital turning over 8.2 times annually

Prove Conversion Before Defending The Fee

Merchants pay around 4.4% against roughly 2% for card acceptance and they renegotiate annually, which means the fee survives only where basket size and completion rate evidence justifies it on the merchant's own data. Providers arguing brand or reach are arguing something retailers cannot verify. Those demonstrating incremental conversion against a controlled comparison hold pricing that everybody else surrenders at renewal without much of a fight. A retailer can measure incremental completion against a controlled comparison in a fortnight, and any provider unwilling to run that test is telling them something without meaning to.
Market Impact: Defends the full 4.4% merchant discount rate annually

Who Controls the Margin Pool

Measured on disclosed buy now pay later revenue including merchant fees, consumer interest and account fees, the five largest providers hold a CR5 of 58%, high for a category this young and reflecting how quickly merchant integration concentrates volume. Klarna and Affirm carry the deepest merchant estates and the furthest advanced interest-bearing conversion, Block and PayPal hold substantial embedded distribution, and Zip Co retains meaningful positions in its origin markets. Nobody outside that group holds both a consumer application people open before shopping and merchant integration at real scale.
Three contests define activity. Enterprise merchants compete on conversion evidence and fee negotiation. Consumer apps compete for the shopper who opens something before shopping. Business deferred payment competes on underwriting capability entirely. The three reward completely different capabilities, and hardly anybody competes convincingly across more than one of them.

Pressure builds from card networks and issuers offering instalment options on existing credit lines at no merchant cost. Rankings shift toward whoever earns from borrowers rather than from merchants alone. Gross merchandise value has become a poor proxy for anything worth measuring, since a great deal of that volume costs more to fund than it earns.
buy-now-pay-later-services-market-company-positioning-matrix-1787914696088

Competitive Moat and Risk Dimensions

KLARNA

Moat: Merchant Estate And Consumer App

Holding both a very large merchant integration base and a consumer application that shoppers open before browsing gives the provider a two-sided position competitors reach from only one direction. Merchants join for the traffic and consumers stay for the offers. Rebuilding either side takes years, and rebuilding both at once has defeated everybody who has tried.
KLARNA

Risk: Regulatory Cost On Thin Transactions

Consumer credit reclassification across its principal markets adds affordability assessment, disclosure and dispute handling to transactions earning a single-digit percentage once. Compliance cost per transaction rises while merchant fee tolerance falls. The friction added at checkout also works directly against the conversion argument that justifies the fee in the first place.
AFFIRM

Moat: Interest-Bearing Conversion Capability

Building genuine underwriting for longer interest-bearing lending, rather than relying on the very short exposures that short tenor products carry, gives the provider a revenue source that survives a rate cycle intact. That capability took years and considerable loss experience to develop properly. Competitors attempting the same transition find instalment history supplies far less signal than assumed.
AFFIRM

Risk: Concentrated Merchant Relationships

A meaningful share of volume flows through a small number of very large merchant relationships that are renegotiated periodically and could move elsewhere. Those merchants have exactly the scale to demand fee reductions and exactly the alternatives to make the threat credible. Losing one changes reported volume materially in a single quarter.

Players Tracked

Prominent Players

Klarna
Affirm
Block
PayPal
Zip Co

Other Key Players

Sezzle
Splitit
Kredivo
Atome
Tabby
Tamara
Scalapay
Alma
Zilch
Postpay
Billie
Hokodo
Mondu
Riverty
Paidy

Recent Developments

JANUARY 2025

Provider begins reporting instalment balances to credit bureaus

A major provider began reporting short tenor instalment balances and repayment behaviour to consumer credit bureaus across its principal market. This was a voluntary reporting decision rather than any regulatory requirement, and balances previously invisible to other lenders became visible to everybody for the first time.
Signal: Invisible balances are now becoming quite visible, which changes both stacking risk and consumer behaviour together.
MAY 2025

Card issuer launches instalment option at no merchant cost

A card issuer launched an instalment repayment option on existing credit lines available at checkout with no additional merchant fee whatsoever. This was a product extension rather than any acquisition, and it competes directly with the proposition retailers currently pay a premium rate for today.
Signal: The fee premium only survives while nobody else offers the same convenience entirely for free elsewhere.
SEPTEMBER 2025

Affordability requirements take effect across major consumer market

Affordability assessment and disclosure requirements took effect for instalment credit across a major consumer market following statutory reclassification. This was a regulatory implementation rather than any commercial change, and completion rates at checkout became the one metric that every single provider then watched immediately afterwards.
Signal: Friction and conversion are the same variable, and regulation has just increased one of them considerably.

Funding, Losses, Compliance

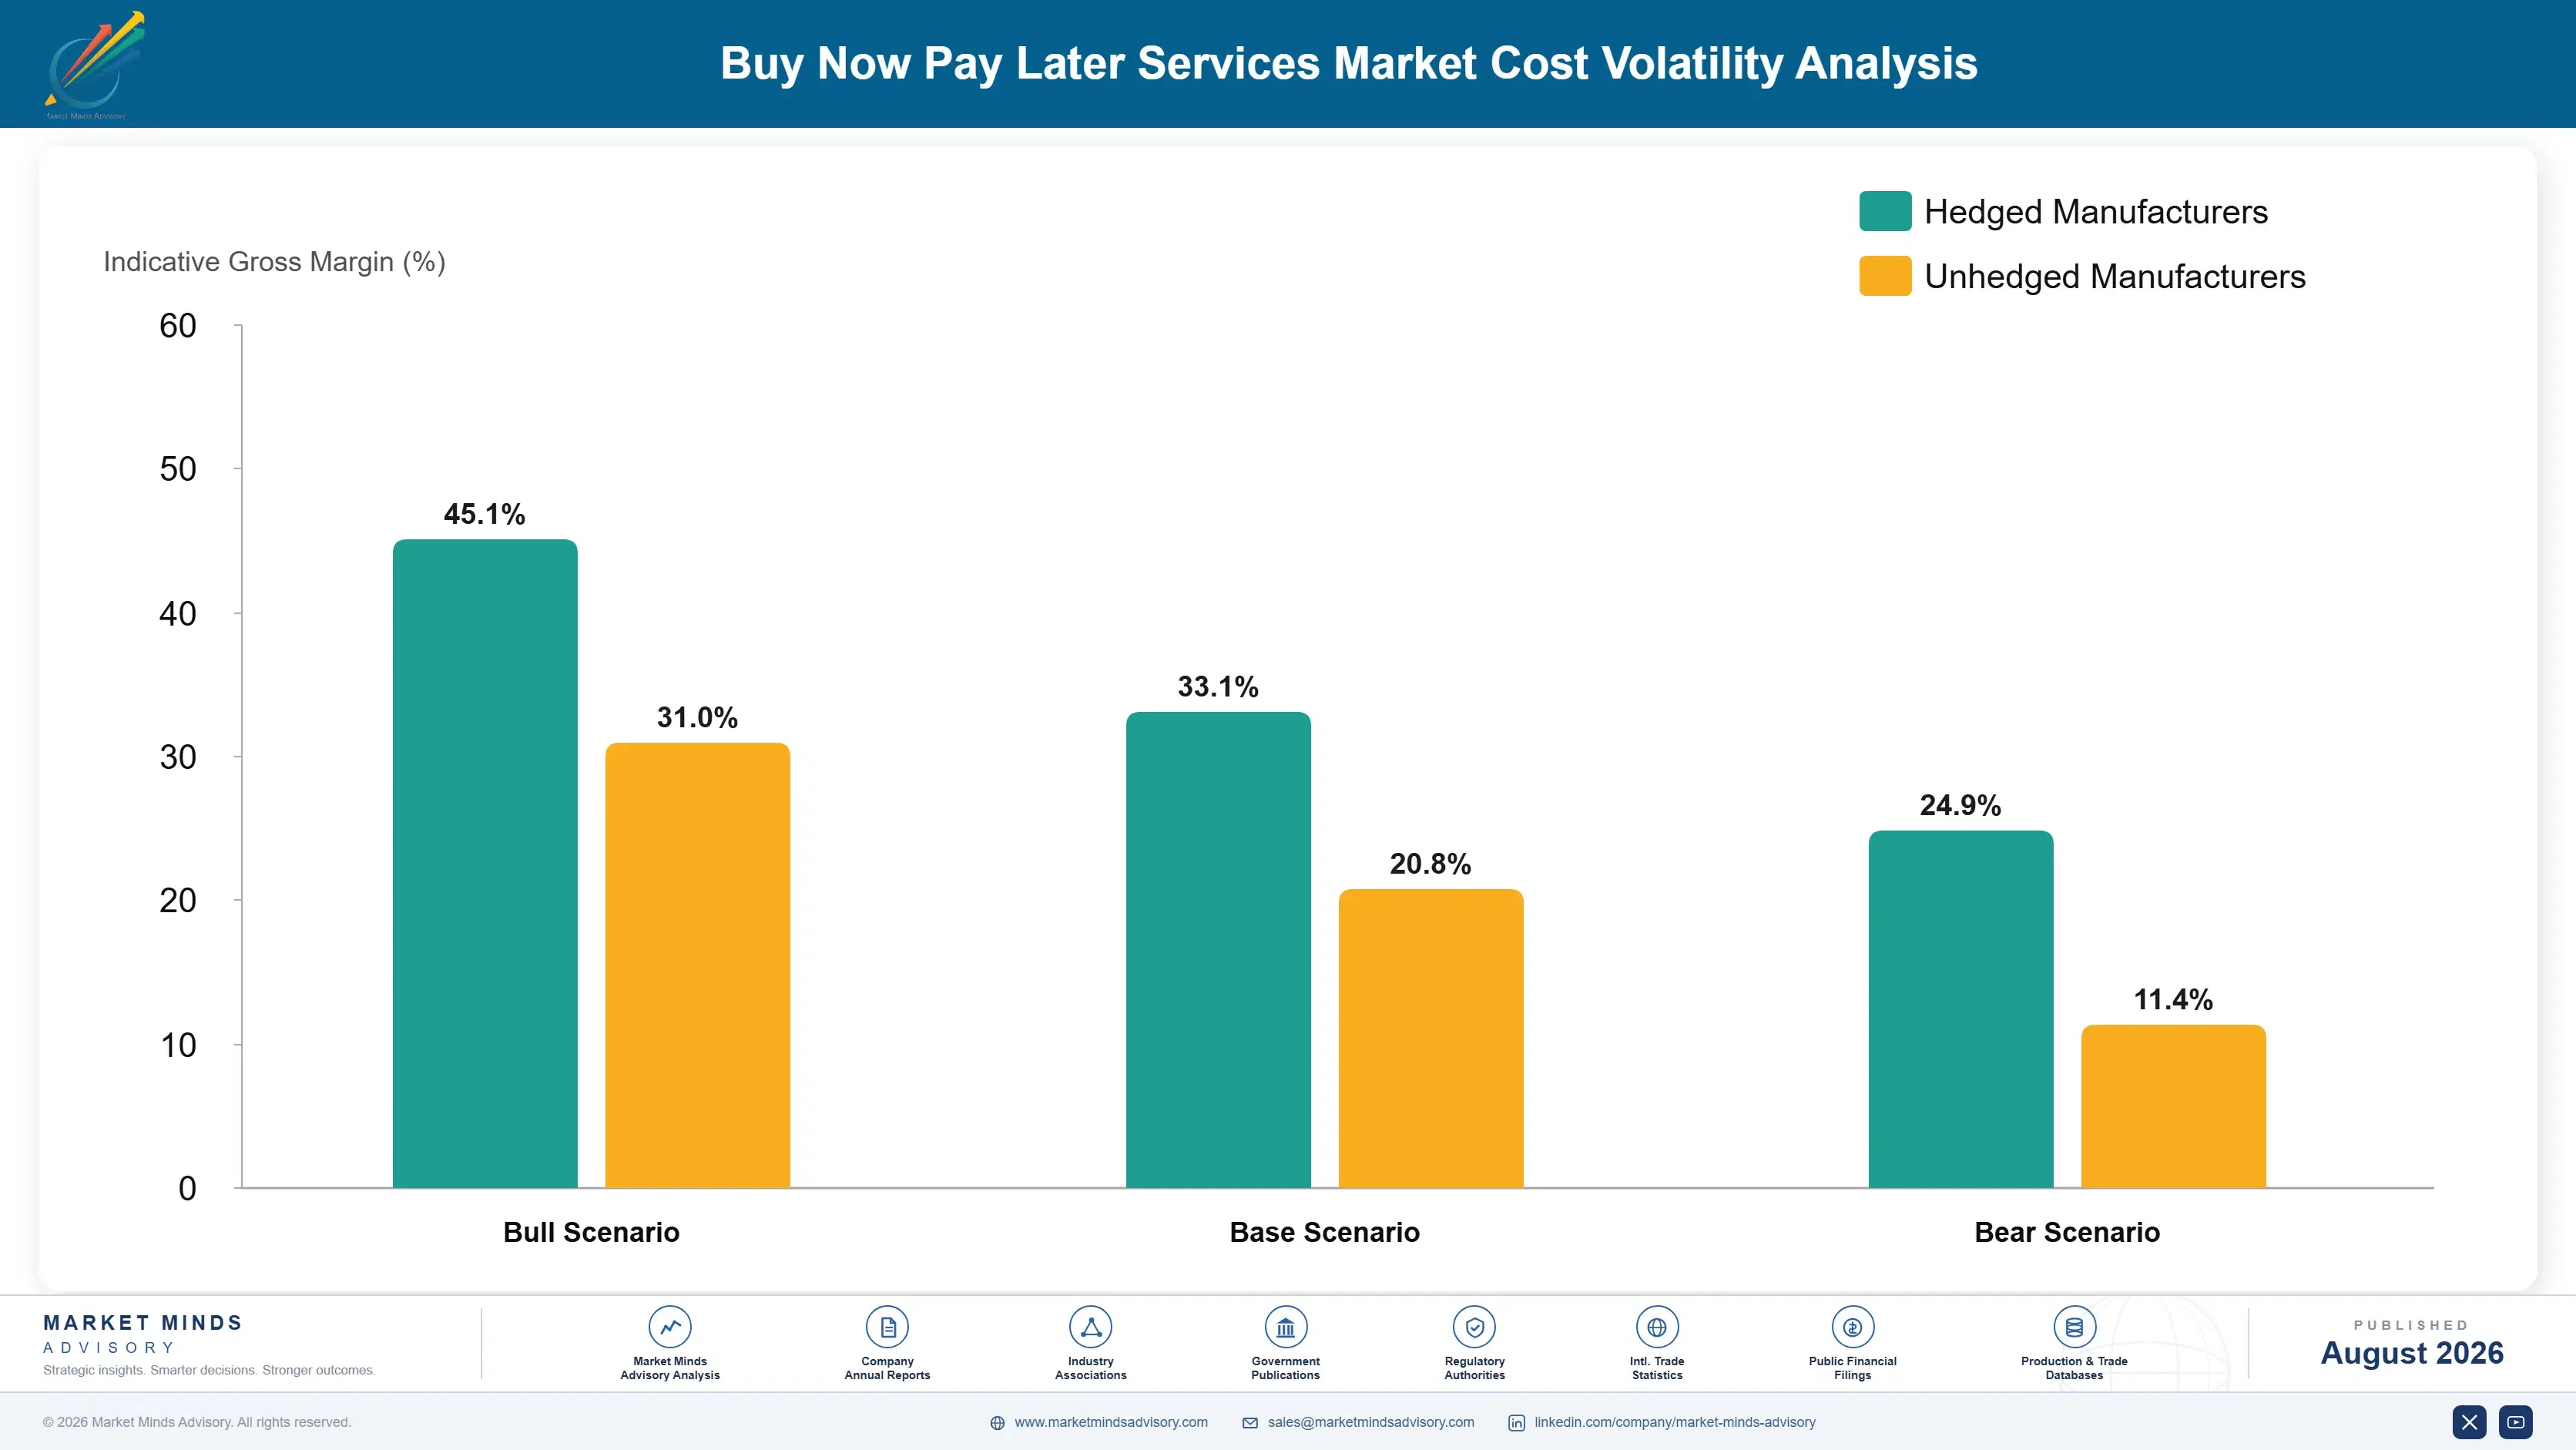
Three costs consume the merchant fee. Funding on advanced balances, credit losses across the book, and merchant acquisition with technology and compliance together account for 71 to 86% of revenue at a typical provider. Funding dominates on short tenor business because capital turns over roughly 8.2 times a year, which means the cost applies repeatedly while revenue on each cycle is one merchant fee of around 4.4%.
The rate cycle did the damage nothing else could. Policy rates across advanced economies rose sharply through 2022 and 2023, which IMF data documents, and providers charging consumers 0% had no mechanism to pass any of that through. Klarna Annual Report 2024 and Affirm Annual Report 2024 disclosures describe the resulting funding cost and margin pressure, and the strategic pivot toward interest-bearing products that followed almost immediately afterwards.

Exposure divides by funding structure rather than by credit quality. Providers with diversified committed facilities and deposit funding carried the cycle at compressed margin. Those dependent on a single warehouse line or wholesale market access found capacity withdrawn exactly when they needed it, and several stopped originating altogether. Credit performance mattered less than where the money came from, which surprised many people.
buy-now-pay-later-services-market-cost-volatility-analysis-1787914696282

Build interest-bearing revenue before the next cycle

Short tenor products charging consumers 0% cannot absorb any increase in funding cost, and merchant fees are negotiated annually by retailers pushing downward. Converting users into longer interest-bearing arrangements requires underwriting capability that short exposures never developed. It restores a borrower who actually pays something toward the actual cost of the money being lent.

Diversify funding beyond a single warehouse facility

Capital turning over roughly 8.2 times a year makes continuous funding access existential rather than merely useful. Providers relying on one facility discovered in 2022 that capacity withdraws precisely when conditions deteriorate. Multiple committed facilities across different investor types cost undrawn fees continuously and they keep origination running right through an entire rate cycle.

Move affordability assessment away from the checkout

Every question asked at checkout reduces the completion rate that justifies a 4.4% merchant fee, and the merchant notices the drop immediately. Pre-approval and background assessment shift the same obligation earlier in the customer relationship. It costs real engineering work and preserves the only argument that the merchant here actually cares about at all.

Portfolio Architecture for Margin Defence

Margin follows whether anybody pays interest rather than how large the volume is. Pay-in-four instalments earn thinly and depend entirely on the merchant fee surviving renewal. Virtual card instalments earn modestly with interchange added. In-store and card-linked arrangements earn reasonably on lower acquisition cost. Merchant-subsidised longer terms earn well where retailers fund the interest. Business deferred payment earns better on larger tickets. Interest-bearing consumer instalments earn best, on borrowers who actually pay.
The tension is that the product everybody knows this category for is the one that cannot pay for itself. Short tenor instalments generate the volume, the brand and the merchant relationships, and they lose money whenever funding costs anything. Providers must therefore run a loss-making acquisition product to feed a profitable lending product, which is a perfectly coherent business and not the one most of them originally described to investors.

High-value pools sit in three places. Interest-bearing conversion, where borrowers fund the cost of the money. Business deferred payment, where tickets are large and suppliers have always priced trade credit poorly. And merchant-subsidised longer terms, where a retailer funds the interest to move goods it would otherwise discount permanently.

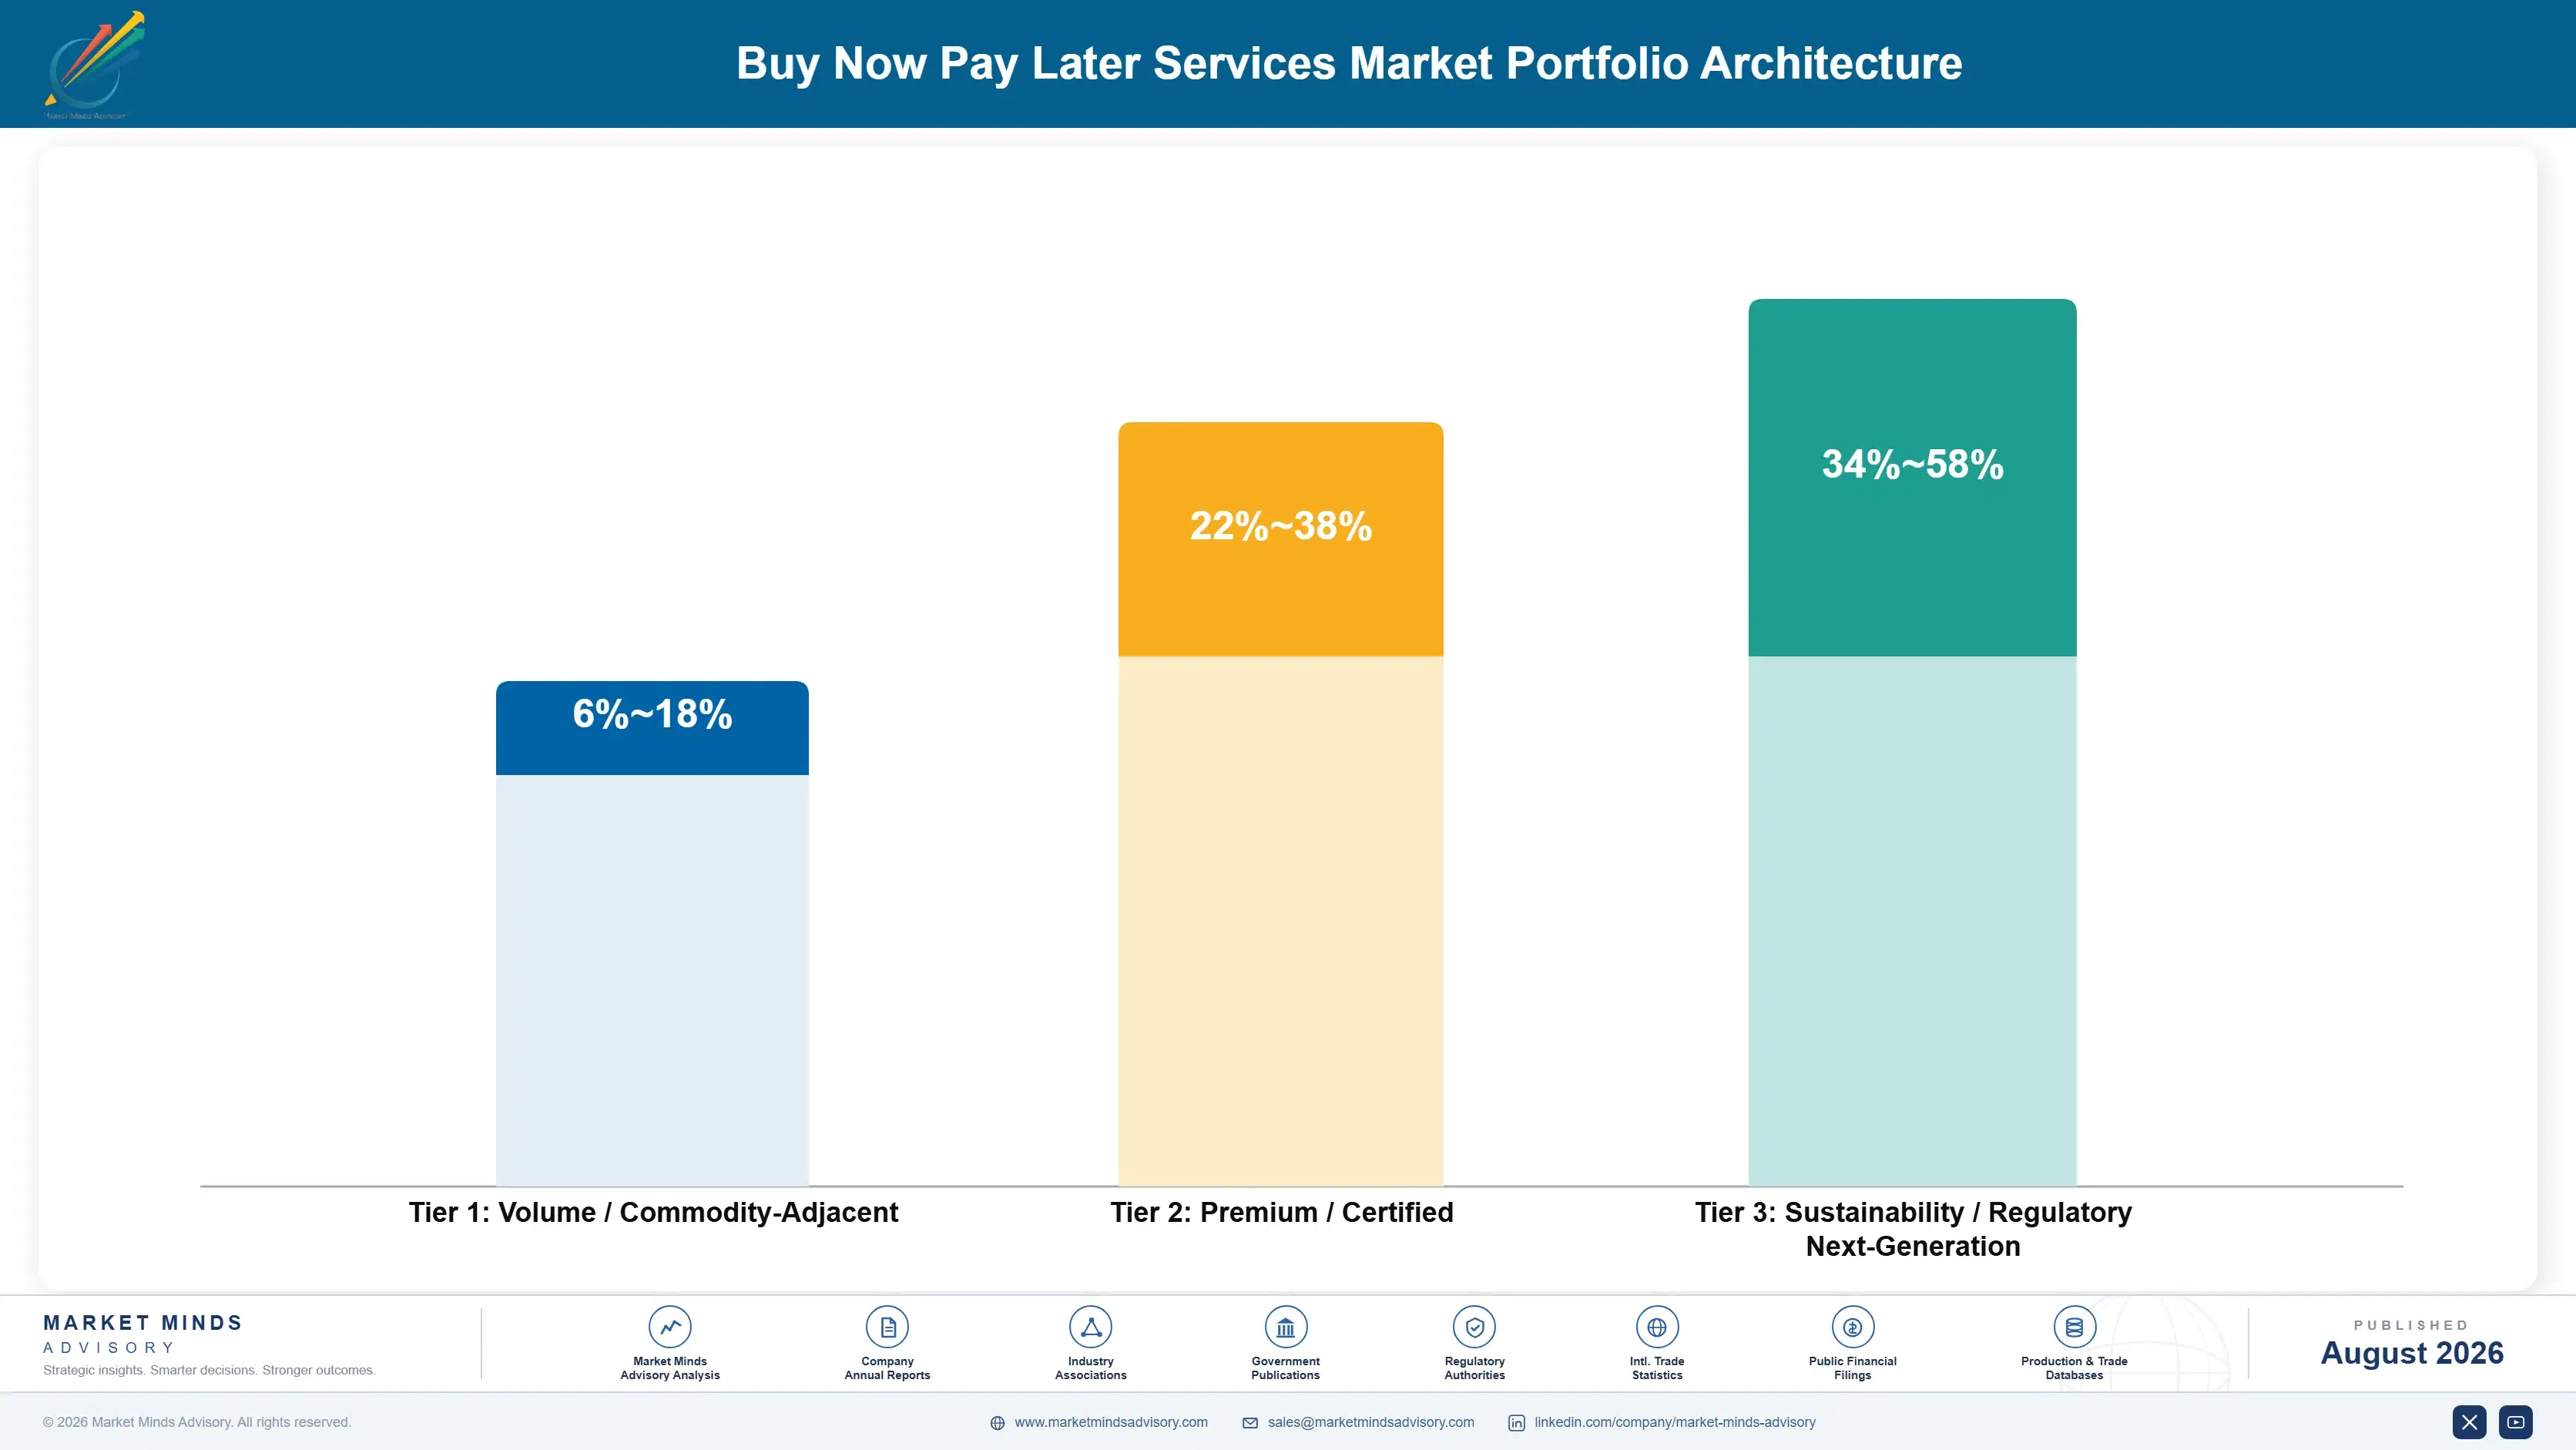
Volume / Commodity-Adjacent

Pay-in-four and virtual card instalments earning a single merchant fee against funding cost that recurs every time capital recycles. The 12-point range separates providers with cheap diversified funding from those on wholesale facilities at market spreads.
Gross Margin: 6-18%

Premium / Certified

In-store, card-linked and merchant-subsidised longer term arrangements carrying lower acquisition cost or retailer-funded interest. The 16-point spread reflects how differently retailer-subsidised and unsubsidised longer terms perform across a rate cycle.
Gross Margin: 22-38%

Sustainability / Regulatory / Next-Generation

Interest-bearing consumer instalments and business deferred payment where borrowers pay toward the funding cost directly. The 24-point range is wide because consumer interest margins and business trade credit economics behave in genuinely different ways.
Gross Margin: 34-58%
buy-now-pay-later-services-market-portfolio-architecture-1787914696780

High-value Sub-segments and Strategic Watch-out

Interest-Bearing Conversion

Highest margin and fastest growth at 18.0%, and the only structure that funds itself once policy rates sit meaningfully above zero at all. The risk is that underwriting for longer exposures needs capability short tenor lending never once developed. Several of them found that out expensively.
Gross Margin: 44-58%

Business Deferred Payment

Strong economics growing at 15.6% on tickets far larger than consumer instalments and against suppliers who have always priced trade credit badly. The risk is that consumer credit capability transfers considerably less well than most providers assumed. And the specialists quietly took those positions meanwhile.
Gross Margin: 38-50%

Pay-In-Four Volume

The volume core, generating brand, merchant relationships and the user base everything else gets sold to eventually. Providers hold it as acquisition, not because a single merchant fee covers repeated funding cost. It is really just acquisition spending with a lending licence attached to it.
Gross Margin: 8-20%

Merchant Fee Dependence

The strategic watch-out. A 4.4% fee against roughly 2% for cards survives only while nobody offers equivalent convenience free. The risk is card issuers doing exactly that on credit lines consumers already hold. And several of the largest ones have already started doing exactly that.
Gross Margin: 4-14%

Habitual Users, Renegotiated Merchants

Annuity characteristics sit with consumers and emphatically not with merchants. A shopper who has used instalments once uses them repeatedly, opening the application before browsing and treating it as a payment method rather than as a loan. That behaviour is genuinely habitual and cheap to maintain. Merchant relationships behave completely differently, coming up for renegotiation annually with fee pressure applied by exactly the retailers generating the most volume.
Stickiness therefore depends on which side a provider has actually built. A consumer base that opens the app first brings traffic merchants will pay for, which is the only durable negotiating position in this category. A provider holding merchant integrations without consumer habit is a checkout button that any competitor can be added alongside. Business deferred payment sticks differently again, through accounting integration and buyer relationships that take real effort to move.

The decision sits in two places and providers keep addressing only one. Merchants choose which options appear at checkout, on conversion evidence and commercial terms. Consumers choose between whatever appears, largely on familiarity rather than on any comparison. Regulation has added a third party, since compliance functions inside merchants now ask affordability questions nobody asked three years ago.
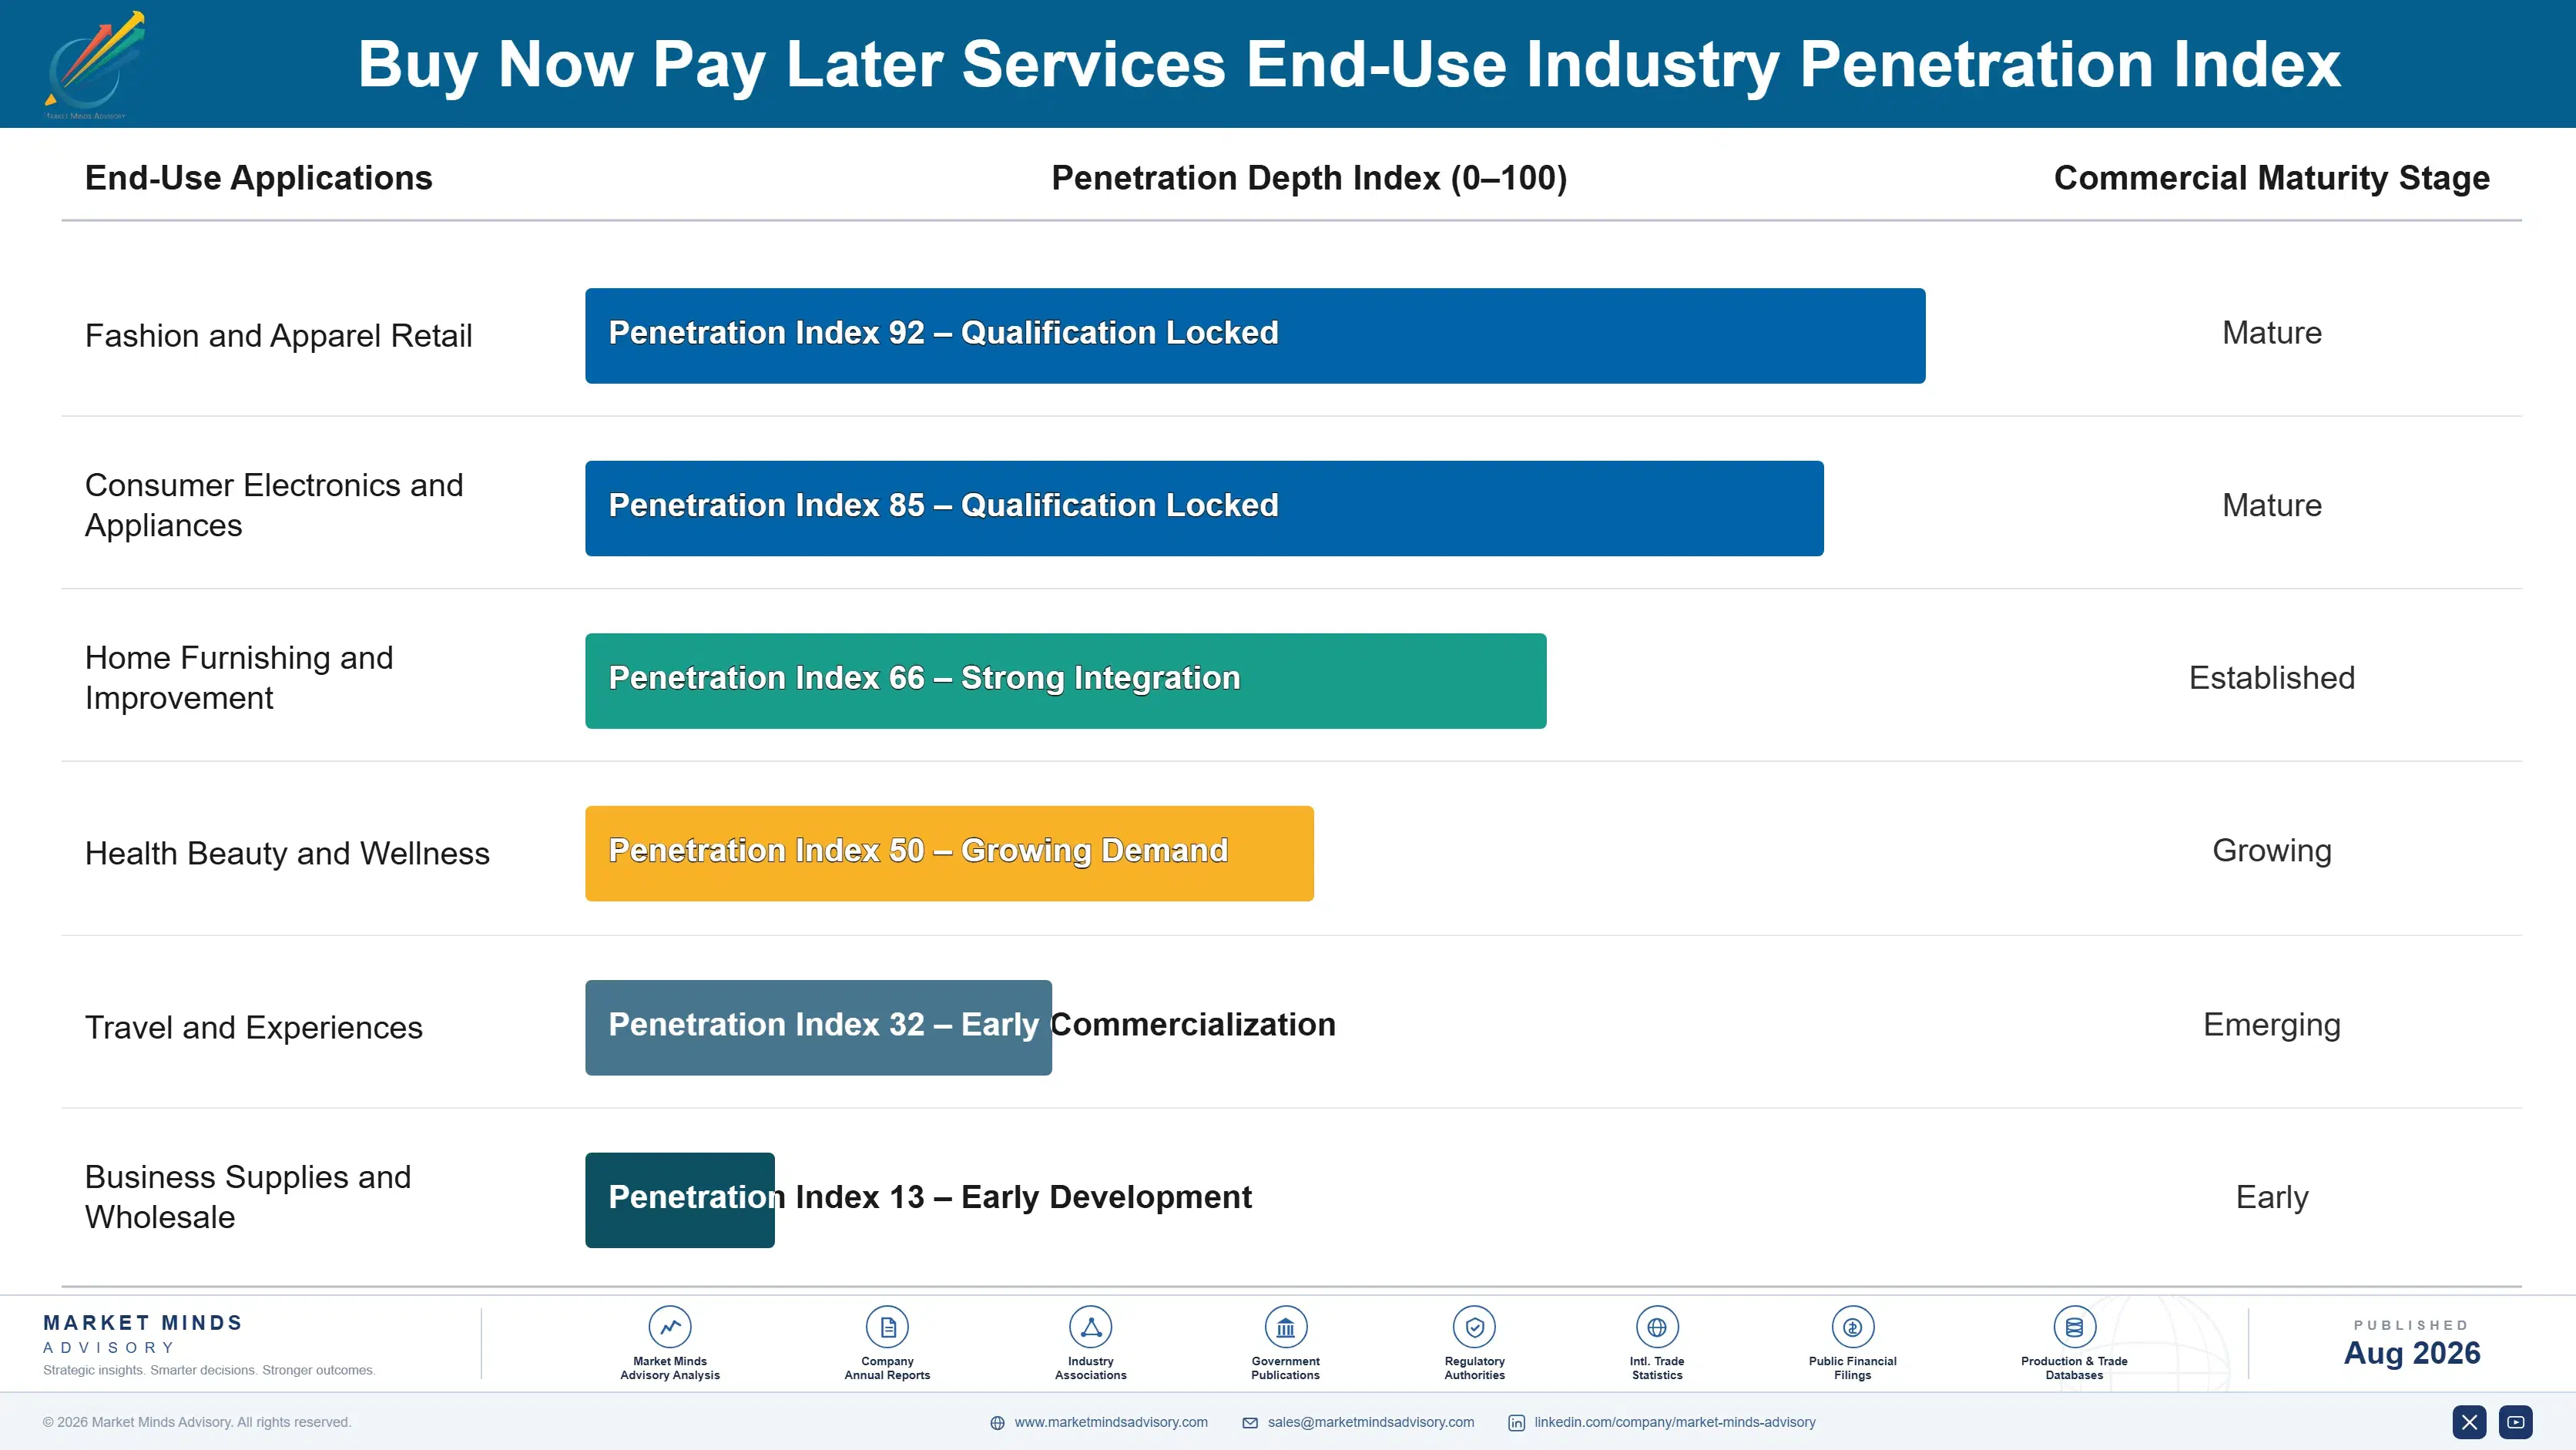
buy-now-pay-later-services-market-end-use-penetration-index-1787914697267

Somebody Has To Pay Interest

These are among the four positions where our research anticipates prominent divergence between winners and laggards over the coming forecast period. Each is grounded in the demand model, the regulatory perimeter, and the announced capacity pipeline.
01 / INTEREST-BEARING CONVERSION DISCIPLINE

The free product cannot fund itself at all

A six week instalment charging the consumer exactly 0% earns a single merchant fee of around 4.4% while funding cost applies every time capital recycles, roughly 8.2 times across a single year, which simply does not work at all once policy rates rise above nothing. Longer interest-bearing arrangements grow at 18.0% precisely because somebody in them actually pays for it. Providers who treat the free product as the business rather than as acquisition are running a marketing service on borrowed money instead.
02 / BUSINESS CREDIT ENTRY

Suppliers have priced trade credit badly forever

Business deferred payment grows at 15.6% a year by taking on credit that suppliers have extended reluctantly and priced very poorly for a whole century, paying those suppliers immediately while carrying both the funding and the credit assessment properly. Ticket sizes run far above consumer instalments and the underwriting turns entirely on company behaviour rather than on any consumer score. Consumer providers assuming their existing credit capability transfers across have found repeatedly that it does not transfer over at all well.
03 / FUNDING STRUCTURE RESILIENCE

Credit quality mattered less than the funding line

Capital turning over roughly 8.2 times a year with no consumer pricing lever available anywhere makes the funding cost translate almost directly through into margin on any short tenor business. Providers dependent on a single warehouse facility found their own capacity withdrawn in 2022 at exactly the moment when they needed it most. Several of them stopped originating altogether, and their credit performance had almost nothing at all to do with which of them actually survived that particular period intact.
04 / CONVERSION EVIDENCE DISCIPLINE

Retailers renegotiate that fee every single year

Merchants here pay around 4.4% against roughly 2% for ordinary card acceptance and they revisit that whole arrangement annually, which means that premium survives only where basket size and completion evidence justify it clearly on the retailer's own transaction data. Providers who argue brand or audience reach are arguing for something that no merchant can independently verify at all. Card issuers now offering instalments entirely free of any merchant cost make gathering all that evidence considerably more urgent than before.

Engagement Snapshot From the Field

A live engagement with an industry participant carrying material or product regulatory and market exposure ahead of a defining policy shift, showing how our research translates into a defensible multi-year portfolio strategy.
MARKET MINDS ADVISORY · CLIENT ENGAGEMENT SUMMARY
Buy Now Pay Later Services Producer Strategic Portfolio Review and Transition Roadmap 2026·Investment Scenario on Buy Now Pay Later Services Exposure Evaluation 2025-26
CLIENT PROFILE
A buy now pay later provider operating across two European markets with reported revenue of 88 million dollars (client-reported, unverified by MMA). Roughly 86% came from short tenor instalments charging consumers nothing. Funding ran through a single warehouse facility and no interest-bearing product existed anywhere in the range at the time of the review at all.
STRATEGIC CHALLENGE
Gross margin had compressed for six consecutive quarters as funding costs rose with no consumer pricing lever, and two large merchants had signalled fee reductions at renewal. Management proposed growing transaction volume to spread fixed costs. That added funding cost on every additional cycle while the revenue per cycle was simultaneously being negotiated downward by the merchants generating it.
MMA APPROACH
MMA rebuilt unit economics per funding cycle rather than per transaction, separating merchant fee from funding, loss and acquisition cost. Twenty-four expert interviews with merchants, warehouse lenders, competing providers and compliance advisers established where margin actually survives. The analysis treated interest-bearing conversion and funding diversification as the routes available, alongside conversion evidence for fee defence.
KEY FINDINGS
  1. Short tenor instalments were contributing negative margin after funding cost at prevailing rates, and the internal reporting measured margin per transaction rather than per funding cycle.
  2. The single warehouse facility carried covenants that would have restricted origination sharply had loss rates moved even modestly against the provider at any point.
  3. No conversion evidence existed for either large merchant, and both were negotiating fee reductions against a benefit that nobody had ever once measured.
  4. Around 31% of the active user base had taken three or more instalment arrangements, which is exactly the population an interest-bearing product would serve.
CLIENT PROFILE
A buy now pay later provider operating across two European markets with reported revenue of 88 million dollars (client-reported, unverified by MMA). Roughly 86% came from short tenor instalments charging consumers nothing. Funding ran through a single warehouse facility and no interest-bearing product existed anywhere in the range at the time of the review at all.
STRATEGIC CHALLENGE
Gross margin had compressed for six consecutive quarters as funding costs rose with no consumer pricing lever, and two large merchants had signalled fee reductions at renewal. Management proposed growing transaction volume to spread fixed costs. That added funding cost on every additional cycle while the revenue per cycle was simultaneously being negotiated downward by the merchants generating it.
MMA APPROACH
MMA rebuilt unit economics per funding cycle rather than per transaction, separating merchant fee from funding, loss and acquisition cost. Twenty-four expert interviews with merchants, warehouse lenders, competing providers and compliance advisers established where margin actually survives. The analysis treated interest-bearing conversion and funding diversification as the routes available, alongside conversion evidence for fee defence.
KEY FINDINGS
  1. Short tenor instalments were contributing negative margin after funding cost at prevailing rates, and the internal reporting measured margin per transaction rather than per funding cycle.
  2. The single warehouse facility carried covenants that would have restricted origination sharply had loss rates moved even modestly against the provider at any point.
  3. No conversion evidence existed for either large merchant, and both were negotiating fee reductions against a benefit that nobody had ever once measured.
  4. Around 31% of the active user base had taken three or more instalment arrangements, which is exactly the population an interest-bearing product would serve.
RECOMMENDED STRATEGY
Phase 1: Phase one: build conversion evidence with both large merchants before renewal, since the fee is being negotiated against an unmeasured benefit. Phase 2: Phase two: launch an interest-bearing longer tenor product to the repeat user base, which is the only revenue that funds itself. Phase 3: Phase three: add a second committed funding facility before growing volume any further under the existing single warehouse line alone.
OUTCOME
Conversion measurement was completed with one merchant and limited the fee reduction agreed at renewal (client-reported, unverified by MMA). An interest-bearing product launched to repeat users and reached early scale within two quarters. A second funding facility was arranged at higher undrawn cost. The volume growth plan was deferred, having proposed adding cycles that lost money on every one.

Frequently Asked Questions

Foundational context covering the market sizes, CAGR, scope, country, region and competition that inform every finding below. This section is provided to cover basics and most often pre-purchase conversations, answered from the MMA Primary Research Dataset.

What is the current size of the Buy Now Pay Later Services Market?

The market was worth 11.6 billion dollars in provider revenue in 2025, comprising merchant fees, consumer interest and account fees. It reaches 12.99 billion dollars in 2026.

How large will the Buy Now Pay Later Services Market be by 2036?

MMA forecasts 40.35 billion dollars by 2036, an increase of 27.36 billion dollars over the 2026 base. That represents an expansion multiple of 3.11 times across the forecast period.

What is the CAGR for the Buy Now Pay Later Services Market 2026 to 2036?

The base case compounds at 12.0% annually. The bull case reaches 13.2% on faster interest-bearing conversion, while the bear case sits at 10.8% if affordability checks suppress checkout conversion.

Which segment is growing fastest?

Longer tenor interest-bearing instalments, at 18.0%, half again the market rate of 12.0%. It is the only structure that funds itself once rates sit above zero.

Who are the major companies in the Buy Now Pay Later Services Market?

Klarna, Affirm, Block, PayPal and Zip Co lead on disclosed instalment revenue. Kredivo, Atome, Tabby and Tamara hold strong regional positions in their own markets.

Which country is growing fastest?

Indonesia at 14.0%, where card penetration never took hold and mobile commerce arrived long before card habits had any real chance to form properly there.

Report Segmentation Architecture

The full report scope spans multiple orthogonal segmentation dimensions, with cross-tabulated demand data provided for each dimension pair. Coverage extends further to regional breakdowns, trend trajectories, and the competitive detail needed to support segment-level decision-making.

By Product Structure

  • Longer Tenor Interest-Bearing Instalments
  • Business-to-Business Deferred Payment
  • Merchant-Subsidised Zero Interest Longer Terms
  • In-Store and Card-Linked Instalments
  • Virtual Card and Anywhere Instalments
  • Pay-in-Four Short Tenor Instalments

By End-Use Industry

  • Fashion and Apparel Retail
  • Consumer Electronics and Appliances
  • Home Furnishing and Improvement
  • Health Beauty and Wellness
  • Travel and Experiences
  • Business Supplies and Wholesale

By Commercial Dimension

  • Enterprise Merchant Direct Integration
  • Platform and Marketplace Distribution
  • Consumer Application Origination
  • Card-Linked and Issuer Partnerships
  • Payment Service Provider Channels
  • Accounting Platform Business Integration

By Region

  • North America
  • Western Europe
  • East Asia
  • South Asia and Pacific
  • Latin America
  • Middle East and Africa
  • Eastern Europe

Scope, Methodology, and Coverage

Every figure in this report is reproducible from documented input assumptions. The scope below maps the historical period, the forecast horizon, the segmentation dimensions, and the countries covered, alongside the underlying primary and qualitative methodology.
Historical Period
2020 to 2025
Forecast Period
2026 to 2036
Base Year
2025 (USD billions; MMA Primary Research Dataset, August 2026)
Market Definition
Scope covers revenue earned by buy now pay later providers globally, spanning longer tenor interest-bearing instalment lending, business-to-business deferred payment arrangements, merchant-subsidised zero interest longer term instalments, in-store and card-linked instalment offers, virtual card and anywhere instalment products, and pay-in-four short tenor instalments. Revenue comprises merchant discount fees, consumer interest charged, late and account fees, and interchange earned on virtual card transactions. General-purpose credit cards and store cards, unsecured personal loans not tied to a specific purchase, motor and mortgage finance, merchant acquiring revenue unconnected to any instalment offer, and platform lending regulated as conventional consumer credit in markets where these products are not distinguished are excluded from the market size and all derived figures.
Quantitative Units
USD billions of provider revenue (current prices); gross merchandise value in USD billions; merchant discount rate as percentage; average tenor in weeks; capital turnover times per year
Segmentation Dimensions
By Product Structure; By End-Use Industry; By Commercial Dimension; By Region
Regions Covered
North America, Western Europe, East Asia, South Asia and Pacific, Latin America, Middle East and Africa, Eastern Europe
Countries Covered
USA, UK, Germany, Sweden, Australia, Indonesia, France, Japan, Canada, Italy, Singapore, Brazil, Mexico, UAE, Poland
Key Companies Profiled
Klarna, Affirm, Block, PayPal, Zip Co, Sezzle, Splitit, Kredivo, Atome, Tabby, Tamara, Scalapay, Alma, Zilch, Postpay, Billie, Hokodo, Mondu, Riverty, Paidy
Quantitative Methodology
Primary survey, n=3,800 respondents, Q4 2025, six countries; demand-side model with trade association cross-validation
Qualitative Methodology
47 expert interviews, Q4 2025; applied to validate demand model assumptions, identify emerging dynamics, and assess competitive positioning
Report Format
PDF and XLSX data workbook (Word format preview document)
Publisher
Market Minds Advisory
Report Code
MMA-2026-TEC-241
Published
August 2026
Contact
sales@marketmindsadvisory.com | www.marketmindsadvisory.com

Purchase the full Buy Now Pay Later Services Market Report (2026 to 2036).

The full report runs to 180 pages and covers all six product structures, seven regions and 20 profiled providers in detail. It includes the complete segment CAGR set, unit economics modelled per funding cycle rather than per transaction, and regulatory reclassification tracked across every major jurisdiction. Company profiles carry evaluation on disclosed buy now pay later revenue including merchant fees and consumer interest, with moat and risk assessment for the top five providers. The competitive section extends to 15 tracked regulatory, funding and product developments across 2024 and 2025. Primary research inputs include a quantitative survey of 3,800 respondents and 47 expert interviews conducted in Q4 2025.
Six product structures with individual CAGR forecasts
Seven regional markets compared on adoption and payment habit
Twenty provider profiles on consistent revenue evaluation basis
Fifteen tracked regulatory and funding developments with commercial interpretation
Unit economics modelled per funding cycle rather than per transaction
Merchant fee sustainability assessed against free issuer alternatives

Built For The People Who Decide

From boardroom strategy to bench-side execution, this report is read cover-to-cover by leaders shaping the next decade of their industry, turning demand scenarios, market dynamics and valuation benchmarks into decisions.
CXOs/ Presidents/ VPs/ Managers
M&A and Corporate Development
Strategy Teams and R&D Heads
Procurement and Product Directors
Regulatory and Compliance Leaders
Investor Relations and Equity Analysts