Market Minds Advisory
Buy Now Pay Later (BNPL) Market

Buy Now Pay Later (BNPL) Market: Buy Now Pay Later (BNPL) Market: Provider Revenue, Funding Economics and Regulatory Outlook 2026 to 2036

Regulation arrived after the growth did. Provider economics now turn on loss rates and funding cost rather than merchant acquisition, and the operators who survived consolidation are the ones with balance sheet discipline.

Lead Analyst

Published

September 2026

Make Smarter Decisions with Customized Research Insights

Request a free sample report and evaluate market opportunities, growth trends, and competitive dynamics relevant to your business needs.

2025 MARKET VALUE$14.8BMarket Size 2025
2036 FORECAST VALUE$53.5BBase Case , 2026 to 2036
CAGR 2026 TO 203612.4 %Bull 13.6% / Bear 11.2%
INCREMENTAL OPPORTUNITY$36.9BNet 10- year value creation
EXPANSION MULTIPLE3.22x2036 value over 2026 base
Strategic Levers
M&A Pipeline
Regional Outlook
Country Rankings
Competitive Intelligence
Segmental Deep-dive
Call-Us : 91 93563 13602

Executive Snapshot and Market Trajectory.

Buy now pay later stopped being a growth story and became a credit business. The 2022 funding correction removed the operators who had priced risk optimistically, and what remains is a smaller field competing on loss performance rather than on merchant sign-ups or app downloads any more.
Provider revenue reaches USD 16.64 billion in 2026 and USD 53.52 billion by 2036, a 3.22 times expansion on a 12.4% rate. B2B trade instalment credit grows at 18.6%, half again the market rate of 12.4%, because business buyers accept underwriting friction that consumers will not. North America and Western Europe together hold 56% of provider revenue, and neither is where the volume growth sits. That gap has widened every year since 2023.
Five providers hold 54% of revenue after a consolidation phase that removed roughly a third of the field. Regulatory treatment as consumer credit in the United Kingdom, Australia and the European Union has raised compliance cost and, more usefully, given surviving operators access to credit bureau data they previously lacked. That trade has favoured scale, and the smaller operators know it. Nobody is buying growth at any price now.
Market Definition
This report covers provider revenue from buy now pay later credit: merchant discount fees, consumer late and account fees, and interest income on instalment balances originated at or immediately after point of sale. It excludes revolving credit card balances, traditional retail store cards, unsecured personal loans not originated at checkout, and the payment processing revenue of acquirers routing BNPL transactions.
Base Year Value
$14.8B in 2025 (MMA Primary Research Dataset, September 2026)
Forecast Period
2026 to 2036, eleven discrete annual values
CAGR
12.4% base case. Bull 13.6%. Bear 11.2%.
Fastest Growth Segment
B2B Trade Instalment Credit: 18.6% CAGR
Fastest Growth Country
India: 17.2% CAGR
Fastest Growth Region
South Asia and Pacific: 14.6% CAGR
Largest Region
North America: 30% of 2025 global value
Market Leaders
Klarna, Affirm, PayPal, Block (Afterpay) and Zip Co lead on originated instalment volume. Source: MMA Analysis.
Primary Survey
n=3,800 procurement and R&D decision-makers, Q4 2025, six countries
Methodology
Demand-side build-up, cross-validated against public data, 47 expert interviews

Buy Now Pay Later (BNPL) Market Forecast Scenarios

buy-now-pay-later-bnpl-platform-market-size-forecast-scenario-1788454903372
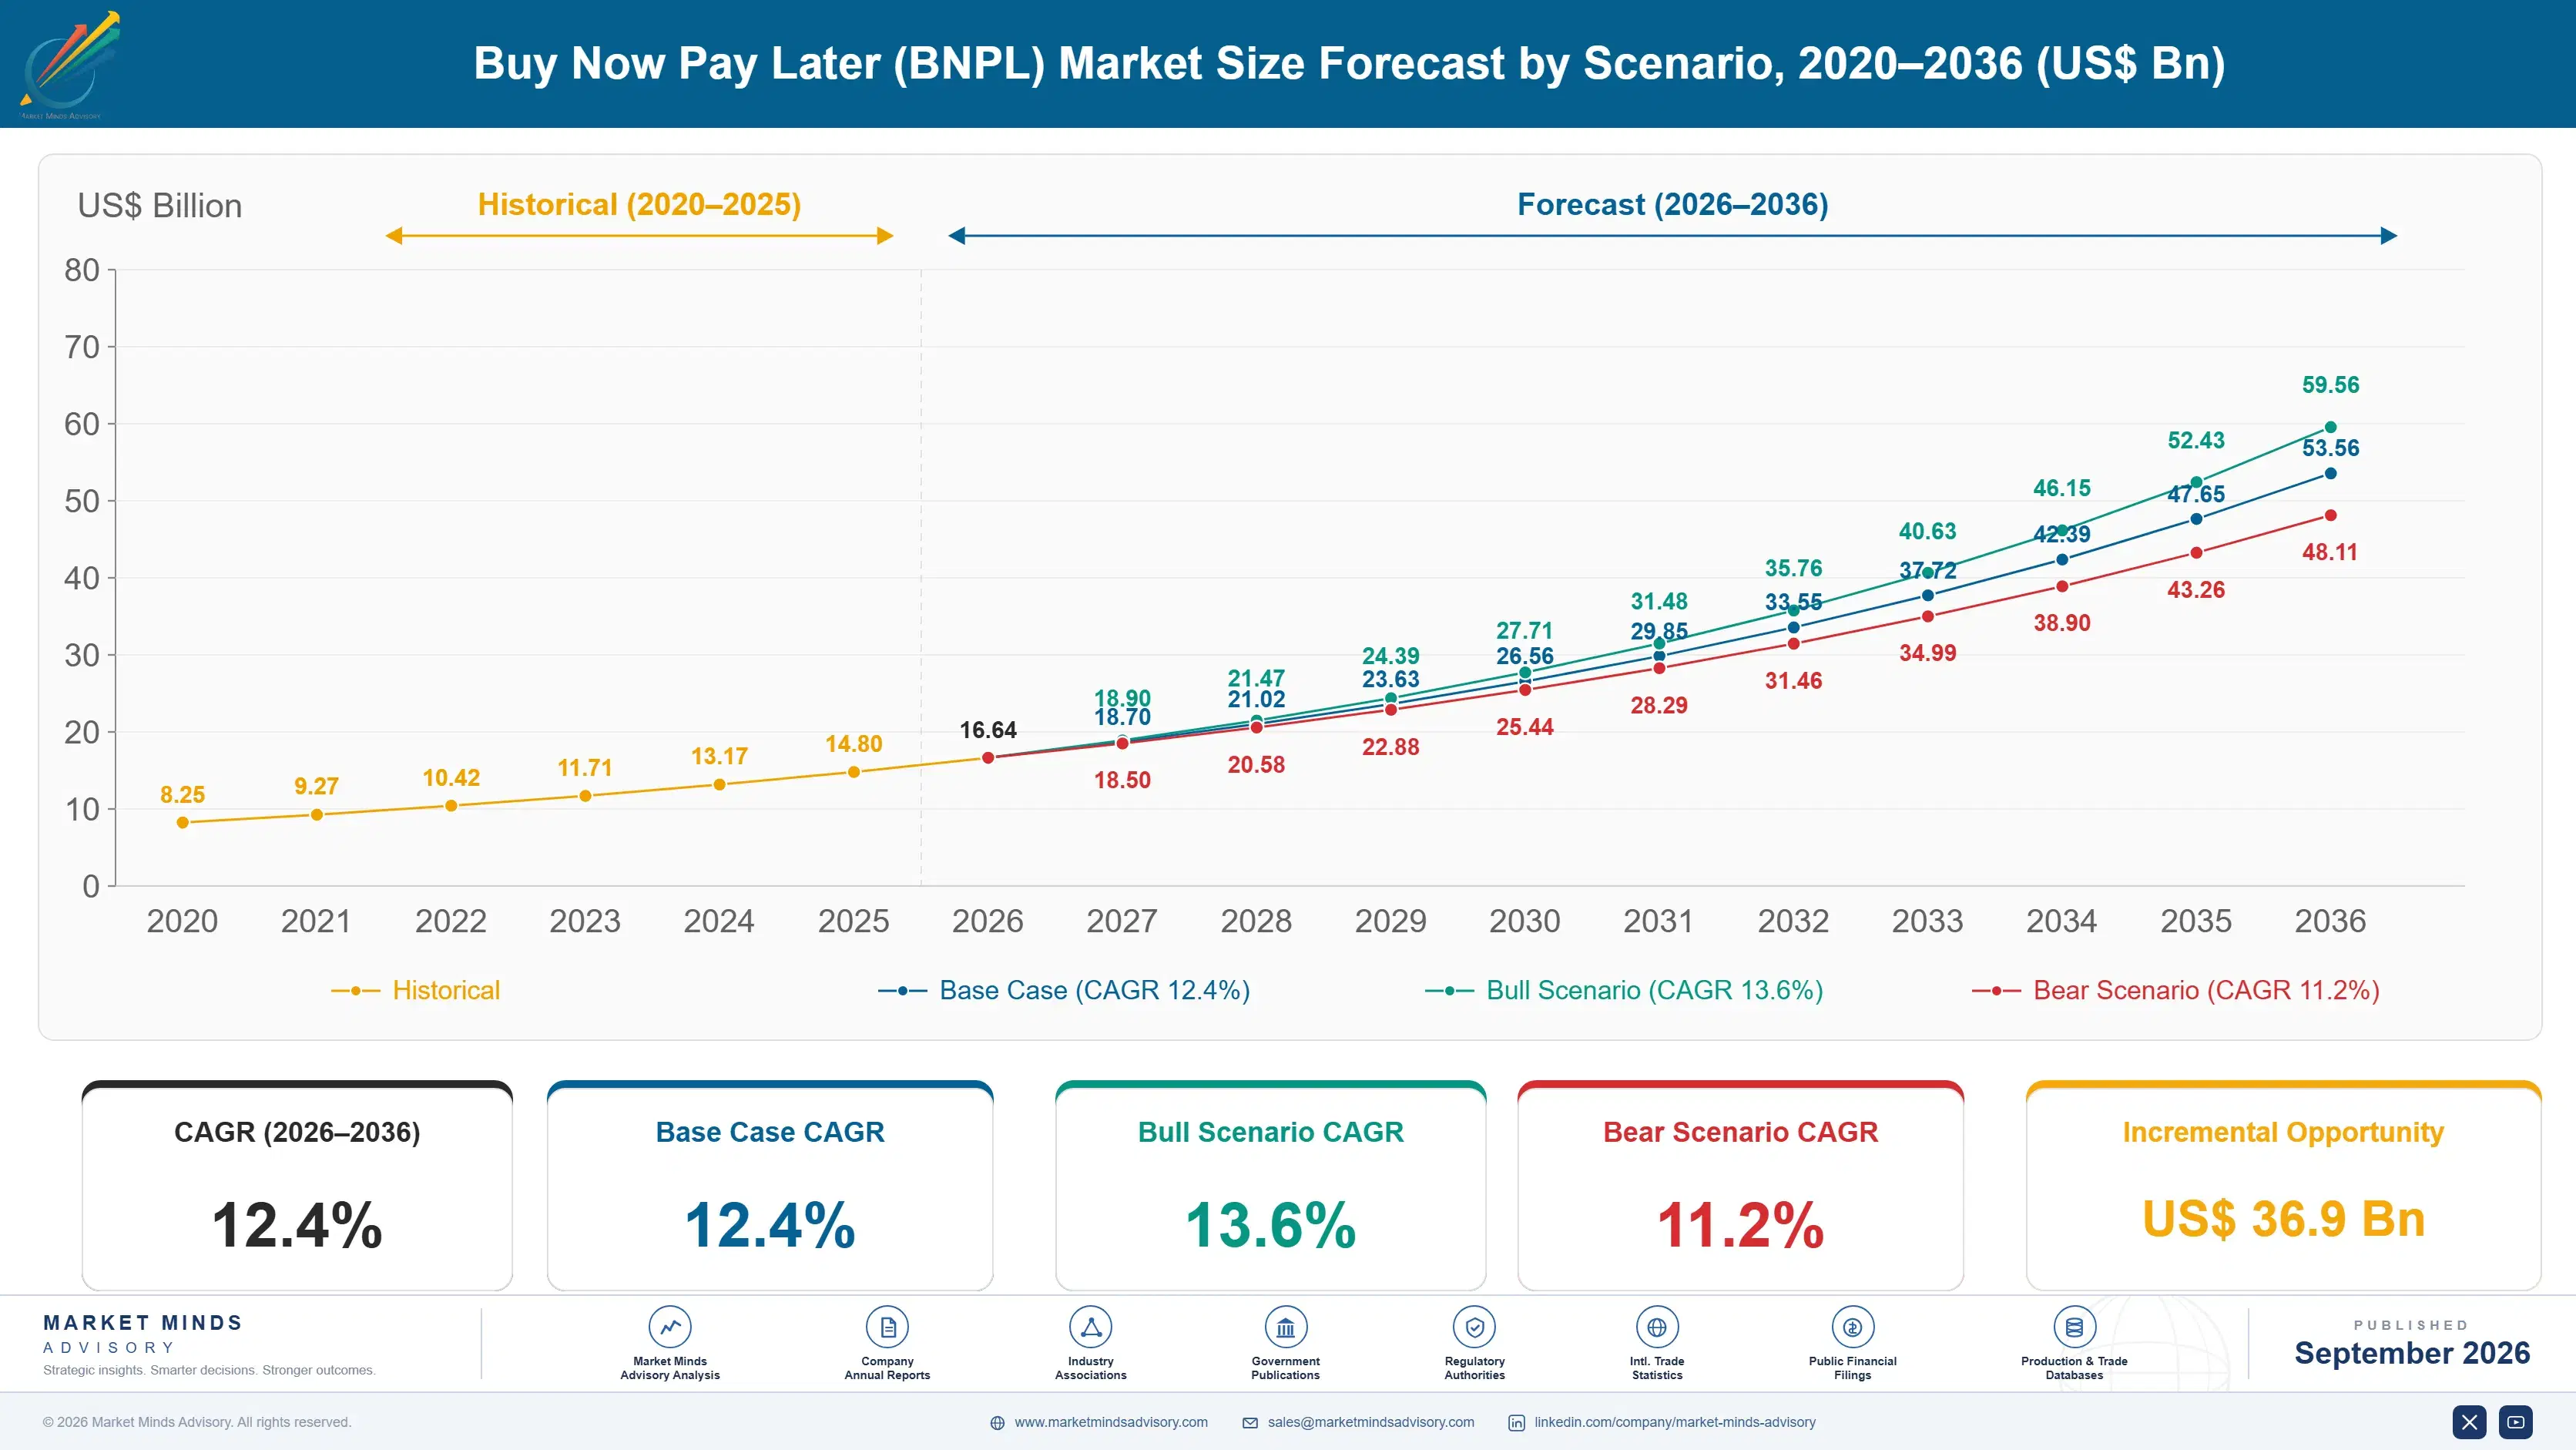
Between 2020 and 2025 the category compounded at 11.2%, a figure that hides two entirely different periods. Volume tripled through 2021 on free capital and no regulatory friction. Then funding cost rose, loss rates surfaced, and valuations fell by 80% or more across the listed operators. The survivors spent 2023 to 2025 rebuilding underwriting rather than chasing merchant logos for a press release.
The base case holds 12.4% on three mechanisms. Merchant demand is stable because BNPL still converts checkout better than any competing option, and merchants pay 4.1% on average for that. B2B trade credit is a genuinely new revenue pool where incumbent invoice financing is slow and expensive. And regulatory clarity in the United Kingdom, Australia and the European Union lets banks and card networks partner rather than wait, which widens distribution without adding acquisition cost.
The bull case at 13.6% turns on B2B adoption running ahead of forecast, since trade instalment credit carries better loss economics and no consumer protection overhead. The bear case at 11.2% is a credit cycle: unemployment rising in the core markets would push loss rates past 4% and force the funding cost that killed the last cohort.

Where BNPL Economics Actually Break Even

The commercial logic of BNPL is simple and frequently misread. A merchant pays 4.1% because instalment checkout lifts conversion and average order value, not because it is cheap. The provider takes that fee, funds the receivable, absorbs the loss, and keeps whatever is left. At a 2.4% net loss rate the arithmetic works. At 4% it does not, which is precisely what happened to a dozen operators in 2022.
TOP FIVE CONCENTRATION54%Consolidated sharply after the funding correction removed weaker operators
AVERAGE ORDER VALUEUSD 172Higher than card checkout across most merchant categories
NET LOSS RATE2.4%The single number that determines whether providers survive downturns
MERCHANT DISCOUNT RATE4.1%Well above card interchange, and merchants keep paying it
REPEAT USAGE RATE71%Users returning within a year, the core retention measure
ECOMMERCE CHECKOUT SHARE6.8%Share of online transactions settled through instalment providers globally
Funding cost is the second variable and it moves independently of anything management controls. Providers financing receivables through warehouse facilities saw their cost of capital roughly triple between 2021 and 2024, which compressed unit economics on every transaction already written. The operators with deposit funding or bank ownership rode that period comfortably. The rest sold themselves or shut down.
What changed after 2023 is that regulators started treating BNPL as credit, and providers stopped fighting it. Reporting to credit bureaux costs money and removes the thin-file advantage that made early growth easy. It also gives providers the data to underwrite properly for the first time, and repeat usage at 71% suggests the customers stayed. Regulation turned out to be a moat.
"The industry spent five years arguing that BNPL was not credit and then spent two years proving that it is. The operators who conceded the point early now have bureau data, bank funding and a regulatory position their competitors cannot buy."
Director, Consumer Credit and Payments Practice · MMA Technology Practice · September 2026

Market Trends

B2B Trade Credit Becomes The Growth Engine

Consumer BNPL is maturing in its core markets and B2B trade instalment credit is not. Business buyers face invoice financing that takes days to approve and prices at rates set for the whole relationship rather than the transaction. Providers including Billie, Hokodo and Mondu underwrite at checkout on company data, settle the merchant immediately, and carry 30 to 90 day terms. Loss rates run below consumer books because business buyers have registered accounts and traceable trading histories. The pool is large and almost entirely unserved by the incumbents who dominate consumer instalment lending.
Market Impact: Merchant churn below 8% annually

Bank And Card Network Partnerships Replace Direct Competition

Visa and Mastercard both built instalment rails into their networks and then discovered that issuing banks would rather partner with an established provider than underwrite consumer instalments themselves. What emerged is a distribution layer: the provider supplies underwriting and collections, the bank supplies funding at deposit cost, and the network supplies acceptance at every merchant already taking cards. Klarna, Affirm and Zip all run programmes on this model. It removes the merchant acquisition cost that consumed the early growth capital, and it gives providers a funding advantage they could not build alone.
Market Impact: Loss rates down to 2.4%

Market Opportunities and Growth Drivers

Merchant Conversion Uplift Justifies A 4.1% Fee

Merchants do not adopt BNPL out of enthusiasm for consumer credit. They adopt it because instalment checkout raises completion rates on abandoned baskets and lifts average order value to around USD 172, well above card checkout in the same categories. At a 4.1% merchant discount rate the maths still works for anything with gross margin above 30%, which covers apparel, furniture, electronics, travel and most of specialty retail. That calculation has held through two rate cycles and a regulatory tightening, which is why merchant churn stays low even as provider economics have moved against the category.
Market Impact: Funding cost tripled since 2021

Credit Bureau Reporting Improves Underwriting Precision Materially

Until roughly 2023 most BNPL providers underwrote on internal signals alone: purchase history, device data, and whatever the merchant passed through. That was adequate while the books were young and terrible once borrowers held four instalment plans across four providers simultaneously. Mandatory bureau reporting in the United Kingdom and Australia, and voluntary reporting elsewhere, made that stacking visible. Providers with two years of bureau-linked performance data now decline applications they would previously have approved, and net loss rates across the listed operators fell to around 2.4%. Better data is worth more than better pricing here.
Market Impact: Compliance cost up 3 times

Market Restraints and Challenges

Funding Cost Volatility Determines Which Providers Survive

BNPL receivables have to be funded before the merchant is paid, and most providers do that through warehouse facilities priced off short-term rates. When those rates moved between 2021 and 2024, cost of capital for non-bank operators roughly tripled while merchant discount rates stayed flat, because merchants will not accept repricing mid-contract. The root cause is a funding model built during a period when capital was effectively free. Mitigation is under way: Klarna operates a licensed bank, Block funds through its own balance sheet, and several mid-size operators have sold forward flow agreements to insurers seeking yield.
Market Impact: B2B pool growing 18.6% annually

Consumer Credit Regulation Raises Compliance Cost Sharply

The United Kingdom brought BNPL under Financial Conduct Authority regulation, the European Union folded it into the revised Consumer Credit Directive, and Australia legislated it as credit in 2024. Each requires affordability assessment, disclosure, complaints handling and hardship processes that the early product deliberately avoided. The root cause is that BNPL grew by exploiting an exemption written for interest-free short-term credit and then scaled past what that exemption contemplated. Compliance adds meaningful fixed cost, which falls hardest on operators below roughly USD 500 million in originated volume. Several have responded by selling to banks rather than building the function.
Market Impact: Cuts acquisition cost roughly 40%
3 additional market trends, 4 additional growth drivers, and 2 additional restraints and challenges are covered in the full report. Contact sales@marketmindsadvisory.com to access the complete intelligence.

Segment CAGR and Growth Architecture

Segmentation follows instalment product structure, since that determines underwriting method, funding duration and revenue model. Six product types cover the market: pay-in-four interest-free, interest-bearing instalment loans, B2B trade instalment credit, card-linked post-purchase instalments, subscription and recurring payment plans, and virtual card single-use instalments. Merchant category and geography are treated as separate analytical dimensions throughout this report.
buy-now-pay-later-bnpl-platform-market-market-share-analysis-1788454903903

B2B Trade Instalment Credit

B2B trade instalment credit grows at 18.6%, half again the market rate of 12.4%, and it is the only segment where the addressable pool is genuinely unserved. Business buyers on wholesale platforms and trade marketplaces need 30 to 90 day terms and currently get either nothing or an invoice financing arrangement priced for the whole relationship. Providers underwrite the buying company at checkout using registry and trading data, settle the seller immediately, and collect on terms. Loss rates run materially below consumer books. Average transaction values sit several multiples higher, which improves unit economics on a fixed underwriting cost. The constraint is integration depth: marketplaces have to expose company identity data, and many have not.
CAGR 18.6%

Card-Linked Post-Purchase Instalments

Card-linked post-purchase instalments let a cardholder convert a completed transaction into an instalment plan after the fact, usually within the issuer app. It grows at 17.4% because distribution costs almost nothing: the customer relationship, the acceptance footprint and the funding already exist inside the bank. Visa and Mastercard both operate rails supporting it, and issuers across North America, Western Europe and Japan have deployed programmes. The economics differ from merchant-funded BNPL, since the consumer pays interest rather than the merchant paying a discount rate. That makes it a lending product wearing instalment clothing, and it competes directly with revolving balances the issuer already earns on, which is a tension issuers have not resolved.
CAGR 17.4%
Full segment breakdown across 6 segments available in the complete report.

Regional Architecture and Country Demand Map

Provider revenue concentrates where regulation defined BNPL as a distinct product rather than folding it into existing consumer credit. North America and Western Europe hold 56% between them. East Asia looks small only because its instalment credit runs through wallet-embedded lines counted elsewhere in the consumer credit statistics.

North America

The United States holds the largest single pool of provider revenue, and it got there without a dedicated BNPL regulation, which is unusual. The Consumer Financial Protection Bureau applied existing credit card rules to pay-in-four in 2024, which imposed dispute rights and disclosure without creating a new licensing regime. Affirm, Klarna, PayPal and Block all originate at scale here, and the merchant base is dense enough that acquisition is largely finished. Growth at 11.4% now comes from card-linked programmes with issuers rather than from new merchant sign-ups. Canada runs smaller and follows the same pattern with a lag of roughly two years. Neither market is where the next decade of volume growth will come from.
Share: 30% | CAGR: 11.4% (2026 to 2036)

Western Europe

Sweden invented this product, and Western Europe still carries the deepest penetration of any region. Klarna, Alma, Scalapay, Oney and Cofidis operate across markets where invoice-first payment was normal long before BNPL had a name, particularly Germany and the Nordics. The revised Consumer Credit Directive brings affordability assessment and disclosure obligations into force across member states, which raises compliance cost and consolidates share toward operators already holding banking licences. Growth at 10.6% is the slowest of any region because penetration is already high; the volume is there, the incremental customer is not. Merchant churn across the region runs below 8% annually. Providers here compete on funding cost rather than on acceptance footprint.
Share: 26% | CAGR: 10.6% (2026 to 2036)
Regional intelligence for 5 additional markets available in the complete report: East Asia, South Asia and Pacific, Latin America, Middle East and Africa, Eastern Europe. Contact sales@marketmindsadvisory.com.
buy-now-pay-later-bnpl-platform-market-country-cagr-analysis-1788454904427

Where Provider Margin Actually Comes From

Provider profitability in this category is a function of four controllable variables: funding cost, loss rate, merchant fee retention and cost to acquire. Growth in originated volume is not one of them, which is the lesson the 2022 cohort paid for. The levers below address each variable directly rather than through volume expansion, which solves nothing here.

Move Funding Onto A Licensed Deposit Base

Warehouse funding priced off short-term rates roughly tripled in cost between 2021 and 2024 while merchant discount rates held flat at around 4.1%. Providers that obtained a banking licence or sold to a bank now fund receivables at deposit cost, which is a difference worth roughly 200 to 300 basis points on every transaction written. Klarna took this route in Sweden, Block funds through its own balance sheet, and several European operators have accepted acquisition rather than build the function. The licence takes years and the capital requirement is real, so that decision belongs before the funding cycle turns.
Market Impact: Saves roughly 250 basis points on every transaction

Report To Credit Bureaux Before Regulators Require It

Voluntary bureau reporting looks like giving away competitive information and is in fact the cheapest loss reduction available. Providers that began reporting and consuming bureau data before mandates arrived cut net loss rates by roughly 60 to 80 basis points within four quarters, because plan stacking across four competing providers becomes visible at application. The cost is integration work and the loss of thin-file customers who were never profitable. Operators that waited for the United Kingdom and Australian mandates arrived with two fewer years of performance data and worse models. Underwriting quality compounds, and the head start does not close.
Market Impact: Cuts net loss rate by around 70 points

Build B2B Origination On Existing Consumer Infrastructure

The underwriting engine, collections operation and merchant integration built for consumer BNPL transfer directly to B2B trade credit, and the segment grows at 18.6% against 12.4% for the market. Average transaction values run 5 to 15 times higher, which spreads a fixed underwriting cost across far more revenue. Loss rates sit below consumer books because company registry data, filed accounts and trading history are all available where a consumer offers a phone number and a purchase history. The barrier is commercial rather than technical: wholesale marketplaces must expose company identity at checkout, which requires a partnership rather than a plugin.
Market Impact: Adds a revenue pool growing 18.6% each year

Sell Distribution To Issuers Rather Than Competing

Card-linked post-purchase instalments grow at 17.4% and cost almost nothing to distribute, because the issuer already holds the customer, the acceptance footprint and deposit funding. A provider supplying underwriting, servicing and collections into an issuer programme earns a fee without carrying the receivable or the acquisition cost, which removes roughly 40% of the cost base on that volume. The trade is margin per transaction against volume and capital efficiency. Providers still trying to win those customers directly are paying to acquire people their partner already banks, which is the least defensible position available in this market.
Market Impact: Removes roughly 40% of the cost base entirely

Who Controls the Margin Pool

Five providers hold 54% of originated instalment volume, and the gap to the rest is wider than that figure suggests. Klarna and Affirm operate at a scale where funding terms, bureau data depth and merchant integration all compound. Below them sit roughly a dozen regional operators competing on single markets, and below those a long tail that consolidation has been steadily removing since 2022. All participants here are assessed on originated instalment volume.
Competition now runs on funding cost and loss performance rather than merchant coverage, which is a complete reversal from 2021. Providers with banking licences or bank ownership fund cheaply and can price patiently. Merchant acquisition has largely finished in North America and Western Europe, so the contested ground is issuer partnerships, B2B marketplace integrations and the emerging markets where nobody has yet demonstrated sustainable unit economics.

Rankings will shift where B2B origination scales, because the specialists there have no consumer regulatory burden and better loss economics. Banks and card networks are the other pressure: they can distribute instalment credit at deposit cost through existing relationships. The providers most at risk are mid-size consumer-only operators without a licence, and there are still too many of those.
buy-now-pay-later-bnpl-platform-market-company-positioning-matrix-1788454904946

Competitive Moat and Risk Dimensions

KLARNA

Moat: Licensed Bank Funding Base

Klarna holds a Swedish banking licence and funds much of its receivables through customer deposits rather than warehouse facilities. That difference was worth hundreds of basis points through the 2022 to 2024 rate cycle, when non-bank competitors watched their cost of capital triple while merchant discount rates stayed flat. The licence also carries supervisory credibility in newly regulating markets.
KLARNA

Risk: Concentrated European Market Exposure

Most of Klarna's originated volume sits in Western Europe and the United States, and the European portion faces the revised Consumer Credit Directive simultaneously across member states. Compliance cost lands in one wave rather than market by market. The Swedish and German core markets also carry the highest penetration anywhere, so incremental growth depends on wallet share, not new customers.
AFFIRM

Moat: Longer-Term Underwriting Track Record

Affirm built its book around interest-bearing instalment loans of six to thirty-six months rather than pay-in-four, reporting to credit bureaux years before anyone required it. The resulting performance dataset covers full credit cycles at durations where losses actually emerge. Competitors moving into longer tenors underwrite those durations for the first time, and that gap takes years, not quarters, to close.
AFFIRM

Risk: Heavy United States Concentration

Affirm originates overwhelmingly in the United States, with limited presence elsewhere. That concentration exposes it to a single credit cycle and a single regulatory posture, and the Consumer Financial Protection Bureau's approach has shifted more than once. International expansion into markets where Klarna and local operators are established requires either acquisition or years of merchant integration work.

Players Tracked

Prominent Players

Klarna
Affirm
PayPal
Block (Afterpay)
Zip Co

Other Key Players

Sezzle
Splitit
Scalapay
Alma
Younited
Cofidis
Oney
Santander Consumer Finance
Atome
Kredivo
Akulaku
Tamara
Tabby
Simpl
Billie

Recent Developments

MARCH 2025

Klarna Files For United States Public Listing

Klarna filed publicly for a United States listing, disclosing full-year profitability after two years of restructuring and a valuation reset of roughly 85% from its 2021 private peak. The filing set out deposit funding levels and net loss rates that competitors had not previously been able to see.
Signal: Public market discipline forced the profitability the private funding round never did, and the disclosure resets competitive benchmarks.
JUNE 2024

Australia Legislates BNPL As Regulated Consumer Credit

Australia passed amendments bringing buy now pay later under the National Consumer Credit Protection Act, requiring providers to hold a credit licence and conduct affordability assessment. Implementation ran through 2025, making Australia the first major market to regulate the product comprehensively rather than by extension.
Signal: The regulatory template other jurisdictions copy, and the compliance cost that pushes smaller operators toward acquisition.
NOVEMBER 2024

PayPal Expands Card-Linked Instalment Programme With Issuers

PayPal extended its instalment offering through partnerships with card issuers in North America and Western Europe, allowing cardholders to convert completed transactions into instalment plans within the issuer application rather than at merchant checkout. The arrangement is a distribution agreement, not a joint venture or an acquisition.
Signal: Distribution through issuers removes acquisition cost entirely, and it puts providers into partnership with their nearest competitors.

What Actually Sits Inside Provider COGS

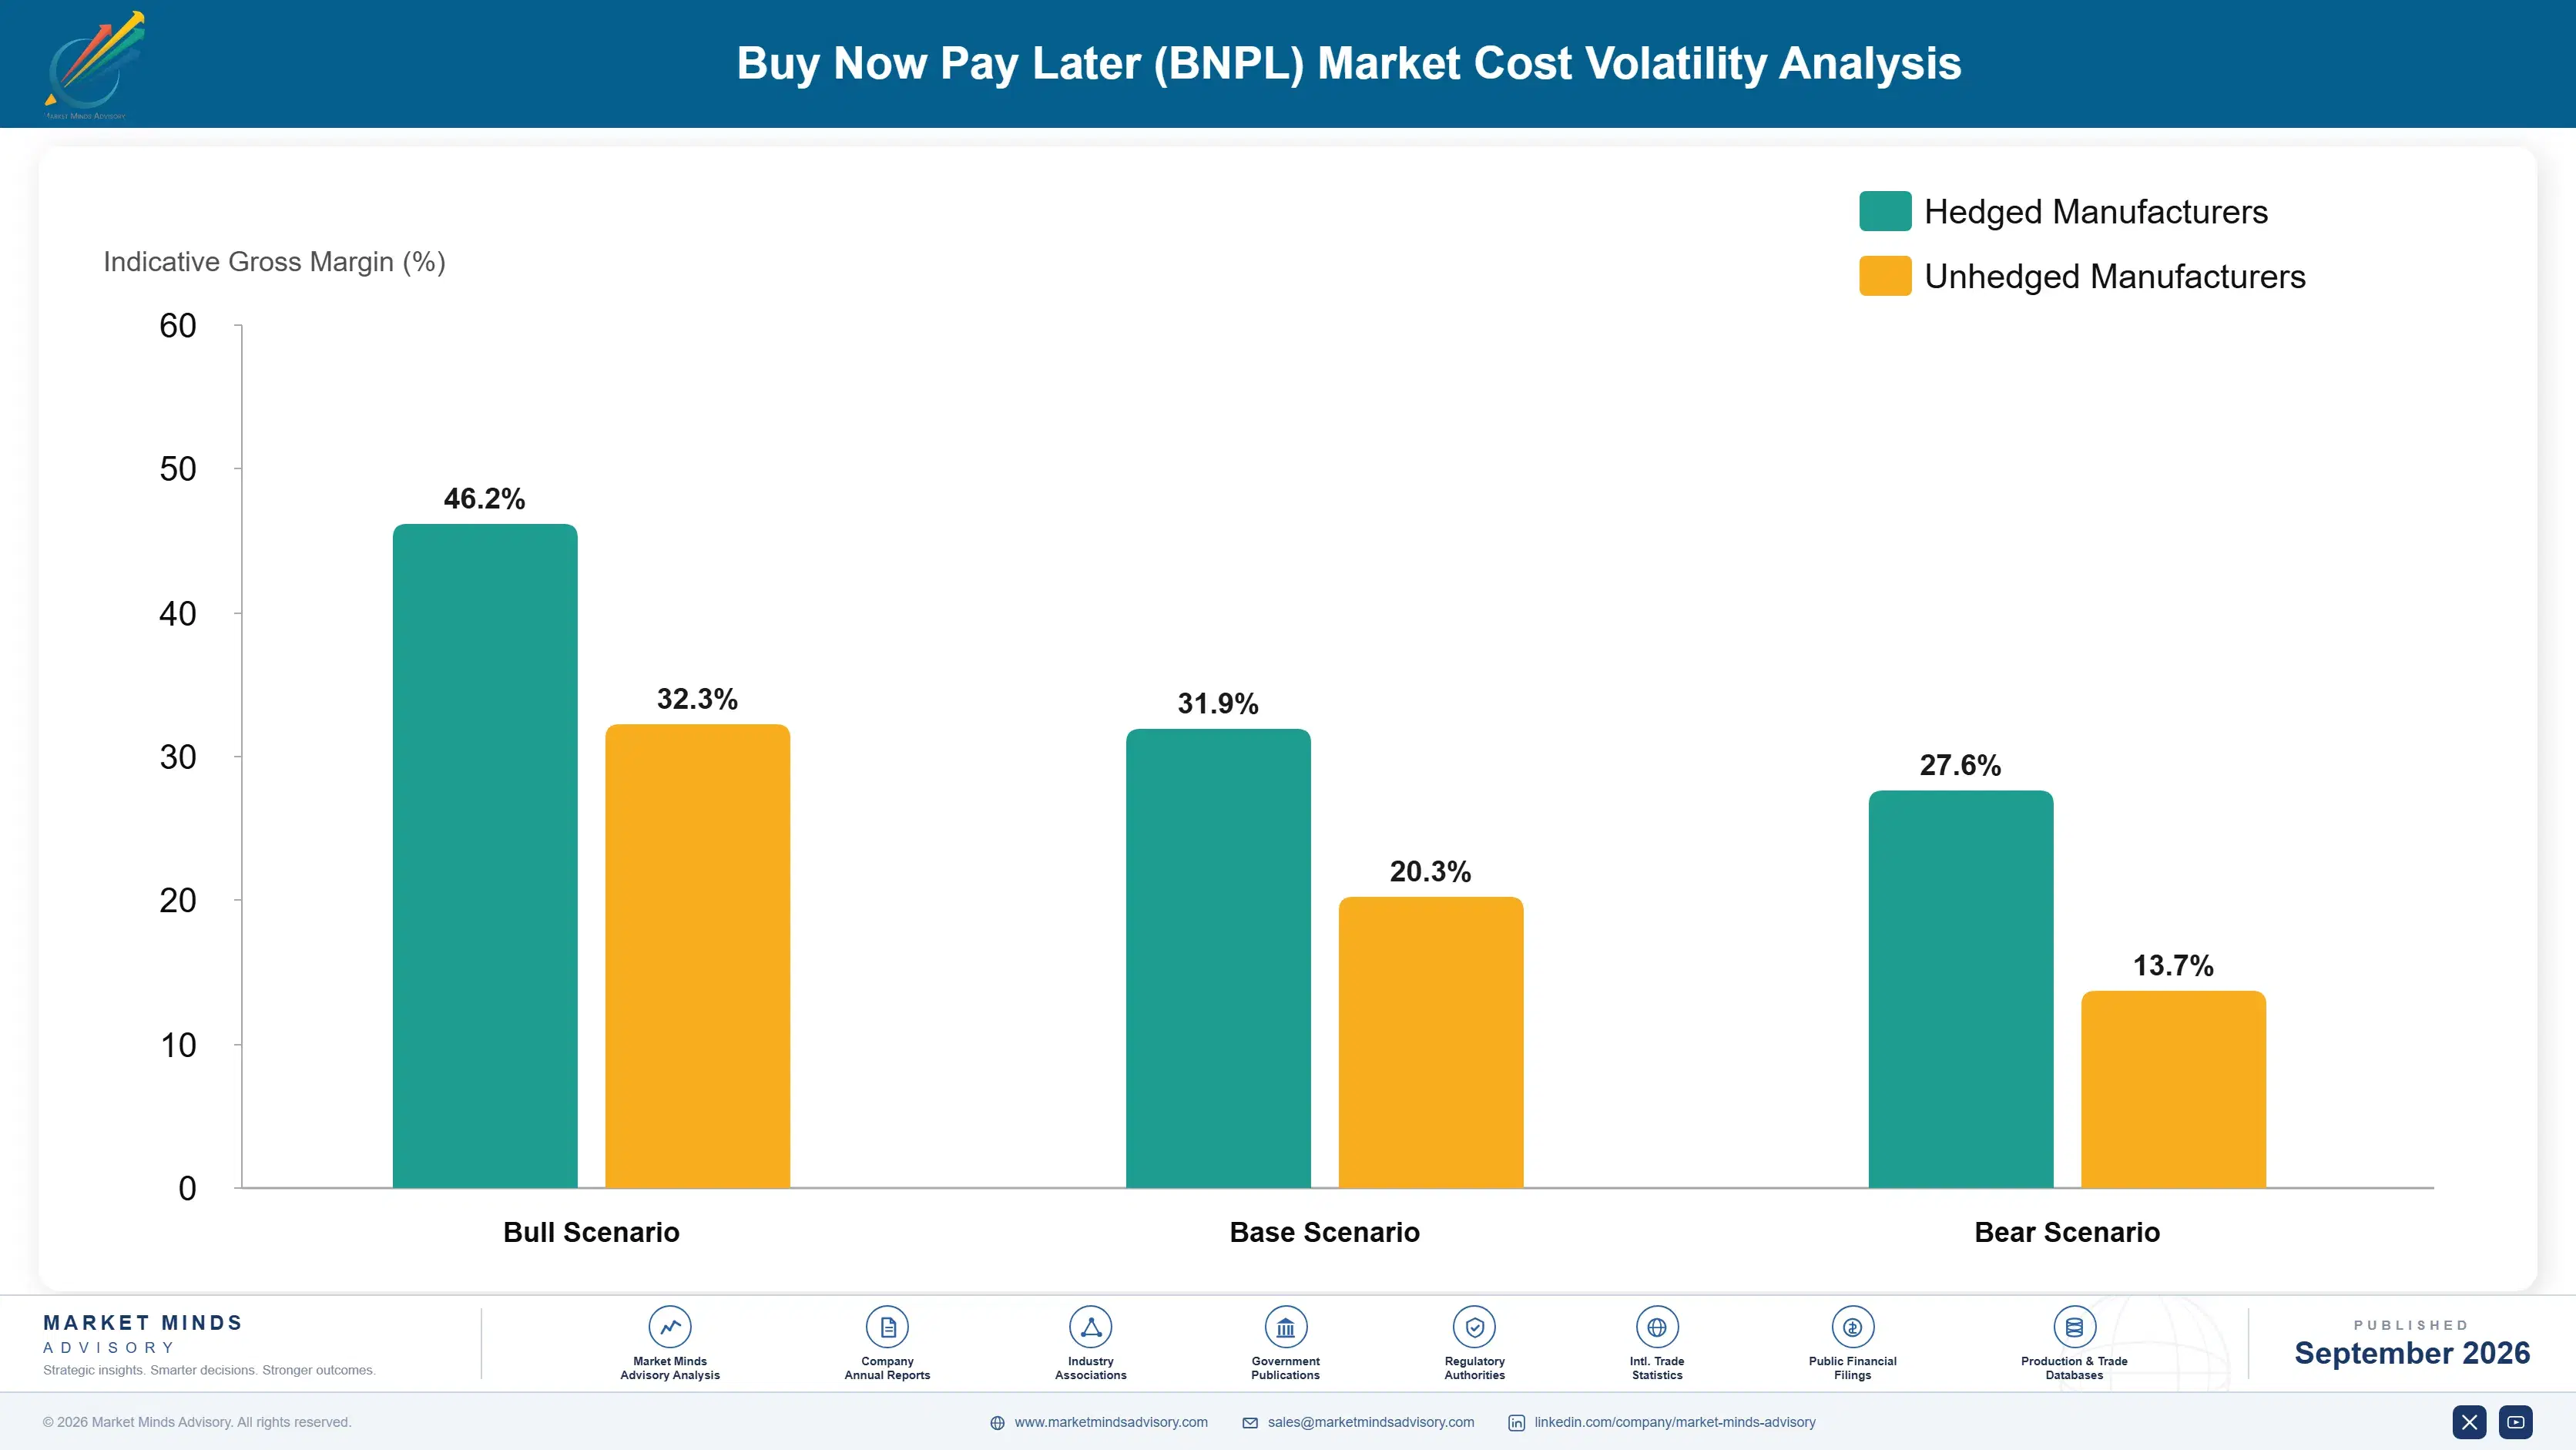
Cost of funds is the dominant input, running 35% to 45% of provider cost of revenue depending on funding structure, and it originates in wholesale credit markets for non-bank operators and in customer deposits for licensed ones. Credit losses account for a further 25% to 35%. Payment processing and merchant settlement costs contribute around 12%, sourced from acquirers and card networks.
Affirm's Annual Report 2024 sets out the mechanism plainly: funding costs rose across the industry as benchmark rates moved from near zero through 2022 and 2023, and providers holding receivables on warehouse facilities absorbed that directly. Klarna's Annual Report 2023 shows the same pressure resolved differently, through deposit funding. Merchant discount rates did not move to compensate, because merchant contracts run for years and repricing mid-term destroys the relationship the whole model depends on.

The competitive disadvantage mechanism is simple: two providers writing identical loans at identical loss rates earn different margins purely on where the money came from. The funding and loss ranges above are wide because bank-owned and independent operators sit at opposite ends of both. Independent operators in emerging markets carry the worst of it, funding at wholesale rates against books with higher losses.
buy-now-pay-later-bnpl-platform-market-cost-volatility-analysis-1788454905142

Diversify Funding Across Deposits, Forward Flow And Securitisation

Single-source warehouse funding is what removed the 2022 cohort. Operators now run three or four channels in parallel: deposits where a licence exists, forward flow agreements sold to insurers and credit funds seeking yield, and securitisation for seasoned receivables. Each prices differently through a cycle, and the blend holds cost of funds considerably steadier than any one channel manages alone.

Consume Bureau Data Rather Than Merely Reporting To It

Reporting to credit bureaux satisfies a regulator. Consuming bureau data at the application decision is what actually cuts losses, because plan stacking across competing providers only becomes visible from the outside. Operators doing both cut net loss rates by 60 to 80 basis points inside four quarters. Ongoing data cost is a fraction of the losses avoided.

Shift Volume Mix Toward B2B And Issuer Programmes

Consumer pay-in-four carries the highest loss rates, the heaviest regulatory overhead and the thinnest margin. B2B trade credit and issuer-distributed card-linked instalments both improve the blend: better loss economics on one side, no acquisition cost or balance sheet on the other. Providers actively rebalancing mix report cost of revenue improving faster than any pricing action would have achieved.

Portfolio Architecture for Margin Defence

Margin separates on funding cost and loss rate rather than on product sophistication, which makes the tier architecture unusually simple here. Commodity pay-in-four sits at the bottom: heavily competed, now regulated as consumer credit in three major markets, and dependent on a merchant fee that no single provider controls. Longer-duration and certified products earn on tenor and relationship depth. The top tier earns on distribution partnerships and on segments nobody else has underwritten yet.
The volume versus premium tension here is sharper than in most industries because volume actively destroys margin. Every additional pay-in-four transaction consumes funding capacity and adds loss exposure at a fee the merchant negotiated downward last renewal. Providers that grew originated volume fastest through 2021 were the ones that failed first. The operators still standing deliberately turned volume away from 2023, and their margin recovered while their reported growth looked unimpressive.

High-value pools concentrate in B2B trade credit and issuer distribution, both of which sit outside the consumer regulatory perimeter and away from the merchant fee negotiation. Neither is large yet. Both compound at rates well above the market, and both reward the underwriting infrastructure that consumer BNPL paid to build.

Volume / Commodity-Adjacent

Consumer pay-in-four at standard merchant discount rates, where margin depends entirely on funding cost and loss performance. The eight point spread reflects the funding structure gap between bank-owned and independent operators.
Gross Margin: 18% to 26%

Premium / Certified

Interest-bearing instalment loans of six to thirty-six months, written by providers holding credit licences. Consumers pay interest, which removes dependence on merchant fee negotiation. The eight point spread tracks tenor mix and underwriting maturity across operators.
Gross Margin: 32% to 40%

Sustainability / Regulatory / Next-Generation

B2B trade instalment credit and issuer-distributed card-linked programmes. Both carry lower losses and no acquisition cost. The ten point spread reflects how few operators have scaled either, so reported margins vary widely by book maturity.
Gross Margin: 44% to 54%
buy-now-pay-later-bnpl-platform-market-portfolio-architecture-1788454905645

High-value Sub-segments and Strategic Watch-out

B2B Trade Instalment Credit

Grows at 18.6% with loss rates below consumer books and no consumer credit regulatory overhead. Average transaction values run several multiples higher, spreading fixed underwriting cost. The ten point margin spread reflects how little of this book has yet seasoned through a full credit cycle anywhere.
Gross Margin: 46% to 56%

Interest-Bearing Instalment Loans

Grows at 15.8% and earns from the consumer rather than the merchant, which removes the fee negotiation entirely. Requires a credit licence and genuine duration underwriting. The eight point spread separates operators with cycle-tested data from those migrating up from pay-in-four for the first time.
Gross Margin: 32% to 40%

Consumer Pay-In-Four Instalments

Grows at 9.6% and still carries most of the originated volume in every developed market. Nobody makes money here without cheap funding. The eight point spread is almost entirely a funding structure difference rather than any operating advantage. Providers keep writing it anyway, because merchants expect it.
Gross Margin: 18% to 26%

Emerging Market Consumer Origination

Volume growth looks excellent and loss rates run well above developed market books, funded at wholesale rates. The twelve point spread reflects genuine dispersion between Gulf operators with sovereign backing and Southeast Asian books nobody has yet cycle-tested. Several of these operators will not survive the next rate cycle.
Gross Margin: 10% to 22%

Who Keeps Using This And Why

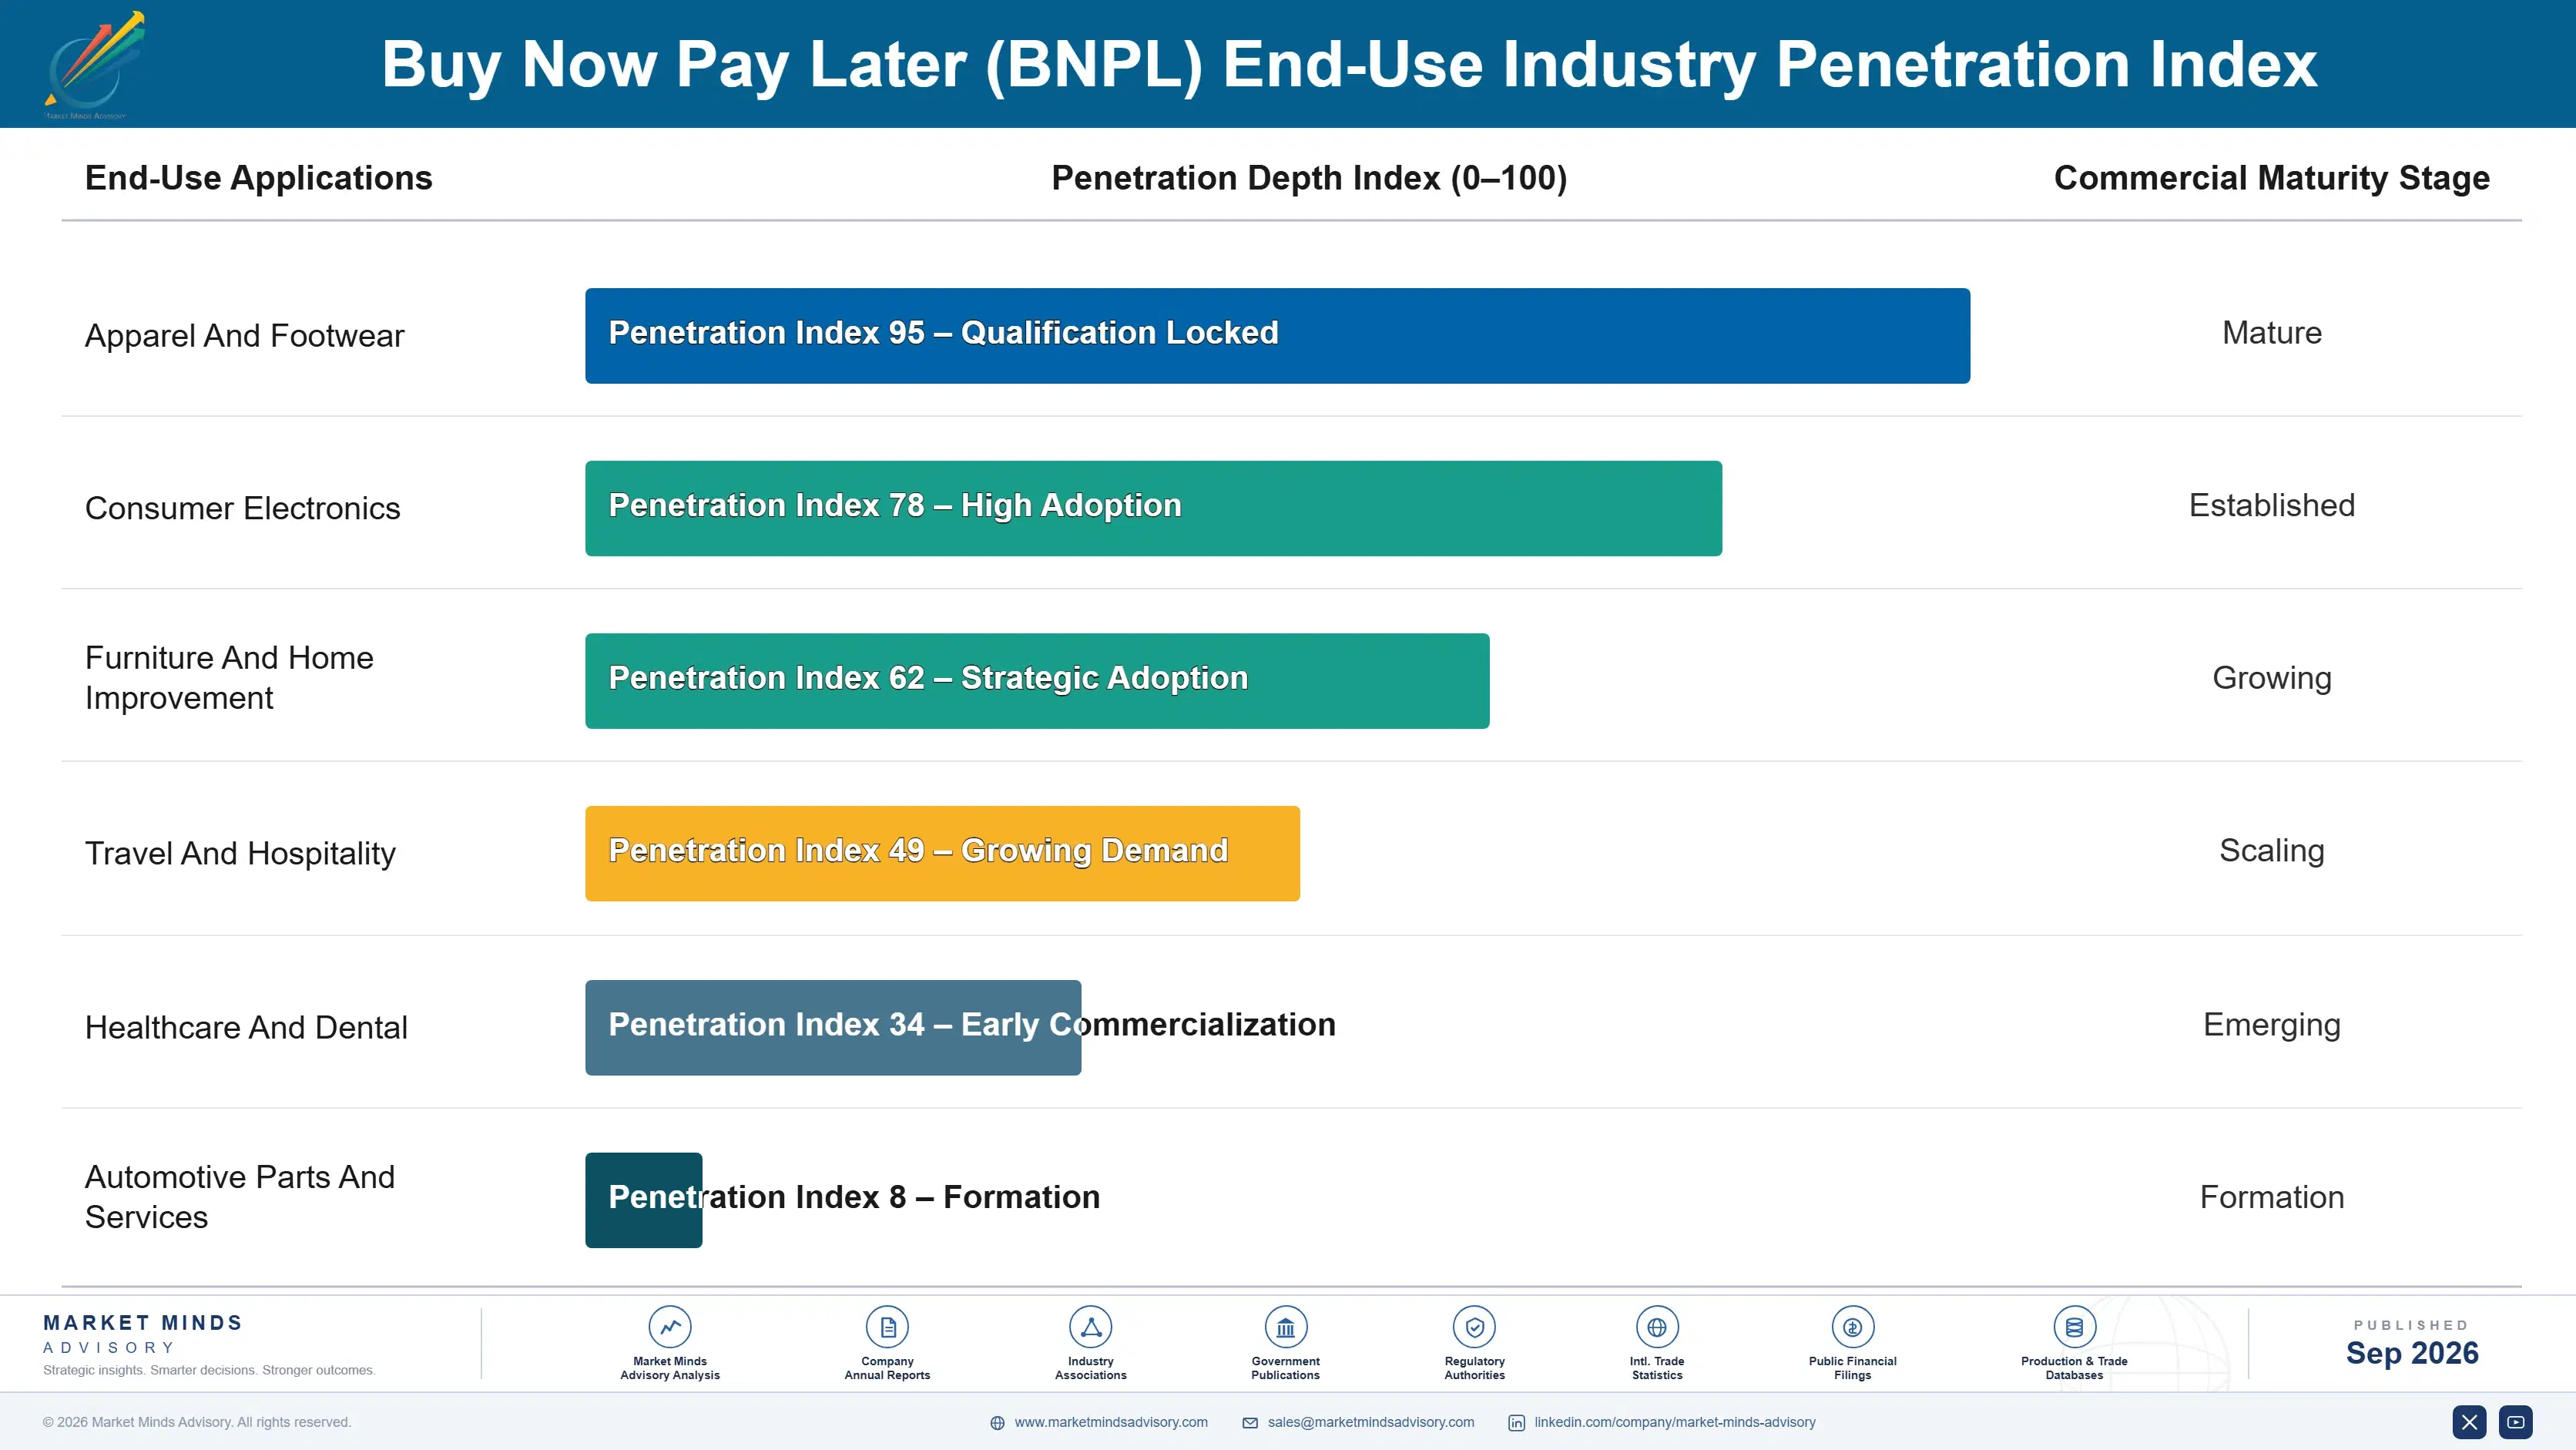
Repeat usage at 71% within twelve months is what makes provider economics work at all, because acquisition cost only amortises across a customer's second and subsequent transactions. The first plan is roughly break-even after acquisition and underwriting. Everything after that is contribution. Providers measuring growth in new customers rather than repeat rate discovered they had bought volume that never came back.
Stickiness varies sharply by merchant vertical. Apparel and beauty generate high frequency at low ticket, which builds habit but thin per-transaction contribution. Furniture, electronics and travel produce large tickets at annual frequency, where the loan is profitable and the relationship is not. Healthcare and home improvement sit in between and have proven the most durable, because the purchases are unavoidable and the amounts genuinely need spreading. Providers concentrated in a single vertical inherit that retention curve whether they like it or not.

The buyer profile has aged. Early adoption skewed heavily toward under-thirties with thin credit files, and that cohort now carries bureau history and conventional credit access. What replaced the growth is thirty-five to fifty-year-old households using instalments for planned large purchases rather than for cash flow gaps. That customer is more profitable and considerably harder to acquire.
buy-now-pay-later-bnpl-platform-market-end-use-penetration-index-1788454906136

What We Would Do Here

These are among the four positions where our research anticipates prominent divergence between winners and laggards over the coming forecast period. Each is grounded in the demand model, the regulatory perimeter, and the announced capacity pipeline.
01 / FUNDING STRUCTURE DISCIPLINE

Secure Deposit Funding Before The Next Rate Cycle

Cost of funds runs 35% to 45% of provider cost of revenue, and the gap between deposit funding and warehouse facilities is worth roughly 250 basis points on every transaction written. That difference removed a dozen operators between 2022 and 2024 while bank-owned competitors barely noticed the cycle. Providers without a licence or a bank owner should be negotiating forward flow and securitisation channels now, because the option disappears once rates move and everybody wants the same facility at once.
02 / B2B ORIGINATION PRIORITY

Move Underwriting Infrastructure Into Trade Credit Now

B2B trade instalment credit grows at 18.6%, half again the market rate of 12.4%, and it uses underwriting and collections infrastructure the consumer business already paid to build. Loss rates sit below consumer books because company registry data and filed accounts beat anything a consumer application provides. The barrier is commercial rather than technical, so the work is partnership conversations with wholesale marketplaces rather than engineering, and the operators who start now will hold those integrations for the next decade.
03 / REGULATORY COMPLIANCE POSITIONING

Treat Regulation As A Filter, Not A Cost

The United Kingdom, Australia and the European Union all now regulate buy now pay later as consumer credit, and compliance adds fixed cost that falls hardest on operators below roughly USD 500 million in originated volume. Providers treating that as a burden are missing the point entirely. Mandatory bureau participation gave surviving operators underwriting data they could not previously buy, net loss rates fell to around 2.4%, and the smaller competitors who could not afford the function sold themselves instead.
04 / DISTRIBUTION CHANNEL CHOICE

Partner With Issuers Instead Of Fighting Them

Card-linked post-purchase instalments grow at 17.4% and remove roughly 40% of the cost base, because the issuer already holds the customer, the acceptance footprint and deposit funding. Providers supplying underwriting and collections into an issuer programme earn a fee without carrying the receivable or paying to acquire anybody. The alternative is spending acquisition budget to win customers a partner bank already serves, which is the least defensible position available in this market and the hardest to explain to a board.

Engagement Snapshot From the Field

A live engagement with an industry participant carrying material or product regulatory and market exposure ahead of a defining policy shift, showing how our research translates into a defensible multi-year portfolio strategy.
MARKET MINDS ADVISORY · CLIENT ENGAGEMENT SUMMARY
Buy Now Pay Later (BNPL) Producer Strategic Portfolio Review and Transition Roadmap 2026·Investment Scenario on Buy Now Pay Later (BNPL) Exposure Evaluation 2025-26
CLIENT PROFILE
A Western European buy now pay later provider operating across six markets with originated volume in the low billions of euros annually and no banking licence. Funding ran entirely through two warehouse facilities. Management had watched cost of capital rise for three consecutive years while merchant discount rates stayed where they were negotiated in 2021, and margin had gone from acceptable to negative.
STRATEGIC CHALLENGE
The board wanted to know whether to pursue a banking licence, sell to a bank, or restructure funding without either. Each path took different time, capital and management attention, and the existing warehouse facilities came up for renewal within eighteen months. Getting the answer wrong meant renewing at rates the business could not carry.
MMA APPROACH
MMA modelled all three paths against the client's actual book performance, drawing on 47 expert interviews conducted in Q4 2025 across banking supervision, credit funds and instalment operators. We priced forward flow and securitisation channels against current market appetite, tested licence timelines with counsel in two jurisdictions, and separately analysed the client's portfolio mix by merchant vertical and product duration.
KEY FINDINGS
  1. Cost of funds had risen 240 basis points since 2021 against flat merchant discount rates, accounting for the entire margin decline (client-reported, unverified by MMA).
  2. A banking licence would take roughly 30 months and consume capital the business needed for receivables, making it the slowest path to the cheapest funding.
  3. Credit fund appetite for forward flow paper was strong, with three counterparties willing to price seasoned receivables inside 90 days of diligence.
  4. Two merchant verticals representing 31% of volume carried loss rates well above book average and had never been repriced (client-reported, unverified by MMA).
CLIENT PROFILE
A Western European buy now pay later provider operating across six markets with originated volume in the low billions of euros annually and no banking licence. Funding ran entirely through two warehouse facilities. Management had watched cost of capital rise for three consecutive years while merchant discount rates stayed where they were negotiated in 2021, and margin had gone from acceptable to negative.
STRATEGIC CHALLENGE
The board wanted to know whether to pursue a banking licence, sell to a bank, or restructure funding without either. Each path took different time, capital and management attention, and the existing warehouse facilities came up for renewal within eighteen months. Getting the answer wrong meant renewing at rates the business could not carry.
MMA APPROACH
MMA modelled all three paths against the client's actual book performance, drawing on 47 expert interviews conducted in Q4 2025 across banking supervision, credit funds and instalment operators. We priced forward flow and securitisation channels against current market appetite, tested licence timelines with counsel in two jurisdictions, and separately analysed the client's portfolio mix by merchant vertical and product duration.
KEY FINDINGS
  1. Cost of funds had risen 240 basis points since 2021 against flat merchant discount rates, accounting for the entire margin decline (client-reported, unverified by MMA).
  2. A banking licence would take roughly 30 months and consume capital the business needed for receivables, making it the slowest path to the cheapest funding.
  3. Credit fund appetite for forward flow paper was strong, with three counterparties willing to price seasoned receivables inside 90 days of diligence.
  4. Two merchant verticals representing 31% of volume carried loss rates well above book average and had never been repriced (client-reported, unverified by MMA).
RECOMMENDED STRATEGY
Phase 1: Phase one: execute forward flow agreements with two credit funds within six months, diversifying away from single-source warehouse dependency before the renewal window opens. Phase 2: Phase two: reprice or exit the two loss-heavy merchant verticals, and shift origination mix toward longer-duration interest-bearing plans over four quarters. Phase 3: Phase three: open licence discussions with two acquisitive banks as a parallel option, without committing capital to an independent application process.
OUTCOME
The client closed two forward flow agreements within five months and cut blended cost of funds by 110 basis points (client-reported, unverified by MMA). Repricing the two problem verticals removed roughly 9% of volume and improved net loss rate materially. Licence discussions with one bank remained open at the close of the engagement.

Frequently Asked Questions

Foundational context covering the market sizes, CAGR, scope, country, region and competition that inform every finding below. This section is provided to cover basics and most often pre-purchase conversations, answered from the MMA Primary Research Dataset.

What is the current size of the Buy Now Pay Later (BNPL) Market?

Global provider revenue reaches USD 16.64 billion in 2026, measured as merchant discount fees, consumer fees and interest income on instalment balances. The 2025 base is USD 14.8 billion.

How large will the Buy Now Pay Later (BNPL) Market be by 2036?

Provider revenue reaches USD 53.52 billion by 2036, an increase of USD 36.88 billion over the forecast period. That represents 3.22 times expansion from the 2026 base.

What is the CAGR for the Buy Now Pay Later (BNPL) Market 2026 to 2036?

The base case runs at 12.4% annually, with a bull case at 13.6% on faster B2B adoption and a bear case at 11.2% on a consumer credit cycle.

Which segment is growing fastest?

B2B trade instalment credit grows at 18.6%, half again the market rate of 12.4%. Business buyers accept underwriting friction consumers reject, and loss rates run below consumer books.

Who are the major companies in the Buy Now Pay Later (BNPL) Market?

Klarna, Affirm, PayPal, Block through Afterpay, and Zip Co lead on originated instalment volume, together holding 54%. Regional operators including Scalapay, Atome, Tabby and Nubank hold meaningful positions.

Which country is growing fastest?

India leads at 17.2%, driven by digital lending frameworks that legitimised the product and merchant adoption across e-commerce platforms. Indonesia and Saudi Arabia follow closely on similar mechanisms.

Report Segmentation Architecture

The full report scope spans multiple orthogonal segmentation dimensions, with cross-tabulated demand data provided for each dimension pair. Coverage extends further to regional breakdowns, trend trajectories, and the competitive detail needed to support segment-level decision-making.

By Instalment Product Structure

  • Pay-In-Four Interest-Free Instalments
  • Interest-Bearing Instalment Loans
  • B2B Trade Instalment Credit
  • Card-Linked Post-Purchase Instalments
  • Subscription And Recurring Payment Plans
  • Virtual Card Single-Use Instalments

By End-Use Industry

  • Apparel And Footwear
  • Consumer Electronics
  • Furniture And Home Improvement
  • Travel And Hospitality
  • Healthcare And Dental
  • Automotive Parts And Services

By Commercial Dimension

  • Merchant-Funded Checkout Integration
  • Issuer And Bank Distribution
  • Marketplace And Platform Embedded
  • Direct App Origination
  • Virtual Card Off-Network
  • Wholesale And Trade Marketplace

By Region

  • North America
  • Western Europe
  • East Asia
  • South Asia and Pacific
  • Latin America
  • Middle East and Africa
  • Eastern Europe

Scope, Methodology, and Coverage

Every figure in this report is reproducible from documented input assumptions. The scope below maps the historical period, the forecast horizon, the segmentation dimensions, and the countries covered, alongside the underlying primary and qualitative methodology.
Historical Period
2020 to 2025
Forecast Period
2026 to 2036
Base Year
2025 (USD billions; MMA Primary Research Dataset, September 2026)
Market Definition
This report covers provider revenue from buy now pay later credit: merchant discount fees, consumer late and account fees, and interest income on instalment balances originated at or immediately after point of sale. It excludes revolving credit card balances, traditional retail store cards, unsecured personal loans not originated at checkout, and the payment processing revenue of acquirers routing BNPL transactions.
Quantitative Units
USD billions, provider revenue basis (merchant discount fees, consumer fees, interest income); originated instalment volume in USD billions; net loss rate as percentage of originated volume.
Segmentation Dimensions
Instalment product structure; end-use industry; commercial distribution dimension; geography across seven regions.
Regions Covered
North America, Western Europe, East Asia, South Asia and Pacific, Latin America, Middle East and Africa, Eastern Europe
Countries Covered
United States, Canada, United Kingdom, Germany, Sweden, France, Italy, Spain, Poland, Japan, South Korea, Australia, India, Indonesia, Singapore, Brazil, Mexico, Saudi Arabia, United Arab Emirates, South Africa.
Key Companies Profiled
Klarna, Affirm, PayPal, Block (Afterpay), Zip Co, Sezzle, Splitit, Scalapay, Alma, Oney, Atome, Kredivo, Tabby, Tamara, Billie.
Quantitative Methodology
Primary survey, n=3,800 respondents, Q4 2025, six countries; demand-side model with trade association cross-validation
Qualitative Methodology
47 expert interviews, Q4 2025; applied to validate demand model assumptions, identify emerging dynamics, and assess competitive positioning
Report Format
PDF and XLSX data workbook (Word format preview document)
Publisher
Market Minds Advisory
Report Code
MMA-2026-TEC-231
Published
September 2026
Contact
sales@marketmindsadvisory.com | www.marketmindsadvisory.com

Purchase the full Buy Now Pay Later (BNPL) Market Report (2026 to 2036).

This report sizes global buy now pay later provider revenue from 2026 to 2036 across six instalment product structures, six end-use industries and seven regions. It sets out the funding cost and loss rate economics that determine which providers survive a credit cycle, with cost of revenue composition sourced to company annual reports. Regional analysis covers regulatory divergence across the United Kingdom, European Union, Australia and the United States, and explains why East Asian instalment credit sits largely outside this market definition. Competitive assessment covers 20 named operators on originated instalment volume, with development tracking and four revenue lever analyses. An anonymised client engagement on funding structure strategy is included.
Funding cost and loss rate economics modelled
Six instalment product structures sized to 2036
Seven region regulatory divergence and share analysis
Twenty named operators assessed on originated volume
Four revenue levers with quantified margin impact
Anonymised European provider funding strategy engagement included

Built For The People Who Decide

From boardroom strategy to bench-side execution, this report is read cover-to-cover by leaders shaping the next decade of their industry, turning demand scenarios, market dynamics and valuation benchmarks into decisions.
CXOs/ Presidents/ VPs/ Managers
M&A and Corporate Development
Strategy Teams and R&D Heads
Procurement and Product Directors
Regulatory and Compliance Leaders
Investor Relations and Equity Analysts