Market Minds Advisory
Burn-off Oven Market

Burn-off Oven Market: Burn-off Oven Market. Global Sizing, Segmentation, and Competitive Analysis to 2036

Powder coating hook stripping and precision metal parts cleaning are pulling burn-off oven specification toward electric models, as operators face tightening emissions permitting across most developed industrial markets this decade.

Lead Analyst

Published

October 2026

Make Smarter Decisions with Customized Research Insights

Request a free sample report and evaluate market opportunities, growth trends, and competitive dynamics relevant to your business needs.

2025 MARKET VALUE$0.6BMarket Size 2025
2036 FORECAST VALUE$1.0BBase Case , 2026 to 2036
CAGR 2026 TO 20364.6 %Bull 5.8% / Bear 3.4%
INCREMENTAL OPPORTUNITY$0.4BNet 10- year value creation
EXPANSION MULTIPLE1.57x2036 value over 2026 base
Strategic Levers
M&A Pipeline
Regional Outlook
Country Rankings
Competitive Intelligence
Segmental Deep-dive
Call-Us : 91 93563 13602

Executive Snapshot and Market Trajectory.

Burn-off oven demand is shifting from gas-fired batch systems toward electric models as powder coating and metal finishing operators face tightening local emissions permitting requirements that gas combustion struggles to satisfy without costly secondary abatement equipment across most industrial facility types.
Powder coating hook and rack reconditioning remains the largest application by volume, but automotive and aerospace parts cleaning is growing meaningfully faster as these industries adopt burn-off technology for applications previously handled through chemical stripping processes entirely. East Asia leads global volume through concentrated metal finishing and powder coating manufacturing capacity, while North America is adding electric capacity quickly behind state and local emissions regulation enforcement across most jurisdictions.
The competitive base remains fragmented across regional oven builders, with a small number of specialized firms competing on temperature uniformity, cycle time, and emissions compliance documentation rather than price alone. Operators increasingly require documented emissions performance data before specifying equipment, a shift smaller regional builders have been slower to accommodate than established national suppliers with deeper testing resources and dedicated compliance staff on hand. Compliance expectations keep climbing year over year without signs of slowing.
Market Definition
This market covers thermal burn-off ovens used to strip paint, powder coating, and other organic residues from metal hooks, racks, and parts through controlled combustion. It excludes chemical paint stripping systems and general industrial curing ovens sold outside dedicated burn-off applications.
Base Year Value
$0.6B in 2025 (MMA Primary Research Dataset, October 2026)
Forecast Period
2026 to 2036, eleven discrete annual values
CAGR
4.6% base case. Bull 5.8%. Bear 3.4%.
Fastest Growth Segment
Electric Burn-off Ovens for Powder Coating Hook Stripping: 6.9% CAGR
Fastest Growth Country
China: 5.8% CAGR
Fastest Growth Region
South Asia and Pacific: 6.7% CAGR
Largest Region
East Asia: 29% of 2025 global value
Market Leaders
Wisconsin Oven, Grieve Corporation, Despatch Industries, Thermal Product Solutions, L&L Special Furnace. Source: MMA Primary Research Dataset, July 2026.
Primary Survey
n=3,800 procurement and R&D decision-makers, Q4 2025, six countries
Methodology
Demand-side build-up, cross-validated against public data, 47 expert interviews

Burn-off Oven Market Forecast Scenarios

burn-off-oven-market-size-forecast-scenario-1791051583281
Demand between 2020 and 2025 tracked general industrial equipment replacement cycles closely, with electric model adoption rising gradually as regional emissions enforcement tightened unevenly across many markets worldwide over time. Supply chain disruption briefly slowed equipment delivery in 2021 and 2022, pulling historical growth modestly below the forecast rate now underway as that disruption has fully cleared.
The base case assumes continued emissions permitting tightening, gradual replacement of aging gas-fired ovens, and growing automotive and aerospace adoption of burn-off technology as the three mechanisms sustaining growth through 2036. Operators in jurisdictions adopting stricter local air quality rules are specifying electric models by default rather than retrofitting gas units with abatement equipment, aerospace and automotive parts cleaning applications are expanding beyond traditional powder coating hook stripping, and aging equipment installed decades ago is approaching the end of its service life across many facilities.
A bull scenario centers on accelerated emissions enforcement pulling electric oven replacement volume well above base case assumptions across multiple regions simultaneously and ahead of current schedules. The bear risk is a broader industrial production slowdown that delays equipment replacement decisions, since burn-off ovens represent discretionary capital spending operators can defer when budgets tighten unexpectedly.

Electric Models Replace Gas-Fired Burn-off Capacity

Electric burn-off ovens have moved from a niche alternative to the default specification choice in jurisdictions enforcing strict local emissions rules, displacing gas-fired units that previously dominated the category on lower upfront equipment cost alone. Operators facing permitting scrutiny increasingly treat the emissions profile as a procurement gate rather than a secondary consideration behind price. Equipment that cannot document compliance is being excluded from bid lists entirely in several major industrial regions.
MARKET CONCENTRATIONCR5 44%Specialized builders split share across regional markets broadly
AVERAGE SELLING PRICE$145K per unitLarge industrial units command substantial single-project capital cost
TOP PRODUCER SHAREChina 21%Concentrated metal finishing demand drives domestic production capability
CAPACITY UTILIZATION71%Builders run below peak amid lumpy order timing patterns overall
TRADE INTENSITY24% cross-borderSpecialized units ship regionally given freight cost on bulky equipment
FEEDSTOCK COST SHARE34%Steel fabrication and heating elements dominate input cost structure
Cycle time and temperature uniformity remain the primary performance differentiators buyers evaluate, since uneven heating can damage parts or leave residue that forces costly rework, making documented performance data increasingly central to specification decisions across most industrial buyers. Suppliers able to demonstrate consistent chamber temperature across repeated cycles are winning specification more often than those relying on manufacturer claims alone.
Replacement demand from aging gas-fired installations is beginning to outpace new facility additions, as operators facing emissions compliance deadlines replace equipment ahead of its natural end of service life rather than risk non-compliance penalties. This replacement wave is expected to accelerate further as more jurisdictions adopt comparable local air quality standards over the coming years. Equipment makers are preparing dedicated retrofit lines anticipating this emerging demand wave.
"A burn-off oven used to be the equipment nobody thought about until it broke. Now it is often the first thing an emissions inspector asks to see documentation for."
Senior Analyst, Industrial Thermal Equipment Practice · MMA Construction and Industrial Equipment Practice · October 2026

Market Trends

Electric Model Adoption Accelerates Under Emissions Pressure

Operators in jurisdictions enforcing stricter local air quality rules are specifying electric burn-off ovens by default rather than retrofitting gas-fired units with secondary abatement equipment that adds meaningful capital cost without fully eliminating emissions risk. This shift has accelerated faster than most suppliers anticipated, catching gas-fired equipment specialists without electric product lines at a competitive disadvantage on bids where emissions documentation is now a baseline requirement rather than an optional feature. Several established gas-fired builders have announced new electric product lines within the past two years specifically in response to this shift.
Market Impact: Pulls forward 15 percent demand

Aerospace and Automotive Parts Cleaning Expands Applications

Aerospace and automotive manufacturers are adopting burn-off technology for precision parts cleaning applications previously handled through chemical stripping, drawn by faster cycle times and the elimination of hazardous chemical waste disposal requirements that chemical stripping processes require under current environmental regulation across most jurisdictions. This expansion is pulling burn-off oven demand into facility types that rarely specified this equipment category previously, creating a genuinely new customer base for suppliers able to meet the tighter tolerance and documentation requirements these demanding industries require. Suppliers are forming dedicated application engineering teams to serve these new verticals effectively.
Market Impact: Adds 8 percent annual volume growth

Market Opportunities and Growth Drivers

Tightening Emissions Permitting Drives Equipment Replacement

Local and state emissions permitting requirements are tightening across multiple jurisdictions, forcing operators running older gas-fired equipment to either retrofit with abatement systems or replace equipment entirely with compliant electric models before permitting deadlines arrive without exception. Many operators are choosing full replacement over retrofit once the comparative lifetime cost becomes clear, since abatement equipment adds ongoing maintenance obligations that electric models avoid entirely by design engineering choice built into the equipment from the outset. Several large operators have already announced multi-site replacement programs tied directly to these deadlines. across multiple operating regions.
Market Impact: Adds 30 percent capital cost premium

Powder Coating Industry Growth Supports Steady Volume

Powder coating application volume continues expanding steadily across automotive, appliance, and general metal finishing industries, each generating ongoing demand for hook and rack reconditioning that burn-off ovens perform more reliably than chemical stripping alternatives at comparable throughput levels and operating cost across most facility types. This steady underlying demand provides a stable volume floor beneath the more cyclical capital replacement demand tied to emissions compliance timing, giving equipment makers considerably more predictable order volume overall year to year. Suppliers serving this base report significantly longer customer relationships than those chasing replacement-driven orders alone.
Market Impact: Adds 15 percent configuration cost

Market Restraints and Challenges

Higher Electric Unit Cost Slows Full Market Conversion

Electric burn-off ovens carry substantially higher capital cost than comparable gas-fired units, making some smaller operators hesitant to convert fully until local emissions enforcement makes the decision unavoidable rather than discretionary. The root cause is that electric heating elements and insulation systems capable of comparable cycle times remain more expensive to manufacture than gas burner assemblies at equivalent chamber capacity. Suppliers are responding by offering financing arrangements and phased conversion paths that let operators electrify incrementally rather than replacing an entire fleet of ovens in one single capital cycle. across most equipment categories.
Market Impact: Cuts emissions documentation time 40 percent

Regional Permitting Variation Complicates Equipment Standardization

Emissions permitting requirements vary meaningfully across states and countries, forcing multi-site operators to specify different equipment configurations at each facility rather than standardizing on a single design across their entire operation. The root cause is that local air quality regulations develop independently without coordination, reflecting each jurisdiction's own industrial emissions history and enforcement priorities. Some larger operators are responding by specifying equipment built to the strictest jurisdiction's standard across all sites, simplifying maintenance even where it exceeds the minimum requirement at some locations. This approach trades some unnecessary cost for meaningfully simpler fleet management.
Market Impact: Adds 12 percent new application volume
4 additional market trends, 3 additional growth drivers, and 2 additional restraints and challenges are covered in the full report. Contact sales@marketmindsadvisory.com to access the complete intelligence.

Segment CAGR and Growth Architecture

Burn-off ovens segment here by heating technology type, since electric versus gas-fired combustion determines emissions profile, operating cost, and permitting complexity most directly for operators specifying equipment across every application and facility type worldwide. Electric models are capturing the fastest-growing, highest-value specification share as emissions enforcement tightens broadly across most major industrial regions and sites.
burn-off-oven-market-market-share-analysis-1791051583607

Electric Burn-off Ovens for Powder Coating Hook Stripping

Electric burn-off ovens have become the specification default in jurisdictions enforcing strict local emissions rules, as operators avoid the secondary abatement equipment gas-fired units require to meet comparable compliance standards. This category is capturing a disproportionate share of new equipment orders as emissions enforcement expands beyond its initial handful of strictest jurisdictions into broader regional and national policy. Suppliers in this category have built dedicated electric heating element engineering capability distinct from traditional gas burner expertise, positioning them favorably as more operators convert existing fleets ahead of mandatory compliance deadlines. Order backlogs now extend well beyond typical lead times as conversion accelerates across regions. Smaller suppliers without comparable engineering depth are struggling to keep pace.
CAGR 6.9%

Burn-off Ovens for Aerospace and Automotive Parts Cleaning

Burn-off ovens engineered for aerospace and automotive precision parts cleaning are growing faster than traditional hook and rack reconditioning equipment, as these industries adopt burn-off technology over chemical stripping to avoid hazardous waste disposal requirements. This category demands tighter temperature uniformity and documentation than conventional powder coating applications, favoring suppliers with established aerospace and automotive quality certification experience over general industrial equipment builders lacking comparable credentials in these demanding end markets. Suppliers entering this category from traditional industrial equipment backgrounds often require several years to build the quality certification track record aerospace and automotive customers expect before winning meaningful specification volume, and most have found the investment worthwhile given growth rates well above conventional applications.
CAGR 5.9%
Full segment breakdown across 6 segments available in the complete report.

Regional Architecture and Country Demand Map

Demand distributes relatively evenly across major industrial economies, tracking general metal finishing and powder coating activity rather than concentrating around any single dominant manufacturing hub or emissions regime, with North America and East Asia holding comparable leading shares driven by distinctly different underlying demand mechanisms entirely.

North America

Emissions permitting enforcement is the defining variable here more than general industrial activity growth. Several states have tightened local air quality rules meaningfully over the past few years, pushing operators toward electric models faster than the broader North American industrial base is otherwise replacing capital equipment. Powder coating and automotive parts cleaning both contribute steady demand, with automotive adoption accelerating as manufacturers seek alternatives to chemical stripping processes facing their own disposal cost pressure. Equipment suppliers with proven emissions compliance documentation are winning a disproportionate share of replacement bids across most affected jurisdictions. Fleet-wide replacement programs at larger operators are becoming increasingly common across multiple industrial sectors. Several additional state-level permitting changes are expected over the next two years.
Share: 27% | CAGR: 4.8% (2026 to 2036)

Western Europe

Stringent European Union industrial emissions directives have pushed electric model adoption further here than in most other regions, with gas-fired units increasingly confined to jurisdictions with less stringent local enforcement standards still permitted under broader EU framework rules. Growth trails the global rate since much of the region's equipment base has already converted to compliant electric models over the past decade, leaving a smaller remaining replacement pool than regions earlier in their conversion cycle. Powder coating demand remains steady but unspectacular, tracking general manufacturing activity across mature industrial economies. Remaining demand increasingly concentrates on the aerospace and automotive applications still expanding here. Domestic suppliers continue investing in certification capability to serve these demanding verticals.
Share: 21% | CAGR: 3.4% (2026 to 2036)
Regional intelligence for 5 additional markets available in the complete report: East Asia, South Asia and Pacific, Latin America, Middle East and Africa, Eastern Europe. Contact sales@marketmindsadvisory.com.
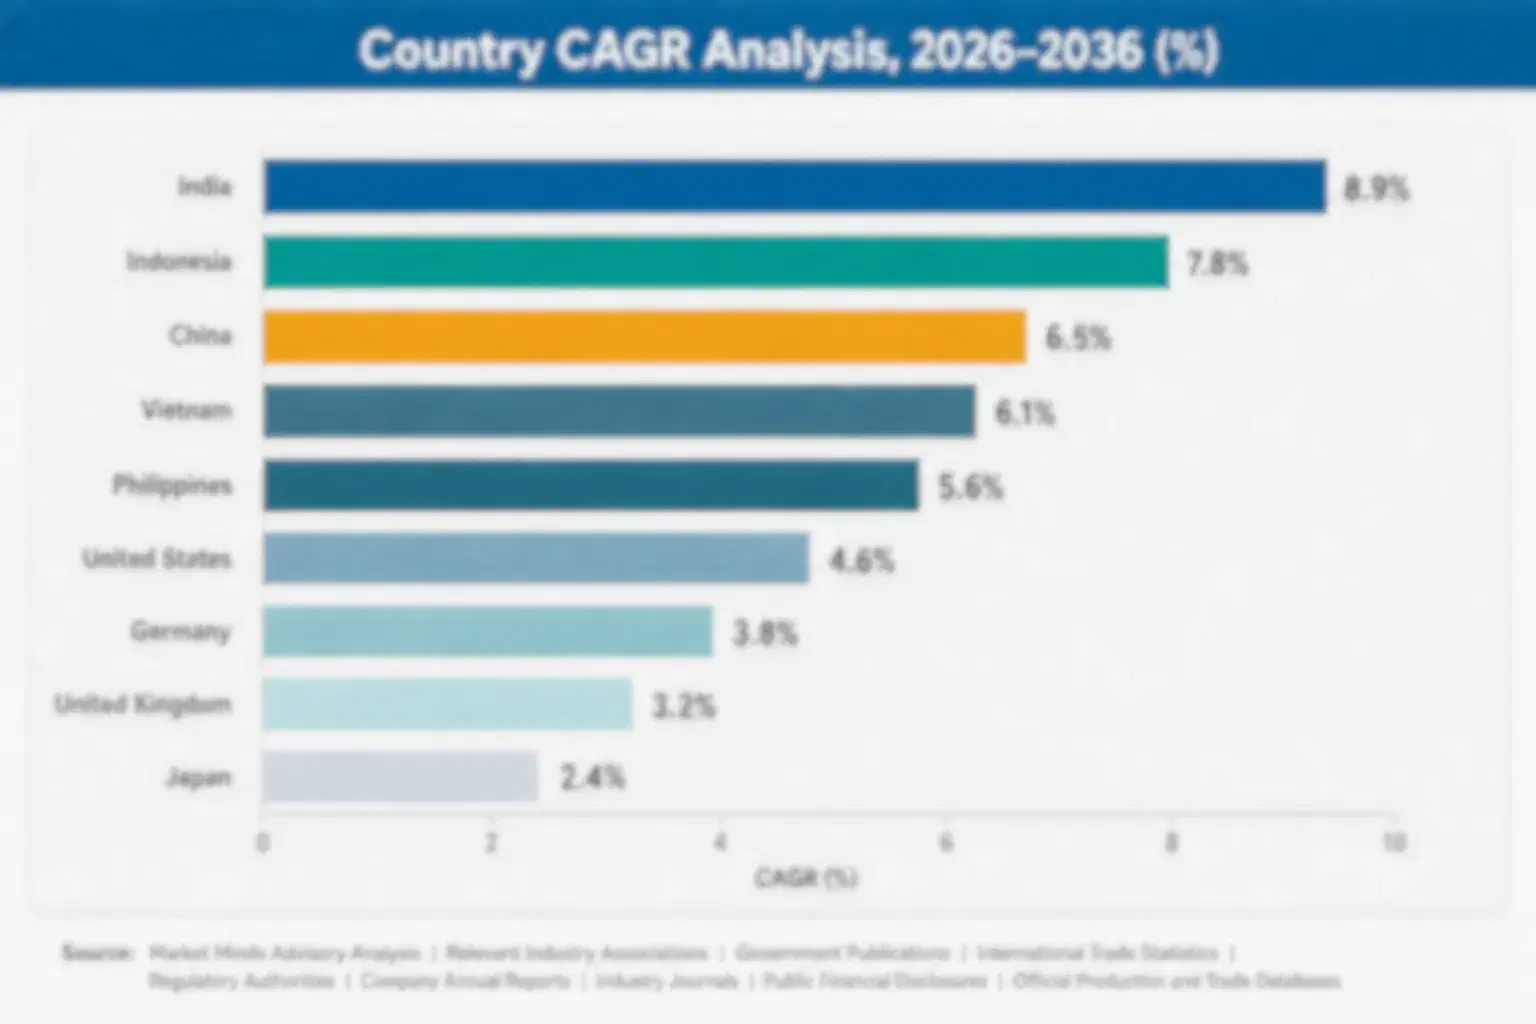
burn-off-oven-market-country-cagr-analysis-1791051583922

Capturing Value Beyond Oven Delivery

Equipment sale alone leaves meaningful value on the table in a market defined by tightening emissions enforcement and rising documentation demands, so the strongest suppliers are building compliance, financing, and service revenue streams around the core equipment sale that smaller competitors still treat as a single one-time transaction rather than an ongoing relationship. overall.

Emissions Compliance Documentation and Service Program

Suppliers that bundle ongoing emissions compliance documentation into the original equipment sale capture recurring revenue worth 10 to 15 percent of original contract value annually, rather than leaving customers to manage their own compliance paperwork and testing independently after installation concludes. This arrangement also gives suppliers ongoing visibility into equipment performance that strengthens their position when customers consider future capacity expansion or replacement, reinforcing switching costs that favor the incumbent supplier over new entrants bidding on follow-on work later. Compliance customers also rarely switch suppliers once documentation history accumulates. across most major accounts.
Market Impact: Adds 10 to 15 percent recurring annual revenue

Phased Electrification Equipment Financing Program Rollout

Suppliers that offer phased electrification financing programs capture specification from operators unable to fund a full fleet conversion in a single capital cycle, a customer segment competitors requiring upfront full payment simply cannot serve at all. These financing arrangements typically extend the relationship across multiple years and facilities rather than a single transaction, generating lifetime revenue per customer roughly 2 to 3 times higher than a one-time equipment sale alone. Several suppliers have built this into a standalone financing arm separate from core equipment manufacturing. Default rates on these programs have remained low across most suppliers offering them.
Market Impact: Extends customer relationships by 3 to 5 years

Who Controls the Margin Pool

Concentration is moderate, with the top five firms holding roughly 44 percent of reported equipment revenue, split across specialized industrial oven builders serving overlapping metal finishing and parts cleaning applications. The gap between leaders and regional challengers is narrower than in many equipment categories, since compliance documentation capability rather than pure scale increasingly determines specification wins. Smaller specialists compete mainly on application-specific engineering depth rather than breadth.
Current competitive activity centers on electric product line expansion, as gas-fired equipment specialists race to build comparable electric offerings before customers convert fleets entirely to competitors already positioned there. Several firms have also launched phased electrification financing programs this year, tying extended payment terms to fleet conversion in a category where upfront cost previously limited who could compete for larger multi-site accounts.

Emerging pressure comes from Chinese equipment manufacturers scaling domestic electric oven capability quickly, a shift that could compress margins on standard equipment the way it has in other industrial categories. Rankings are most likely to shift among suppliers racing to win aerospace and automotive parts cleaning specification, since those relationships tend to carry forward into subsequent facility expansion orders. Local content preferences in China could accelerate this shift considerably.
burn-off-oven-market-company-positioning-matrix-1791051584203

Competitive Moat and Risk Dimensions

WISCONSIN OVEN

Moat: Broad Industrial Oven Portfolio

Wisconsin Oven's broad portfolio spanning multiple industrial oven categories beyond burn-off equipment gives it manufacturing scale and engineering resources that pure-play burn-off specialists cannot match, letting it cross-subsidize development of new electric product lines more easily than smaller competitors. This diversification also smooths demand cycles across its broader equipment portfolio.
WISCONSIN OVEN

Risk: Specialist Competitor Focus Risk

Specialized burn-off oven builders that focus exclusively on this category can develop deeper application-specific expertise than a diversified portfolio player managing attention across many product lines simultaneously, potentially eroding Wisconsin Oven's position in the most demanding aerospace and automotive applications. Several specialists have already begun targeting these specific niches aggressively.
GRIEVE CORPORATION

Moat: Decades of Compliance Documentation Experience

Grieve Corporation's decades of experience documenting emissions performance across varied regulatory jurisdictions gives it compliance expertise newer entrants into electric burn-off technology struggle to replicate quickly, a capability increasingly central to winning specification in strict enforcement regions. This track record is difficult for new entrants to replicate without years of accumulated project history.
GRIEVE CORPORATION

Risk: Legacy Gas-Fired Portfolio Exposure

A substantial share of Grieve Corporation's installed base and ongoing service revenue remains tied to gas-fired equipment, exposing it to margin pressure as customers accelerate conversion toward electric models faster than the company can fully transition its own product mix. Competitors with cleaner electric-only portfolios face less of this margin pressure.

Players Tracked

Prominent Players

Wisconsin Oven
Grieve Corporation
Despatch Industries
Thermal Product Solutions
L&L Special Furnace

Other Key Players

Lewco Inc
Gruenberg
Blue M Electric
Sahara Natural Gas Furnaces
Ipsen International
Surface Combustion
C.M. Furnaces
Thermcraft
Across International
Davron Technologies
Furnace Brazing Components
Mellen Company
ProcessBarron
Industrial Heating Systems
Protherm Industries

Recent Developments

JUNE 2026

Grieve Corporation launched a next-generation electric burn-off oven product line specifically engineered to match the cycle times of its established gas-fired models, addressing a performance gap that had slowed customer conversion despite strong emissions compliance advantages electric units otherwise offer. Observers noted the timing followed rival announcements.
Signal: Signals established gas-fired specialists are now racing hard to close the performance gap with electric alternatives.
JANUARY 2026

Despatch Industries introduced a phased electrification financing program allowing multi-site operators to convert their equipment fleets incrementally over several years rather than requiring full upfront capital, following similar programs several competitors had already launched in response to customer demand. Several large customers have already enrolled.
Signal: Signals financing flexibility is quickly becoming a standard competitive requirement across the industry rather than a differentiator.

Steel and Heating Elements Drive Costs

Steel fabrication and electric heating elements together account for roughly 34 percent of total equipment cost, sourced from domestic steel mills supplemented by specialized heating element manufacturers whose supply base is considerably more concentrated than general industrial component production. Insulation materials and control electronics add a further meaningful share of equipment cost. Control panel electronics and sensors represent a smaller but growing cost share as monitoring requirements expand.
Steel coil prices rose sharply during 2024 tariff adjustments affecting imported flat steel, a volatility event documented in US Census Bureau trade data and corroborated by several equipment makers' annual reports, forcing rapid repricing on fixed-bid contracts signed before the increase took effect. Suppliers without hedging arrangements absorbed meaningfully higher costs on in-progress orders that could not be repriced mid-contract once materials had already been committed.

Smaller regional oven builders face disproportionate exposure since they lack the purchasing scale to negotiate favorable steel supply terms that larger diversified manufacturers secure routinely, leaving them more vulnerable to sudden input cost spikes. Builders concentrated in electric product lines, which use proportionally more specialized heating components than structural steel, face a different cost exposure profile than gas-fired equipment specialists.
burn-off-oven-market-cost-volatility-analysis-1791051584505

Multi-Year Steel Supply Contracts

Larger equipment makers are locking in multi-year steel supply agreements with price adjustment formulas tied to published index prices, reducing exposure to spot market volatility on large orders placed well ahead of fabrication schedules across major accounts and recurring institutional customers they serve repeatedly across multiple budget cycles. across the broader supplier relationship. overall.

Standardized Heating Element Platforms

Larger suppliers are standardizing heating element designs across multiple product lines, giving them purchasing scale with specialized component manufacturers that smaller single-product competitors cannot replicate, reducing per-unit heating element cost meaningfully across their entire product range and improving overall margin consistency. Several suppliers have also begun qualifying secondary component manufacturers to reduce single-source dependency risk further.

Portfolio Architecture for Margin Defence

Margin architecture splits along technology and application tier, with standard gas-fired units running moderate margins typical of mature industrial equipment, while electric models and documented compliance capability command meaningfully better economics tied to regulatory necessity rather than commodity differentiation alone. This gap has widened as emissions enforcement has expanded well beyond its original handful of strictest jurisdictions over the past several years.
The volume versus premium tension here is straightforward: gas-fired equipment remains viable in jurisdictions with lax enforcement, but the fastest-growing demand sits entirely in electric models and aerospace-grade documentation that standard gas-fired units simply cannot provide, forcing suppliers to choose which capability to build rather than hedging across both categories indefinitely without clear focus. Suppliers that serve both tiers evenly often struggle to invest adequately in either path.

High-value margin pools concentrate specifically in electric models for strict emissions jurisdictions and aerospace and automotive parts cleaning applications, where documentation and tolerance requirements command premium pricing standard equipment cannot match on comparable terms. Suppliers without these capabilities are increasingly confined to the thinner commodity gas-fired tier as enforcement spreads to more jurisdictions worldwide. This divergence is widening the gap between specialized suppliers and generalist builders lacking comparable depth.

Standard gas-fired burn-off ovens for basic powder coating hook and rack stripping in less regulated jurisdictions, with gross margins in the 18 to 25 percent range typical of mature industrial equipment.
Gross Margin

Electric models carrying documented emissions compliance certification, earning gross margins in the 28 to 36 percent range on regulatory necessity and competitive specification wins across most strict enforcement jurisdictions worldwide.
Gross Margin

Aerospace and automotive grade electric systems with tight tolerance documentation, commanding gross margins in the 34 to 44 percent range under specialized certification requirements and the strictest industry quality standards.
Gross Margin
burn-off-oven-market-portfolio-architecture-1791051584870

High-value Sub-segments and Strategic Watch-out

Aerospace and Automotive Electric Systems

Electric systems for aerospace and automotive parts cleaning are both high-value and fast-growing, as these industries adopt burn-off technology over chemical stripping, creating a durable premium revenue stream for the handful of suppliers with proven certification capability today and limited near-term competition. Switching costs here remain high.

Emissions Compliance Documentation Services

Emissions compliance documentation services combine high value with moderate growth, since this category expands steadily alongside broader equipment specification rather than in sharp bursts, offering suppliers a more predictable premium revenue base over time than the more volatile equipment sales cycle itself. Adoption keeps broadening steadily.

Standard Gas-Fired Equipment

Standard gas-fired equipment remains the volume core of the market in less regulated jurisdictions, generating steady unit count at moderate commodity-adjacent margins that leave limited room for differentiation beyond price and reliable delivery performance. Margins continue eroding slowly as regional fabricators compete heavily for volume.

Chinese Electric Oven Competition

Rising domestic Chinese electric oven capability is a strategic watch-out for established global suppliers, since local content preferences on domestic projects increasingly favor regional firms over traditional incumbent suppliers on home-market contracts going forward. Partnership structures with domestic firms are one defensive option suppliers are actively exploring right now.

From Capital Sale to Compliance Partner

Revenue is shifting from one-time equipment sale toward ongoing emissions compliance documentation relationships that renew across a facility's entire operating life rather than ending at installation. Suppliers that secure these documentation relationships capture value well beyond the original equipment sale, since switching providers mid-contract means rebuilding compliance history that permitting authorities have come to expect continuity on. This makes compliance documentation central to supplier strategy.
Adoption stickiness varies by end-use vertical. Aerospace and automotive customers show the deepest stickiness, having built burn-off specifications directly into their own quality certification processes in ways that would be costly to restructure under a different equipment vendor. Conventional powder coating operators show weaker stickiness, remaining more willing to switch suppliers between facility expansion or replacement cycles. Suppliers are tailoring contract structures to match these differing stickiness profiles by industry vertical.

Buyer profiles are shifting generationally as plant managers who once treated burn-off ovens as a standard utility purchase are replaced by compliance-focused engineers trained during the period when emissions documentation already determined which suppliers won major contracts. This generational shift is accelerating specification of electric, documented systems among mid-sized operators who previously deferred such decisions to whichever supplier served their first facility historically.
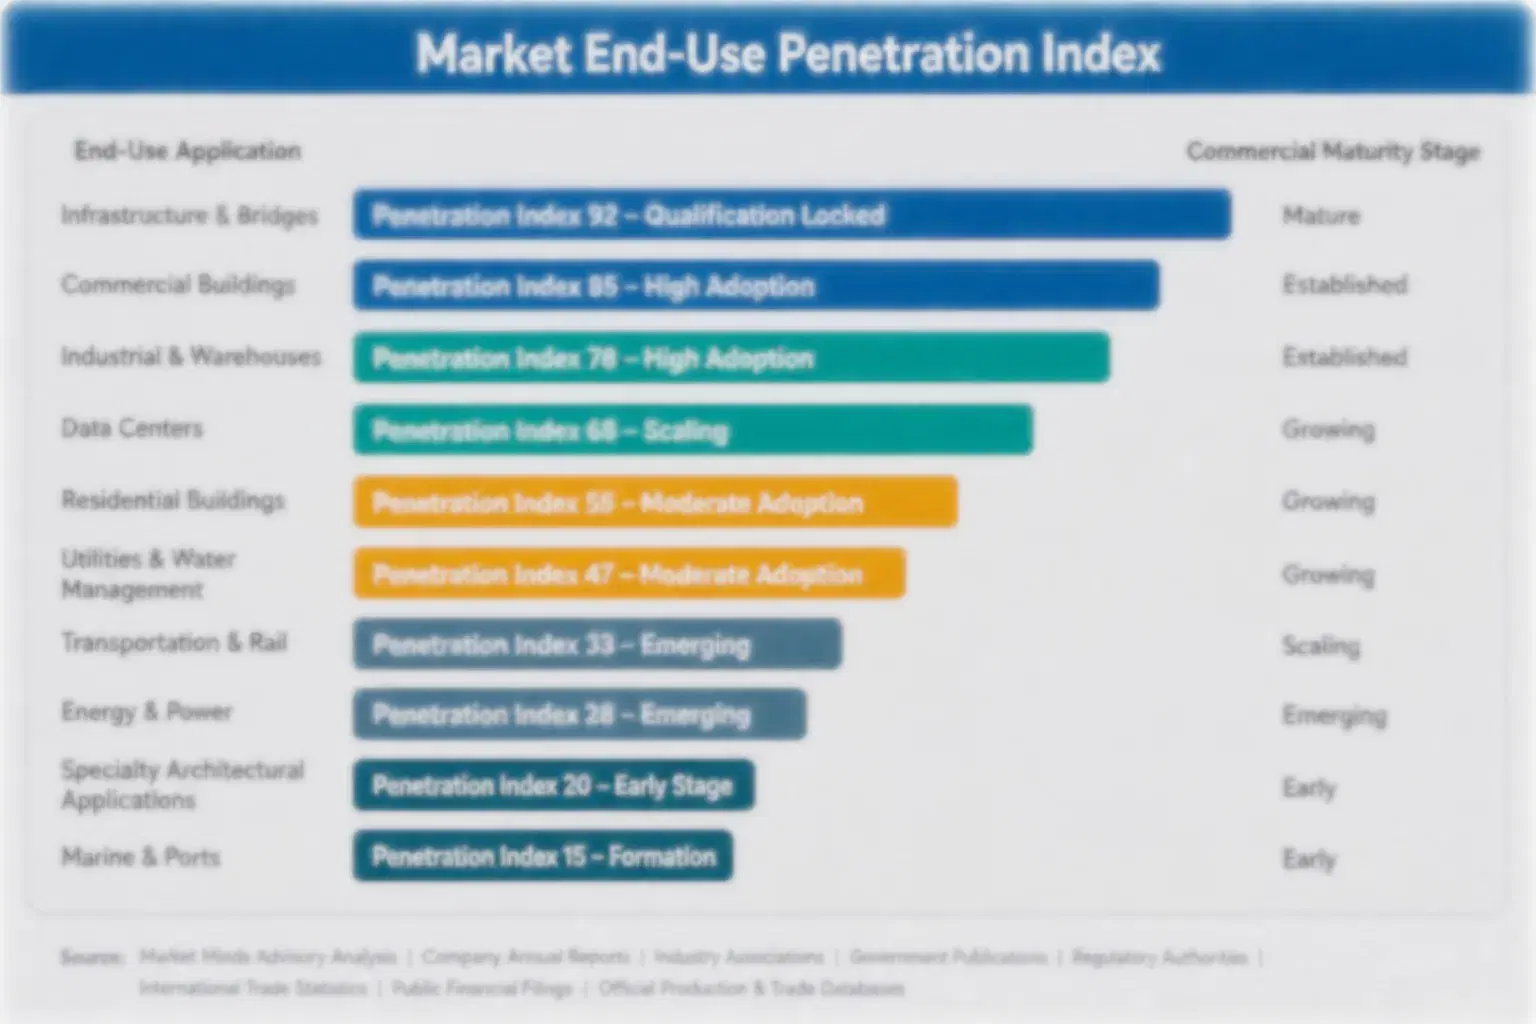
burn-off-oven-market-end-use-penetration-index-1791051585151

Where Oven Suppliers Should Focus Next

These are among the four positions where our research anticipates prominent divergence between winners and laggards over the coming forecast period. Each is grounded in the demand model, the regulatory perimeter, and the announced capacity pipeline.
01 / ELECTRIC TECHNOLOGY INVESTMENT

Build electric product lines before gas-fired equipment becomes unsellable

Emissions enforcement is tightening across more jurisdictions each year, and suppliers without competitive electric product lines will simply be unable to bid on an expanding share of replacement orders as strict permitting spreads beyond its current handful of leading jurisdictions. Building this capability requires sustained engineering investment in heating element and cycle time performance that smaller suppliers may struggle to fund without a strategic partner. Those that move first will capture specification that slower competitors are permanently locked out of.
02 / COMPLIANCE DOCUMENTATION SERVICE BUILD

Attach compliance documentation services to every new equipment sale

Suppliers that attach ongoing emissions compliance documentation to every new equipment sale capture meaningfully more lifetime revenue per account while building switching costs that protect against competitor displacement over the equipment's full service life and beyond. This transition requires investing in testing and documentation infrastructure that smaller suppliers may struggle to fund without additional capital or a strategic financing partner. Those that complete it first will set the service structure that slower competitors are eventually forced to match across the industry.
03 / AEROSPACE VERTICAL EXPANSION

Expand aerospace and automotive certification capability ahead of demand

Aerospace and automotive parts cleaning demand is growing faster than traditional powder coating applications, and suppliers that build certification track records in these verticals early are establishing relationships competitors will struggle to displace once specification habits set in across repeat facility projects and expanding programs. This focus requires dedicating engineering resources specifically to tighter tolerance requirements rather than spreading investment evenly across all applications. Suppliers that wait too long risk losing this opportunity entirely to competitors already well positioned there.
04 / CHINESE COMPETITION RESPONSE

Prepare a defensive response to rising Chinese electric oven capability

Domestic Chinese equipment manufacturers are scaling electric oven capability quickly, threatening established suppliers most directly on home-market projects where local content preferences increasingly favor regional firms over traditional incumbents operating there today across multiple industrial provinces. Global suppliers should either pursue joint venture or licensing arrangements with domestic partners to retain market access, or concentrate capital on regions where local competition remains less developed. Standing still against this shift risks losing a genuinely meaningful market over the coming decade entirely.

Engagement Snapshot From the Field

A live engagement with an industry participant carrying material or product regulatory and market exposure ahead of a defining policy shift, showing how our research translates into a defensible multi-year portfolio strategy.
MARKET MINDS ADVISORY · CLIENT ENGAGEMENT SUMMARY
Burn-off Oven Producer Strategic Portfolio Review and Transition Roadmap 2026·Investment Scenario on Burn-off Oven Exposure Evaluation 2025-26
CLIENT PROFILE
The client operates a regional powder coating facility serving automotive and appliance manufacturers across a multi-state service area, running an aging fleet of gas-fired burn-off ovens that had served reliably for over fifteen years. The company faced a newly announced state emissions permitting deadline requiring either costly retrofit or full equipment replacement within an accelerated timeline.
STRATEGIC CHALLENGE
Management needed to decide between retrofitting existing gas-fired ovens with abatement equipment or replacing the entire fleet with electric models, a decision complicated by limited capital availability and uncertainty about whether the state's enforcement timeline would hold or face further delay given political pressure from affected operators statewide. before finalizing a decision under time pressure.
MMA APPROACH
MMA modeled the comparative lifetime cost of retrofit versus full replacement against the client's specific production volume, benchmarked phased electrification financing programs other regional operators had used to manage capital outlay, and assessed the likelihood of enforcement timeline delay based on comparable permitting history in other jurisdictions. facing comparable deadlines.
KEY FINDINGS
  1. Retrofit cost per unit exceeded sixty percent of full electric replacement cost once ongoing maintenance was included. based on supplier quotes gathered during the engagement.
  2. Phased financing programs used by comparable regional operators reduced upfront capital exposure meaningfully (client-reported, unverified by MMA). These programs allowed conversion without disrupting ongoing operations.
  3. Enforcement timeline delay in comparable jurisdictions elsewhere had historically been brief, rarely exceeding six months. This pattern informed the client's final timeline decision.
  4. Electric models reduced cycle time meaningfully compared to the client's existing gas-fired equipment, improving overall facility throughput. This improvement alone partially offset the higher upfront equipment cost.
CLIENT PROFILE
The client operates a regional powder coating facility serving automotive and appliance manufacturers across a multi-state service area, running an aging fleet of gas-fired burn-off ovens that had served reliably for over fifteen years. The company faced a newly announced state emissions permitting deadline requiring either costly retrofit or full equipment replacement within an accelerated timeline.
STRATEGIC CHALLENGE
Management needed to decide between retrofitting existing gas-fired ovens with abatement equipment or replacing the entire fleet with electric models, a decision complicated by limited capital availability and uncertainty about whether the state's enforcement timeline would hold or face further delay given political pressure from affected operators statewide. before finalizing a decision under time pressure.
MMA APPROACH
MMA modeled the comparative lifetime cost of retrofit versus full replacement against the client's specific production volume, benchmarked phased electrification financing programs other regional operators had used to manage capital outlay, and assessed the likelihood of enforcement timeline delay based on comparable permitting history in other jurisdictions. facing comparable deadlines.
KEY FINDINGS
  1. Retrofit cost per unit exceeded sixty percent of full electric replacement cost once ongoing maintenance was included. based on supplier quotes gathered during the engagement.
  2. Phased financing programs used by comparable regional operators reduced upfront capital exposure meaningfully (client-reported, unverified by MMA). These programs allowed conversion without disrupting ongoing operations.
  3. Enforcement timeline delay in comparable jurisdictions elsewhere had historically been brief, rarely exceeding six months. This pattern informed the client's final timeline decision.
  4. Electric models reduced cycle time meaningfully compared to the client's existing gas-fired equipment, improving overall facility throughput. This improvement alone partially offset the higher upfront equipment cost.
RECOMMENDED STRATEGY
Phase 1: Phase one: replace the two oldest, least efficient gas-fired ovens first using available capital reserves. to minimize immediate capital outlay. Phase 2: Phase two: secure phased electrification financing to convert the remaining fleet over the following two years. while maintaining uninterrupted production capacity. Phase 3: Phase three: complete full conversion ahead of the enforcement deadline rather than waiting for potential delay. to avoid last-minute compliance risk entirely.
OUTCOME
The client completed its first phase of replacement ahead of schedule and secured phased financing for the remaining fleet conversion, reporting improved throughput at converted facilities (client-reported, unverified by MMA). The state enforcement deadline held as originally announced, validating the decision not to wait for delay.

Frequently Asked Questions

Foundational context covering the market sizes, CAGR, scope, country, region and competition that inform every finding below. This section is provided to cover basics and most often pre-purchase conversations, answered from the MMA Primary Research Dataset.

What is the current size of the Burn-off Oven Market?

The global burn-off oven market reached 0.62 billion dollars in 2025. Growth is driven by tightening emissions permitting pushing operators toward electric models across multiple regions.

How large will the Burn-off Oven Market be by 2036?

The market is projected to reach 1.018 billion dollars by 2036, up from 0.649 billion dollars in 2026. That represents a 1.57 times expansion over the forecast decade.

What is the CAGR for the Burn-off Oven Market 2026 to 2036?

The market is forecast to grow at a 4.6 percent compound annual rate between 2026 and 2036, up from an estimated 3.8 percent historical rate over 2020 to 2025.

Which segment is growing fastest?

Electric burn-off ovens for powder coating hook stripping are growing fastest, at a 6.9 percent CAGR, roughly 1.50 times the overall market rate, driven by emissions compliance pressure.

Who are the major companies in the Burn-off Oven Market?

Leading participants include Wisconsin Oven, Grieve Corporation, Despatch Industries, Thermal Product Solutions, and L&L Special Furnace, together holding roughly 44 percent combined share on a reported equipment revenue basis.

Which country is growing fastest?

China is growing fastest among major markets, expanding at an estimated 5.8 percent CAGR as domestic metal finishing capacity and electric oven technology development continue scaling.

Report Segmentation Architecture

The full report scope spans multiple orthogonal segmentation dimensions, with cross-tabulated demand data provided for each dimension pair. Coverage extends further to regional breakdowns, trend trajectories, and the competitive detail needed to support segment-level decision-making.
  • Electric Burn-off Ovens
  • Gas-Fired Burn-off Ovens
  • Hybrid Electric-Gas Systems
  • Pyrolysis Oven Systems
  • Batch Versus Continuous Processing Ovens
  • Powder Coating and Metal Finishing
  • Automotive Parts Cleaning
  • Aerospace Parts Cleaning
  • Appliance Manufacturing
  • General Industrial Hook and Rack Service
  • Direct Equipment Purchase
  • Phased Electrification Financing
  • Equipment Rental and Leasing
  • Compliance Documentation Service Contracts

By Region

  • North America
  • Western Europe
  • East Asia
  • South Asia and Pacific
  • Latin America
  • Middle East and Africa
  • Eastern Europe

Scope, Methodology, and Coverage

Every figure in this report is reproducible from documented input assumptions. The scope below maps the historical period, the forecast horizon, the segmentation dimensions, and the countries covered, alongside the underlying primary and qualitative methodology.
Historical Period
2020 to 2025
Forecast Period
2026 to 2036
Base Year
2025 (USD billions; MMA Primary Research Dataset, October 2026)
Market Definition
This market covers thermal burn-off ovens used to strip paint, powder coating, and other organic residues from metal hooks, racks, and parts through controlled combustion. It excludes chemical paint stripping systems and general industrial curing ovens sold outside dedicated burn-off applications.
Quantitative Units
USD billions (current prices); TODO additional units where applicable
Segmentation Dimensions
TODO Dim 1; TODO Dim 2; TODO Dim 3; By Region
Regions Covered
North America, Western Europe, East Asia, South Asia and Pacific, Latin America, Middle East and Africa, Eastern Europe
Countries Covered
USA, China, Germany, France, UK, Japan, South Korea, India, Australia, Canada, Brazil, Mexico, Indonesia, Vietnam, Thailand, Malaysia, UAE, Saudi Arabia, South Africa, Nigeria, Turkey, Poland, Netherlands, Italy, Spain, Sweden, Switzerland, Argentina, Colombia, Singapore, and additional markets relevant to this sector
Key Companies Profiled
TODO Comma-separated list of all 20 companies profiled.
Quantitative Methodology
Primary survey, n=3,800 respondents, Q4 2025, six countries; demand-side model with trade association cross-validation
Qualitative Methodology
47 expert interviews, Q4 2025; applied to validate demand model assumptions, identify emerging dynamics, and assess competitive positioning
Report Format
PDF and XLSX data workbook (Word format preview document)
Publisher
Market Minds Advisory
Report Code
MMA-2026-CON-667
Published
October 2026
Contact
sales@marketmindsadvisory.com | www.marketmindsadvisory.com

Purchase the full Burn-off Oven Market Report (2026 to 2036).

This report provides a complete analysis of the global burn-off oven market, covering market sizing, segmentation, and regional dynamics through 2036. It profiles the leading equipment builders across the competitive landscape. The analysis examines steel and heating element input cost exposure and margin architecture across product tiers, and details the demand mechanisms driving adoption across powder coating, automotive, and aerospace end markets worldwide. It draws on primary survey data and expert interviews conducted specifically for this research. Company disclosures round out the evidence base supporting procurement, investment, and strategic planning decisions.
Seven-region market sizing and growth forecasts
Segment-level CAGR and market share breakdowns
Competitive benchmarking of 20 named builders
Input cost exposure and mitigation strategy analysis
Margin architecture across three product tiers
Anonymized client case study with recommended strategy

Built For The People Who Decide

From boardroom strategy to bench-side execution, this report is read cover-to-cover by leaders shaping the next decade of their industry, turning demand scenarios, market dynamics and valuation benchmarks into decisions.
CXOs/ Presidents/ VPs/ Managers
M&A and Corporate Development
Strategy Teams and R&D Heads
Procurement and Product Directors
Regulatory and Compliance Leaders
Investor Relations and Equity Analysts