Market Minds Advisory
Building Thermal Insulation Market

Building Thermal Insulation Market: Renovation Mandates, Material Substitution, and the Energy Cost of Making Insulation

Renovation mandates now drive more insulation volume than new construction, while the furnaces and blowing agents that produce the material remain among the most energy exposed inputs in building products.

Lead Analyst

Bilal Shaikh

Published

September 2026

Make Smarter Decisions with Customized Research Insights

Request a free sample report and evaluate market opportunities, growth trends, and competitive dynamics relevant to your business needs.

2025 MARKET VALUE$38.4BMarket Size 2025
2036 FORECAST VALUE$72.2BBase Case , 2026 to 2036
CAGR 2026 TO 20365.9 %Bull 7.1% / Bear 4.6%
INCREMENTAL OPPORTUNITY$31.5BNet 10- year value creation
EXPANSION MULTIPLE1.77x2036 value over 2026 base
Strategic Levers
M&A Pipeline
Regional Outlook
Country Rankings
Competitive Intelligence
Segmental Deep-dive
Call-Us : 91 93563 13602

Executive Snapshot and Market Trajectory

Insulation demand has moved from the building site to the existing building. Renovation of standing stock now generates more volume than new construction across every developed market, and that shift changes which materials win and how thin the product has to be. Thickness now decides more than price does.
Commercial power sits with producers who own both a material position and an installed system, because insulation is increasingly bought as a certified wall assembly rather than a board. Aerogel and vacuum insulation panels grow fastest at 11.4%, roughly 1.93 times the market, from a base small enough that the growth rate flatters it. East Asia holds 29% of global value. Renovation supplies most of the incremental volume behind it.
Concentration is moderate at roughly 29% for the top five, and the five leaders differ sharply in material mix rather than competing head to head everywhere. Fire performance regulation after several high-profile facade failures has reshaped specification in favour of mineral products, while energy codes keep pushing the required thickness steadily upward year after year. Fire rules favour mineral products, while thickness rules favour foams, and specifiers must reconcile the two on every facade.
Market Definition
The market comprises thermal insulation materials supplied for building envelopes, covering glass wool, stone wool, expanded and extruded polystyrene, polyurethane and polyisocyanurate boards, and aerogel and vacuum insulation panels. Value is measured at manufacturer level across new construction and renovation demand. Industrial process and pipe insulation, acoustic-only products, HVAC duct insulation, cold-store panels, and installation labour fall outside scope.
Base Year Value
$38.4B in 2025 (MMA Primary Research Dataset, August 2026)
Forecast Period
2026 to 2036, eleven discrete annual values
CAGR
5.9% base case. Bull 7.1%. Bear 4.6%.
Fastest Growth Segment
Aerogel and Vacuum Insulation Panels: 11.4% CAGR
Fastest Growth Country
India: 8.9% CAGR
Fastest Growth Region
South Asia and Pacific: 8.0% CAGR
Largest Region
East Asia: 29% of 2025 global value
Market Leaders
Saint-Gobain, Kingspan Group, Rockwool A/S, Owens Corning, and Knauf Insulation lead on building insulation revenue. Source: company annual reports and MMA Analysis, July 2026.
Primary Survey
n=3,800 procurement and R&D decision-makers, Q4 2025, six countries
Methodology
Demand-side build-up, cross-validated against public data, 47 expert interviews

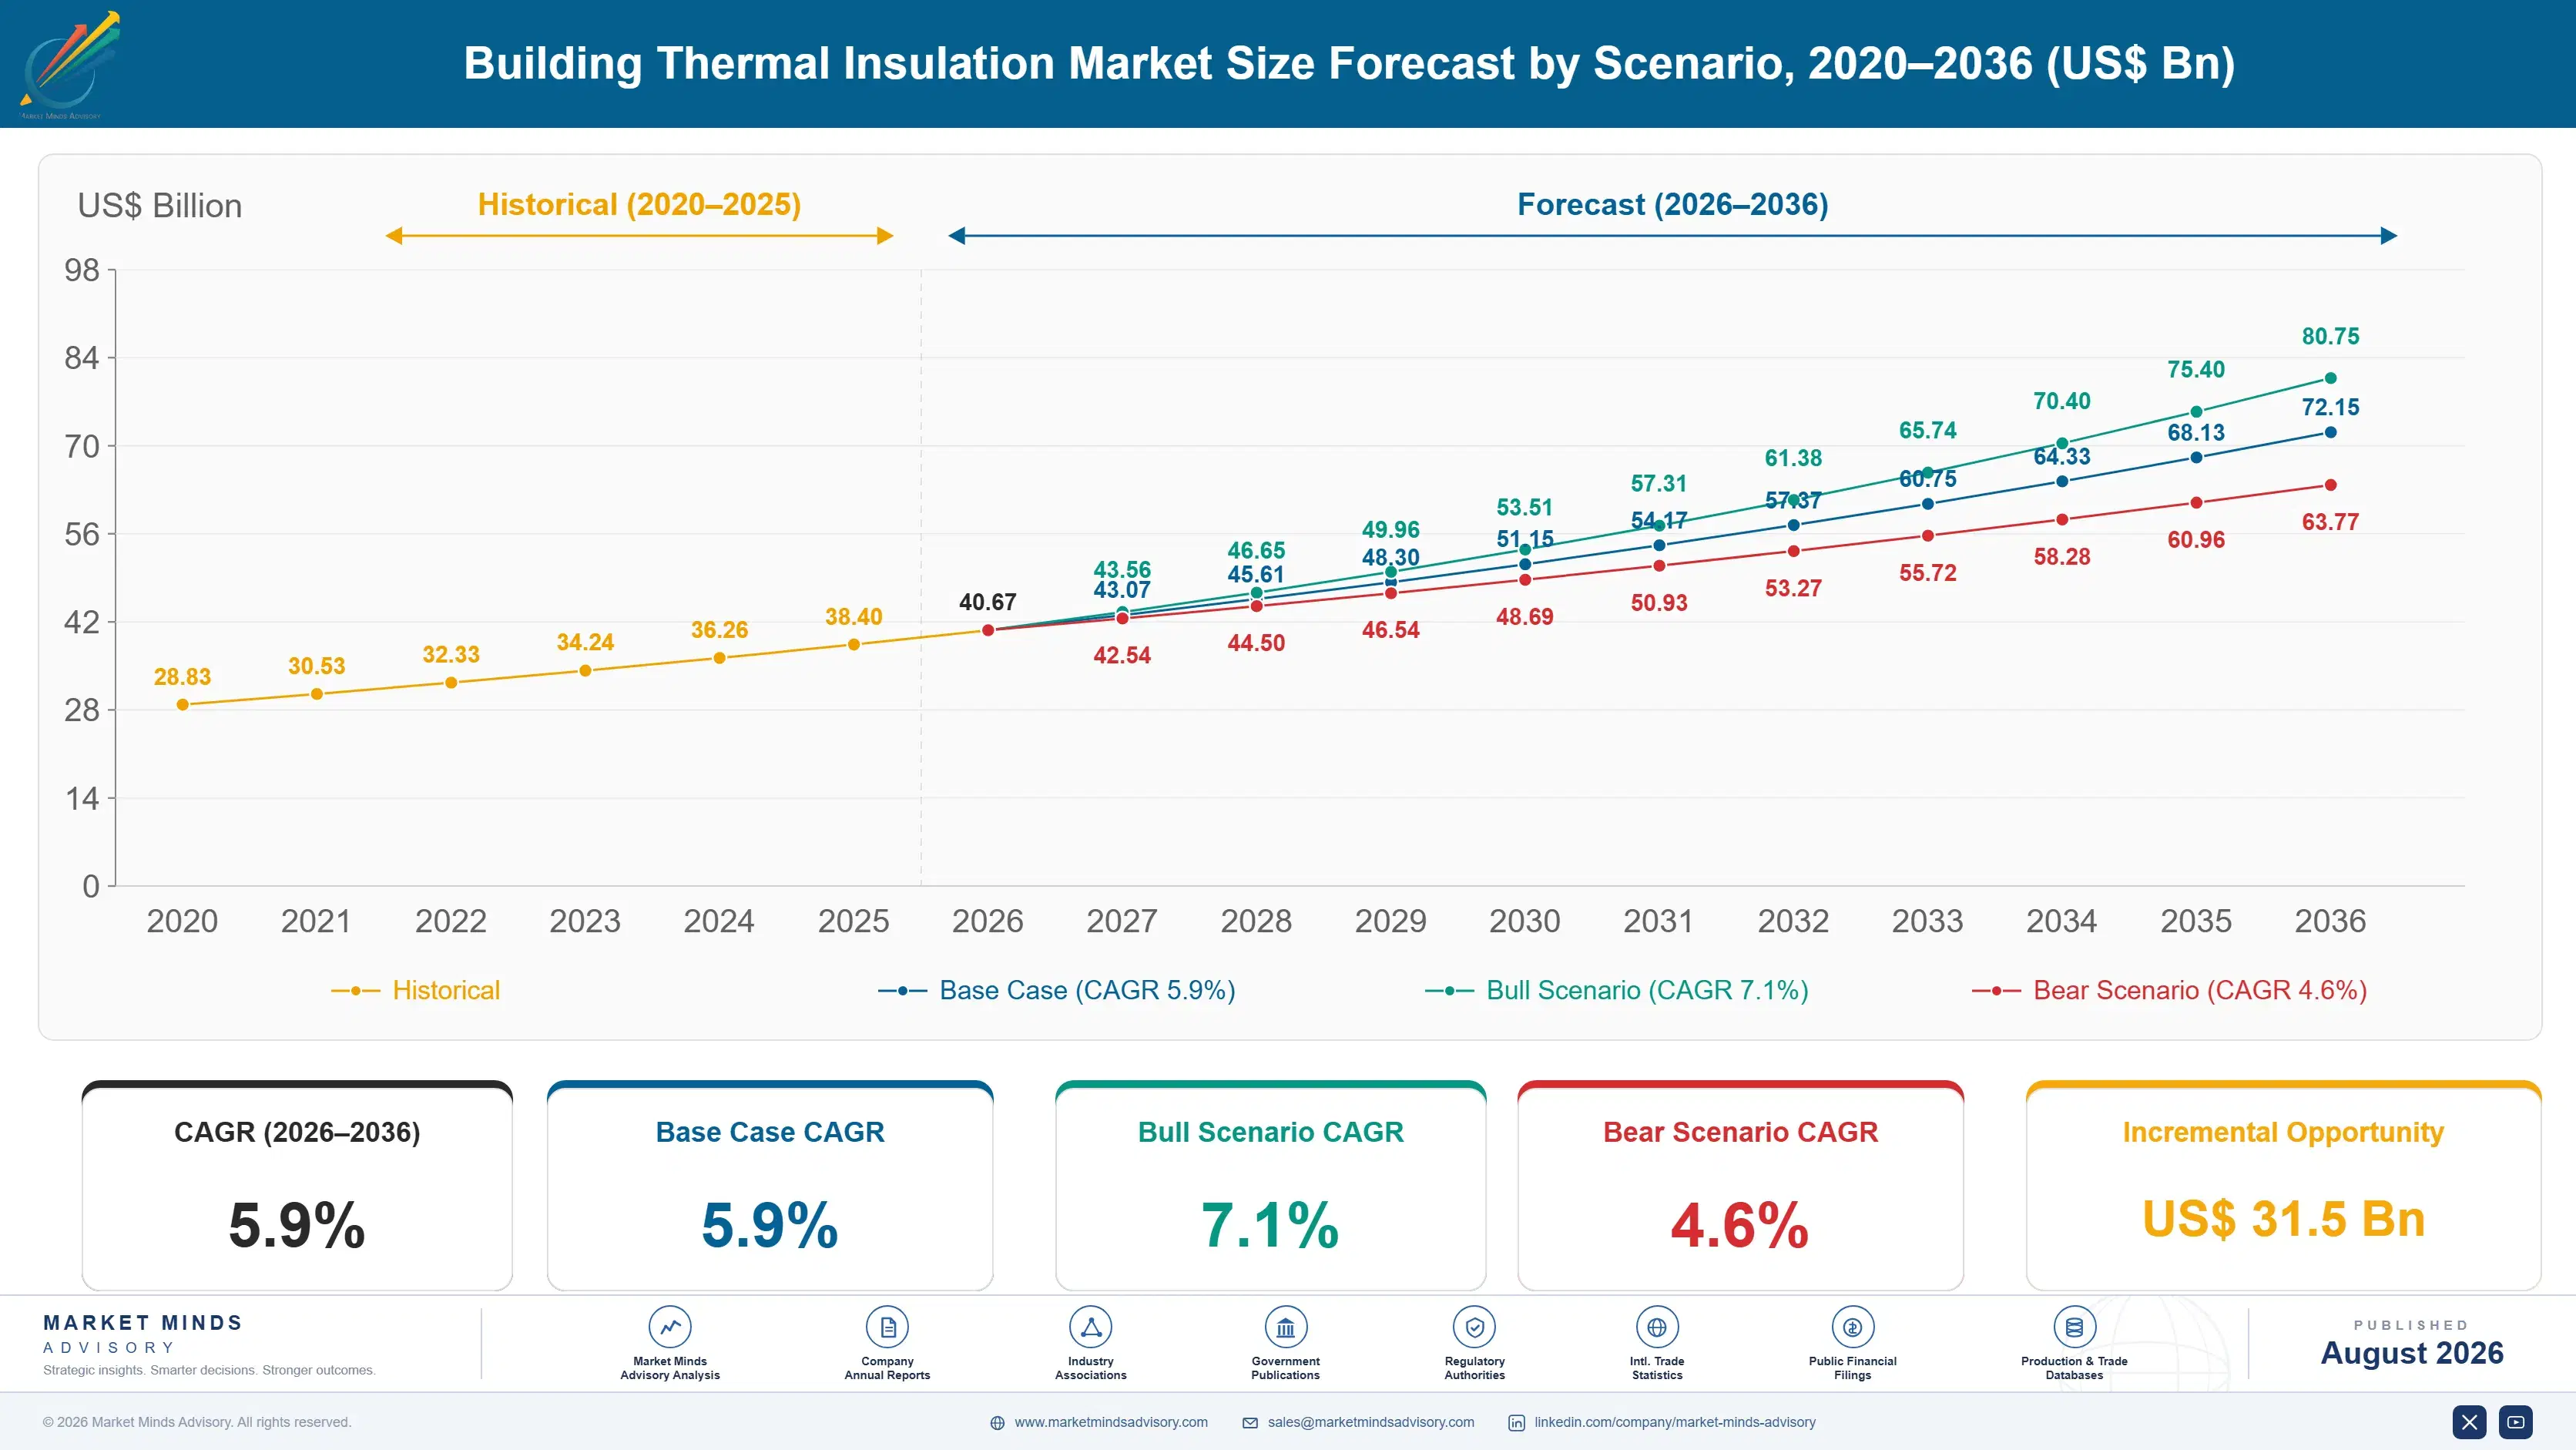
Building Thermal Insulation Market Forecast Scenarios

building-thermal-insulation-market-size-forecast-scenario-1787465361194
Between 2020 and 2025 the market grew on price more than volume. Material costs rose sharply through the European energy crisis, and producers passed most of it through because no substitute existed at scale. Renovation activity held up better than new build, which fell in several markets. The 4.8% historical growth therefore hides a volume picture that was close to flat in Western Europe across the period.
The 5.9% base case rests on three mechanisms. Renovation mandates under the recast Energy Performance of Buildings Directive and comparable national programmes convert policy into specified thickness on a defined timetable. Required insulation depth keeps rising as thermal transmittance limits tighten, which grows value per square metre without any increase in buildings treated. And fire regulation continues shifting facade specification toward mineral products that carry higher material cost per unit of thermal performance delivered.
The 7.1% bull case assumes renovation subsidy programmes hold their funding through the decade and that thin high-performance products break out of niche use. The 4.6% bear case reflects sustained residential construction weakness, subsidy withdrawal under fiscal pressure, and homeowners deferring discretionary retrofit when interest rates stay elevated. Public money decides much of which case arrives.

Where Thickness, Fire Rules, and Furnace Energy Collide

Three things set the commercial shape of this market. Regulation comes first, because almost no building owner insulates beyond what the code demands. Energy cost comes second, since melting glass and rock and producing blowing agents are genuinely energy intensive. Transport economics comes third, and it explains why insulation is made close to where it is used.
TOP-FIVE CONCENTRATION29%Share of global insulation supply held by leading producers
AVERAGE INSTALLED PRICEUSD 14.20 per sq mTypical delivered and fitted cost across mainstream wall applications
RENOVATION DEMAND SHARE58%Portion of demand arising from existing building stock upgrades
ENERGY SHARE OF COGS23%Furnace and blowing agent energy within total production cost
CAPACITY UTILISATION81%Average line loading across European and North American plants
TRADE INTENSITY18%Cross-border share of volume, limited by bulk transport economics
The material is bulky and cheap per tonne, so freight eats margin quickly. A plant serves perhaps 500 kilometres economically, which makes this a set of regional markets that look global only in the corporate accounts. Producers compete on plant footprint as much as on product. Corporate scale buys purchasing power and technical resource, not delivered-cost advantage in any given city, and that distinction explains why regional specialists survive comfortably alongside the multinationals.
Fire performance has become the specification battleground since the Grenfell Tower inquiry and comparable reviews elsewhere. Combustible facade insulation is now restricted on tall buildings across most of Europe, which handed mineral wool a protected position in a segment it previously shared. Polyurethane and polyisocyanurate keep winning in roofs and floors, where fire exposure differs and thermal performance per millimetre decides. Specifiers now reconcile the two rules on every project.
"The interesting thing about insulation is that nobody wants it. They want a compliance certificate, a lower heating bill, or a mortgage valuation, and insulation is what the regulation makes them buy to get one. That is why specification changes move this market far more than any product innovation does."
Practice Director, Building Materials and Construction Products · MMA Construction and Industrial Equipment Practice · August 2026

Market Trends

Renovation Overtakes New Build as Primary Demand Source

Existing building stock now generates roughly 58% of insulation demand across developed markets, and the proportion keeps climbing. Renovation buys differently from new construction: the installer is often a small contractor, the decision is homeowner-led or subsidy-triggered, and space constraints inside occupied buildings put a hard limit on how thick the product can be. That last point matters commercially, because it is the single condition under which expensive thin materials become the only workable answer. Producers built for volume board supply into housebuilders are discovering that the renovation channel rewards different things entirely.
Market Impact: Targets 16% reduction by 2030
Fire Regulation Redraws Facade Material Specification Across Europe

Combustible insulation is now restricted or banned on residential buildings above 11 to 18 metres depending on jurisdiction, following the Grenfell Tower inquiry and parallel reviews in France, Germany, and Australia. That removed polystyrene and polyurethane from a facade segment they had been taking share in, and handed it to stone wool and glass wool. The commercial effect is a permanent price floor in high-rise facade work, because the compliant alternatives cost more per unit of thermal resistance. Producers with mineral capacity in Europe have run those lines close to full since the rules changed.
Market Impact: Transmittance limits down 40%

Market Opportunities and Growth Drivers

European Renovation Mandates Convert Policy Into Specified Volume

The recast Energy Performance of Buildings Directive requires member states to cut residential building energy use by 16% by 2030 against a 2020 baseline, with the worst-performing stock treated first. That is a volume commitment on a legal timetable rather than an aspiration, and national programmes in Germany, France, and Italy attach money to it. Insulation is the cheapest measure per unit of energy saved in almost every building assessed, so it captures a disproportionate share of the spending. Contractors report order books extending further out than at any point in the past decade.
Market Impact: Energy reaches 23% of cost

Tightening Transmittance Limits Raise Thickness Per Treated Building

Maximum permitted thermal transmittance for walls has fallen roughly 40% across major European and North American codes over fifteen years, and each revision ratchets it further. That grows material volume per square metre treated without any increase in the number of buildings involved, which is unusually good for producers because it raises value on flat activity. It also creates the space constraint that thin high-performance products exploit. Every code cycle effectively hands the industry a volume increase that requires no marketing and no new customers to realise. Regulation does the selling that no sales force could.
Market Impact: Trade limited to 18% of volume

Market Restraints and Challenges

Energy Intensity Exposes Producers to Regional Power Price Gaps

Glass and stone wool production runs melting furnaces continuously at above 1,400 degrees Celsius, and energy reaches 23% of production cost. The root cause is physical rather than operational: the melt temperature is set by the chemistry, so no efficiency programme escapes it. European producers paid several times American gas prices through 2022 and curtailed lines rather than sell below cost. Mitigation is under way through electric melting, oxy-fuel conversion, and long-term power purchase agreements, and Rockwool has commissioned electric melting capacity. None of it closes a gas price gap of that size.
Market Impact: Renovation reaches 58% of demand

Freight Economics Cap Reach and Trap Regional Overcapacity

Insulation ships air, not material. A truckload of glass wool weighs a fraction of its volumetric limit, so delivered cost rises steeply past roughly 500 kilometres and cross-border trade stays near 18% of volume. The root cause is the low density that makes the product work thermally in the first place. When regional construction weakens, producers cannot export their way out, and utilisation falls to the low seventies quickly. Compression packaging, regional plant networks, and blowing installed on site are the responses in use, and each helps at the margin only.
Market Impact: Restrictions apply above 11 metres
4 additional market trends, 3 additional growth drivers, and 2 additional restraints and challenges are covered in the full report. Contact sales@marketmindsadvisory.com to access the complete intelligence.

Segment CAGR and Growth Architecture

Segmentation follows insulation material, because material determines thermal performance per millimetre, fire classification, plant economics, and which part of the building envelope the product can legally serve. Six material families cover the envelope market, and they compete only partially, since fire rules and available depth exclude several from any given application. Substitution happens at the margin, not across the board.
building-thermal-insulation-market-market-share-analysis-1787465361823

Aerogel and Vacuum Insulation Panels

The fastest-growing material family at 11.4%, roughly 1.93 times the market, and the smallest by a wide margin. Aerogel blankets and vacuum panels deliver thermal performance per millimetre that mineral and foam products cannot approach, at somewhere between eight and twenty times the cost per square metre. That price rules them out wherever depth is available, which is most new construction. Renovation inside occupied buildings is different: internal wall insulation steals floor area, and in high-value urban property the lost square metres cost more than the panel does. Cabot and Aspen Aerogels have both scaled capacity against that argument. Handling fragility and site damage remain unresolved commercial problems. Site protection adds cost that quotations rarely capture.
CAGR 11.4%

Polyurethane and Polyisocyanurate Boards

Second fastest at 7.1%, and the strongest position in roofs, floors, and warm-deck assemblies where fire exposure differs from facades. Rigid polyisocyanurate delivers roughly twice the thermal resistance per millimetre of glass wool, which matters wherever build-up depth is fixed by a door threshold, a roof parapet, or an existing structure. Kingspan built a business on exactly that arithmetic. The facade restrictions removed a growth avenue, but flat roofing across commercial and industrial buildings more than replaced it, and refurbishment of ageing roof stock is a large annuity. Blowing agent transitions under fluorinated gas rules have forced reformulation twice in a decade, and each round cost thermal performance. Reformulation risk has not gone away either.
CAGR 7.1%
Full segment breakdown across 6 segments available in the complete report.

Regional Architecture and Country Demand Map

Insulation is a regional business dressed as a global one, because freight economics cap sensible delivery distance near 500 kilometres. Regional differences reflect building codes, heating fuel, renovation subsidy, and construction cycle rather than any single global driver applying evenly across markets. Subsidy funding matters more than any product argument.

North America

Single-family housing sets the tone here, and fibreglass batt dominates a market built around timber frame construction and contractor familiarity. Demand tracks housing starts closely, which makes it the most cycle-exposed major region and the one where interest rates move volume fastest. The Inflation Reduction Act attached tax credits to residential efficiency upgrades, and those have grown the retrofit share meaningfully since 2023. Canadian codes run tighter than most American states, pulling average thickness upward across the northern market. Owens Corning, Johns Manville, and Knauf hold most of the fibreglass capacity, and continuous furnace economics keep the barrier to new entry high. Commercial roofing supplies the polyisocyanurate demand. Gas prices remain a competitive advantage for producers here.
Share: 24% | CAGR: 6.2% (2026 to 2036)

Western Europe

Regulation rather than construction volume drives this region, and it shows in the numbers. New housing completions have been weak across Germany, France, and the Nordics, yet value has held because renovation mandates and tightening transmittance limits keep raising material per project. The recast Energy Performance of Buildings Directive gives the demand a legal timetable through 2030 and beyond. Fire rules following the Grenfell Tower inquiry pushed facade specification decisively toward mineral wool, protecting Rockwool and Saint-Gobain positions in high-rise work. The offsetting problem is energy: European producers pay far more for gas and power than American or Middle Eastern competitors, and furnace-intensive production makes that gap visible in margin. Growth of 4.3% reflects that squeeze on a large base.
Share: 23% | CAGR: 4.3% (2026 to 2036)
Regional intelligence for 5 additional markets available in the complete report: East Asia, South Asia and Pacific, Latin America, Middle East and Africa, Eastern Europe. Contact sales@marketmindsadvisory.com.
building-thermal-insulation-market-country-cagr-analysis-1787465362394

Four Commercial Moves That Actually Pay

Insulation producers compete on plant location, material position, and specification access rather than on product novelty, so the commercial moves that pay are the ones that change what gets written into a specification or what a furnace costs to run. Four are worth capital and management attention over the forecast period. Everything else defends a commodity position at declining margin.

Sell certified wall systems rather than insulation boards

Fire regulation forced facade insulation to be tested and certified as a complete assembly, not as a material. That changed the buying unit, and it favours producers who can supply the board, the fixings, the render or cladding, and the test certificate together. System supply carries gross margins 8 to 14 percentage points above commodity board sales, because the specifier is buying compliance evidence rather than thermal resistance. It also locks out competitors who can only offer a component. Saint-Gobain and Sto both run this model. The investment is in testing programmes and technical specification teams, not in plant.
Market Impact: Adds 8 to 14 points of gross margin

Convert melting capacity to electric or oxy-fuel operation

Furnace energy is 23% of production cost and the largest controllable exposure any producer carries. Electric melting removes gas price risk entirely where power is cheap or contracted long term, and oxy-fuel conversion cuts fuel use around 20% on existing furnaces at far lower capital cost. Rockwool has commissioned electric melting, and several glass wool operators have converted to oxy-fuel. Neither is cheap: a full furnace rebuild costs upward of $70 million and takes a plant offline for months. The payback case depends entirely on the local power-to-gas price ratio, which is why the answer differs by country.
Market Impact: Cuts furnace fuel use by roughly 20% overall

Build a thin high-performance range for constrained retrofit

Internal wall insulation in occupied buildings competes against floor area, and in high-value urban property the lost space costs more than any premium material. Aerogel blankets and vacuum panels win there on arithmetic rather than on sustainability arguments. The addressable slice is small but grows at 11.4%, and pricing runs 8 to 20 times conventional board per square metre. Producers without a position are ceding a category that will matter more as renovation deepens in dense cities. Entry is possible through partnership rather than manufacture, since the material makers need channel access as badly as board producers need the range.
Market Impact: Captures a niche segment growing at 11.4% annually

Own the renovation contractor channel, not the housebuilder

Renovation now supplies 58% of demand, and it reaches the market through thousands of small contractors and merchants rather than a handful of national housebuilders. That channel is fragmented, loyal to whoever trains and supports it, and far less price-transparent than tendered new build supply. Merchant and installer programmes typically hold 5 to 9 percentage points of price advantage over volume housebuilder contracts on comparable product. Building it takes years of technical training, installer certification, and stock availability rather than capital, which is exactly why competitors find it hard to replicate quickly.
Market Impact: Holds 5 to 9 points of price advantage

Who Controls the Margin Pool

Concentration is moderate: the top five producers hold roughly 29% of global building insulation revenue, and the gap between the leader and the fifth is narrower than in most building products. Saint-Gobain leads on breadth across materials and geographies rather than dominance in any one. Kingspan sits behind it on a far more concentrated position in rigid boards, and Rockwool competes as a single-material specialist with the strongest position in the fire-regulated segment.
Competitive activity runs on three fronts. Plant footprint is the first, because freight economics mean the nearest producer usually wins on delivered cost. Material breadth is the second, and it decides whether a producer can serve a whole envelope specification or only part of it. Certification and technical service is the third, and it has become more valuable since fire rules made assemblies rather than materials the tested unit.

Pressure is building from two directions. Gulf and Chinese producers on cheap energy are competitive in any market they can reach economically, which restrains European export ambitions. And embodied carbon requirements entering procurement rules favour mineral and bio-based products over foams, which would shift rankings if the rules tighten as drafted.
building-thermal-insulation-market-company-positioning-matrix-1787465362966

Competitive Moat and Risk Dimensions

SAINT-GOBAIN

Moat: Breadth across every material

No competitor matches the combination of glass wool, stone wool, foam, plaster, and facade systems supplied from plants close to almost every major European and North American market. That breadth lets Saint-Gobain quote a whole envelope specification where single-material producers can only bid a component, and it makes the company difficult to displace on any large project.
SAINT-GOBAIN

Risk: European energy cost exposure

The same European plant concentration that provides delivered-cost advantage inside the region leaves the company paying gas and power prices several times those of Gulf, American, or Chinese competitors. Furnace-intensive production makes that gap visible in reported margin, and no operational programme closes a fuel price difference of that magnitude on its own.
KINGSPAN GROUP

Moat: Rigid board thermal performance

Polyisocyanurate delivers roughly twice the thermal resistance per millimetre of mineral alternatives, and Kingspan has built manufacturing, specification relationships, and roofing system credibility around that single physical advantage. Wherever build-up depth is fixed by an existing structure or a roof detail, the arithmetic favours the company before any commercial argument is made at all.
KINGSPAN GROUP

Risk: Combustibility and regulatory drift

Facade restrictions following the Grenfell Tower inquiry removed a growth segment and attached reputational cost that persists. If fire rules extend further down the height range, or embodied carbon procurement rules penalise hydrocarbon-derived foams as several draft frameworks propose, the concentrated material position becomes a concentrated exposure instead.

Players Tracked

Prominent Players

Saint-Gobain
Kingspan Group
Rockwool A/S
Owens Corning
Knauf Insulation

Other Key Players

Johns Manville
BASF
Recticel
URSA Insulation
Beijing New Building Materials
Huntsman
Dow
Sika
Soprema
TechnoNICOL
Armacell
Cabot Corporation
Aspen Aerogels
Nichias
Sto SE & Co. KGaA

Recent Developments

MARCH 2025

Rockwool commissions electric melting capacity

The company brought additional electrically melted stone wool capacity into operation, extending a technology it has developed over several years. Electric melting removes direct gas exposure from the most energy intensive step and cuts process emissions substantially where the grid supply is already decarbonised. Capital cost remains substantial.
Signal: Energy cost, and not carbon reporting alone, is now driving genuine capital decisions in furnace technology
SEPTEMBER 2025

Kingspan expands North American roofing capacity

A new insulated panel and roofing board line entered service, adding capacity aimed at commercial roofing demand outside Europe. The expansion was organic rather than acquisitive, and it reduces the group's revenue dependence on European facade and construction markets after several weak quarters. Roofing demand has proved steadier.
Signal: Geographic rebalancing away from European facade exposure is being executed through capital spending rather than deals
JUNE 2025

Aspen Aerogels scales building retrofit supply

The company expanded supply of aerogel blanket products directed at internal wall retrofit in space-constrained buildings, targeting the European renovation programmes. Volumes remain small against mineral and foam board, and pricing stays several multiples above conventional material on a comparable thermal basis. Renovation depth is the growth condition here.
Signal: Thin high-performance insulation is finding a real niche, but the price gap still confines it to constrained projects

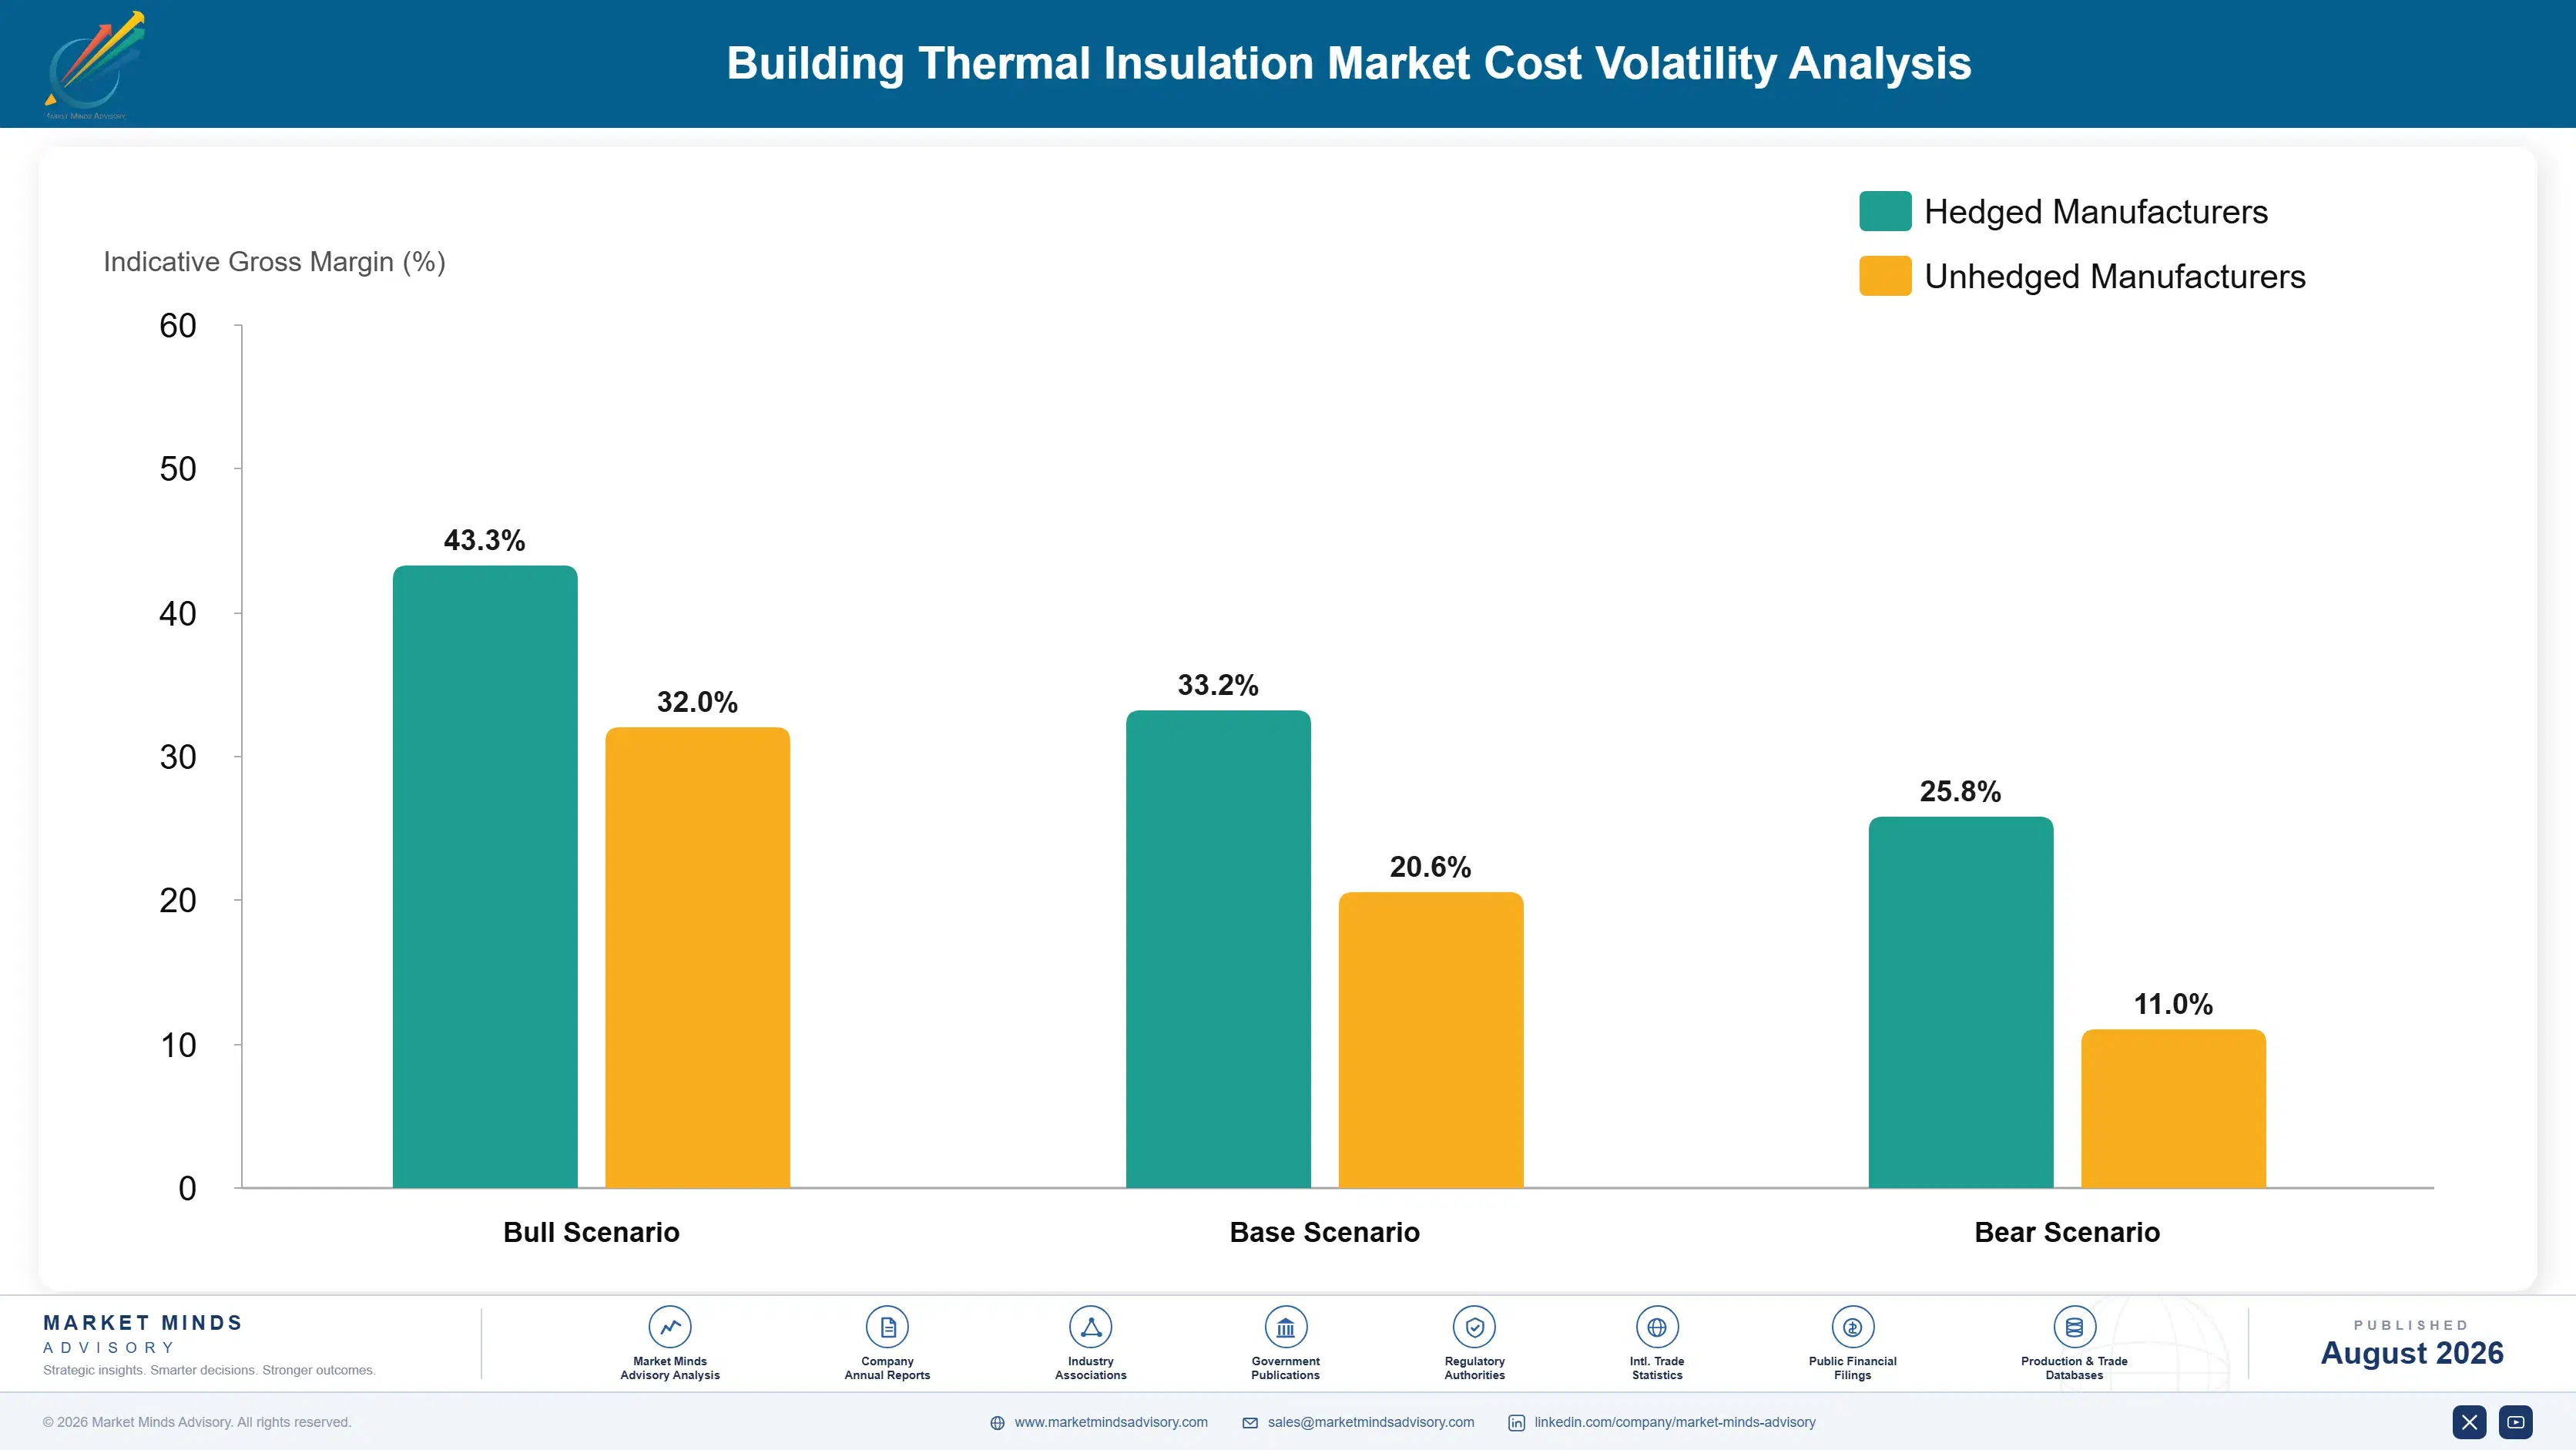
What Actually Sets the Cost Base

Energy is the defining exposure at roughly 23% of production cost, split between furnace fuel for mineral products and blowing agent plus feedstock energy for foams. Raw materials account for 31%: sand, cullet, and basalt for mineral wool, and styrene, polyol, and isocyanate for foams. Binder chemistry contributes 9%. Freight absorbs an unusually high 11% because the product ships volume rather than weight.
European gas prices through 2021 and 2022 exposed the difference between regions with brutal clarity. IEA reporting documented industrial gas costs in Europe reaching multiples of North American levels, and several insulation producers curtailed furnace output rather than run below cost, with lines idled in Germany and the Netherlands. Saint-Gobain and Rockwool both referenced energy cost pressure across their 2023 reporting. The gap against American and Gulf gas has not closed since.

Exposure divides on furnace technology and power contract rather than on scale. Producers running electric melting on contracted low-carbon power held cost position through the gas spike, while gas-fired glass and stone wool operations absorbed the full increase. Foam producers face a different exposure, since styrene and isocyanate track petrochemical cycles. Gas price gaps of that size close through no operational programme.
building-thermal-insulation-market-cost-volatility-analysis-1787465363167

Convert furnaces to electric melting on contracted power

Electric melting removes direct gas exposure from the largest energy step and shifts it to a power contract that can be fixed for a decade. Rockwool has commissioned capacity on this basis. Capital cost runs upward of $70 million per furnace rebuild and the plant is offline for months, so the case depends heavily on the local power-to-gas price relationship.

Raise recycled cullet and slag content in mineral melts

Recycled glass cullet melts at lower temperature than raw batch, cutting furnace energy demand measurably for every percentage point substituted. Slag and recovered mineral fibre serve a similar purpose in stone wool production. Collection infrastructure and contamination control are the practical constraints, and both improve with volume rather than with any technical breakthrough being required.

Index long-term supply contracts to published energy benchmarks

Fixed-price annual contracts with housebuilders and merchants proved expensive when gas moved several hundred percent inside a year. Indexing to published gas or power benchmarks shifts that risk back to buyers who can hedge it more cheaply than producers can. Customer resistance is real, and it softens noticeably after any period of severe input price volatility passes.

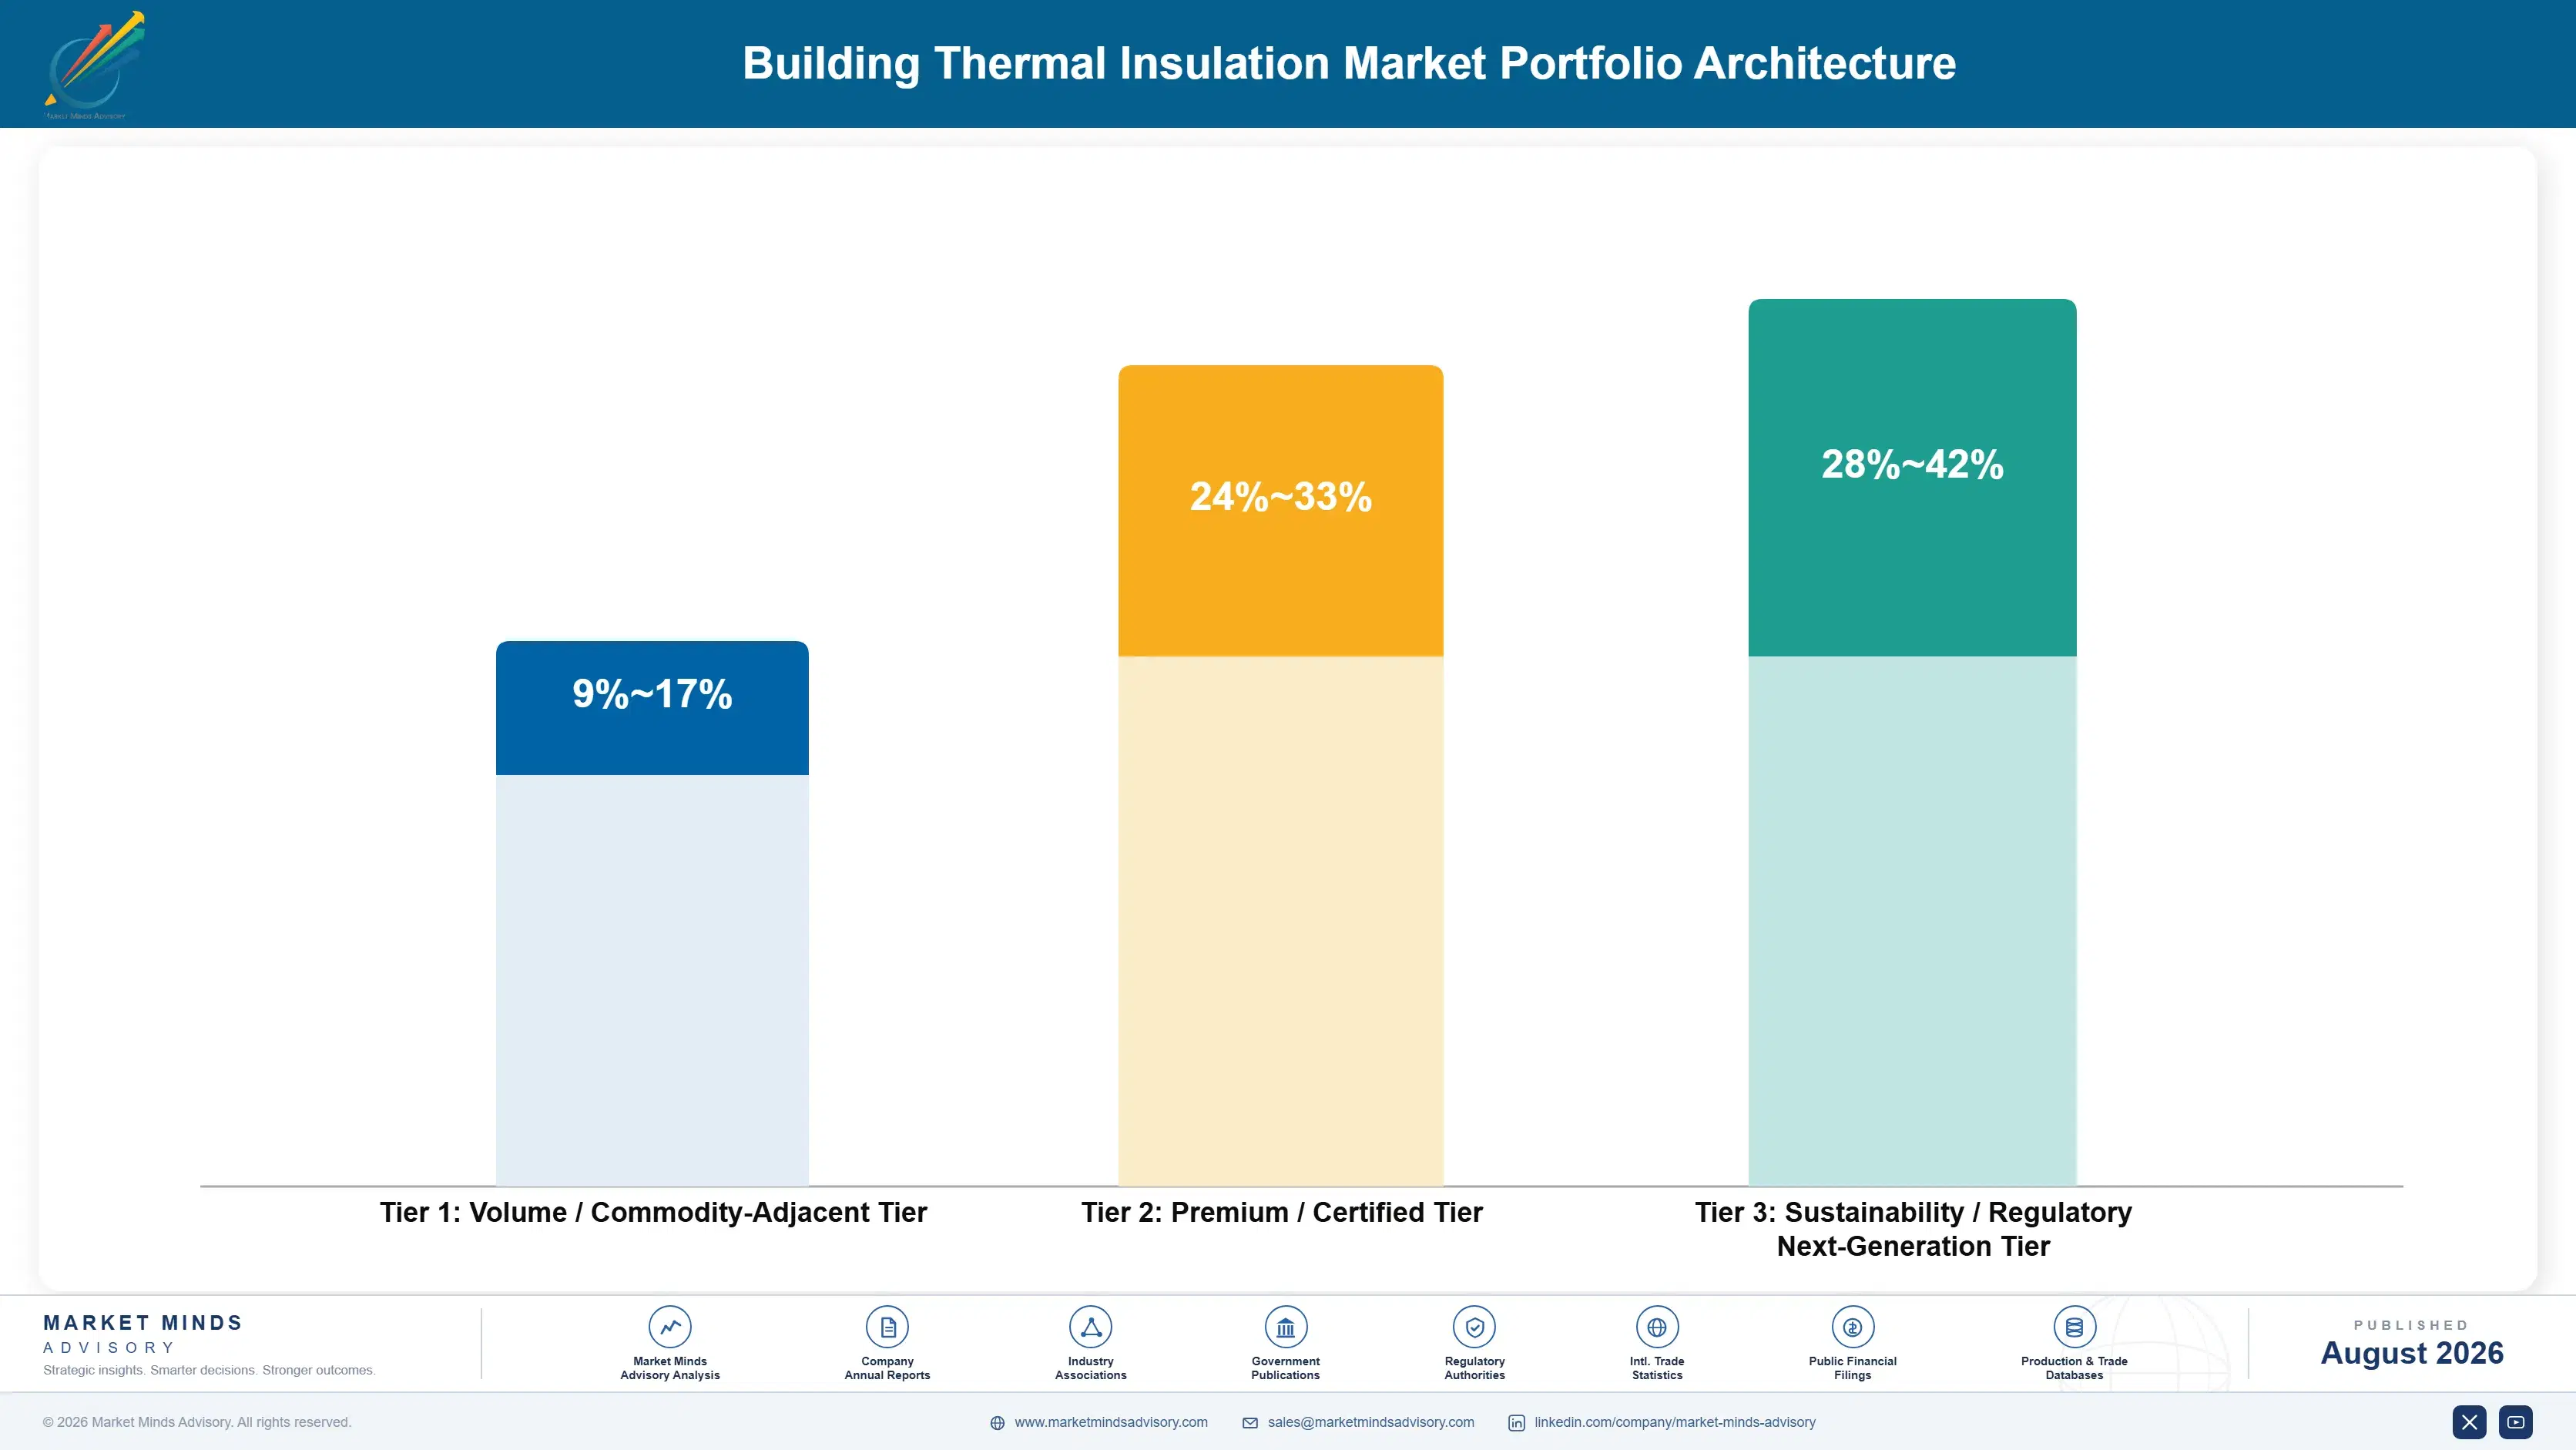
Portfolio Architecture for Margin Defence

Margin in insulation follows certification and thermal performance per millimetre, not volume. Commodity board sold against a housebuilder tender earns single-digit to low-teens gross margin, because the specification names a performance level that four producers can meet and the tender picks on price. Certified facade systems and high-performance rigid boards earn materially more, since the buyer is purchasing compliance evidence or space saving rather than a commodity.
The volume and premium tension is unusually sharp here because plant utilisation drives the whole cost base. Continuous furnaces cannot be turned down economically, so producers chase commodity volume to keep lines loaded even when the margin barely covers conversion. That produces a portfolio where low-margin business is not optional; it is what makes the high-margin business affordable to produce at all.

High-value pools concentrate in three places: certified facade systems in fire-regulated high-rise work, rigid board in depth-constrained roofing and flooring, and thin high-performance material in urban internal retrofit. Each is defended by something other than price, which is precisely why the margins hold. Price competition arrives in each of them only when a competitor matches the certificate, the millimetre performance, or the channel position, and that takes years rather than quarters.

Volume / Commodity-Adjacent Tier

Standard glass wool batt and expanded polystyrene board supplied against housebuilder tenders and merchant stock programmes. Wins on delivered cost from the nearest plant. The wide range reflects large regional differences in energy cost and furnace technology.
Gross Margin: 9%-17%

Premium / Certified Tier

Certified facade systems, fire-tested assemblies, and high-performance rigid polyisocyanurate board. The buyer purchases compliance evidence or space saving rather than thermal resistance alone, and switching means re-testing the whole assembly.
Gross Margin: 24%-33%

Sustainability / Regulatory / Next-Generation Tier

Aerogel blankets, vacuum insulation panels, bio-based and recycled-content products carrying verified embodied carbon declarations. Small volumes at high prices, sold on space constraint or procurement rules. The range is wide because pricing has not settled.
Gross Margin: 28%-42%
building-thermal-insulation-market-portfolio-architecture-1787465363671

High-value Sub-segments and Strategic Watch-out

Certified Facade Insulation Systems

The highest-value pool in the market. Fire regulation made the tested assembly rather than the board the purchased unit, which favours producers who supply the whole system with its certificate. Re-testing cost makes substitution genuinely difficult once specified. Technical service capability decides who holds the specification.
Gross Margin: 26%-35%

High-Performance Rigid Roofing Board

Twice the thermal resistance per millimetre of mineral alternatives, which decides specification wherever roof build-up depth is fixed. Commercial and industrial roof refurbishment supplies a long annuity of replacement demand. Blowing agent regulation is the standing risk to performance. Depth constraint is the durable commercial argument here.
Gross Margin: 22%-30%

Volume Glass Wool and Polystyrene Board

The utilisation engine rather than the profit engine. Continuous furnaces must run, and this business keeps them loaded through construction cycles that would otherwise idle capacity. Price it for contribution and plant loading, and expect nothing beyond that. Treat it as loading, and negotiate a contribution floor.
Gross Margin: 9%-16%

Thin High-Performance Retrofit Material

The strategic watch-out. Growth of 11.4% is real but the base is tiny, and the price gap against conventional board confines it to projects where floor area is worth more than the panel. Handling fragility remains an unsolved commercial problem. Partnership beats manufacture for anyone entering today.
Gross Margin: 28%-42%

How Demand Actually Reaches Producers

Insulation has almost no annuity in the usual sense. It is installed once and lasts the life of the building, so there is no replacement cycle worth modelling on residential walls. The annuity that does exist sits in commercial flat roofing, where the waterproofing membrane above the insulation fails on a twenty to thirty year cycle and the board is replaced with it. That refurbishment stream is predictable, which is why roofing-weighted producers show steadier volumes.
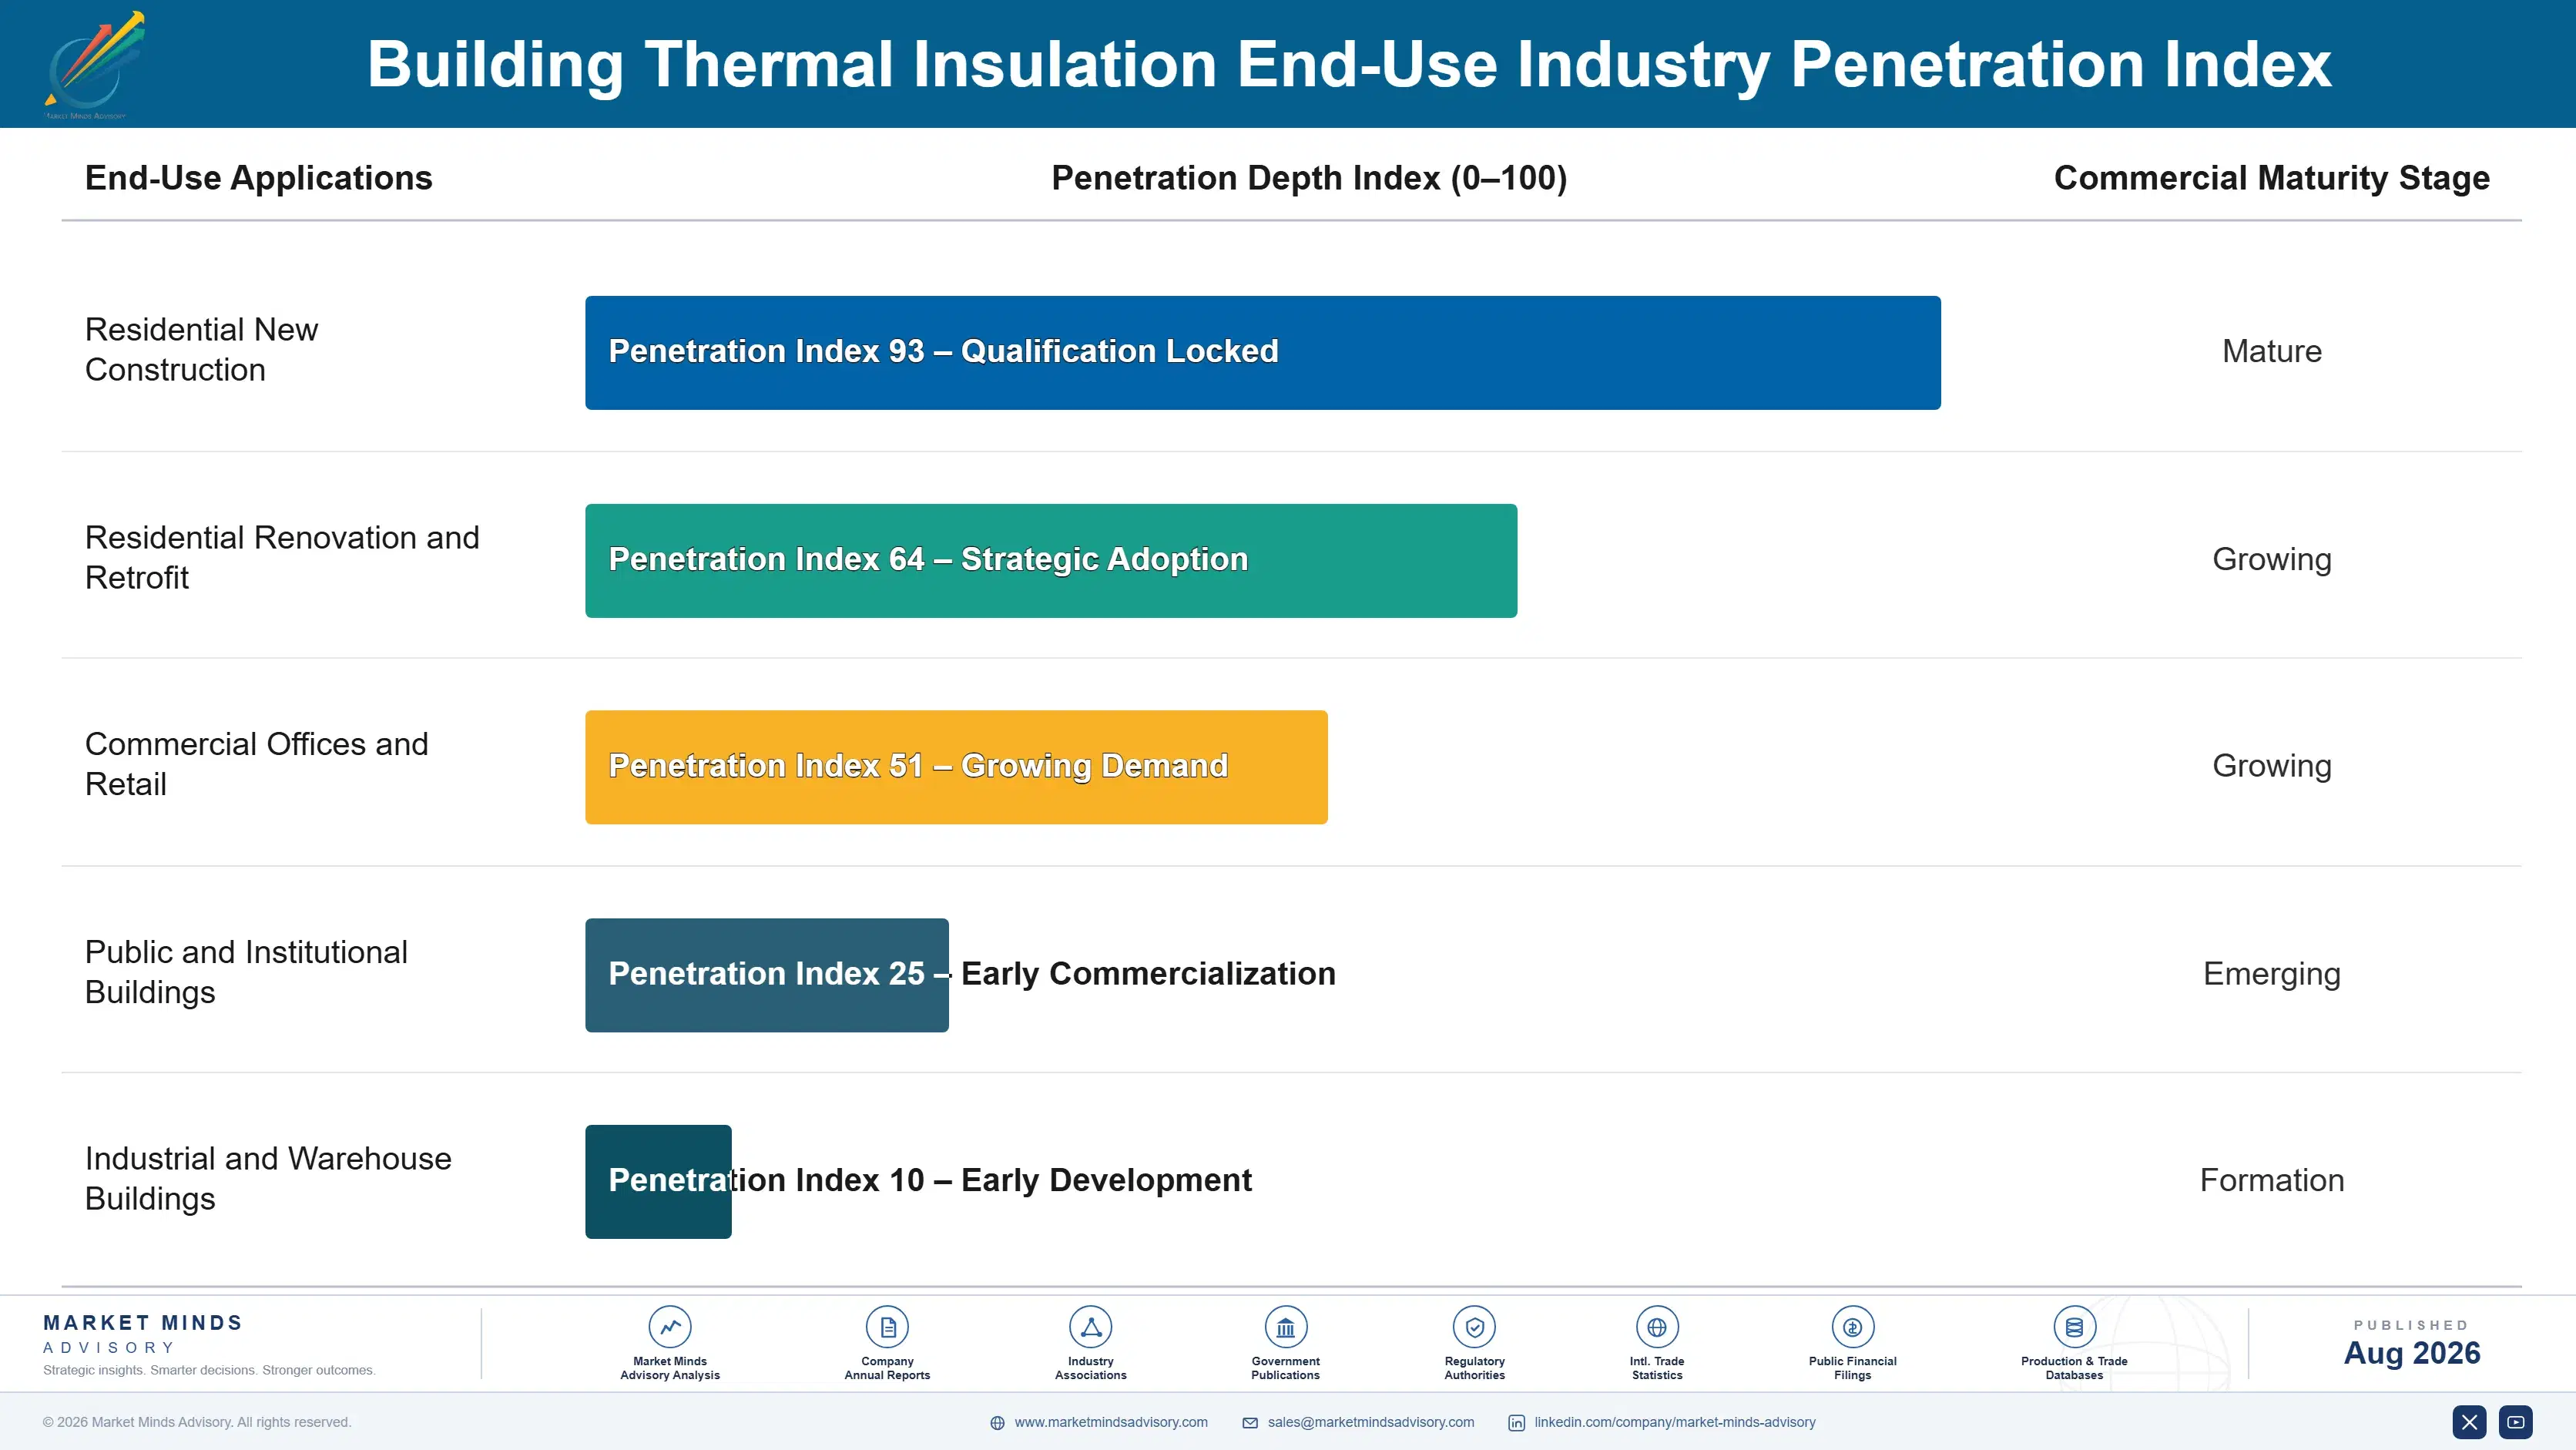
Adoption depth varies sharply by vertical. New residential construction insulates to whatever the code requires and no further, so demand there is a direct function of regulation and starts. Commercial offices go deeper because energy performance certificates affect valuation and lettability. Public buildings follow procurement rules that increasingly price embodied carbon, and industrial buildings insulate where process heat makes the payback short.

The buyer has changed. Specification used to sit with architects; it now sits with facade consultants, energy assessors, and compliance managers who read test certificates rather than product literature. That audience compares tested performance data across suppliers before an architect sees a single product name, which has shifted marketing spend away from brand and toward certification, technical documentation, and installer training programmes.
building-thermal-insulation-market-end-use-penetration-index-1787465364165

Where the Money Sits

These are among the four positions where our research anticipates prominent divergence between winners and laggards over the coming forecast period. Each is grounded in the demand model, the regulatory perimeter, and the announced capacity pipeline.
01 / CERTIFIED SYSTEM SUPPLY

Sell the tested assembly, because the board alone is a commodity

Fire regulation changed the purchased unit from a material to a certified assembly, and that single shift moved 8 to 14 percentage points of gross margin toward producers who can supply the whole system with its test evidence attached. Component suppliers now bid into a specification written around somebody else's certificate, which is a permanently weaker position to occupy. Building the testing programme and technical specification team costs far less than a furnace and defends far more revenue than any plant investment could.
02 / FURNACE ENERGY STRATEGY

Fix the power position before the next gas cycle arrives

Energy is 23% of production cost and the exposure is physical, since melt temperature is set by chemistry rather than by any operational choice available to management. Producers who converted to electric melting on contracted power held their cost position through the European gas spike while gas-fired competitors curtailed output and lost customers. A furnace rebuild above $70 million is genuinely expensive, but the alternative is carrying an entirely uncontrolled input cost on the largest single line item in the plant.
03 / RENOVATION CHANNEL ACCESS

The growth is in retrofit, and it buys through different people

Renovation supplies 58% of demand and reaches the market through fragmented contractors and merchants rather than the national housebuilders that volume producers were built to serve. That particular channel pays 5 to 9 percentage points more for comparable product and stays loyal to whoever trains and stocks it properly. Building it takes years of patient installer certification and technical support rather than capital, which is the whole reason that competitors with deeper balance sheets cannot simply buy their way in.
04 / THIN MATERIAL POSITION

Take a position in aerogel now, through partnership not plant

Aerogel and vacuum panels grow at 11.4%, roughly 1.93 times the market, and win on floor-area arithmetic rather than on any sustainability argument in dense urban retrofit work. The base is still small enough that manufacturing investment cannot be justified today on any honest projection of near-term volume growth. Partnership gives board producers the range they lack and gives aerogel makers the specification channel access they need, at a small fraction of what building dedicated capacity would cost either party.

Engagement Snapshot From the Field

A live engagement with an industry participant carrying material or product regulatory and market exposure ahead of a defining policy shift, showing how our research translates into a defensible multi-year portfolio strategy.
MARKET MINDS ADVISORY · CLIENT ENGAGEMENT SUMMARY
Building Thermal Insulation Producer Strategic Portfolio Review and Transition Roadmap 2026·Investment Scenario on Building Thermal Insulation Exposure Evaluation 2025-26
CLIENT PROFILE
A European mineral wool manufacturer with four production sites and revenue concentrated in volume glass wool supplied to national housebuilders across three countries. The business had grown for two decades on plant proximity and tender pricing, and held roughly 6% regional share (client-reported, unverified by MMA). Renovation and certified system work together accounted for under a fifth of revenue, well behind regional peers.
STRATEGIC CHALLENGE
Housebuilder volumes had fallen for eight consecutive quarters while furnace utilisation dropped to 74%, and management faced a decision between chasing tender volume at deteriorating margin or reallocating commercial resource toward renovation and system supply. Neither the sales organisation nor the technical function was built for the second option, and the board wanted evidence before committing.
MMA APPROACH
MMA sized renovation demand by country and building type, mapped the merchant and contractor channel structure against the client's existing coverage, and modelled margin outcomes for volume tender work against certified system supply. Forty-seven expert interviews with specifiers, merchants, and installers established what actually drives brand selection in retrofit, which tender data cannot show.
KEY FINDINGS
  1. Renovation channel pricing ran 7 percentage points above housebuilder tender pricing on comparable product, and merchant loyalty proved far stickier than any procurement relationship the client held.
  2. Certified facade system revenue carried gross margin 11 points above board supply, but required a testing programme the client had repeatedly deferred as a cost rather than treating it as an investment.
  3. Furnace utilisation below 78% destroyed more margin than low-price tender work recovered, meaning volume business retained real value purely as plant loading rather than as profit.
  4. Installer training reach, not price or product specification, explained roughly two-thirds of brand preference variation across the merchant channel in the three countries examined.
CLIENT PROFILE
A European mineral wool manufacturer with four production sites and revenue concentrated in volume glass wool supplied to national housebuilders across three countries. The business had grown for two decades on plant proximity and tender pricing, and held roughly 6% regional share (client-reported, unverified by MMA). Renovation and certified system work together accounted for under a fifth of revenue, well behind regional peers.
STRATEGIC CHALLENGE
Housebuilder volumes had fallen for eight consecutive quarters while furnace utilisation dropped to 74%, and management faced a decision between chasing tender volume at deteriorating margin or reallocating commercial resource toward renovation and system supply. Neither the sales organisation nor the technical function was built for the second option, and the board wanted evidence before committing.
MMA APPROACH
MMA sized renovation demand by country and building type, mapped the merchant and contractor channel structure against the client's existing coverage, and modelled margin outcomes for volume tender work against certified system supply. Forty-seven expert interviews with specifiers, merchants, and installers established what actually drives brand selection in retrofit, which tender data cannot show.
KEY FINDINGS
  1. Renovation channel pricing ran 7 percentage points above housebuilder tender pricing on comparable product, and merchant loyalty proved far stickier than any procurement relationship the client held.
  2. Certified facade system revenue carried gross margin 11 points above board supply, but required a testing programme the client had repeatedly deferred as a cost rather than treating it as an investment.
  3. Furnace utilisation below 78% destroyed more margin than low-price tender work recovered, meaning volume business retained real value purely as plant loading rather than as profit.
  4. Installer training reach, not price or product specification, explained roughly two-thirds of brand preference variation across the merchant channel in the three countries examined.
RECOMMENDED STRATEGY
Phase 1: Phase one: fund the facade system testing programme immediately and hire technical specification staff, treating certification as infrastructure rather than as discretionary marketing spend. Phase 2: Phase two: build installer training and merchant stocking coverage in the two countries with the strongest renovation subsidy programmes, before competitors extend their own channel positions. Phase 3: Phase three: hold volume tender business explicitly for furnace loading at a defined contribution floor, and decline anything below it without further internal negotiation.
OUTCOME
The client committed to the testing programme and opened two installer training centres within eleven months. Renovation and system revenue reached 29% of the total by the following year, and blended gross margin improved 3.4 percentage points while furnace utilisation recovered to 82% (client-reported, unverified by MMA).

Frequently Asked Questions

Foundational context covering the market sizes, CAGR, scope, country, region and competition that inform every finding below. This section is provided to cover basics and most often pre-purchase conversations, answered from the MMA Primary Research Dataset.

What is the current size of the Building Thermal Insulation Market?

The market was valued at USD 38.4 billion in 2025, rising to an estimated USD 40.67 billion in 2026. East Asia holds the largest regional share at 29% of global value.

How large will the Building Thermal Insulation Market be by 2036?

MMA forecasts USD 72.15 billion by 2036 under the base case, an expansion multiple of 1.77 times the 2026 value. That represents USD 31.48 billion of incremental value added across the forecast period.

What is the CAGR for the Building Thermal Insulation Market 2026 to 2036?

The base case CAGR is 5.9%, with a bull case of 7.1% and a bear case of 4.6%. The spread reflects uncertainty over renovation subsidy funding and residential construction recovery.

Which segment is growing fastest?

Aerogel and vacuum insulation panels grow fastest at 11.4%, roughly 1.93 times the market rate. Polyurethane and polyisocyanurate boards follow at 7.1%, driven by roofing and depth-constrained applications.

Who are the major companies in the Building Thermal Insulation Market?

Saint-Gobain, Kingspan Group, Rockwool A/S, Owens Corning, and Knauf Insulation lead on building insulation revenue. The top five hold roughly 29% of global value, with a long regional tail behind them.

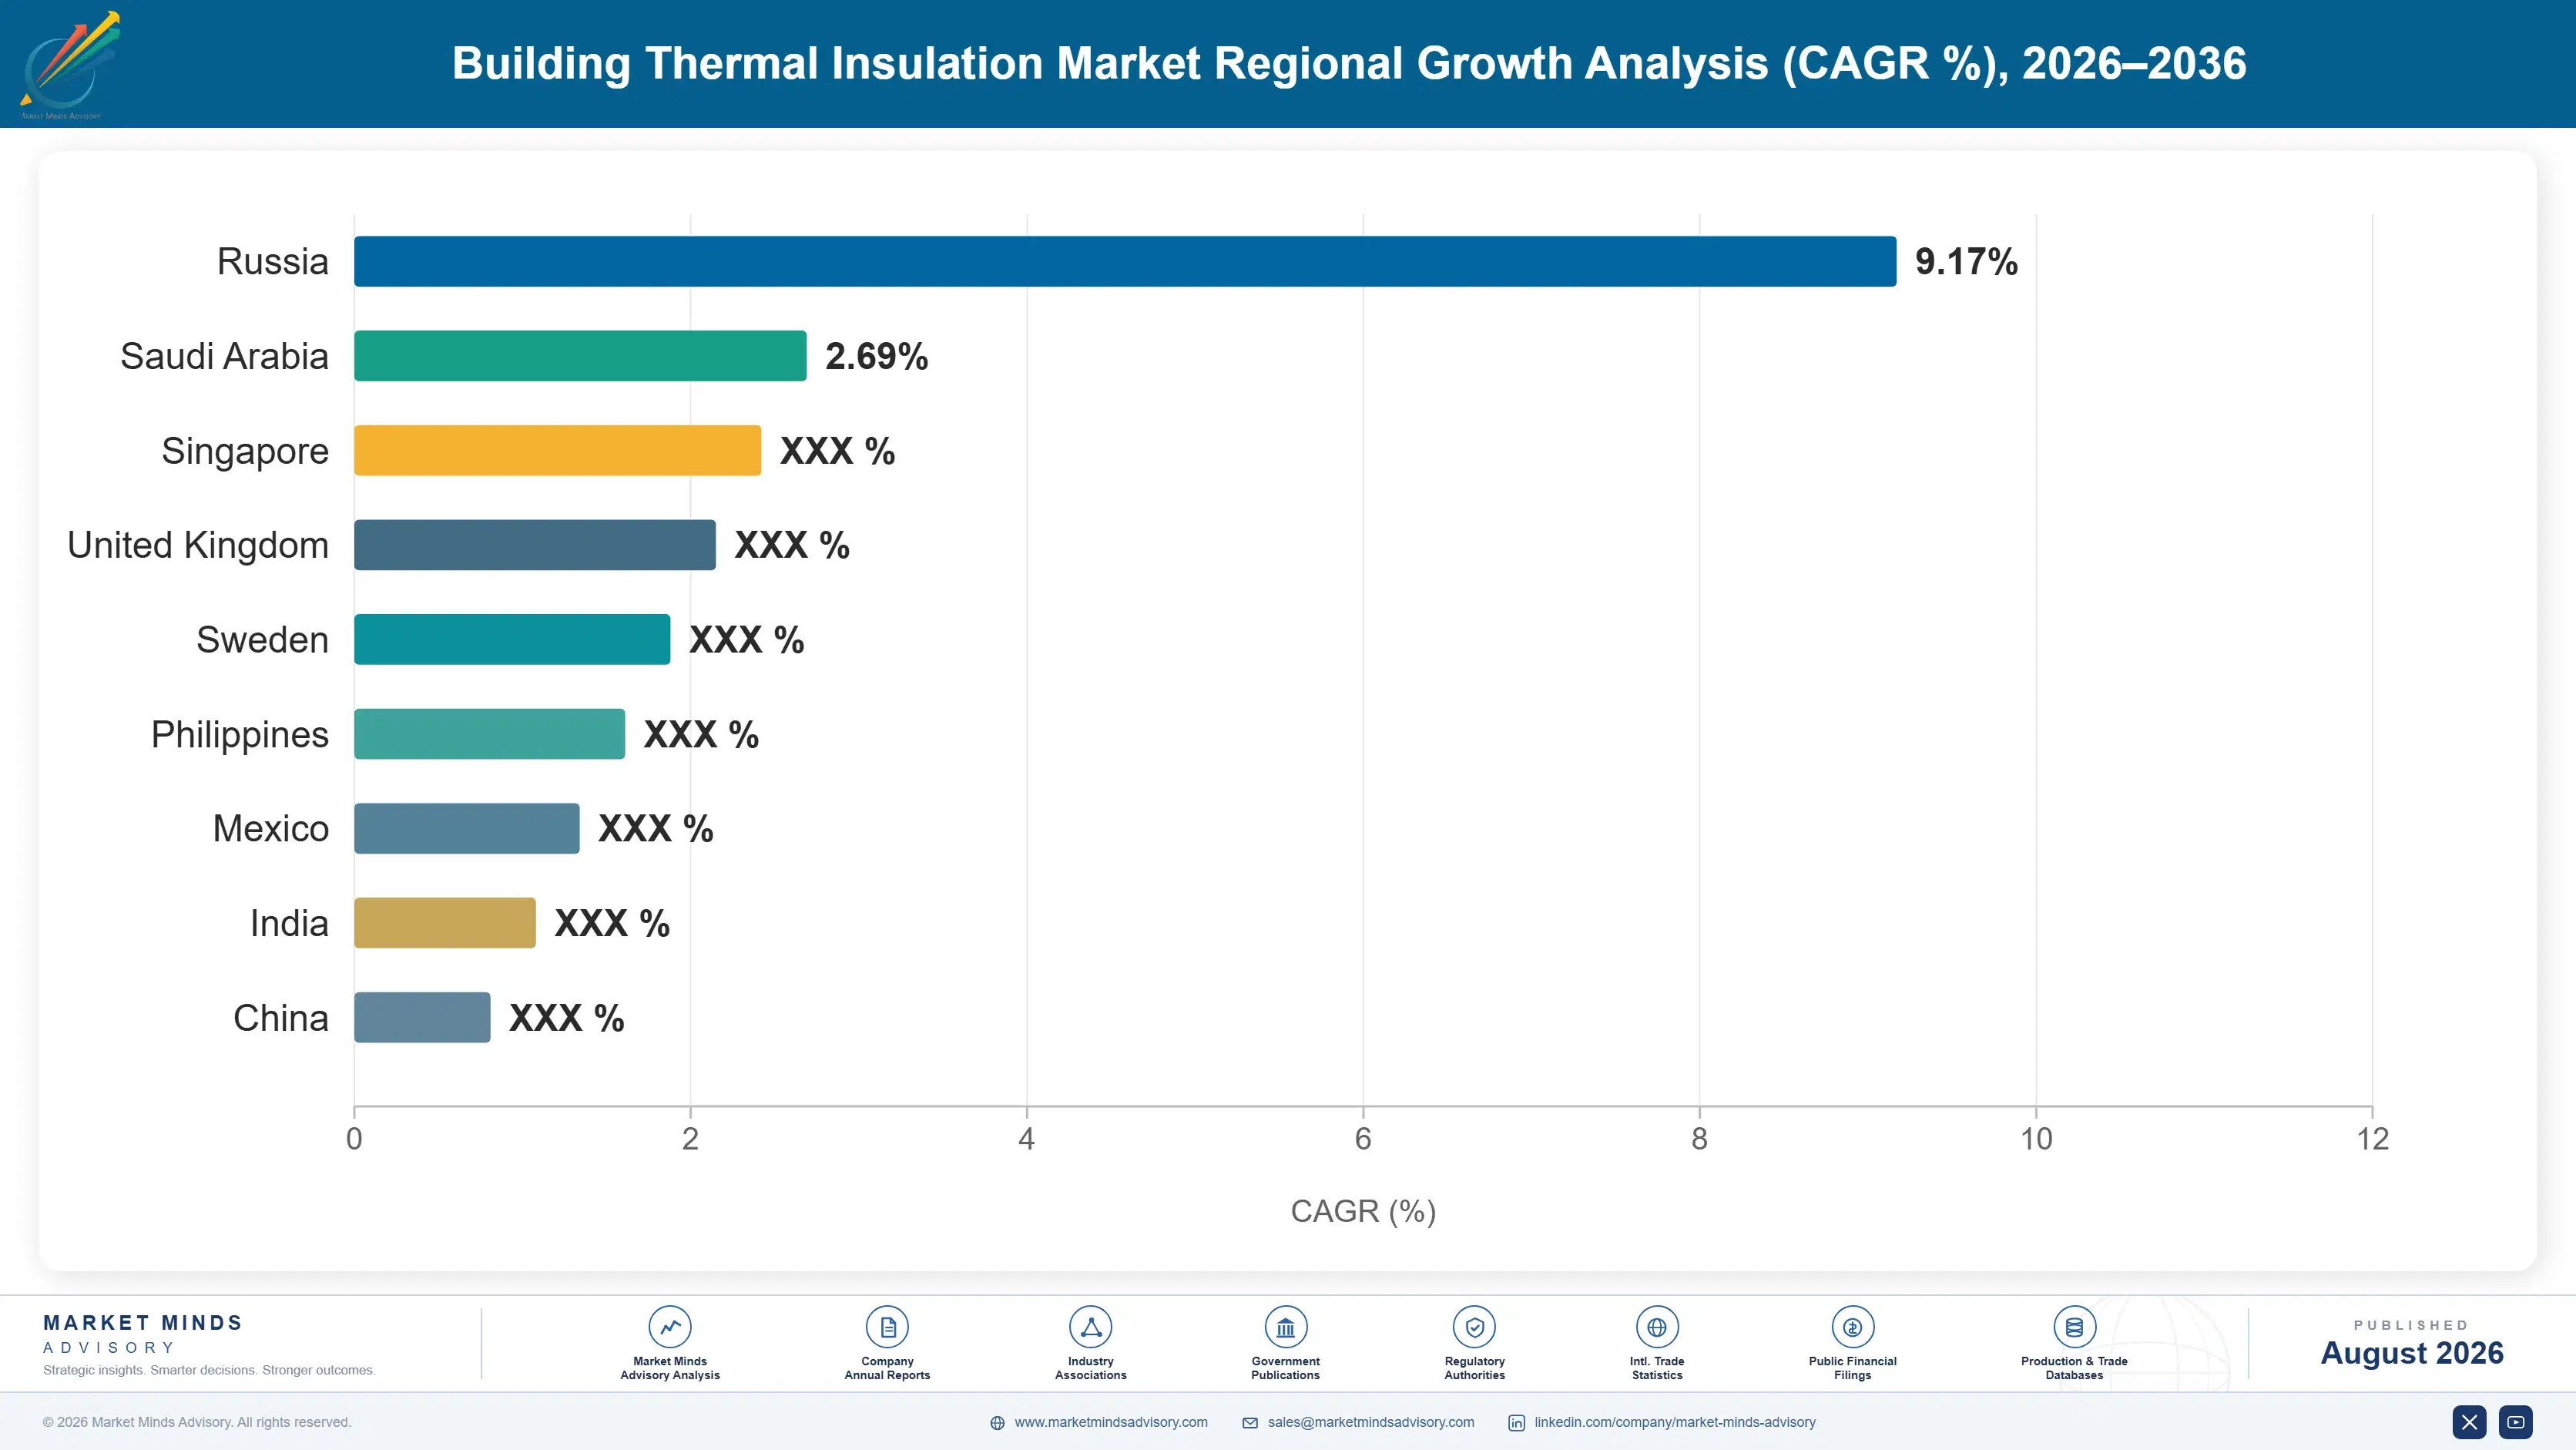
Which country is growing fastest?

India grows fastest at 8.9%, driven by commercial adoption under the Energy Conservation Building Code as cooling loads make uninsulated buildings costly to operate. Residential penetration remains low outside premium developments.

Report Segmentation Architecture

The full report scope spans multiple orthogonal segmentation dimensions, with cross-tabulated demand data provided for each dimension pair. Coverage extends further to regional breakdowns, trend trajectories, and the competitive detail needed to support segment-level decision-making.

By Insulation Material

  • Glass Wool
  • Stone Wool
  • Expanded Polystyrene Board
  • Extruded Polystyrene Board
  • Polyurethane and Polyisocyanurate Boards
  • Aerogel and Vacuum Insulation Panels

By End-Use Industry

  • Residential New Construction
  • Residential Renovation and Retrofit
  • Commercial Offices and Retail
  • Public and Institutional Buildings
  • Industrial and Warehouse Buildings

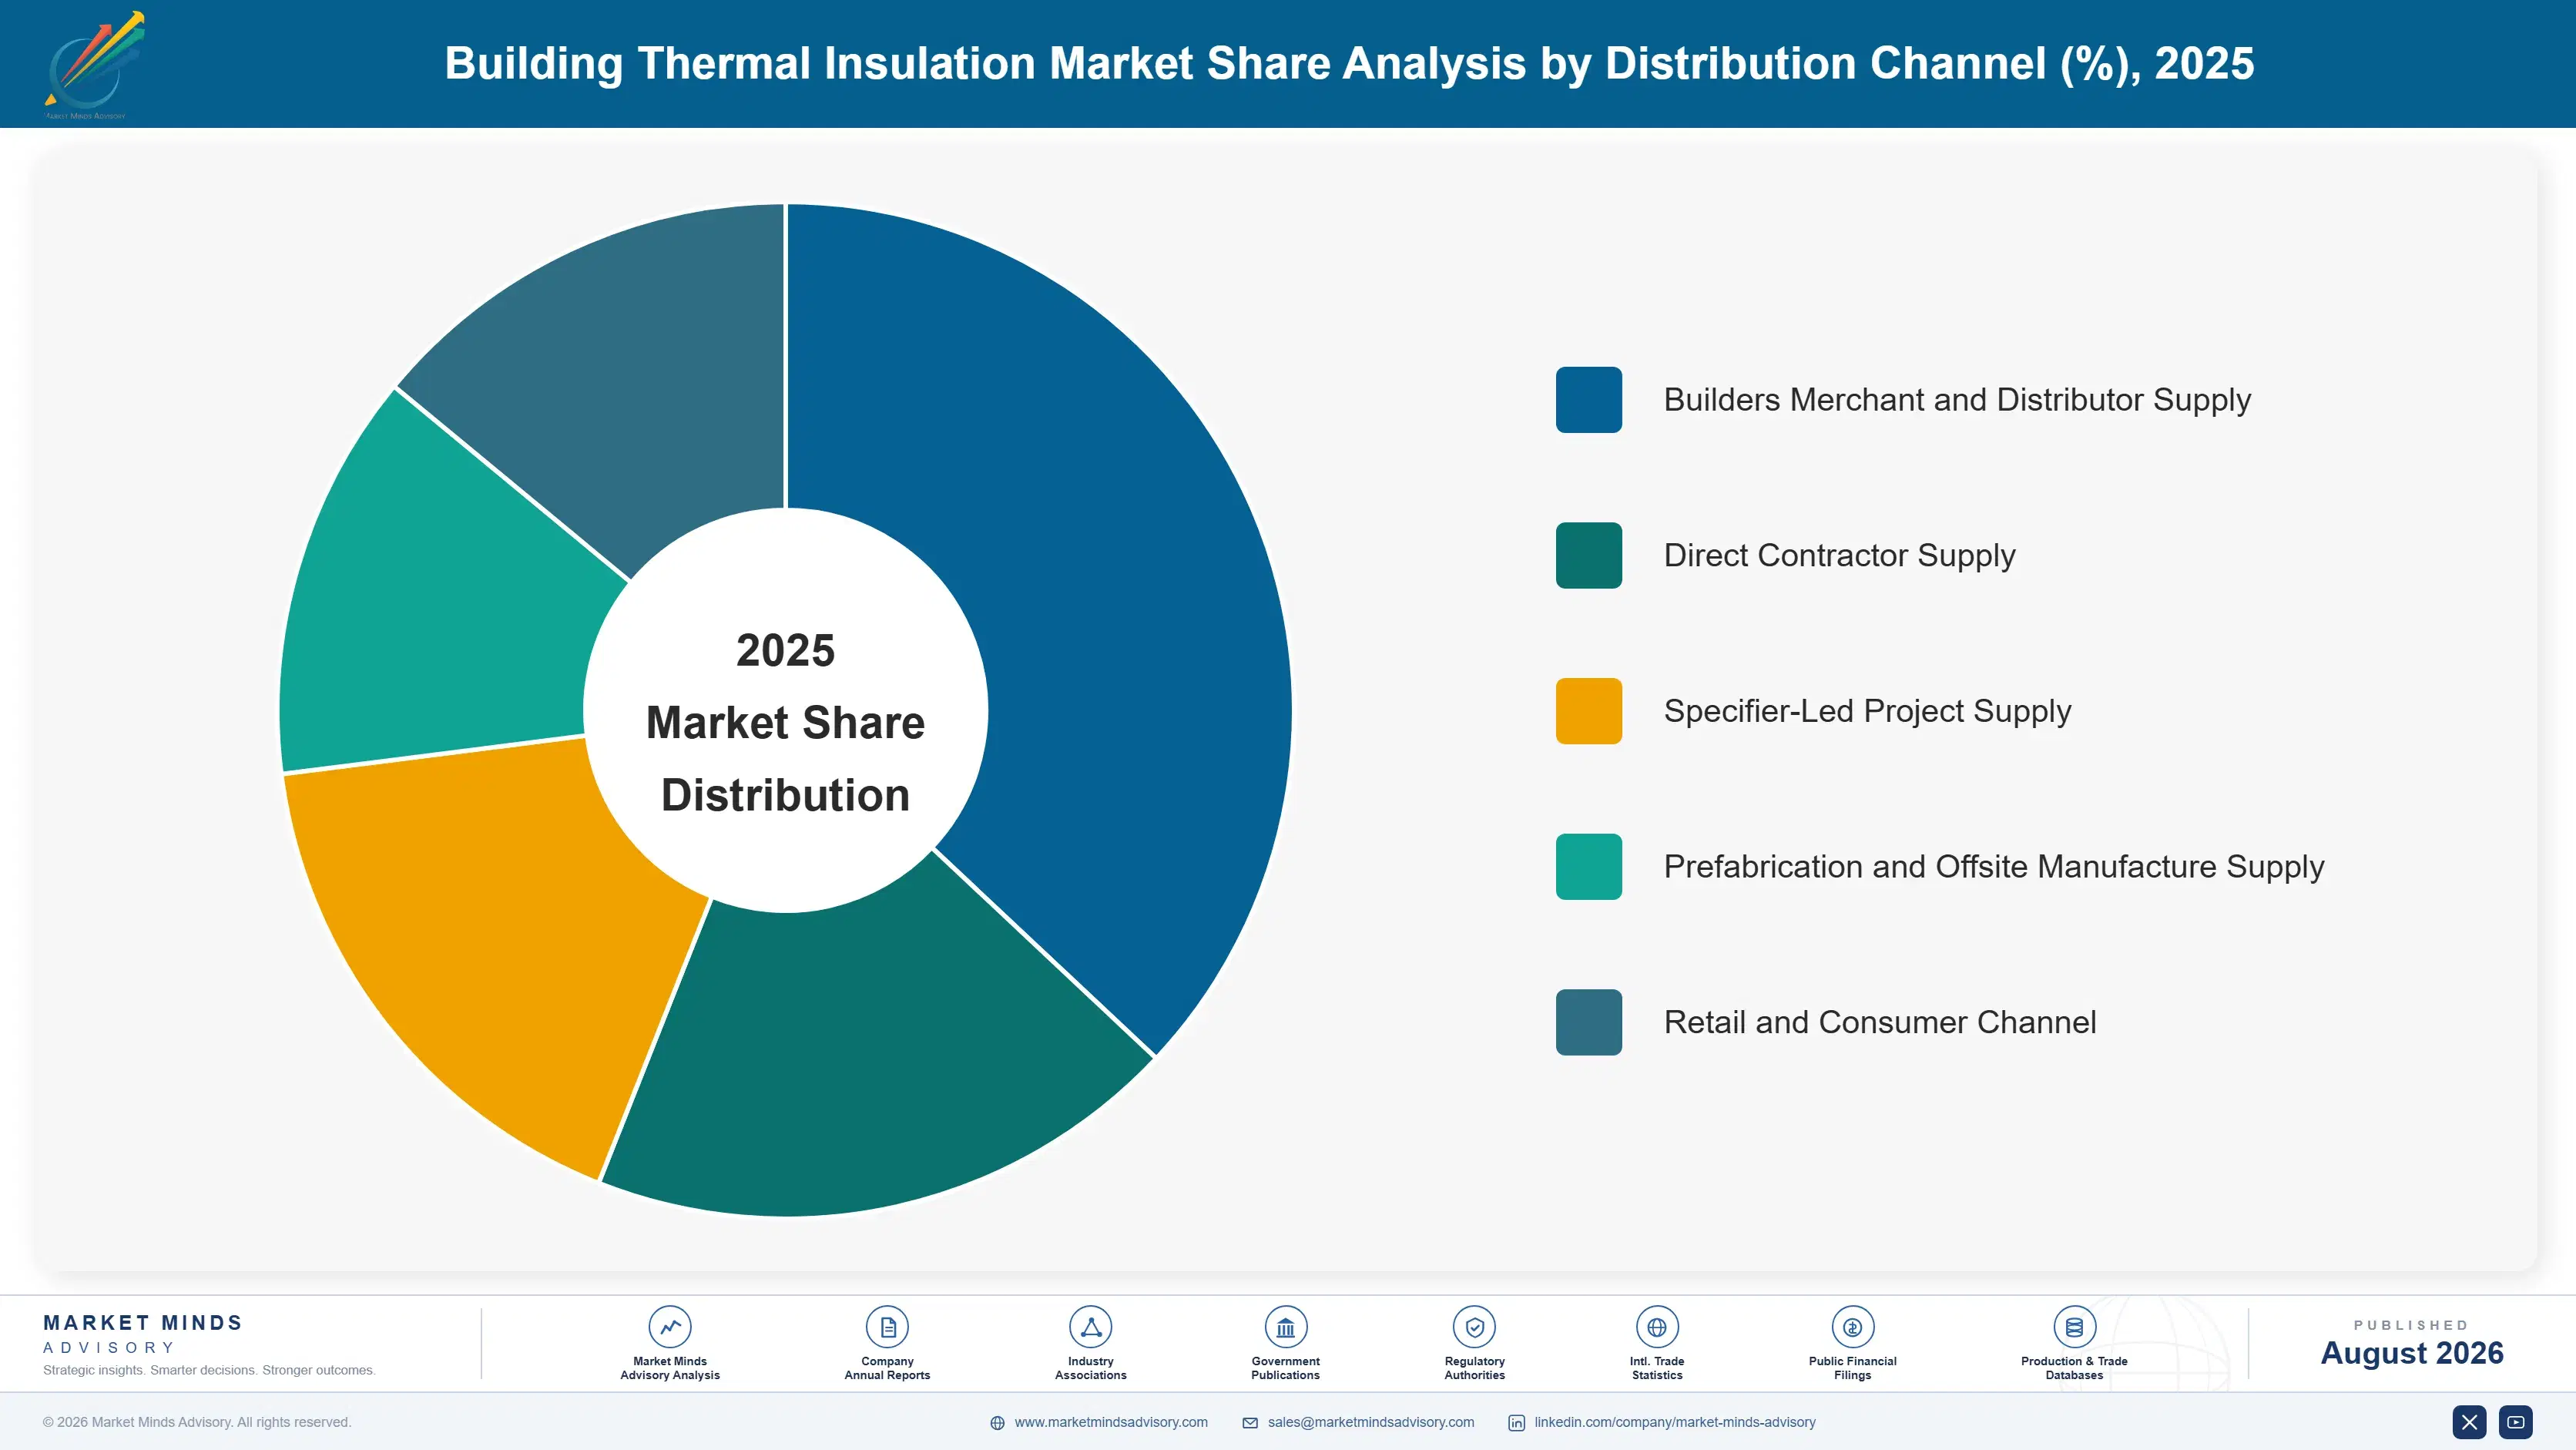
By Distribution Channel

  • Builders Merchant and Distributor Supply
  • Direct Contractor Supply
  • Specifier-Led Project Supply
  • Prefabrication and Offsite Manufacture Supply
  • Retail and Consumer Channel

By Region

  • North America
  • Western Europe
  • East Asia
  • South Asia and Pacific
  • Latin America
  • Middle East and Africa
  • Eastern Europe

Scope, Methodology, and Coverage

Every figure in this report is reproducible from documented input assumptions. The scope below maps the historical period, the forecast horizon, the segmentation dimensions, and the countries covered, alongside the underlying primary and qualitative methodology.
Historical Period
2020 to 2025
Forecast Period
2026 to 2036
Base Year
2025 (USD billions; MMA Primary Research Dataset, August 2026)
Market Definition
The market comprises thermal insulation materials supplied for building envelopes, covering glass wool, stone wool, expanded polystyrene, extruded polystyrene, polyurethane and polyisocyanurate boards, and aerogel and vacuum insulation panels. Value is measured at manufacturer level across new construction and renovation demand in residential, commercial, public, and industrial buildings. Industrial process and pipe insulation, acoustic-only products, HVAC duct insulation, cold-store and refrigeration panels, glazing, and installation labour fall outside scope.
Quantitative Units
USD billions (current prices); million cubic metres of insulation shipped annually; USD per square metre installed at reference thermal performance
Segmentation Dimensions
By Insulation Material; By End-Use Industry; By Distribution Channel; By Region
Regions Covered
North America, Western Europe, East Asia, South Asia and Pacific, Latin America, Middle East and Africa, Eastern Europe
Countries Covered
United States, Canada, Mexico, Germany, France, United Kingdom, Italy, Spain, Netherlands, Nordics, Poland, Czech Republic, China, Japan, South Korea, India, Australia, Southeast Asia, Brazil, Chile, Saudi Arabia, United Arab Emirates, South Africa
Key Companies Profiled
Saint-Gobain, Kingspan Group, Rockwool A/S, Owens Corning, Knauf Insulation, Johns Manville, BASF, Recticel, URSA Insulation, Beijing New Building Materials, Huntsman, Dow, Sika, Soprema, TechnoNICOL, Armacell, Cabot Corporation, Aspen Aerogels, Nichias, Sto SE & Co. KGaA
Quantitative Methodology
Primary survey, n=3,800 respondents, Q4 2025, six countries; demand-side model with trade association cross-validation
Qualitative Methodology
47 expert interviews, Q4 2025; applied to validate demand model assumptions, identify emerging dynamics, and assess competitive positioning
Report Format
PDF and XLSX data workbook (Word format preview document)
Publisher
Market Minds Advisory
Report Code
MMA-2026-CON-127
Published
August 2026
Contact
sales@marketmindsadvisory.com | www.marketmindsadvisory.com

Purchase the full Building Thermal Insulation Market Report (2026 to 2036).

The full report sizes building insulation demand across six material families, five end-use categories, and seven regions with 2026 to 2036 forecasts under base, bull, and bear cases. It models renovation mandates and tightening transmittance limits against construction cycles to separate regulatory volume from cyclical volume. Competitive profiles cover twenty producers assessed consistently on building insulation revenue, plant footprint, and material breadth. Cost analysis traces furnace energy and feedstock exposure by technology and regional power position. Commercial guidance addresses certified system supply, furnace conversion economics, renovation channel building, and thin high-performance positioning.
Six insulation material families sized separately by region
Renovation demand separated from new construction volume
Furnace energy cost modelled by technology and geography
Twenty producers assessed on one consistent revenue basis
Fire regulation impact traced through facade specification
Certified system margin economics quantified against commodity board

Built For The People Who Decide

From boardroom strategy to bench-side execution, this report is read cover-to-cover by leaders shaping the next decade of their industry, turning demand scenarios, market dynamics and valuation benchmarks into decisions.
CXOs/ Presidents/ VPs/ Managers
M&A and Corporate Development
Strategy Teams and R&D Heads
Procurement and Product Directors
Regulatory and Compliance Leaders
Investor Relations and Equity Analysts