Market Minds Advisory
Building Automation System Market

Building Automation System Market: A Fifteen-Year Retrofit Cycle, And The Building Nobody Wants To Touch During Occupancy

A commercial reading of building automation, where the biggest obstacle to a better system is not cost but the disruption of ripping out a working one while tenants are still occupying the building.

Lead Analyst

David Horsley

Published

September 2026

Make Smarter Decisions with Customized Research Insights

Request a free sample report and evaluate market opportunities, growth trends, and competitive dynamics relevant to your business needs.

2025 MARKET VALUE$95.0BMarket Size 2025
2036 FORECAST VALUE$250.1BBase Case , 2026 to 2036
CAGR 2026 TO 20369.2 %Bull 10.4% / Bear 8.0%
INCREMENTAL OPPORTUNITY$146.4BNet 10- year value creation
EXPANSION MULTIPLE2.41x2036 value over 2026 base
Strategic Levers
M&A Pipeline
Regional Outlook
Country Rankings
Competitive Intelligence
Segmental Deep-dive
Call-Us : 91 93563 13602

Executive Snapshot and Market Trajectory

Replacing a building automation system is not primarily a cost decision. It means shutting down heating, cooling, or lighting control in an occupied building for weeks, which is why systems installed fifteen years ago are often still running smoothly today, however dated.
The market stands at USD 95.0 billion in 2025 and reaches USD 250.13 billion by 2036 at a 9.2% CAGR. AI-enabled analytics platforms grow fastest at 14.7%, about 1.60 times the overall rate, as owners seek software finding savings inside systems they already own. North America holds 29% of value on the largest commercial stock needing retrofit, while Saudi Arabia posts the quickest growth at 12.8% on giga-project specification.
Concentration is moderate at roughly 41%, split between building technology conglomerates and specialist controls manufacturers competing across different layers. Two forces now dominate the direction of travel. Cybersecurity requirements are reaching building systems never designed with network security in mind, and analytics software layered on existing hardware is capturing value that used to belong entirely to equipment itself. That shift is reshaping how vendors compete. That widening gap increasingly defines this category's commercial rhythm.
Market Definition
The building automation system market covers integrated control systems that monitor and manage heating, ventilation and air conditioning, lighting, access control, fire and life safety, and energy management within commercial and institutional buildings, spanning building management system platforms, HVAC controls, lighting controls, access control and security integration, and analytics and fault detection software, valued at manufacturer and integrator selling prices. Standalone consumer smart home devices, industrial process control systems, elevator and escalator control, and building construction and installation labour sold separately are excluded.
Base Year Value
$95.0B in 2025 (MMA Primary Research Dataset, August 2026)
Forecast Period
2026 to 2036, eleven discrete annual values
CAGR
9.2% base case. Bull 10.4%. Bear 8.0%.
Fastest Growth Segment
AI-Enabled Analytics and Fault Detection Platforms: 14.7% CAGR
Fastest Growth Country
Saudi Arabia: 12.8% CAGR
Fastest Growth Region
South Asia and Pacific: 11.2% CAGR
Largest Region
North America: 29% of 2025 global value
Market Leaders
Johnson Controls, Honeywell, Siemens, Schneider Electric, ABB. Source: MMA Analysis based on company annual reports.
Primary Survey
n=3,800 procurement and R&D decision-makers, Q4 2025, six countries
Methodology
Demand-side build-up, cross-validated against public data, 47 expert interviews

Building Automation System Market Forecast Scenarios

building-automation-system-market-size-forecast-scenario-1787324907213
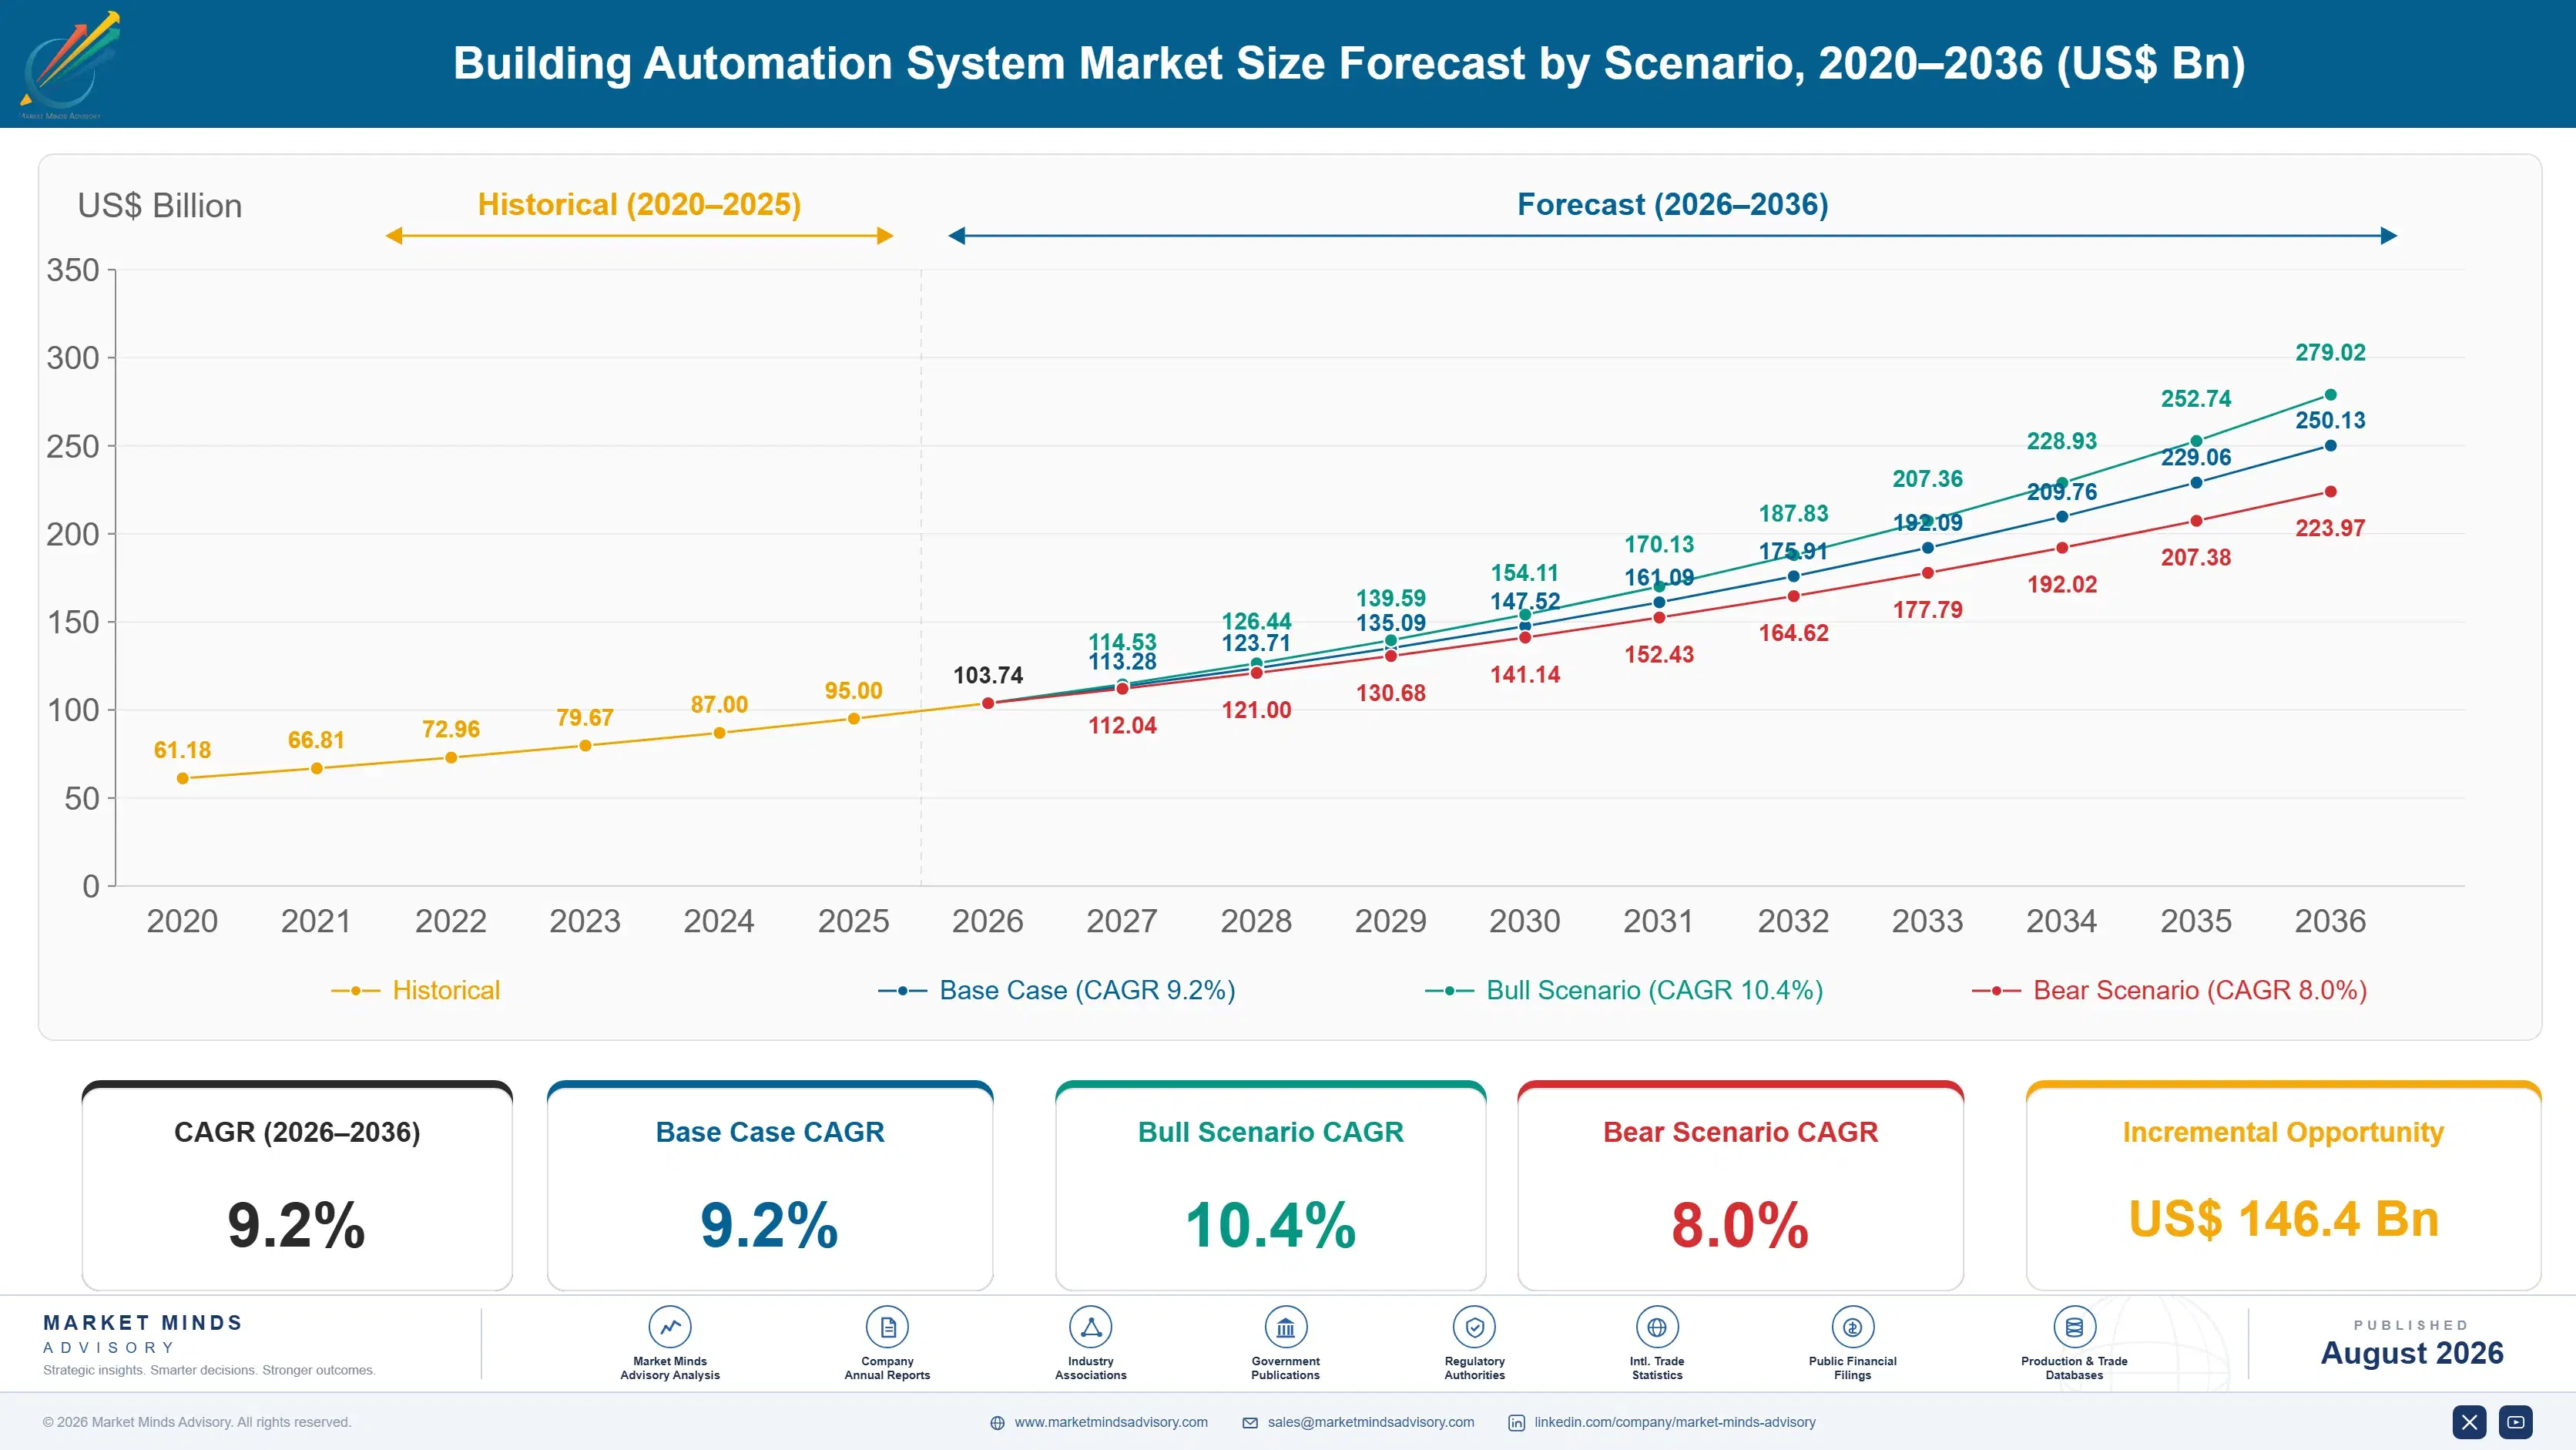
Growth from 2020 to 2025 compounded near 8.0%, and the period was shaped by two forces working in the same direction. Building owners facing lower occupancy invested in air quality and energy management systems to attract tenants back, while rising energy prices across most major markets made the payback case for control upgrades considerably easier to justify to finance committees than it had been previously.
Three mechanisms carry the base case to 9.2%. First, energy performance mandates spreading across major cities, which require existing buildings to cut consumption on fixed timelines regardless of ownership preference. Second, analytics software adoption on already-installed hardware, capturing savings that older systems left entirely undiscovered for years. Third, new construction in fast-growing markets specifying integrated automation from the outset rather than retrofitting it in considerably later, once the building is already occupied.
The bull case at 10.4% assumes energy mandates tighten faster and analytics adoption accelerates across the existing installed base considerably. The bear case at 8.0% assumes commercial construction slows under higher financing costs, building owners defer retrofit spending during economic uncertainty, and mandate enforcement proves weaker in practice than the underlying legislation originally promised policymakers everywhere.

Why Nobody Wants To Touch A System That Still Works

Three forces set demand. Regulatory mandate drives the most durable volume, as cities from New York to London require existing commercial buildings to cut energy consumption within fixed timelines that owners cannot simply ignore. Tenant expectation drives a second stream, since air quality and lighting now influence leasing decisions directly, unlike a decade ago. New construction drives a third stream, specifying automation from the design stage rather than adding it later.
MARKET CONCENTRATIONCR5: 41%Moderately concentrated among the major building technology firms
SYSTEM REPLACEMENT CYCLE12 to 18 yearsTypical operating life before a full system replacement decision
ENERGY COST REDUCTION10 to 25%Typical building energy savings achieved after a control upgrade
RETROFIT SHAREAbout 65%Retrofit share of total building automation system revenue
INTEGRATION COST SHARE30 to 45%Engineering and integration as a portion of total project cost
PAYBACK PERIOD RANGE2 to 5 yearsTypical payback period for an energy-focused controls upgrade
The commercial character is defined by occupied-building risk rather than by technology performance alone. Replacing a control system in a functioning office tower or hospital means disrupting heating, cooling, or security for weeks, and that cost routinely outweighs the gap between an old system and a better one. Owners therefore replace reactively, when a system fails outright or a major renovation creates a natural window, rather than proactively on any fixed technology cycle.
The decade turns on two forces converging at once. Cybersecurity requirements are reaching networks designed decades ago with no expectation of facing intrusion, forcing retrofit spending unrelated to comfort or energy. And analytics software increasingly holds the value, since a platform finding hidden savings inside existing hardware can outperform full replacement.
"Facility managers do not lie awake worrying about their control system's processor speed. They worry about the three-week shutdown a replacement would cause, which is why buildings run technology a decade behind what vendors are actually selling."
Director, Building Technology and Smart Infrastructure Practice · MMA Technology

Market Trends

Cybersecurity Requirements Are Reaching Decades-Old Building Networks

Building automation networks were designed for decades assuming physical isolation, with no expectation anyone would ever attempt a remote network intrusion, and that assumption has aged badly as buildings connected these systems to the internet for remote monitoring access. Regulators and insurers are now imposing cybersecurity requirements on building networks previously exempt from meaningful scrutiny, forcing owners to segment, patch, and monitor infrastructure many facility teams do not fully understand technically. The commercial consequence is retrofit spending justified by risk rather than comfort or energy savings, a category that barely existed as a budget line a decade ago.
Market Impact: Deadlines now affect 20,000 buildin
Analytics Software Captures Value That Used To Sit In Hardware

A building management platform layering fault detection and energy analytics on top of existing controls can identify savings the underlying hardware never surfaced on its own, often paying for itself within a single budget cycle without touching any mechanical equipment. That shift moves commercial value away from control hardware itself and toward the software interpreting the data it produces, which is precisely why hardware manufacturers are racing to build or acquire analytics capability rather than ceding that margin to independent software vendors. Owners increasingly evaluate vendors on software roadmap as much as hardware reliability.
Market Impact: Cuts vacancy time by 15%

Market Opportunities and Growth Drivers

Building Performance Mandates Force Retrofit On Fixed Timelines

Major cities including New York, London, and increasingly several others have enacted building performance standards requiring existing commercial buildings to cut energy consumption or carbon emissions within fixed compliance timelines, with genuine financial penalties attached for buildings missing the deadline entirely. That regulatory structure converts automation upgrades from a discretionary capital decision into a compliance obligation an owner cannot simply defer, which is a fundamentally different sales conversation for vendors than the payback pitch that dominated the category previously. Owners facing near-term deadlines are moving decisively. Compliance is now the primary driver behind the majority of large-scale retrofit projects underway.
Market Impact: Downtime spans 2 to 4 weeks

Tenant Air Quality Expectations Now Influence Leasing Decisions

Commercial tenants increasingly evaluate indoor air quality and lighting control directly as part of leasing decisions, a shift accelerated considerably by pandemic-era health awareness that has only partially receded across most major office markets since. Building owners competing for tenants in a market with persistently elevated vacancy rates treat automation upgrades as a genuine leasing differentiator rather than as pure operating cost reduction, which changes both the budget owner and the urgency behind the purchasing decision. Landlords who upgrade air quality monitoring and control report measurably faster leasing velocity on renovated floors compared with untouched space in the same building.
Market Impact: Costs 30 to 45% of budget

Market Restraints and Challenges

Occupied Buildings Nearly Always Block Fast Replacement

Replacing a control system in a functioning building means disrupting heating, cooling, security, or lighting for an extended period, and that operational disruption routinely costs more in tenant complaints and lost productivity than the performance gap between an ageing system and a better one ever justifies. The root cause is that automation systems are deeply embedded in daily operations, making downtime tolerance essentially zero for most tenants. The commercial impact is that owners replace reactively, waiting for outright failure. Mitigation runs through phased replacement and off-hours scheduling. That reluctance persists even when a newer system would outperform the current one.
Market Impact: Breaches rose over 30% recently

Legacy Protocol Fragmentation Raises Integration Cost Everywhere

Buildings accumulate control systems from different eras and vendors, often running incompatible communication protocols never designed to interoperate with equipment installed decades apart, and integrating them requires considerable custom engineering on nearly every project. The root cause is that the industry never standardised communication protocols the way other technology categories eventually did, leaving BACnet, Modbus, and proprietary protocols coexisting uneasily within the same buildings. The commercial impact is that integration represents 30% to 45% of total cost. Mitigation runs through open protocol gateways and phased standardisation. Vendor-neutral integration platforms are increasingly designed specifically to bridge this persistent fragmentation.
Market Impact: Analytics finds 10 to 20% savings
3 additional market trends, 4 additional growth drivers, and 2 additional restraints and challenges are covered in the full report. Contact sales@marketmindsadvisory.com to access the complete intelligence.

Segment CAGR and Growth Architecture

Segmentation follows control function, a single system logic describing what building process each layer manages directly and continuously across the facility. Each function carries its own hardware base, integration complexity, replacement cycle, and buyer relationship, so commercial position tracks the function rather than the building type ultimately using it, in every case observed. broadly.
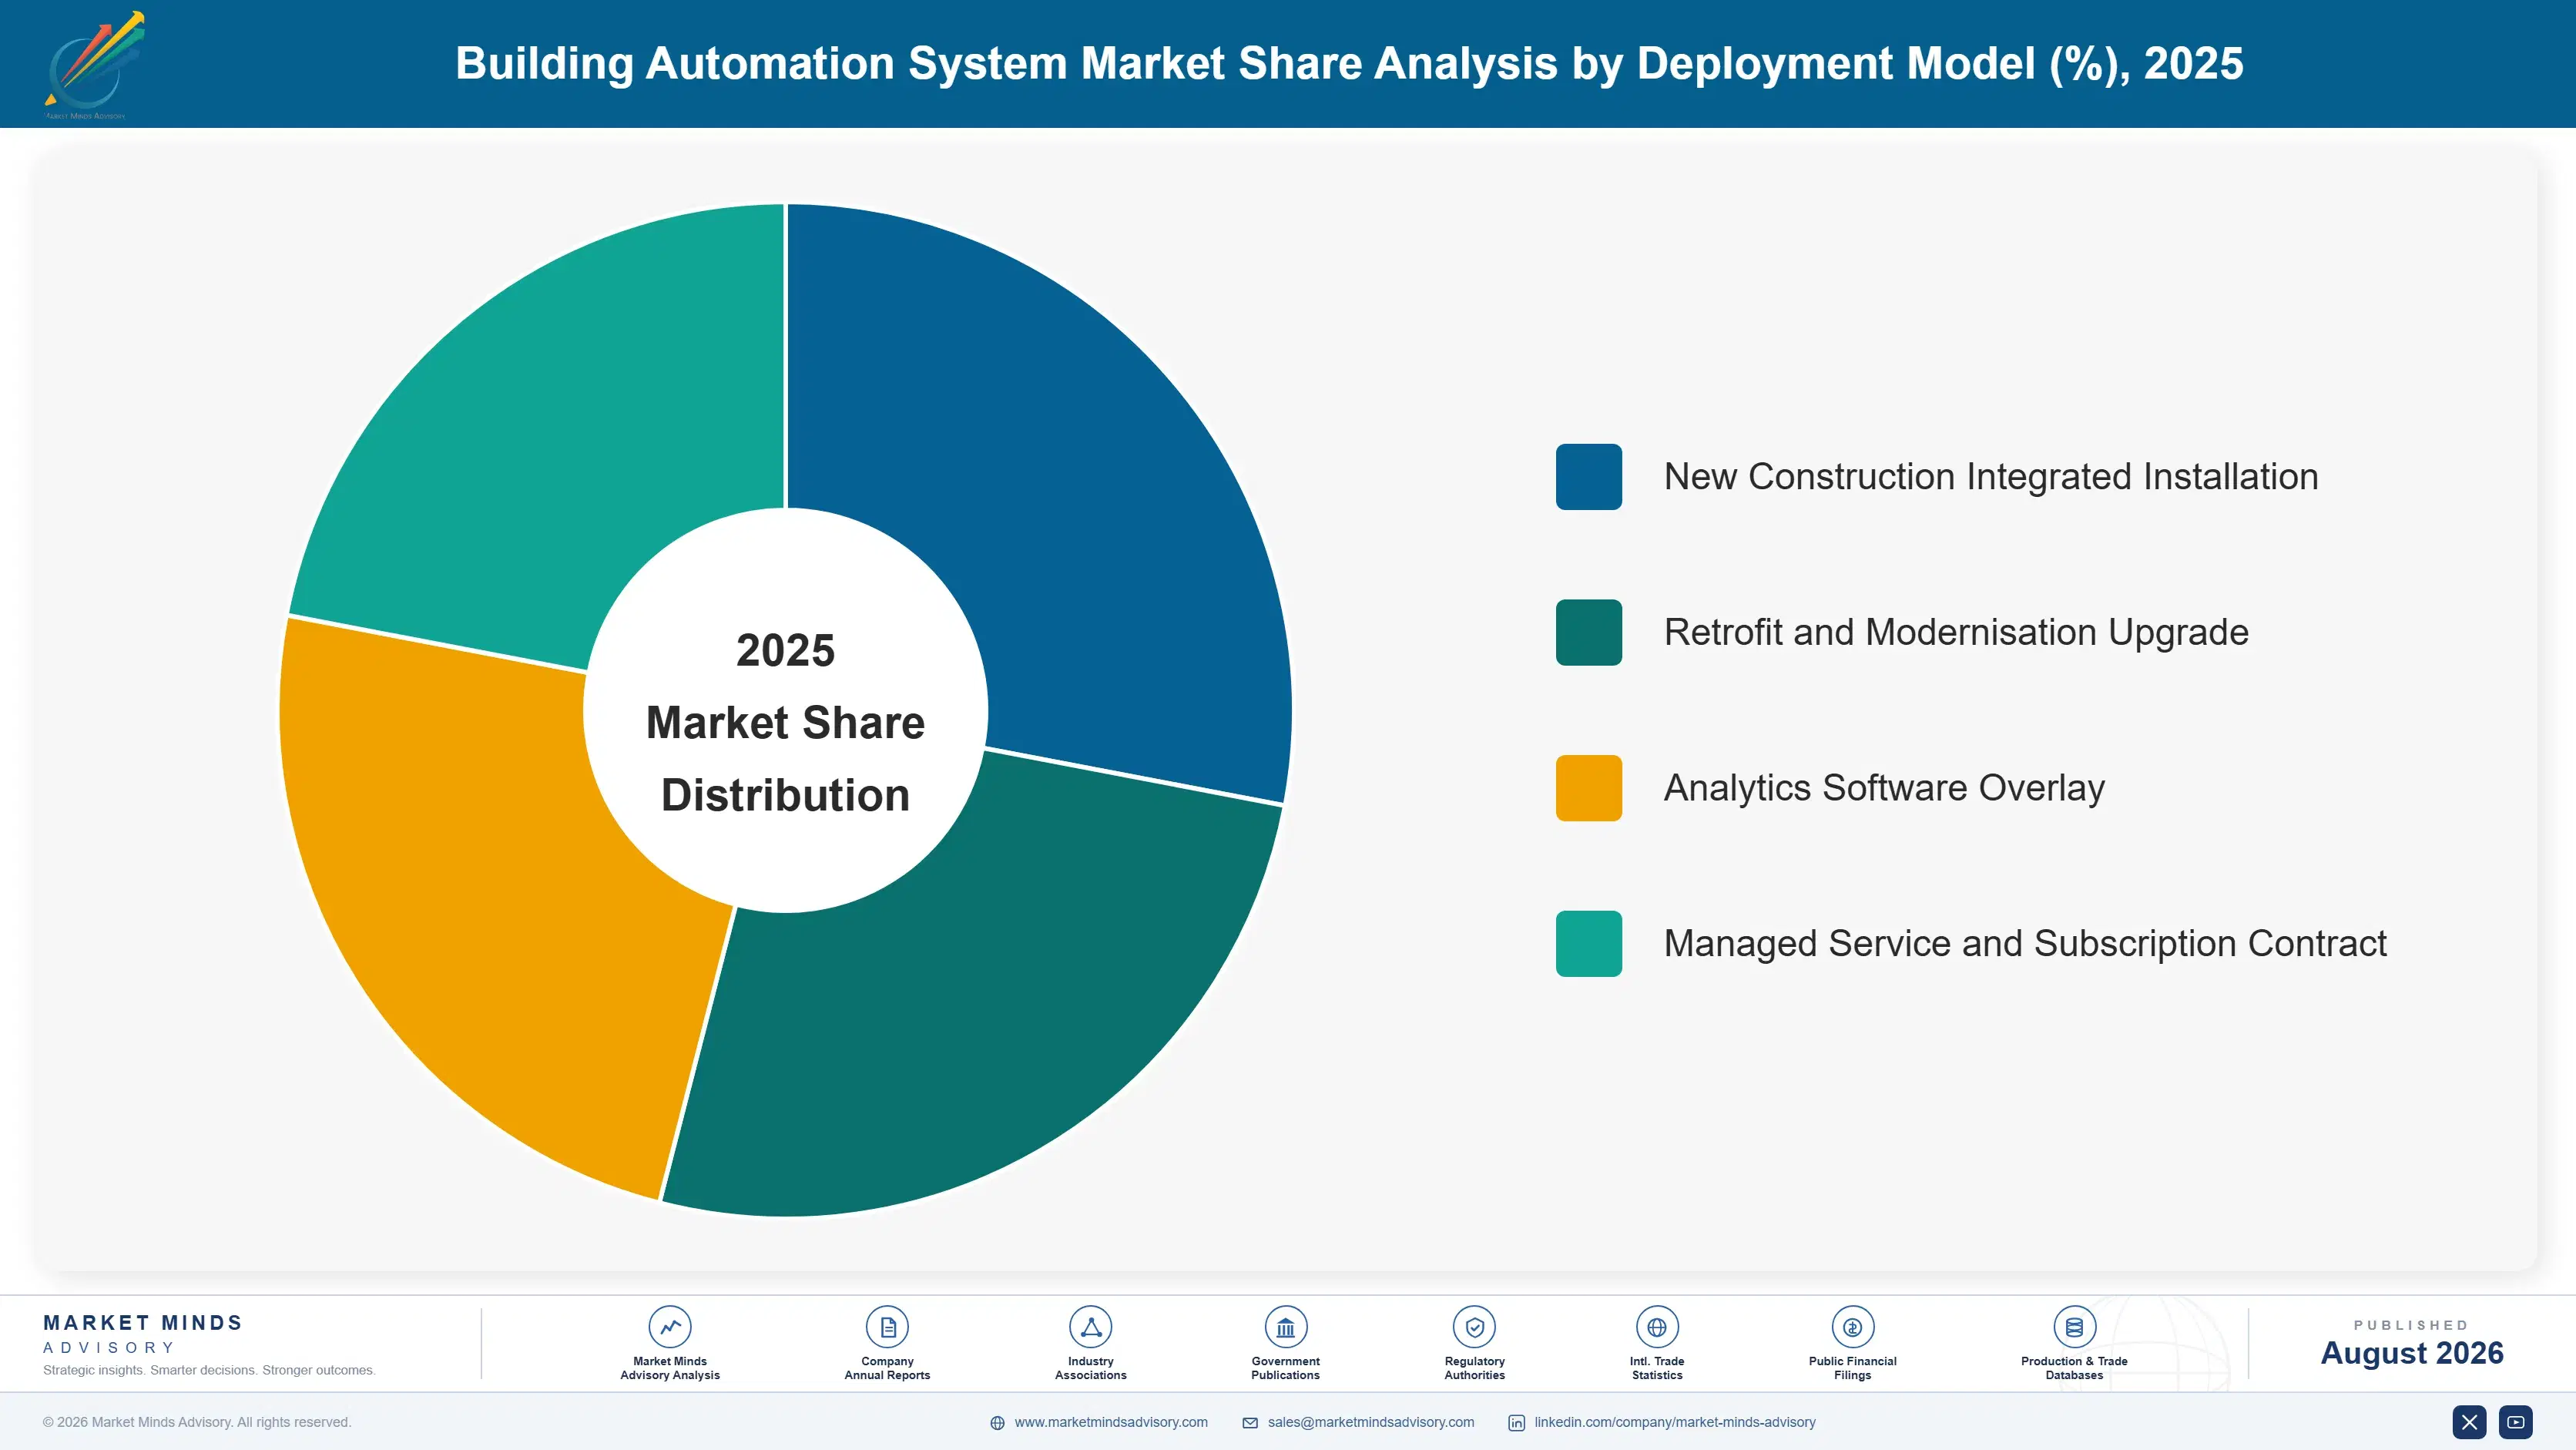
building-automation-system-market-market-share-analysis-1787324907749

AI-Enabled Analytics and Fault Detection Platforms

AI-enabled analytics and fault detection platforms grow fastest at 14.7%, about 1.60 times the overall 9.2% rate, layering machine learning and pattern recognition on top of existing building hardware to identify energy waste and equipment faults that traditional systems never surfaced on their own. Growth is driven by the fact that this software can be deployed without the occupied-building disruption a hardware replacement requires, making it the rare upgrade path facility managers can approve quickly and confidently. Honeywell Forge, Siemens Building X, and several independent software vendors compete for this layer specifically. The category increasingly determines vendor selection even where the underlying hardware itself remains largely unchanged from a prior generation.
CAGR 14.7%

HVAC Controls

HVAC controls grow at 9.8%, covering the sensors, actuators, and control logic that manage heating, ventilation, and air conditioning across commercial buildings, which together represent the largest single energy consumption category in most facilities by a considerable margin. Growth tracks both energy mandate compliance and the broader post-pandemic emphasis on air quality and ventilation rates that building codes increasingly specify as a baseline requirement rather than an optional feature. Johnson Controls, Honeywell, and Siemens hold the strongest positions here, built on decades of installed base and integrator relationships. Growth is steady rather than explosive, reflecting a mature technology category where the innovation increasingly sits in software layered above it. Growth also depends on rising air quality standards across major codes.
CAGR 9.8%
Full segment breakdown across 5 segments available in the complete report.

Regional Architecture and Country Demand Map

Existing building stock and mandate intensity rather than new construction volume set this distribution across the seven regions. North America leads on the largest retrofit-eligible commercial building base, East Asia follows on new construction volume, and Saudi Arabia grows fastest on giga-project specification. collectively today

North America

The largest retrofit-eligible commercial building stock anywhere gives North America 29% of value at 9.6% growth. Building performance standards enacted across New York, Washington, and several other major cities require existing buildings to cut energy consumption on fixed timelines, converting automation upgrades from discretionary spending into a genuine compliance obligation owners cannot indefinitely defer. Johnson Controls and Honeywell hold deep domestic positions built on decades of installed base and integrator relationships across the commercial real estate sector. Cybersecurity requirements are also more advanced here than in most other regions, adding a further retrofit driver layered on top of energy compliance. Canadian demand follows broadly similar patterns at smaller overall scale.
Share: 29% | CAGR: 9.6% (2026 to 2036)

Western Europe

Western Europe holds 22% of value at the slowest growth of the seven regions at 7.6%, reflecting a mature building stock and energy standards that were already tightened considerably during an earlier regulatory cycle than North America's. The European Union's energy performance of buildings directive sets renovation targets that member states are implementing at varying speeds, creating a genuinely uneven regional demand pattern across countries. Siemens and Schneider Electric hold strong positions built on deep integrator networks and decades of engineering relationships across the region. German and French demand leads regionally, while southern European markets lag behind on both building stock age and enforcement intensity considerably. Growth reflects incremental retrofit rather than any broad construction surge.
Share: 22% | CAGR: 7.6% (2026 to 2036)
Regional intelligence for 5 additional markets available in the complete report: East Asia, South Asia and Pacific, Latin America, Middle East and Africa, Eastern Europe. Contact sales@marketmindsadvisory.com.
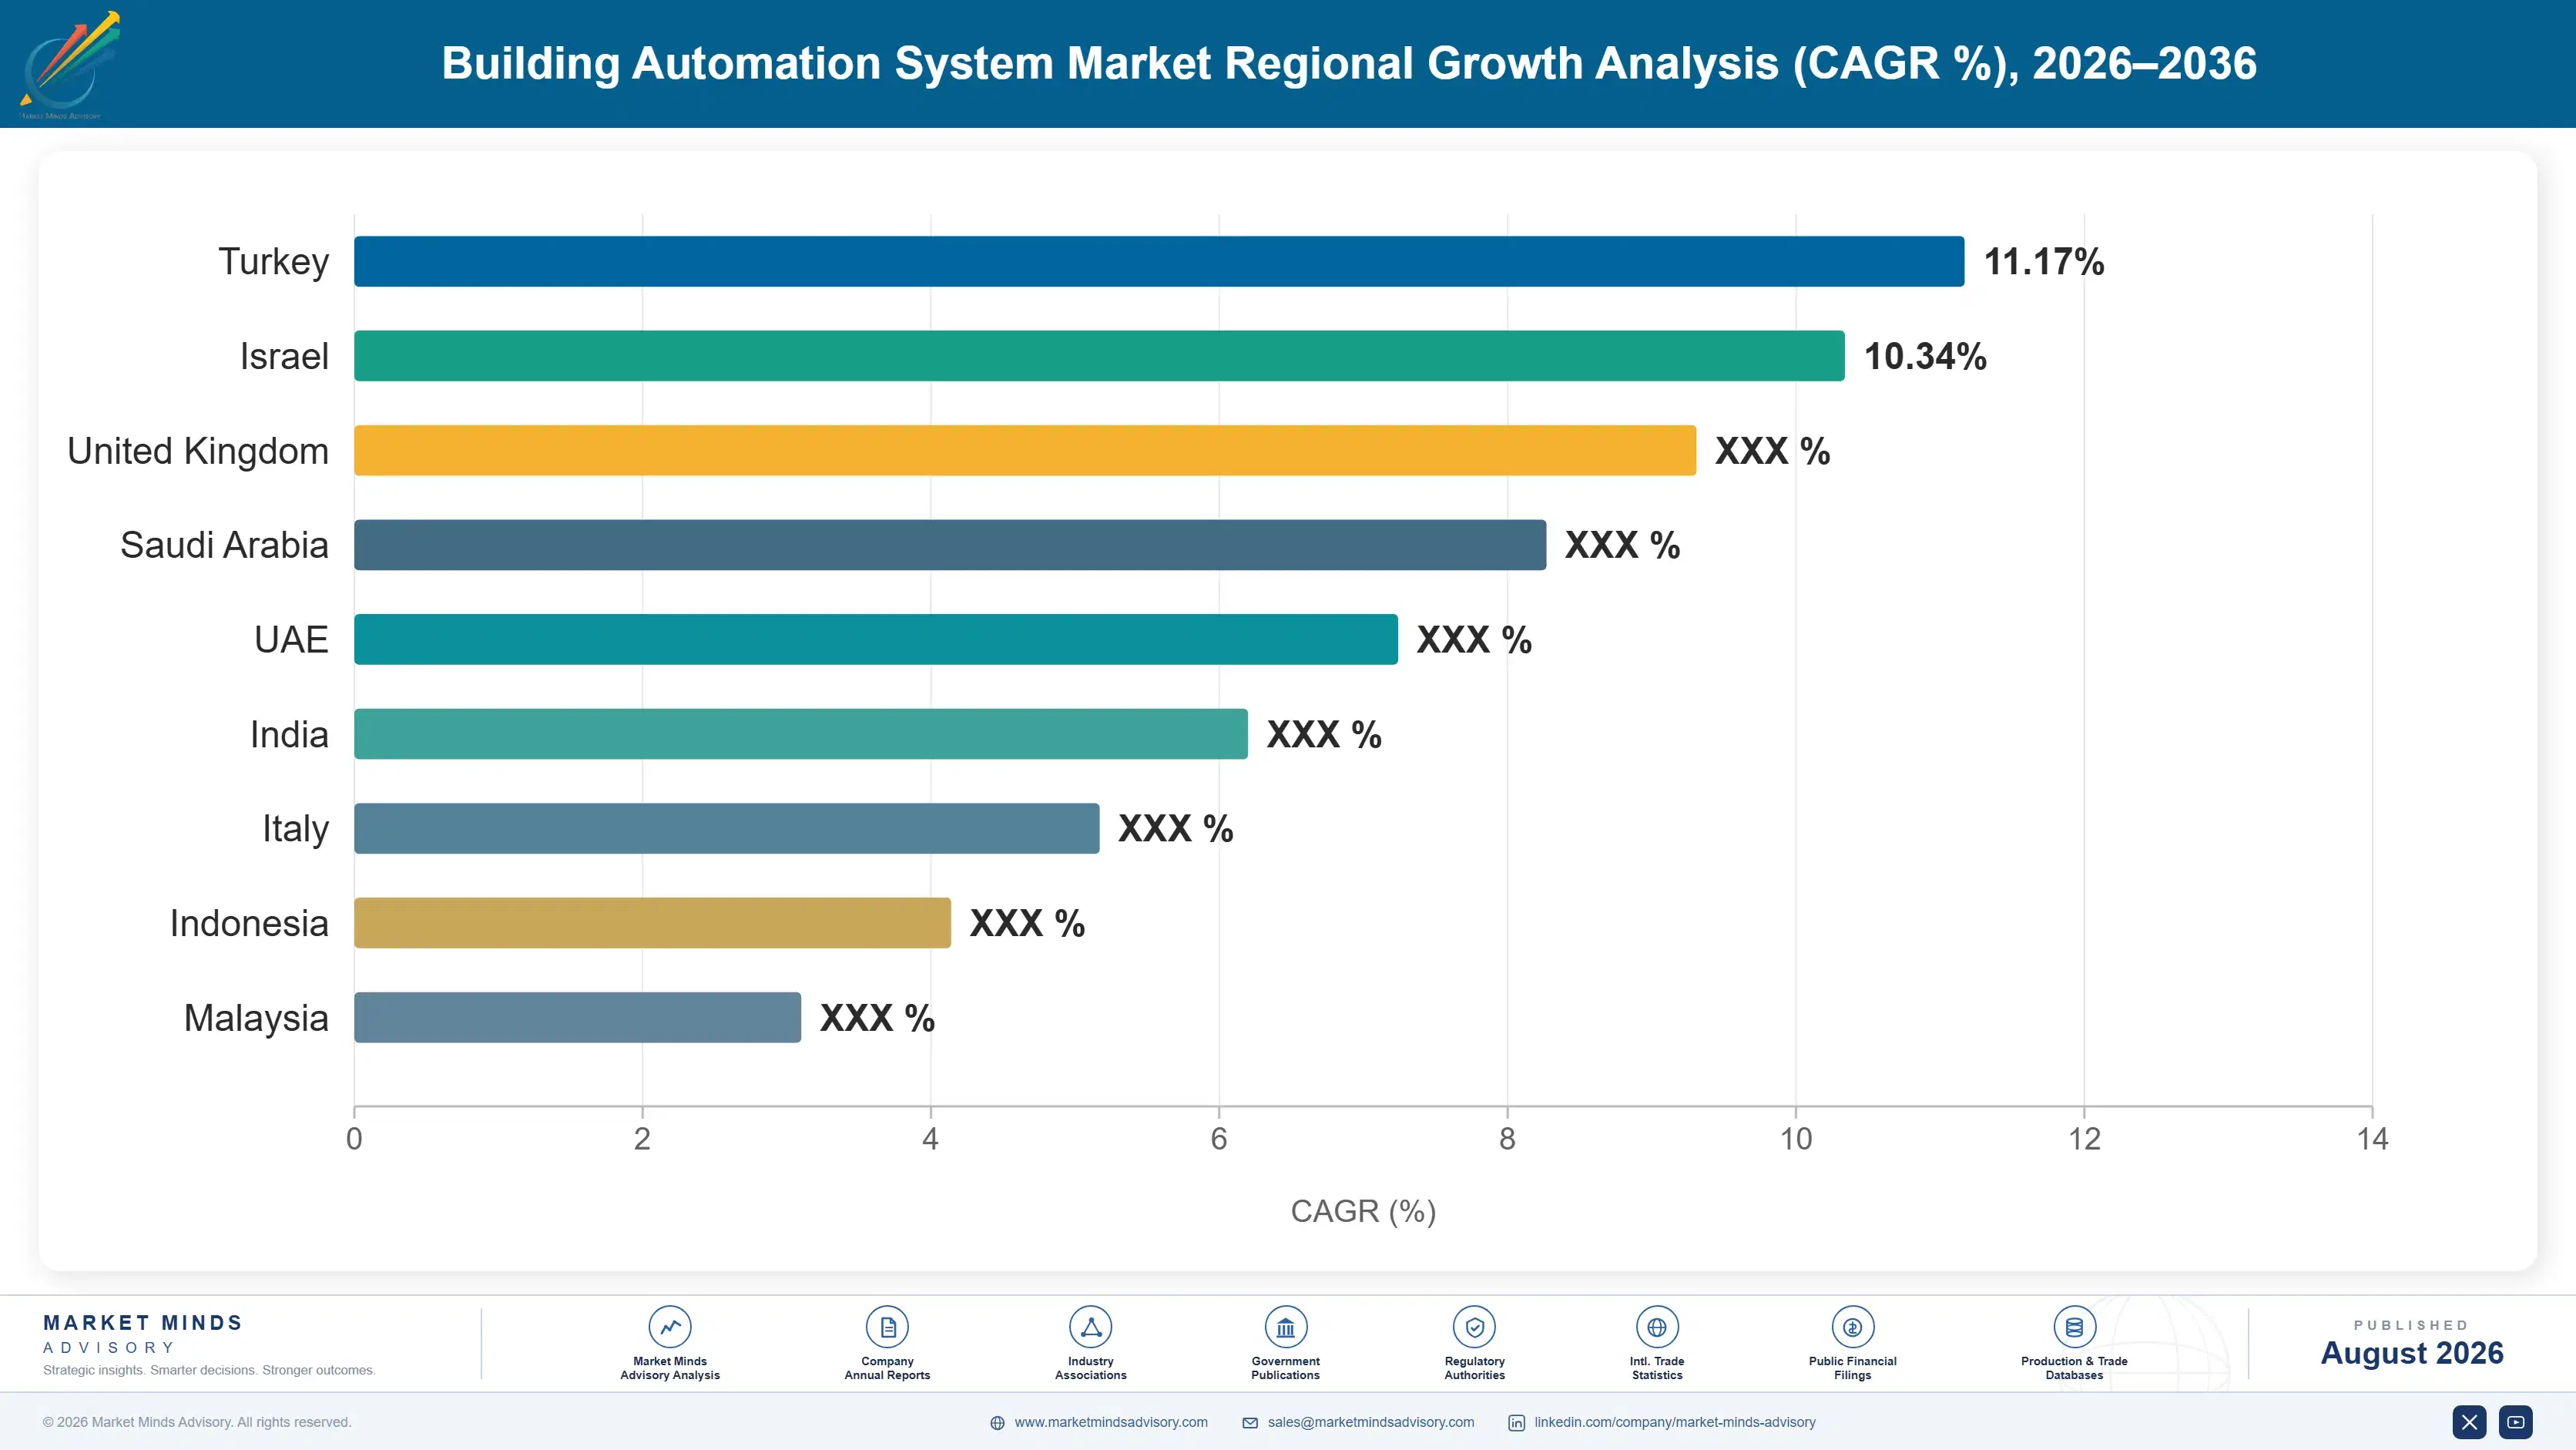
building-automation-system-market-country-cagr-analysis-1787324908252

Where Building Technology Suppliers Defend Margin

Selling control hardware into a market where replacement happens once every fifteen years is a business built on scarce transactions. The four moves below shift earnings toward what recurring revenue can reach: analytics software layered on installed base, mandate compliance positioning, cybersecurity retrofit, and integrator relationships built over time. Formulation alone rarely wins accounts anywhere.

Layer Analytics Software On Top Of Installed Hardware

A building automation platform generates continuous operating data that most owners never fully exploit, and software that surfaces fault detection and energy savings from that existing data monetises an asset the owner already paid for without requiring any disruptive hardware replacement at all. Vendors who build or acquire genuine analytics capability convert a one-time hardware sale into a recurring software subscription relationship that persists for the full life of the underlying system. Analytics platforms typically identify 10% to 20% of additional energy savings on systems owners believed were already fully optimised.
Market Impact: Analytics platforms find 10 to 20%

Position Directly Against Mandate Compliance Deadlines

Building performance standards convert automation upgrades from discretionary spending into a genuine compliance obligation with real financial penalties attached for buildings that miss their fixed deadline entirely. Vendors who position offerings explicitly against specific mandate timelines, rather than around generic energy savings claims, address a board-level obligation rather than an optional facilities upgrade that competes for capital against many other priorities. Compliance-driven projects now affecting over 20,000 buildings across major mandate cities move through procurement considerably faster than payback-justified upgrades ever did previously. Compliance-driven projects now move through procurement considerably faster than payback-justified upgrades ever did before.
Market Impact: Compliance mandates now affect over

Build Cybersecurity Retrofit Into The Core Product Line

Building networks designed decades ago with no expectation of network intrusion are now facing genuine cybersecurity requirements from regulators and insurers who previously exempted this equipment from meaningful scrutiny. Vendors who build segmentation, monitoring, and patching capability directly into their core product line, rather than treating security as a bolt-on afterthought, address a budget line that barely existed a decade ago and now competes for the same limited capital pool. Security-related incidents affecting building systems have risen sharply, and insurers increasingly require documented remediation before renewing coverage, with remediation costs often exceeding 15% of the original hardware budget.
Market Impact: Security incidents have risen more

Deepen Integrator Relationships Across Multi-Building Portfolios

Large commercial real estate owners managing dozens of buildings value integrators who understand their full portfolio rather than treating each building as an isolated project requiring fresh engineering from scratch every single time. Vendors and integrators who invest in portfolio-level relationships capture repeat business across an owner's entire building stock as each individual property reaches its own natural renovation window over time. That relationship depth, built over a decade or more of portfolio-wide engagement, is considerably harder for a transactional competitor to displace with a single lower bid on any one project. That relationship typically spans over 10 years.
Market Impact: Portfolio relationships often span

Who Controls the Margin Pool

Concentration is moderate at roughly 41% for the top five, split between large building technology conglomerates offering full-portfolio solutions and specialist manufacturers focused on particular control functions. The gap between leaders and challengers is integrator relationship depth and analytics capability rather than hardware performance, broadly comparable across established suppliers. All participants are assessed on one basis, revenue from building automation hardware, software, and i
Competition runs along three lines. First, analytics and software capability, increasingly where customers evaluate vendors rather than hardware specification alone. Second, integrator and portfolio relationship depth, because large owners value continuity across their entire building stock over time. Third, cybersecurity retrofit capability, a newly important requirement that several established vendors are still building out internally rather than having ready today.

Pressure is building from two directions. Independent software vendors are entering through analytics and fault detection, competing directly against the conglomerates' own software ambitions in exactly this space. Meanwhile Chinese manufacturers are expanding internationally on price, particularly in new construction markets where relationships matter less than in mature retrofit regions. Rankings should favour suppliers combining analytics depth with genuine integrator relationships over those holding hardware scale alone.
building-automation-system-market-company-positioning-matrix-1787324908773

Competitive Moat and Risk Dimensions

JOHNSON CONTROLS

Moat: Deep integrator network and scale

Johnson Controls operates one of the deepest integrator networks in the industry, built through decades of relationships across commercial real estate portfolios worldwide. Its OpenBlue analytics platform addresses the software layer directly, positioning it against both hardware and pure software competitors simultaneously. Scale supports investment in cybersecurity retrofit capability smaller competitors struggle to match.
JOHNSON CONTROLS

Risk: Legacy hardware transition pressure

A large installed base of legacy hardware creates genuine transition risk as customers shift spending toward analytics software rather than replacement hardware entirely. Independent software vendors compete directly for the fault detection and analytics layer without carrying comparable hardware overhead costs. Portfolio breadth means building automation competes internally for capital against other divisions.
HONEYWELL

Moat: Analytics and cybersecurity integration

Honeywell Forge combines analytics with cybersecurity capability built directly into its core platform, addressing two of the fastest-growing demand drivers in this market from a single integrated offering. Its industrial automation heritage provides genuine cybersecurity depth that pure building technology competitors are still developing internally. Strong presence across both new construction and retrofit segments provides balanced exposure.
HONEYWELL

Risk: Diversified portfolio dilutes focus

Building automation competes for investment against Honeywell's broader aerospace and industrial portfolio, which carries different growth and margin profiles entirely. Chinese manufacturers are expanding aggressively in new construction markets where Honeywell's brand premium matters considerably less than on established retrofit accounts. Integrator relationship depth varies meaningfully by region.

Players Tracked

Prominent Players

Johnson Controls
Honeywell
Siemens
Schneider Electric
ABB

Other Key Players

Trane Technologies
Carrier Global
Legrand
Signify
Delta Controls
Distech Controls
Tridium
KMC Controls
Cylon Controls
Ecolab BluePoint
Verdigris Technologies
Aquicore
Brainbox AI
75F
Cimetrics

Recent Developments

APRIL 2023

New York building performance mandate enforcement period begins

New York's Local Law 97 building performance mandate entered its enforcement period, requiring covered buildings to meet emissions limits or face financial penalties. This was regulatory enforcement rather than any corporate transaction, and it converted automation upgrades from discretionary spending into a genuine compliance obligation.
Signal: Mandate enforcement dates now predict retr
JANUARY 2024

Major building technology vendor expands cybersecurity retrofit offering

A leading building technology vendor expanded its cybersecurity retrofit product line, adding network segmentation and monitoring capability for legacy building automation systems. This was an organic product expansion rather than an acquisition. It came as regulators across several major markets began imposing comparable requirements on ageing infrastructure.
Signal: Cybersecurity retrofit is quickly becoming
SEPTEMBER 2025

Saudi giga-project awards major building automation contract

A major Saudi Arabian giga-project awarded a substantial building automation contract covering comprehensive integrated systems across its planned development. This was a procurement award rather than a corporate transaction, and it confirmed sustained regional demand for full-portfolio automation specification. This confirmed sustained regional demand for full-portfolio automation specification.
Signal: Gulf giga-projects are now specifying auto

Sensors, Controllers, Software Development, Integration Labour

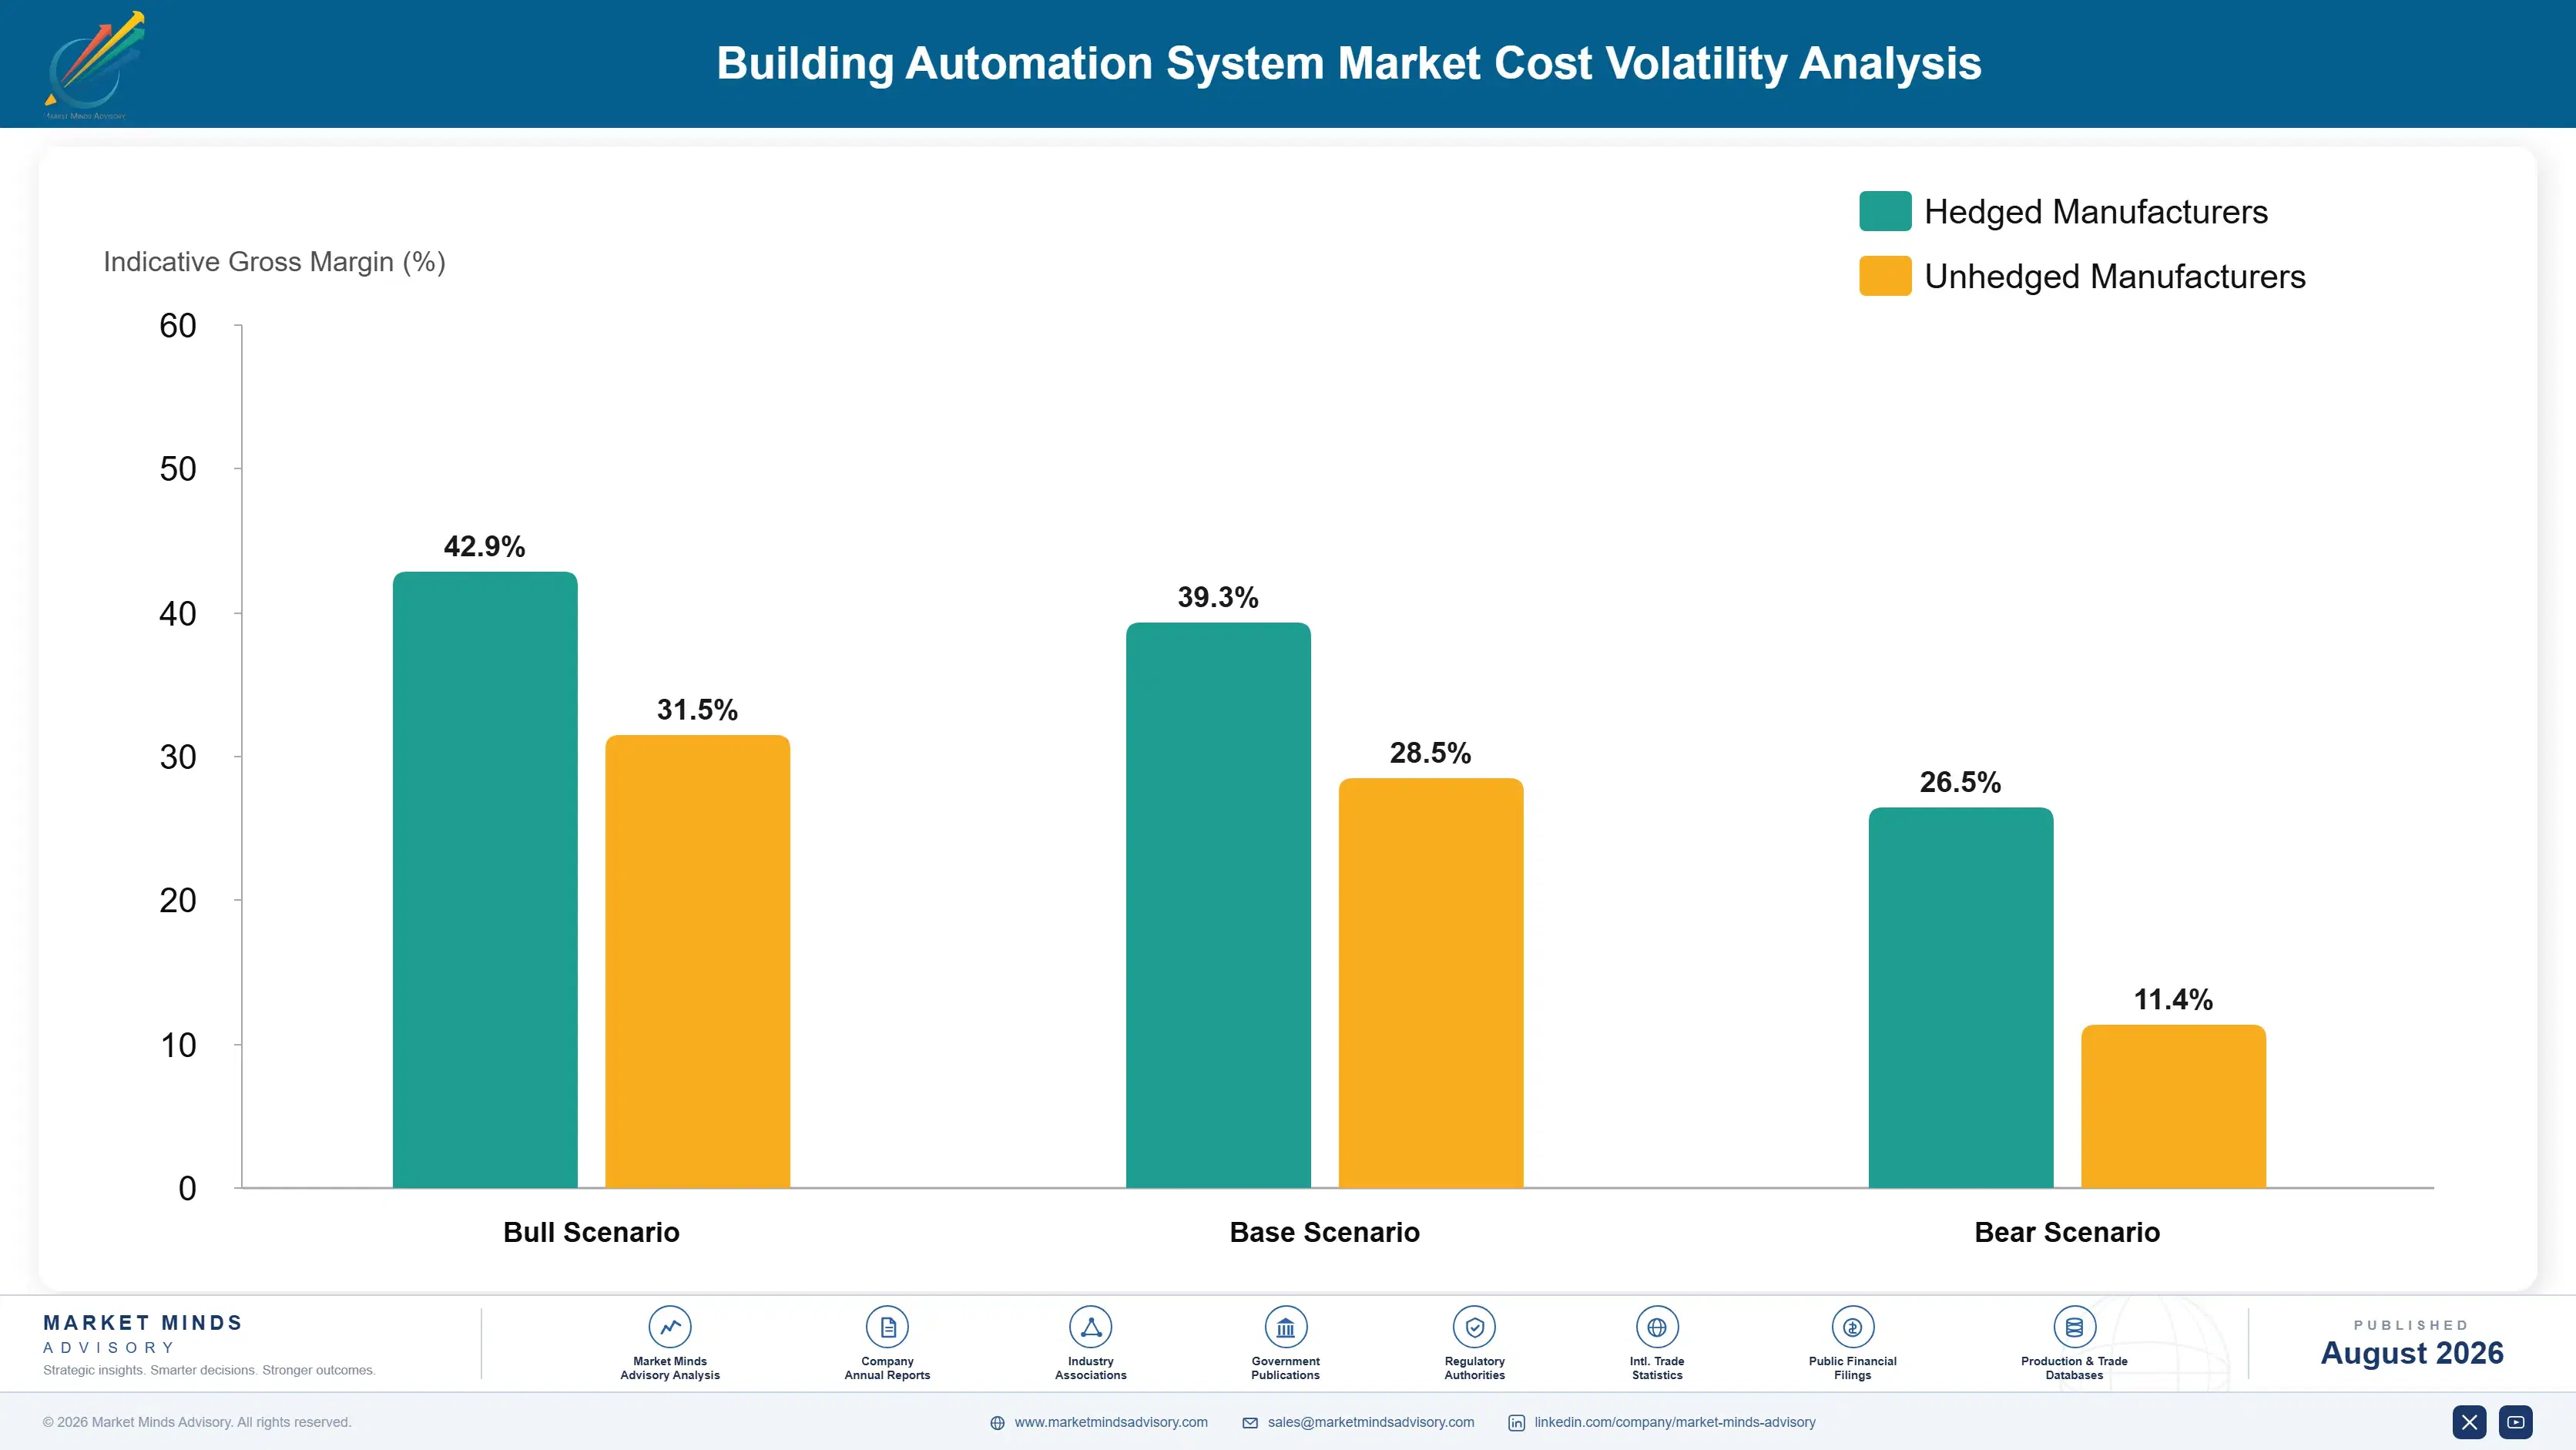
Cost structure splits between hardware and engineering labour. Sensors, controllers, and networking hardware account for roughly 35% of typical project cost, sourced from a mix of proprietary and general electronics supply chains. Integration and engineering labour represents 30% to 45% of total project cost, reflecting the custom work required to connect disparate legacy systems. Software licensing and cloud infrastructure complete the structure for analytics-enabled platforms specifically.
Semiconductor shortages through 2021 and 2022 extended controller and sensor lead times considerably, forcing several integrators to redesign projects around whatever components were actually available rather than the originally specified hardware. Several vendors disclosed the resulting delivery delays across their annual reporting through that period, and EIA data recorded the parallel electricity cost movement that raised both component manufacturing and building operating costs simultaneously across the industry.

Exposure divides sharply by integrator scale and vendor relationships rather than by geography specifically. Large integrators with direct manufacturer relationships secured component allocation considerably better than smaller firms buying through distribution during the shortage. The disadvantage compounds, because a project delayed by component shortage disrupts an occupied building's operations for longer than planned, damaging the integrator relationship with that owner for future portfolio work.
building-automation-system-market-cost-volatility-analysis-1787324908966

Qualify multiple controller platforms rather than standardising

Standardising on a single controller manufacturer simplifies engineering but becomes a hard constraint the moment that supplier faces a component shortage. Qualifying software and engineering practice across two or three controller platforms costs additional training investment but preserves the ability to deliver when any single supplier faces disruption unexpectedly. That flexibility matters most when a supplier faces disruption unexpectedly.

Secure component allocation through direct manufacturer agreements

Buying components through general distribution channels leaves integrators competing for allocation against every other customer during a shortage, with no priority whatsoever. Direct manufacturer agreements, even at modest volume, typically secure better allocation priority and clearer visibility into genuine lead times than distribution purchasing ever provides during periods of constrained supply. That access proves valuable when supply is tightest.

Price integration labour separately from hardware bundles

Bundling engineering and integration labour into a single hardware price hides the largest and most variable cost in most projects, and scope changes erode margin invisibly when labour is not tracked separately. Pricing integration as a distinct line item makes true project economics visible and defensible when scope inevitably expands. Clients accept the change once shown it prevents disputes.

Portfolio Architecture for Margin Defence

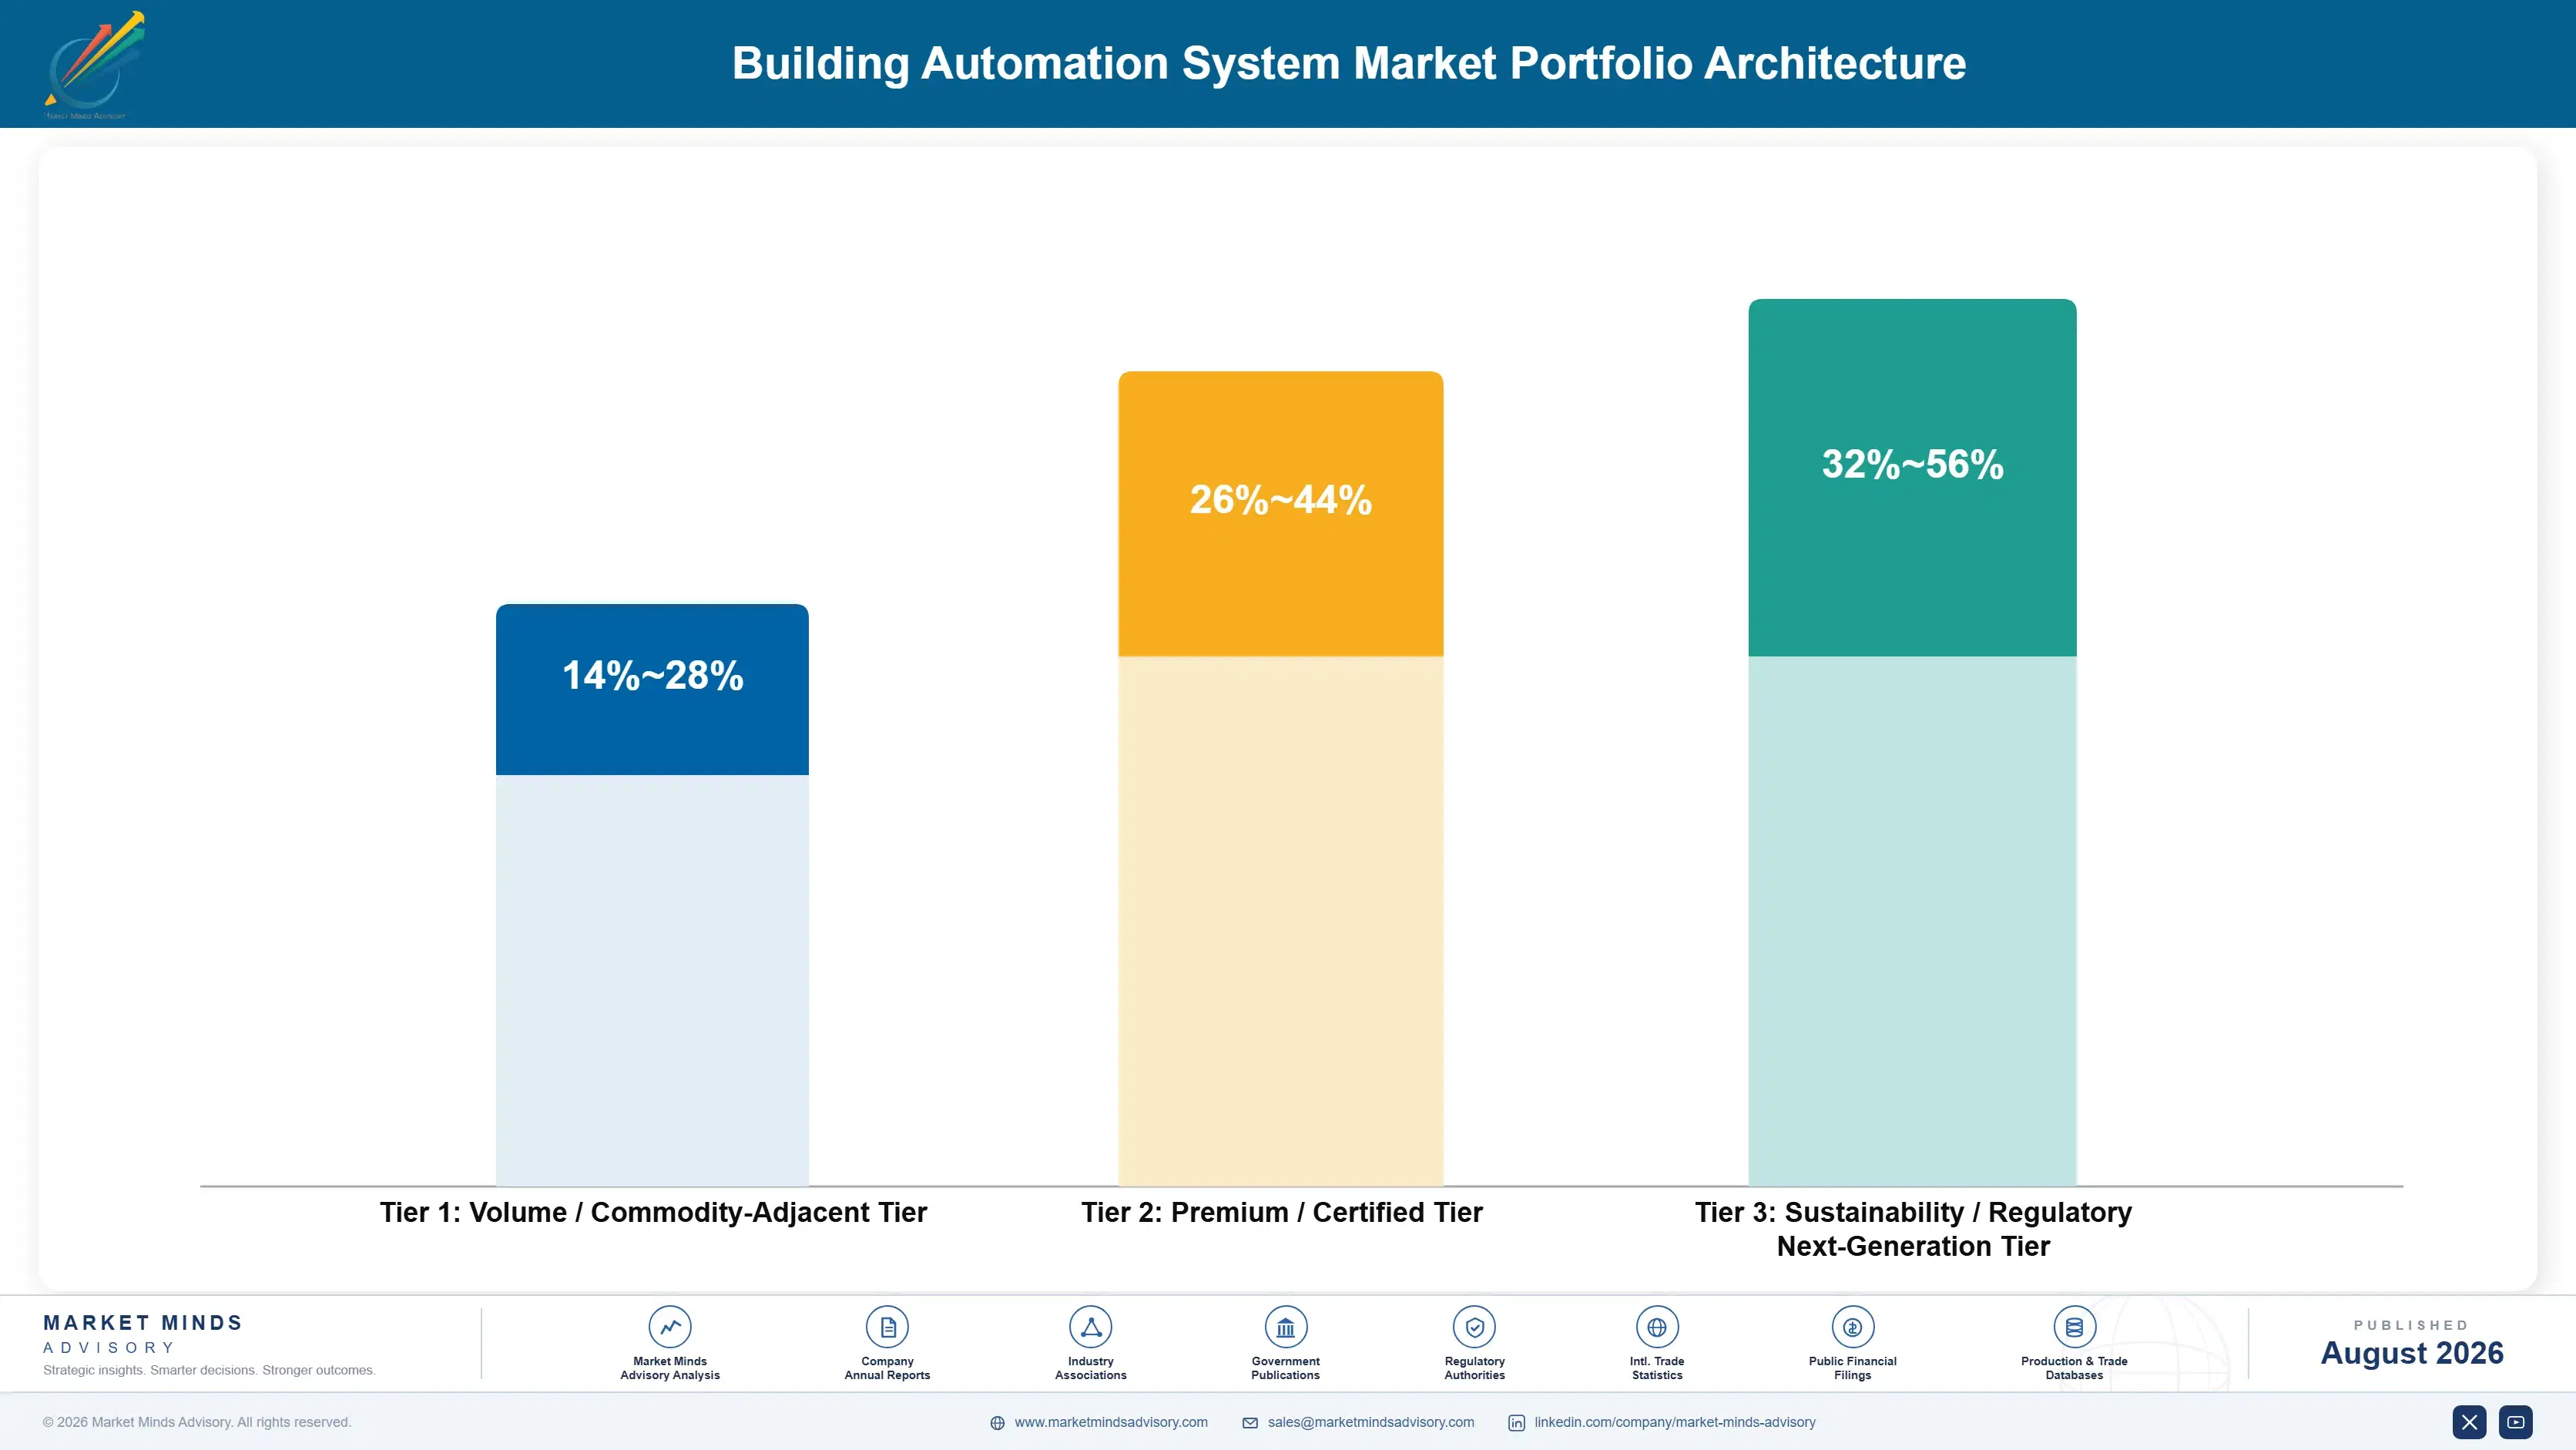
The portfolio splits into three tiers with genuinely different economics. Standard HVAC and lighting controls are the volume tier, where hardware competition is direct and integration cost dominates economics. Cybersecurity retrofit and mandate-compliance projects earn considerably more, because regulatory urgency and specialised expertise narrow the qualified field substantially. Analytics and AI-enabled platforms sit differently again, priced against recurring software value rather than one-ti
The tension runs between hardware volume that keeps integrators busy and software work that earns the recurring return. Standard controls generate steady project revenue and maintain the relationships through which higher-value analytics conversations eventually happen. Yet hardware alone competes directly on price against every other qualified integrator in a given market. Suppliers managing this well treat hardware as relationship maintenance and direct growth investment toward analytics and compliance-driven work specifically.

High-value pools concentrate where regulation or genuine technical differentiation limits competition meaningfully: mandate-compliance retrofits with fixed deadlines, cybersecurity remediation addressing newly imposed requirements, and analytics platforms delivering savings existing hardware never surfaced on its own. All three resist the price competition defining standard hardware installation, because the customer is purchasing urgency or genuine expertise rather than comparing equivalent equipment specifications across bidders.

Volume / Commodity-Adjacent Tier

Standard HVAC, lighting, and access control hardware sold into competitive integration bids across commercial construction and retrofit projects. The range is wide because integrator relationship depth varies considerably between projects and customers.
Gross Margin: 14-28%

Premium / Certified Tier

Mandate-compliance retrofit projects and cybersecurity remediation work carrying regulatory urgency and specialised technical expertise requirements. The range is wide because compliance deadline proximity affects achievable pricing considerably. Regulatory deadlines and insurer requirements both sustain this premium pricing durably over time.
Gross Margin: 26-44%

Sustainability / Regulatory / Next-Generation Tier

AI-enabled analytics platforms, fault detection software, and integrated energy management systems delivering recurring subscription revenue beyond hardware. The range is wide because software economics differ sharply from one-time hardware sales.
Gross Margin: 32-56%
building-automation-system-market-portfolio-architecture-1787324909465

High-value Sub-segments and Strategic Watch-out

AI-Enabled Analytics and Fault Detection Platforms

High value and the fastest growth at 14.7%, deployable without the occupied-building disruption a hardware replacement requires. This is increasingly where owners evaluate vendors, even where underlying hardware remains largely unchanged from a prior generation. This increasingly determines vendor selection even where underlying hardware remains largely unchanged.
Gross Margin: 34-56%

Cybersecurity Retrofit Services

High value with strong growth, created substantially by regulatory and insurer requirements reaching equipment previously exempt from meaningful scrutiny. Most established vendors are still building this capability internally rather than having it fully ready today. Most established vendors are still building this capability internally rather than having it ready.
Gross Margin: 28-46%

HVAC Controls

The volume core across nearly every commercial building automation project, and the category that establishes integrator relationships. Growth is steady at 8.6% but hardware competition is direct, holding margin below the software and compliance tiers above it. Hardware competition stays direct across nearly every competitive integration bid available today.
Gross Margin: 14-28%

Lighting Controls

The strategic watch-out, growing slowest at 7.2% as LED lighting's own efficiency gains reduce the incremental savings controls alone can still deliver. Integration with broader building platforms remains the segment's clearest path to renewed growth ahead. Integration with broader platforms remains its clearest path toward renewed growth ahead.
Gross Margin: 16-30%

How Building Automation Decisions Actually Commit

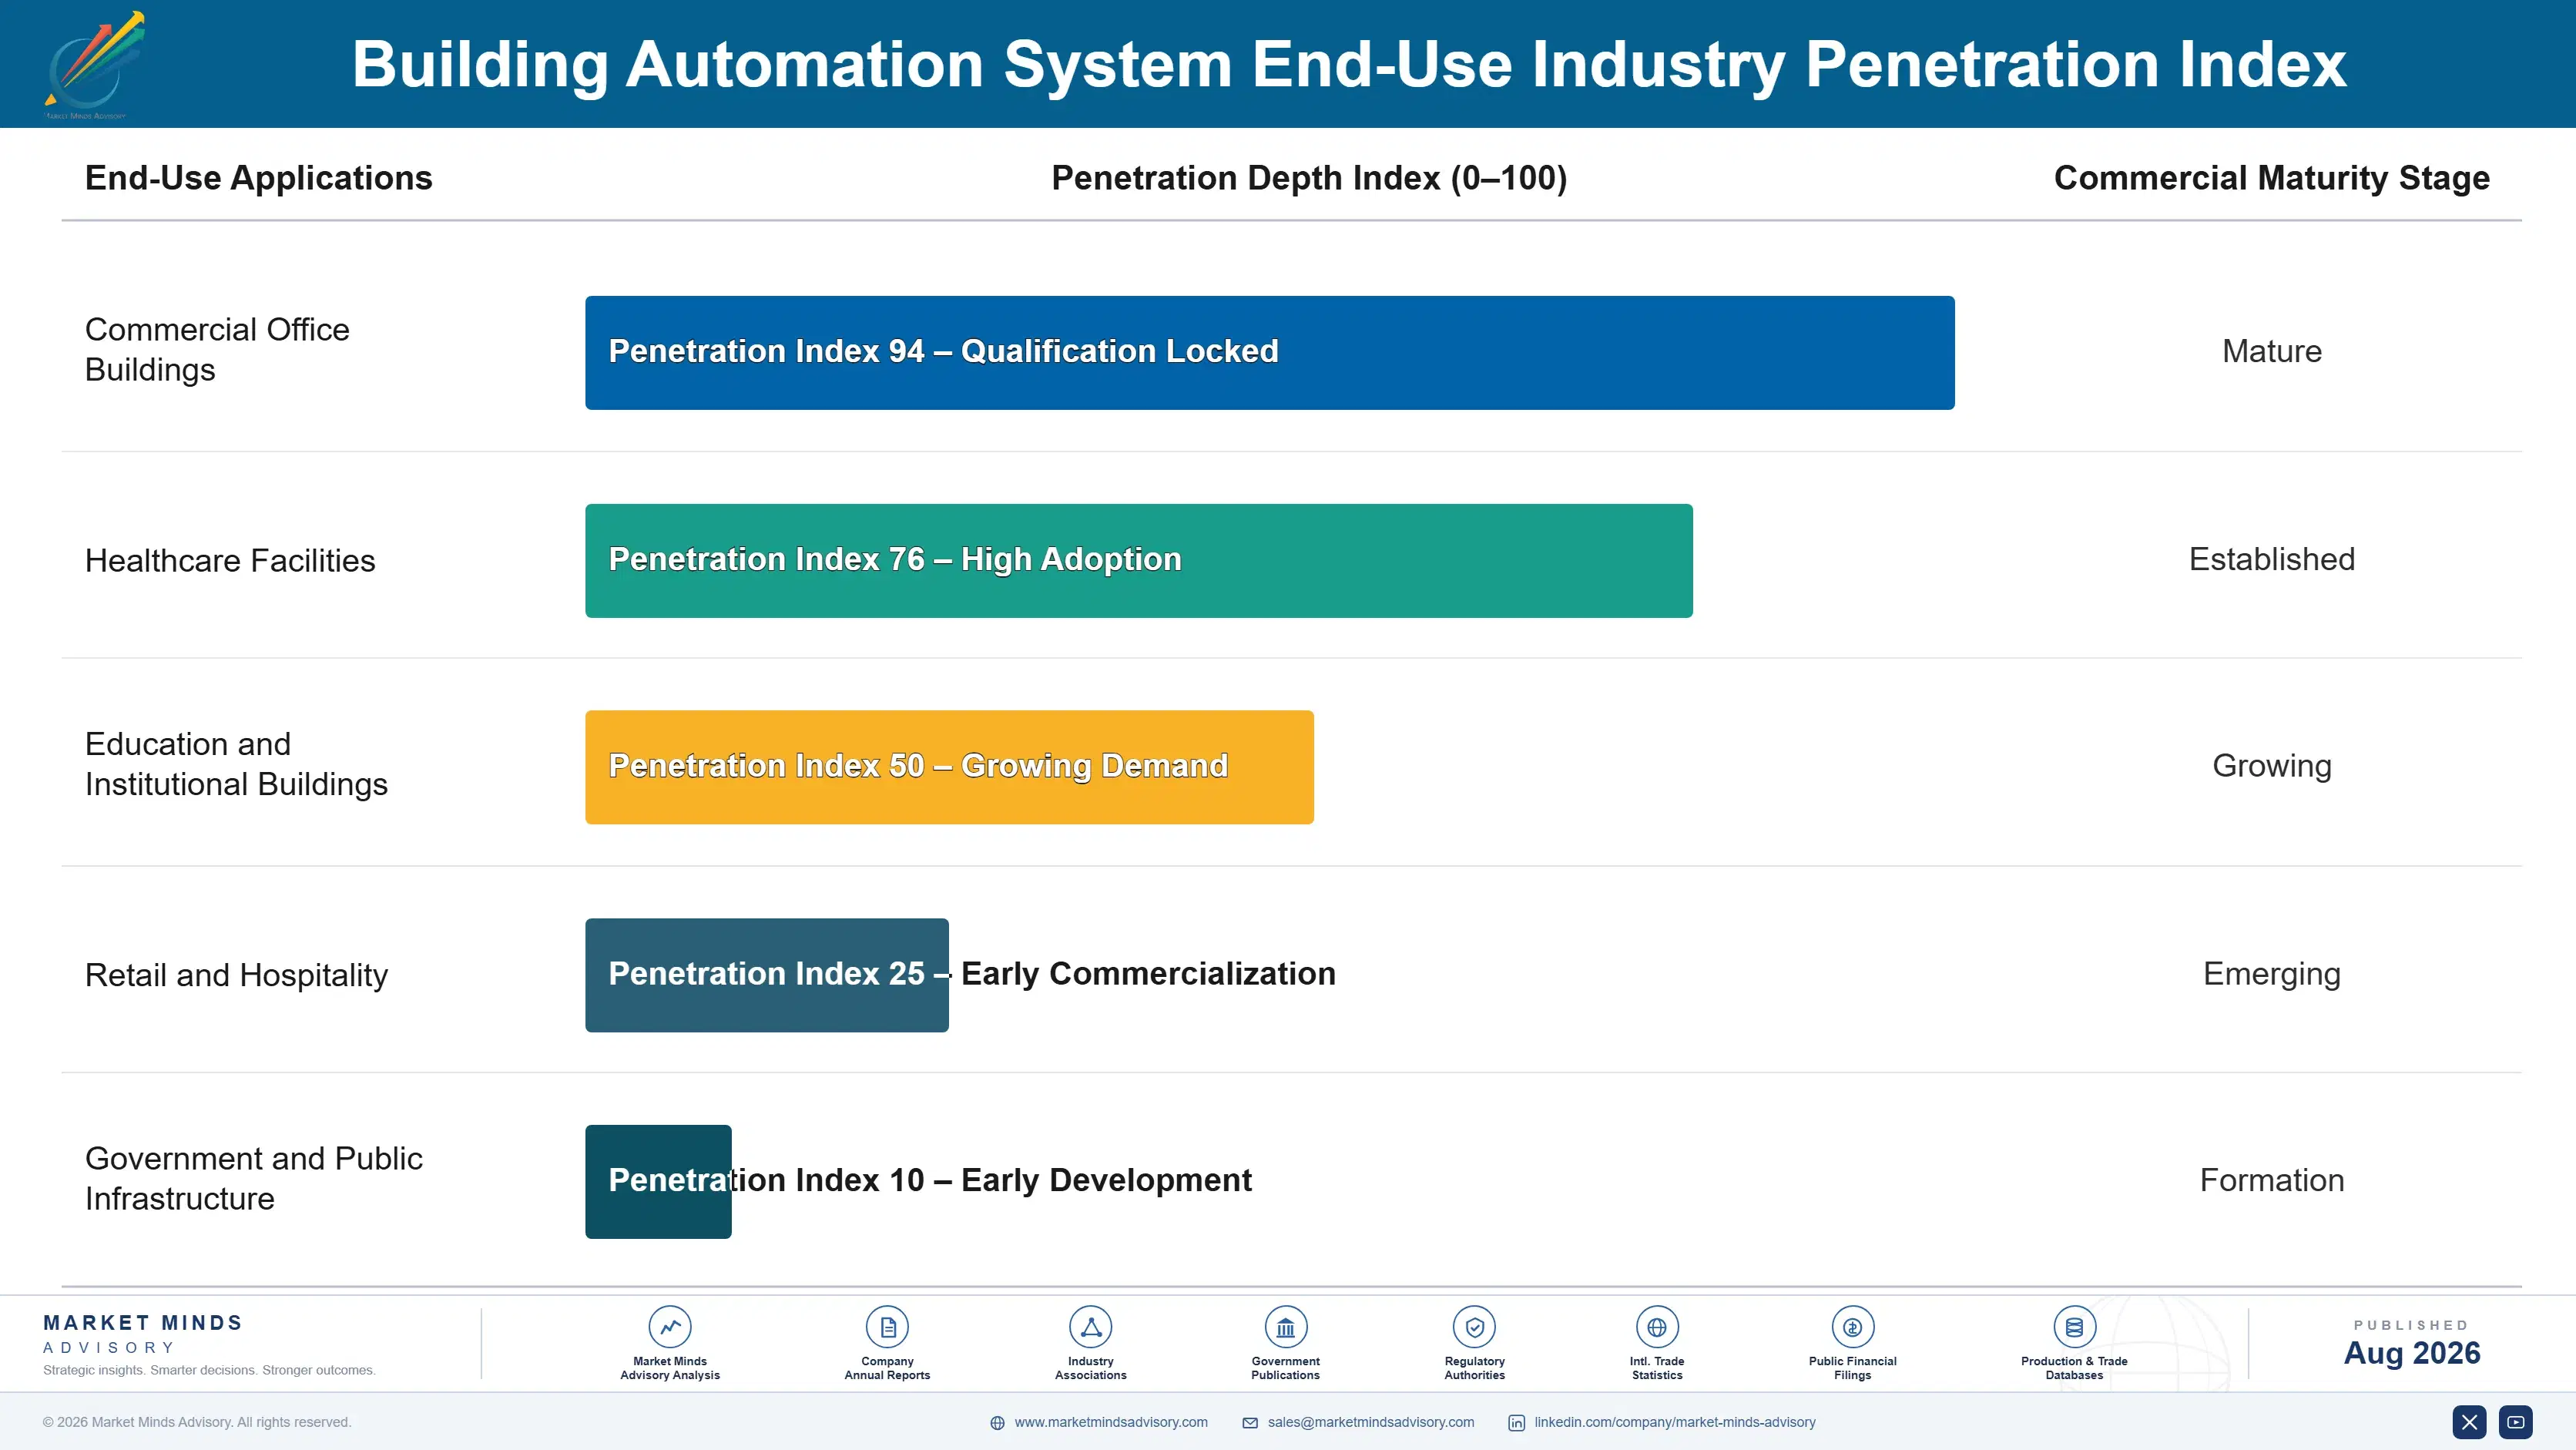
Revenue commits in long cycles once a system is installed, and rarely reconsidered outside a natural renovation window. A building automation platform installed today typically runs twelve to eighteen years before facing genuine replacement, and the vendor relationship persists across that period through parts, service, and software upgrades. Winning the original installation is therefore the whole commercial contest, and the relationship that follows is close to automatic.
Adoption depth varies sharply by owner type. Institutional owners managing large multi-building portfolios go deepest, standardising on preferred vendors across their holdings to simplify operations. Single-building owners specify more opportunistically, often driven by whichever integrator their facilities manager already trusts from prior projects. Government and institutional buildings move slowest, constrained by procurement processes, but commit to the longest relationships once a vendor is genuinely qualified.

Buyer profiles have shifted from facilities engineers toward sustainability officers, finance functions, and increasingly cybersecurity teams with quite different priorities. An engineer once compared equipment specifications directly; a sustainability officer now tracks mandate compliance timelines, and a finance function models total cost of ownership against recurring software fees. Vendors still selling purely on hardware specification find decisions made by people who never saw their datasheet.
building-automation-system-market-end-use-penetration-index-1787324909956

Our Call On Building Automation

These are among the four positions where our research anticipates prominent divergence between winners and laggards over the coming forecast period. Each is grounded in the demand model, the regulatory perimeter, and the announced capacity pipeline.
01 / SOFTWARE VALUE MIGRATION

Analytics now decide vendor selection, not hardware alone

A building automation platform generates continuous operating data that most owners never fully exploit, and software surfacing fault detection and energy savings from that existing data monetises an asset the owner already paid for without any disruptive hardware replacement. Vendors who build genuine analytics capability convert a one-time hardware sale into a recurring subscription relationship persisting for the underlying system's entire operating life. Analytics platforms typically identify 10% to 20% of additional savings on systems owners believed were already fully optimised.
02 / MANDATE COMPLIANCE POSITIONING

Regulation converts discretionary spending into obligation

Building performance standards convert automation upgrades from discretionary spending into a genuine compliance obligation carrying real financial penalties for buildings that miss fixed deadlines entirely. Vendors who position offerings explicitly against specific mandate timelines, rather than around generic energy savings claims, address a board-level obligation that competes for capital very differently than an optional facilities upgrade ever does. Compliance-driven projects now affecting over 20,000 buildings across major mandate cities move through procurement considerably faster than payback-justified upgrades ever managed previously.
03 / CYBERSECURITY RETROFIT OPPORTUNITY

A budget line barely existing a decade ago now competes directly

Building networks designed decades ago with no expectation of network intrusion now face genuine cybersecurity requirements from regulators and insurers who previously exempted this equipment category from meaningful scrutiny entirely. Vendors who build segmentation, monitoring, and patching capability directly into their core product line, rather than treating security as an afterthought, address demand that barely existed as a budget category a decade ago. Security incidents affecting building systems have risen sharply, and insurers increasingly require documented remediation before renewing coverage.
04 / OCCUPIED BUILDING TIMING DISCIPLINE

Replacement happens on the building's schedule, not the vendor's

Replacing a control system in a functioning building disrupts heating, cooling, or security for weeks, and that disruption cost routinely outweighs the performance gap between an ageing system and a genuinely better replacement available on the market. Vendors should therefore concentrate sales effort around natural renovation windows and system failures rather than trying to accelerate proactive replacement against an owner's operational reluctance to disrupt occupied space. Phased replacement and parallel operation strategies that minimise tenant-visible disruption win projects that a full disruptive shutdown proposal simply cannot.

Engagement Snapshot From the Field

A live engagement with an industry participant carrying material or product regulatory and market exposure ahead of a defining policy shift, showing how our research translates into a defensible multi-year portfolio strategy.
MARKET MINDS ADVISORY · CLIENT ENGAGEMENT SUMMARY
Building Automation System Producer Strategic Portfolio Review and Transition Roadmap 2026·Investment Scenario on Building Automation System Exposure Evaluation 2025-26
CLIENT PROFILE
An institutional real estate owner managing 45 commercial office buildings across several major cities engaged MMA while facing building performance mandate deadlines in three jurisdictions simultaneously. The client reported a building automation vendor base fragmented across nine different suppliers accumulated through decades of individual acquisitions, with no portfolio-wide standard applied (client-reported, unverified by MMA). across its holdings
STRATEGIC CHALLENGE
Compliance deadlines were approaching in multiple cities with different requirements, and the fragmented vendor base meant every building needed a separately scoped project with no economies of scale across the portfolio at all. The board wanted a standardisation plan but worried that forcing vendor consolidation would disrupt operations at buildings currently performing well under existing systems.
MMA APPROACH
MMA mapped every building against its specific mandate deadline, current system age, and compliance gap to prioritise the portfolio by genuine urgency rather than treating every property identically. We assessed which incumbent vendors offered credible analytics upgrade paths that could close compliance gaps without full hardware replacement. We then modelled portfolio-wide standardisation savings against the disruption risk at buildings with systems still performing adequately.
KEY FINDINGS
  1. Roughly 60% of the portfolio could close its compliance gap through analytics software layered on existing hardware, avoiding disruptive replacement entirely at those specific properties.
  2. Three buildings faced compliance deadlines within eighteen months and had hardware too old to support analytics upgrades, requiring full replacement regardless of the broader standardisation timeline (client-reported, unverified by MMA).
  3. Standardising on two vendors rather than nine would cut ongoing service contract costs meaningfully while preserving genuine competitive tension through a second qualified source.
  4. Sequencing the three urgent buildings first, ahead of the broader standardisation programme, avoided compliance penalties that the original consolidation-first plan would have risked incurring.
CLIENT PROFILE
An institutional real estate owner managing 45 commercial office buildings across several major cities engaged MMA while facing building performance mandate deadlines in three jurisdictions simultaneously. The client reported a building automation vendor base fragmented across nine different suppliers accumulated through decades of individual acquisitions, with no portfolio-wide standard applied (client-reported, unverified by MMA). across its holdings
STRATEGIC CHALLENGE
Compliance deadlines were approaching in multiple cities with different requirements, and the fragmented vendor base meant every building needed a separately scoped project with no economies of scale across the portfolio at all. The board wanted a standardisation plan but worried that forcing vendor consolidation would disrupt operations at buildings currently performing well under existing systems.
MMA APPROACH
MMA mapped every building against its specific mandate deadline, current system age, and compliance gap to prioritise the portfolio by genuine urgency rather than treating every property identically. We assessed which incumbent vendors offered credible analytics upgrade paths that could close compliance gaps without full hardware replacement. We then modelled portfolio-wide standardisation savings against the disruption risk at buildings with systems still performing adequately.
KEY FINDINGS
  1. Roughly 60% of the portfolio could close its compliance gap through analytics software layered on existing hardware, avoiding disruptive replacement entirely at those specific properties.
  2. Three buildings faced compliance deadlines within eighteen months and had hardware too old to support analytics upgrades, requiring full replacement regardless of the broader standardisation timeline (client-reported, unverified by MMA).
  3. Standardising on two vendors rather than nine would cut ongoing service contract costs meaningfully while preserving genuine competitive tension through a second qualified source.
  4. Sequencing the three urgent buildings first, ahead of the broader standardisation programme, avoided compliance penalties that the original consolidation-first plan would have risked incurring.
RECOMMENDED STRATEGY
Phase 1: Phase 1 (0 to 18 months): Replace hardware at the three buildings facing imminent compliance deadlines, prioritising urgency over portfolio-wide standardisation sequencing. Phase 2: Phase 2 (18 to 36 months): Deploy analytics software across the 60% of the portfolio where existing hardware supports it, closing compliance gaps without disruptive replacement. Phase 3: Phase 3 (36 to 60 months): Standardise the remaining fragmented vendor base onto two qualified suppliers as each building reaches its natural renovation window.
OUTCOME
The client avoided compliance penalties at its three urgent buildings by prioritising them ahead of the broader consolidation plan, and analytics deployment across the eligible portfolio is proceeding on schedule. Vendor consolidation toward two suppliers is underway opportunistically as buildings reach renovation windows naturally (client-reported, unverified by MMA).

Frequently Asked Questions

Foundational context covering the market sizes, CAGR, scope, country, region and competition that inform every finding below. This section is provided to cover basics and most often pre-purchase conversations, answered from the MMA Primary Research Dataset.

What is the current size of the Building Automation System Market?

The global building automation system market is valued at USD 95.0 billion in 2025, covering building management platforms, HVAC controls, lighting controls, access control, and analytics software. Consumer smart home devices and industrial process control are excluded.

How large will the Building Automation System Market be by 2036?

The market is forecast to reach USD 250.13 billion by 2036 in the base case, about 2.41 times the 2026 level. That represents incremental value of roughly USD 146.39 billion across the forecast decade.

What is the CAGR for the Building Automation System Market 2026 to 2036?

The market grows at a 9.2% CAGR in the base case, with bull and bear scenarios at 10.4% and 8.0%. The spread turns mainly on mandate enforcement pace and analytics adoption speed across the installed base.

Which segment is growing fastest?

AI-enabled analytics and fault detection platforms grow fastest at 14.7%, about 1.60 times the overall rate, since they deploy without occupied-building disruption. HVAC controls follow at 9.8% on mandate compliance and air quality demand.

Who are the major companies in the Building Automation System Market?

Leading suppliers include Johnson Controls, Honeywell, Siemens, Schneider Electric, and ABB, holding roughly 41% between them. Independent software vendors are increasingly competing for the analytics and fault detection layer specifically.

Which country is growing fastest?

Saudi Arabia grows fastest at a 12.8% CAGR, as giga-project construction specifies comprehensive building automation from the design stage at unprecedented scale. The United Arab Emirates and India follow on comparable construction momentum.

Report Segmentation Architecture

The full report scope spans multiple orthogonal segmentation dimensions, with cross-tabulated demand data provided for each dimension pair. Coverage extends further to regional breakdowns, trend trajectories, and the competitive detail needed to support segment-level decision-making.

By Control Function

  • Building Management System Platforms
  • HVAC Controls
  • Lighting Controls
  • Access Control and Security Integration
  • Analytics and Fault Detection Software

By End-Use Industry

  • Commercial Office Buildings
  • Healthcare Facilities
  • Education and Institutional Buildings
  • Retail and Hospitality
  • Government and Public Infrastructure

By Deployment Model

  • New Construction Integrated Installation
  • Retrofit and Modernisation Upgrade
  • Analytics Software Overlay
  • Managed Service and Subscription Contract

By Region

  • North America
  • Western Europe
  • East Asia
  • South Asia and Pacific
  • Latin America
  • Middle East and Africa
  • Eastern Europe

Scope, Methodology, and Coverage

Every figure in this report is reproducible from documented input assumptions. The scope below maps the historical period, the forecast horizon, the segmentation dimensions, and the countries covered, alongside the underlying primary and qualitative methodology.
Historical Period
2020 to 2025
Forecast Period
2026 to 2036
Base Year
2025 (USD billions; MMA Primary Research Dataset, August 2026)
Market Definition
The building automation system market comprises integrated control systems and associated software that monitor and manage heating, ventilation and air conditioning, lighting, access control, fire and life safety, and energy consumption within commercial and institutional buildings, valued at manufacturer, integrator, and software selling prices. It spans building management system platforms serving as the central control layer, HVAC controls including sensors and actuators, lighting controls, access control and security system integration, and analytics and fault detection software layered on top of underlying hardware. Standalone consumer smart home devices, industrial process control systems used in manufacturing, elevator and escalator control systems, and building construction and installation labour sold separately from automation equipment are excluded.
Quantitative Units
USD billions (current prices); installed building count and control point volume where applicable
Segmentation Dimensions
By Control Function; By End-Use Industry; By Deployment Model; By Region
Regions Covered
North America, Western Europe, East Asia, South Asia and Pacific, Latin America, Middle East and Africa, Eastern Europe
Countries Covered
USA, Canada, Mexico, China, Japan, South Korea, Germany, France, UK, Netherlands, Italy, Spain, Sweden, Poland, Czechia, Romania, India, Australia, Indonesia, Vietnam, Thailand, Brazil, Argentina, Chile, UAE, Saudi Arabia, Qatar, Egypt, South Africa, Nigeria, and additional markets relevant to this sector
Key Companies Profiled
Johnson Controls, Honeywell, Siemens, Schneider Electric, ABB, Trane Technologies, Carrier Global, Legrand, Signify, Delta Controls, Distech Controls, Tridium, KMC Controls, Cylon Controls, Ecolab BluePoint, Verdigris Technologies, Aquicore, Brainbox AI, 75F, Cimetrics
Quantitative Methodology
Primary survey, n=3,800 respondents, Q4 2025, six countries; demand-side model with trade association cross-validation
Qualitative Methodology
47 expert interviews, Q4 2025; applied to validate demand model assumptions, identify emerging dynamics, and assess competitive positioning
Report Format
PDF and XLSX data workbook (Word format preview document)
Publisher
Market Minds Advisory
Report Code
MMA-2026-TEC-241
Published
August 2026
Contact
sales@marketmindsadvisory.com | www.marketmindsadvisory.com

Purchase the full Building Automation System Market Report (2026 to 2036).

The full MMA Building Automation System report sizes the market across five control functions, five end-use industries, four deployment models, and seven regions through 2036. It profiles 20 suppliers on a consistent basis of building automation revenue, scoring each on analytics and software capability, integrator relationship depth, cybersecurity retrofit readiness, and mandate compliance positioning. Scenario models quantify how building performance mandates, analytics adoption, and cybersecurity requirements move both revenue and achievable margin by control function. The report also includes mandate deadline tracking across major cities, analytics savings benchmarking by building type, and cybersecurity retrofit market sizing across the installed base.
Five-function and four-model market sizing through 2036
Twenty-supplier benchmark on building automation revenue
Building performance mandate deadline tracking by city
Analytics savings benchmarking across building types
Cybersecurity retrofit market sizing on installed base
Integrator relationship depth assessment by supplier

Built For The People Who Decide

From boardroom strategy to bench-side execution, this report is read cover-to-cover by leaders shaping the next decade of their industry, turning demand scenarios, market dynamics and valuation benchmarks into decisions.
CXOs/ Presidents/ VPs/ Managers
M&A and Corporate Development
Strategy Teams and R&D Heads
Procurement and Product Directors
Regulatory and Compliance Leaders
Investor Relations and Equity Analysts