Market Minds Advisory
Building Automation System Industry Analysis in Korea

Building Automation System Industry Analysis in Korea: Commissioning Is Where the Savings Vanish

Korean buildings are specified to some of the strictest energy codes anywhere, then handed over with control sequences nobody verified, which is why measured performance keeps falling short of design.

Lead Analyst

David Horsley

Published

September 2026

Make Smarter Decisions with Customized Research Insights

Request a free sample report and evaluate market opportunities, growth trends, and competitive dynamics relevant to your business needs.

2025 MARKET VALUE$2.1BMarket Size 2025
2036 FORECAST VALUE$4.8BBase Case , 2026 to 2036
CAGR 2026 TO 20367.8 %Bull 9.0% / Bear 6.6%
INCREMENTAL OPPORTUNITY$2.5BNet 10- year value creation
EXPANSION MULTIPLE2.12x2036 value over 2026 base
Strategic Levers
M&A Pipeline
Regional Outlook
Country Rankings
Competitive Intelligence
Segmental Deep-dive
Call-Us : 91 93563 13602

Executive Snapshot and Market Trajectory

Korean commercial buildings are designed to strict energy codes and then commissioned badly. Around 63% of installed control sequences were never functionally verified against the design intent, and measured energy use runs roughly 22% above the modelled figure. The equipment is not the problem.
Growth runs at 7.8% and services rather than hardware carry it. Analytics, commissioning, and optimisation services grow at 11.7%, exactly 1.50 times the market rate, because building owners have started measuring what they actually got. Seoul and the surrounding capital region account for the majority of installed value, concentrated in office and mixed-use towers. Energy metering and submetering follows at 9.4%, pulled directly by disclosure requirements. Retro-commissioning payback typically arrives inside two years.
Concentration reaches 47% across the top five measured on installed control points, split between global automation vendors, Korean conglomerate affiliates, and system integrators. The integrators do the commissioning work and carry none of the brand, which is where the accountability for building performance quietly disappears. Independent commissioning agents are now selling verification directly to owners instead. Domestic manufacturers are also moving upward from field devices into supervisory platforms.
Market Definition
This market covers building automation and control systems installed in commercial, institutional, and industrial buildings within South Korea, spanning heating, ventilation and air conditioning control systems, lighting and shading control, energy metering and submetering systems, integrated security and access control tied to building management, and analytics, commissioning and optimisation services. Residential smart home products, process control in manufacturing plants, district heating network infrastructure, and construction electrical installation fall outside scope.
Base Year Value
$2.1B in 2025 (MMA Primary Research Dataset, August 2026)
Forecast Period
2026 to 2036, eleven discrete annual values
CAGR
7.8% base case. Bull 9.0%. Bear 6.6%.
Fastest Growth Segment
Analytics, Commissioning and Optimisation Services: 11.7% CAGR
Fastest Growth Country
South Korea: 7.8% CAGR
Fastest Growth Region
South Asia and Pacific: 9.6% CAGR
Largest Region
East Asia: 46% of 2025 global value
Market Leaders
Samsung C&T, LS Electric, Siemens Korea, Honeywell Korea, Johnson Controls Korea. Source: MMA Analysis based on company annual reports.
Primary Survey
n=3,800 procurement and R&D decision-makers, Q4 2025, six countries
Methodology
Demand-side build-up, cross-validated against public data, 47 expert interviews

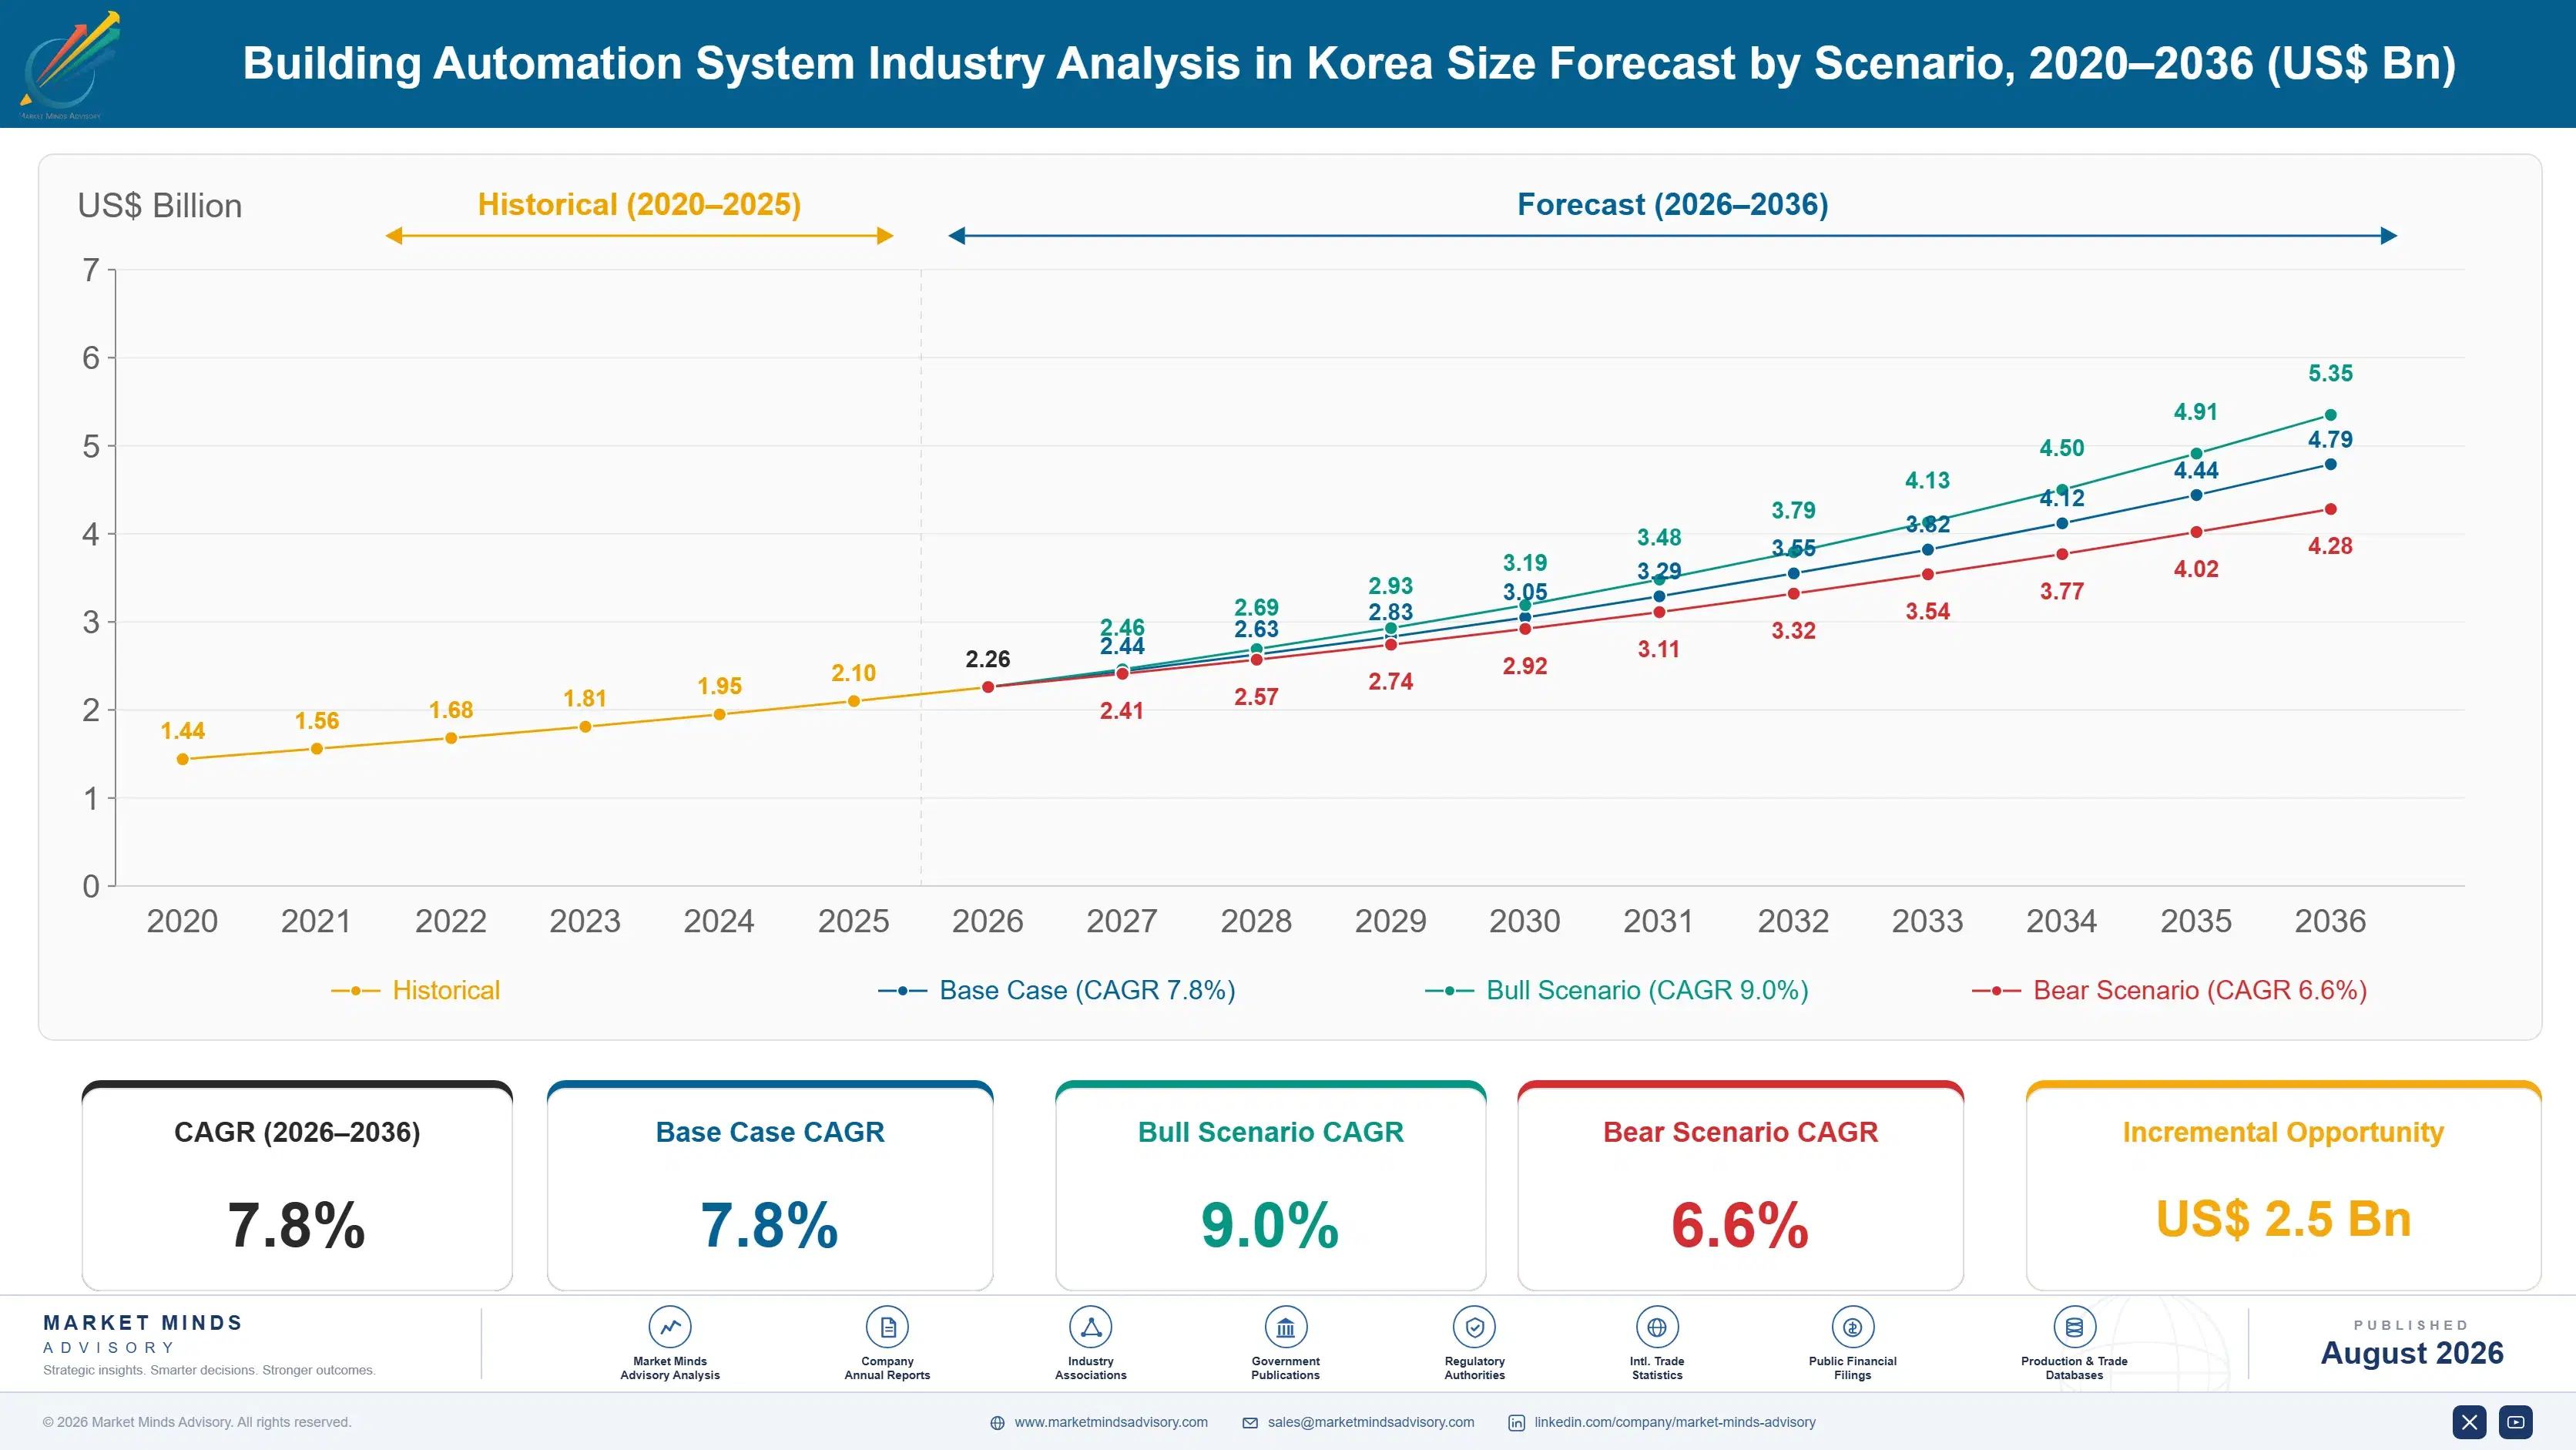
Building Automation System Industry Analysis in Korea Market Forecast Scenarios

building-automation-system-industry-analysis-in-ko-size-forecast-scenario-1787301057775
The 2020 to 2025 period ran at 6.6% and new construction rather than retrofit drove it. Office completions in Seoul and the capital region continued through the disruption, while retrofit activity fell sharply and recovered slowly. Green building certification requirements tightened across the period and pulled specification upward without changing how buildings were actually commissioned or verified afterward.
Three mechanisms carry the 7.8% base case. Energy performance disclosure requirements are the largest, since a building whose measured consumption is published faces an argument its design documents cannot settle. Ageing office stock retrofit is the second, with a substantial share of Seoul commercial buildings now beyond twenty years old. And data centre and industrial facility control demand is the third, growing considerably faster than commercial property. None of the three depends on new control technology arriving.
The 9.0% bull case rests on mandatory functional commissioning entering the building code, which would convert a service most owners currently decline into a required line item on every project. The 6.6% bear case is commercial construction weakness in the capital region combined with retrofit budgets deferred, since building automation upgrades compete against envelope and safety work that cannot wait.

Designed Well and Handed Over Badly

Korea writes demanding energy codes and enforces them at design stage. Buildings are modelled, specified, and permitted against performance targets that compare well with anywhere in the world. Then they are built, handed over, and occupied, and measured consumption comes in around 22% above the modelled figure. The gap is consistent enough across the stock that it cannot be explained by occupancy behaviour alone.
UNVERIFIED CONTROL SEQUENCES63%Of installed sequences never functionally tested against design intent
ENERGY PERFORMANCE GAP22%By which measured consumption exceeds the modelled design figure
CAPITAL REGION SHARE68%Of installed system value concentrated around Seoul and Gyeonggi
TOP FIVE CONCENTRATION47%Moderate, across global vendors, conglomerate affiliates, and integrators
COMMISSIONING SHARE OF PROJECT4%Of installed system cost spent on functional verification work
SYSTEM REPLACEMENT CYCLE14 yearsBetween control system replacements across commercial building stock
The explanation sits in commissioning. Roughly 63% of installed control sequences are never functionally tested against the design intent, meaning nobody confirms that the economiser actually opens at the right outdoor temperature or that the reheat coil stops fighting the cooling coil. Commissioning accounts for about 4% of installed system cost, which is the first line cut when a project runs over budget, and it usually does.
The accountability structure makes this worse rather than better. Global vendors supply equipment, conglomerate affiliates hold main contracts, and system integrators actually configure the controls. The integrator carries none of the brand and none of the energy performance obligation, and the owner discovers the shortfall a year later from a utility bill. That is why the fastest growth is now in analytics and retro-commissioning.
"We put trend logs on a two-year-old tower in Gangnam. Three air handlers were heating and cooling the same air simultaneously, all day, since handover. Nobody had ever looked, because nobody was responsible for looking."
Director, Building Systems and Energy Performance Practice · MMA Technology and

Market Trends

Owners Start Measuring What They Actually Received

Analytics platforms reading trend data from installed systems are finding faults that commissioning never caught, and around 63% of control sequences were never functionally verified in the first place. Retro-commissioning services grow at 11.7% against 7.8% for the market, because a measured 22% performance gap is an argument no design document settles. Owners commissioning this work generally find payback inside two years, which is faster than any equipment replacement can offer. Faults found routinely include air handlers heating and cooling the same air stream continuously since handover. Nobody had looked, because nobody was responsible for looking.
Market Impact: Cycle runs about 14 years
Disclosure Requirements Make Measured Performance Public

Energy performance disclosure obligations across Korean commercial buildings publish measured consumption rather than modelled design figures, which changes what a building owner can ignore. A 22% gap between the two becomes a leasing conversation rather than an engineering footnote. The requirement has done more to create demand for verification services than any efficiency incentive, and it applies to existing stock where the retrofit opportunity sits rather than only to new construction. Submetering by floor and by system makes that gap attributable rather than merely visible. Attribution is what converts a published measurement into an actual capital decision.
Market Impact: Commissioning is 4% of cost

Market Opportunities and Growth Drivers

Ageing Seoul Office Stock Reaches Replacement Age

Control systems run around fourteen years between replacements, and a substantial share of Seoul commercial buildings completed during the construction waves of the late nineties and early two thousands are now well past that. Replacement is not optional once controllers become unsupported and spare parts disappear from the market. That creates retrofit demand driven by obsolescence rather than by any efficiency argument, which is considerably more reliable as a demand base. Efficiency arguments compete for capital against envelope and safety work and usually lose that contest. Obsolescence-driven replacement proceeds regardless of any energy case.
Market Impact: Commissioning is 4% of cost

Data Centre Construction Demands Control At Higher Specification

Korean data centre construction has expanded rapidly around the capital region and in Busan, and cooling control in those facilities operates at tolerances commercial buildings never approach. Failure carries consequences measured in equipment damage and service outage rather than in occupant comfort complaints. That raises specification, raises the value of proper commissioning, and brings a customer who actually pays for functional verification instead of cutting it from the budget. Data centre operators write functional verification into contracts rather than accepting handover on installation completion. Commercial owners almost never do, which is precisely the difference.
Market Impact: About 63% never verified

Market Restraints and Challenges

Commissioning Is The First Budget Line Cut

Functional verification costs about 4% of installed system value and roughly 63% of control sequences never receive it, because commissioning is discretionary while equipment is contractual. The root cause is that a project running over budget cuts what nobody can point at in a handover inspection. Commercial impact is buildings performing 22% below design across the stock. Mitigation runs through commissioning written into the building code, owner-side commissioning agents, and performance clauses tied to measured consumption. Pricing verification as explicit scope rather than absorbing it makes it visible and defensible.
Market Impact: Services growing at 11.7%

Nobody In The Chain Owns Building Performance

Global vendors supply equipment, conglomerate affiliates hold the main contract, and system integrators configure the controls, so responsibility for whether the building performs as designed sits with nobody in particular. The root cause is contractual structure rather than technical capability. Commercial impact is faults persisting for years after handover with no party obliged to find them. Mitigation runs through owner-appointed commissioning agents, measured performance clauses, and ongoing analytics contracts that create a standing obligation. Owners are beginning to appoint their own commissioning agents in response to exactly this. Energy disclosure has made the resulting gap public rather than internal.
Market Impact: Gap reaches 22% of consumption
4 additional market trends, 3 additional growth drivers, and 2 additional restraints and challenges are covered in the full report. Contact sales@marketmindsadvisory.com to access the complete intelligence.

Segment CAGR and Growth Architecture

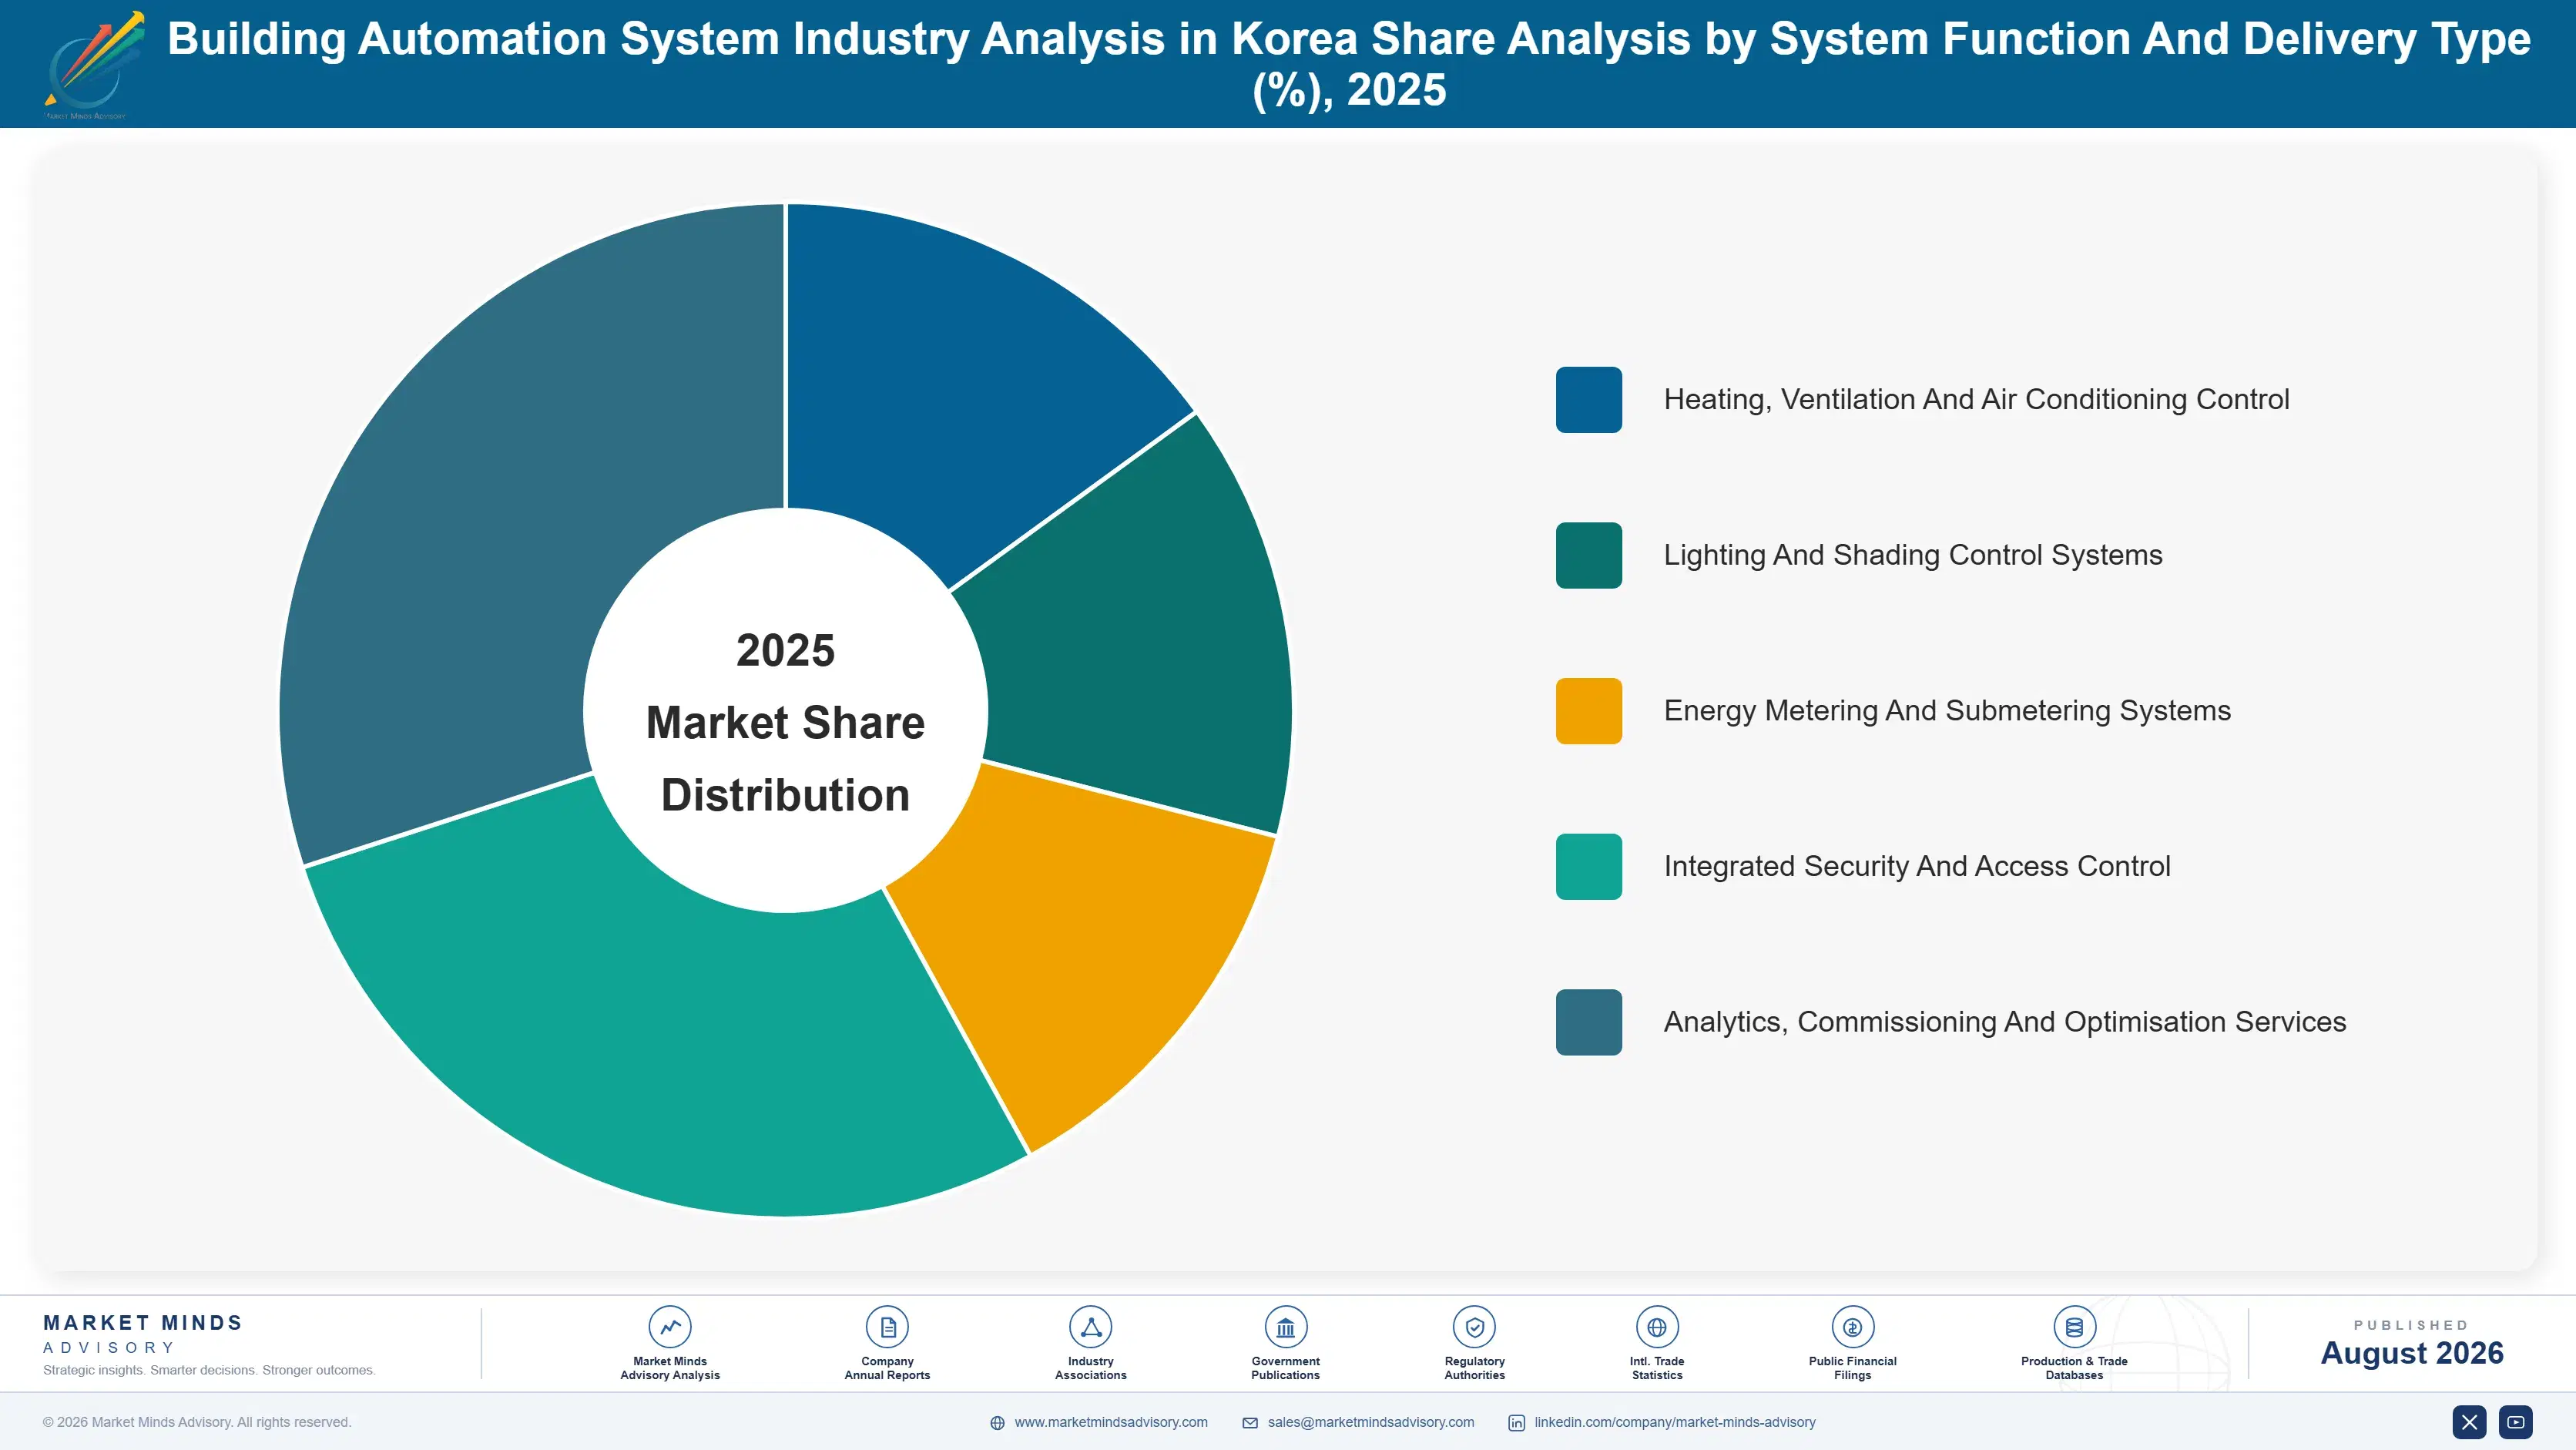
Segmentation follows system function and the delivery type attached to it, because those determine specification level, who installs and configures the work, and whether the revenue arrives once or recurs. Building type and ownership model both cut across every function rather than separating them, which makes either a weaker primary dimension here. Delivery type decides whether revenue recurs at all.
building-automation-system-industry-analysis-in-ko-market-share-analysis-1787301058309

Analytics, Commissioning And Optimisation Services

The fastest category at 11.7%, exactly 1.50 times the market rate, and the only one addressing the gap between what a building was designed to do and what it actually does. Around 63% of installed control sequences were never functionally verified, and measured consumption runs roughly 22% above design. Owners who commission retro-commissioning work generally find their payback inside two years, faster than any equipment replacement offers. Revenue also recurs wherever analytics contracts continue, which changes the economics against one-time installation work considerably. Baseline trend data accumulated under a contract is also difficult for a new provider to reproduce. That makes analytics relationships considerably stickier than one-time installation relationships ever were.
CAGR 11.7%

Energy Metering And Submetering Systems

Second fastest at 9.4%, pulled directly by disclosure requirements that publish measured consumption rather than modelled design figures. Submetering by floor, tenant, and system makes a performance gap attributable rather than merely visible, which is what converts a measurement into an action. Multi-tenant office buildings drive most demand, since cost recovery from tenants requires metering that older buildings never installed. Installation is disruptive in occupied space, so this work tends to follow major refurbishment rather than standing alone. Submetering also makes cost recovery from tenants possible, which older Korean buildings were never equipped for. Disclosure obligations apply to existing stock rather than only to new construction, which is where the opportunity sits.
CAGR 9.4%
Full segment breakdown across 5 segments available in the complete report.

Regional Architecture and Country Demand Map

This report covers South Korea, so the regional table below is repurposed to show where the technology and equipment installed in Korean buildings originates. Every share therefore sits outside its framework band by construction rather than by any judgment. Technology origin, not installation location, is the axis here.

East Asia

Forty-six percent of the equipment and control technology installed in Korean buildings originates within the region, far outside the framework band because this table shows technology origin rather than installation location. Korean manufacturers supply controllers, sensors, metering, and field devices at scale, supported by conglomerate affiliates holding main contracts on domestic projects. Japanese suppliers contribute precision sensing and variable refrigerant flow control. Chinese component supply is growing at the device level rather than at the platform level. Growth at 8.6% runs above the market rate on domestic supply substitution. Korean field device manufacturing in particular has compressed pricing across the lower layers considerably. Supervisory platform capability is now being developed domestically as well.
Share: 46% | CAGR: 8.6% (2026 to 2036)

North America

Twenty-two percent, and American automation platforms carry a disproportionate share of the supervisory and analytics layer relative to their field device presence. The building management software installed in most large Korean commercial towers originates here, and the analytics platforms driving retro-commissioning growth almost entirely so. Field devices beneath those platforms are increasingly Korean or Japanese. Growth at 7.4% sits close to the market rate, supported by the analytics layer expanding faster than the hardware layer beneath it does. Analytics and fault detection platforms driving retro-commissioning growth originate almost entirely from this origin. Platform positions also persist across a fourteen-year replacement cycle in ways field equipment does not. Field device presence continues shrinking.
Share: 22% | CAGR: 7.4% (2026 to 2036)
Regional intelligence for 5 additional markets available in the complete report: Western Europe, South Asia and Pacific, Eastern Europe, Latin America, Middle East and Africa. Contact sales@marketmindsadvisory.com.
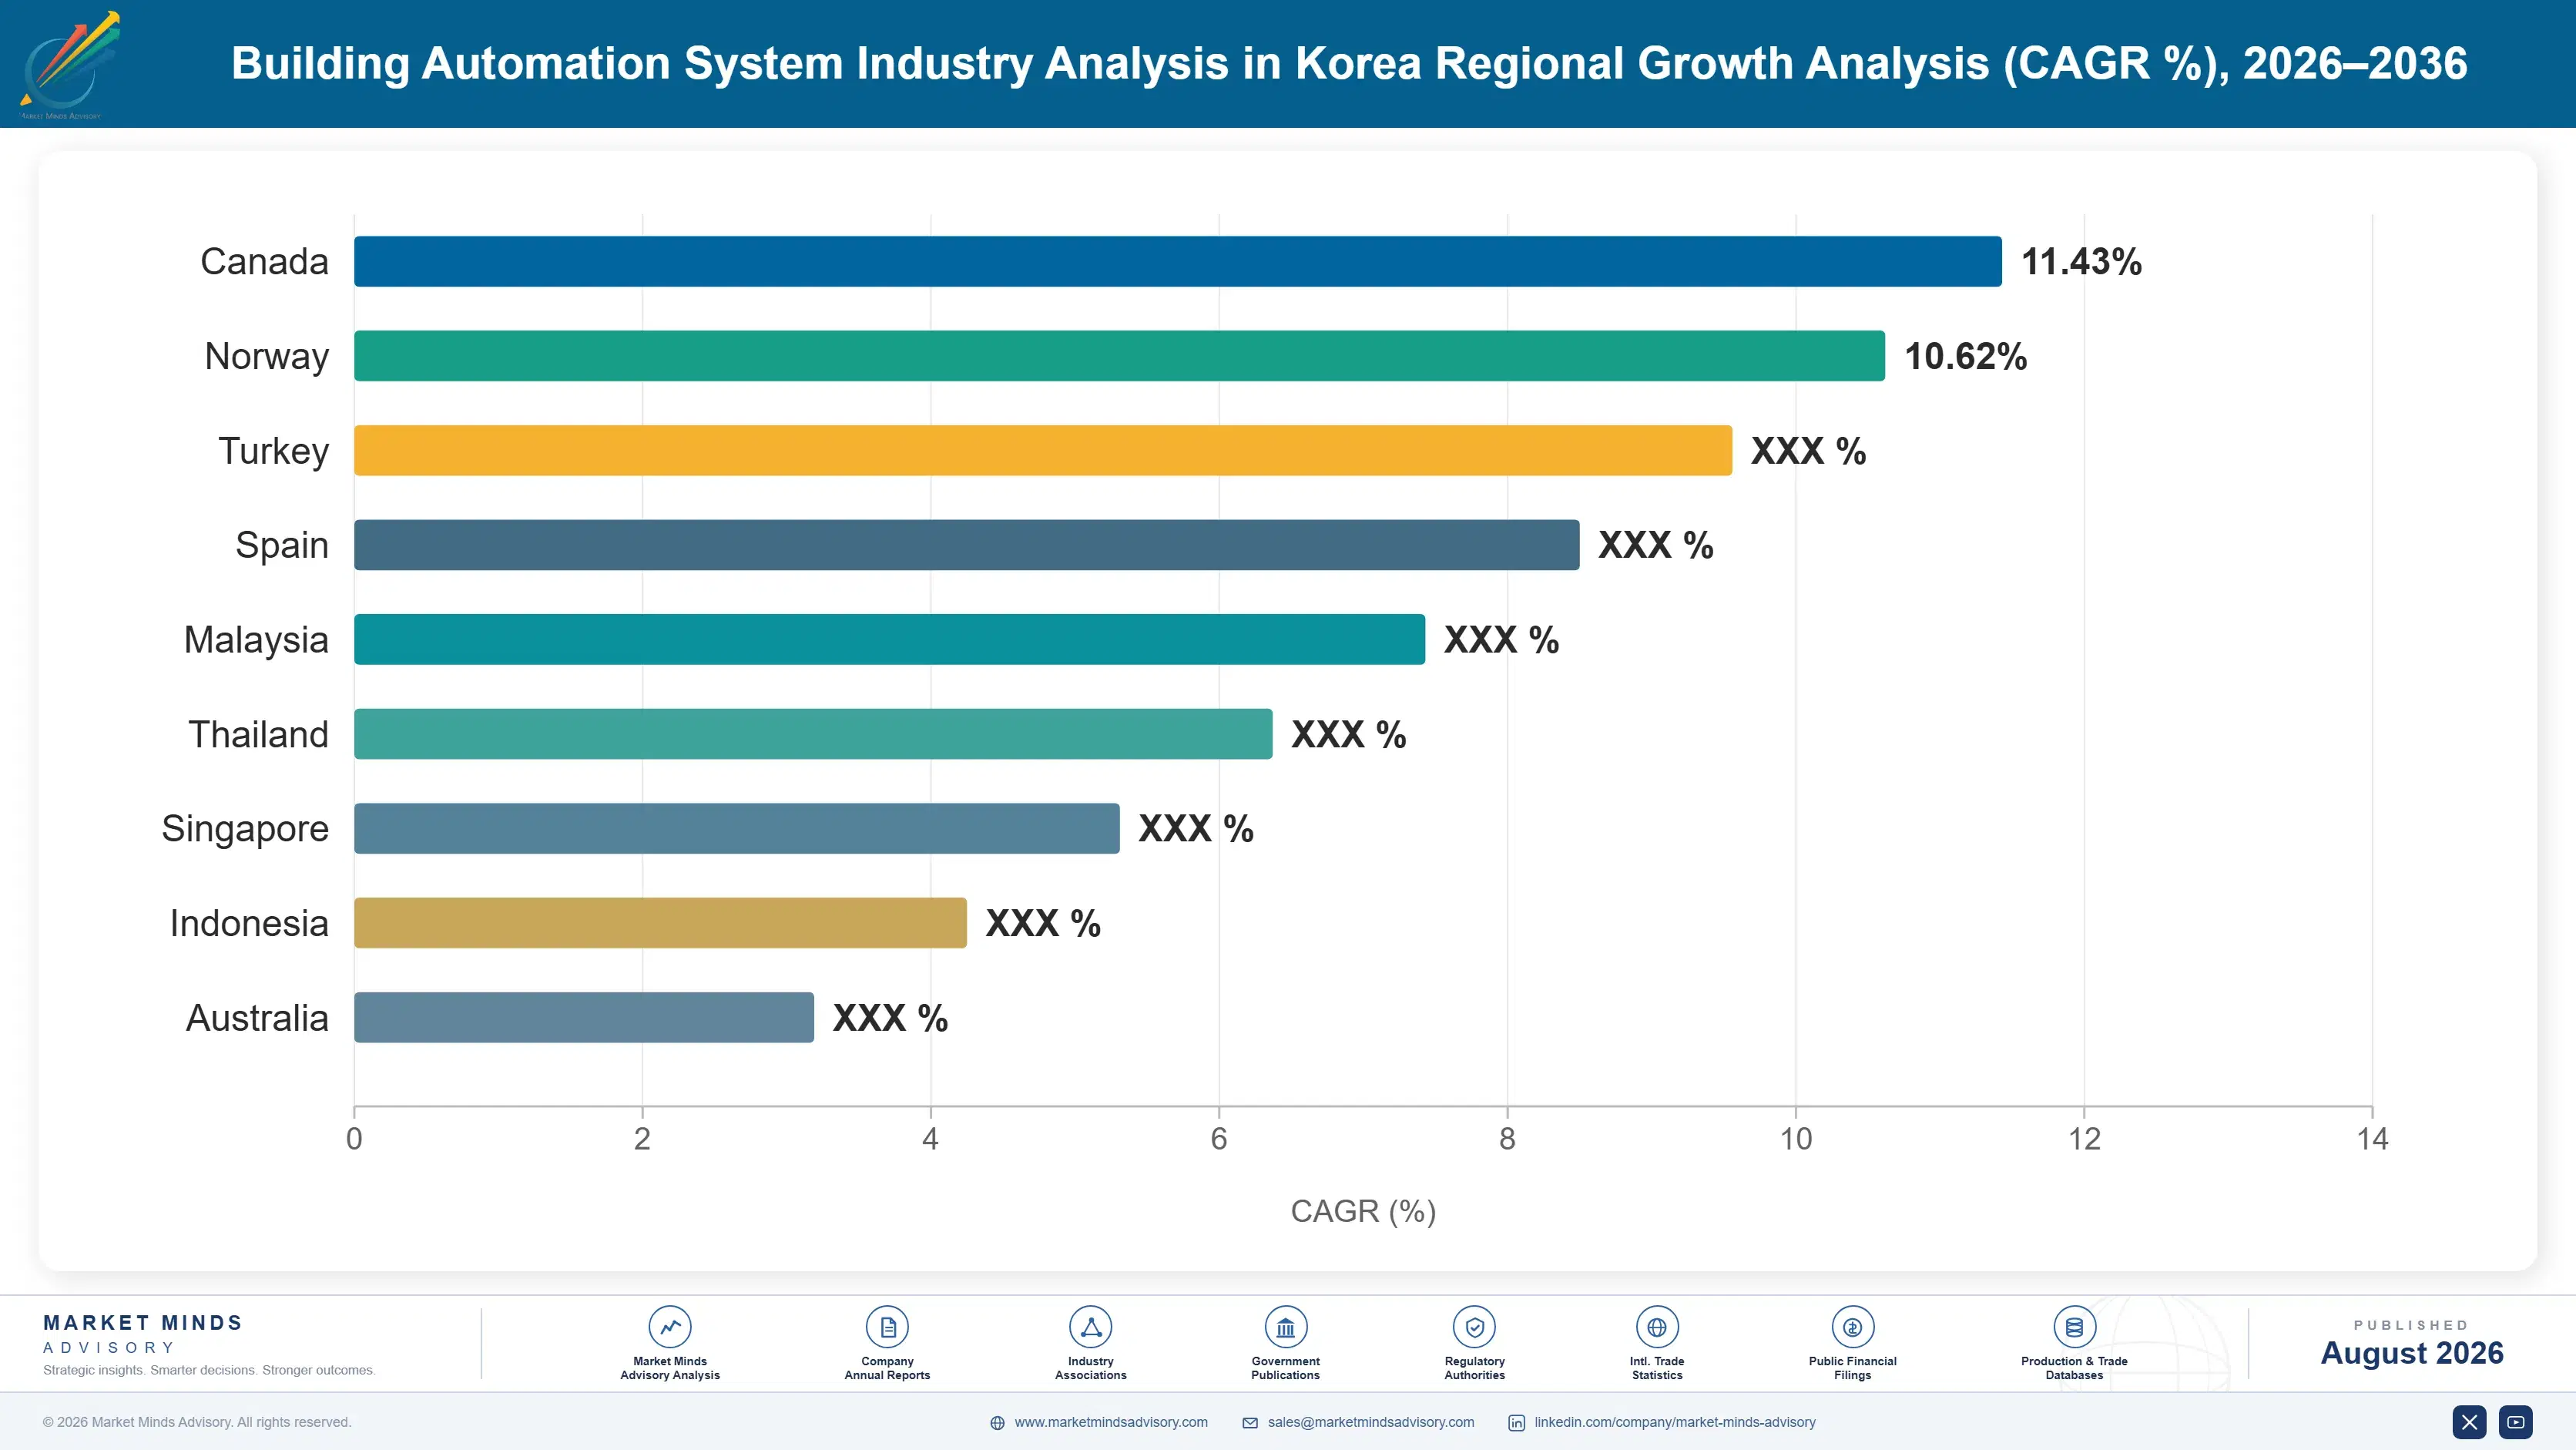
building-automation-system-industry-analysis-in-ko-country-cagr-analysis-1787301058831

Selling the Verification Nobody Bought

Roughly 63% of control sequences were never verified, measured consumption runs 22% above design, commissioning is only 4% of system cost, and replacement cycles run fourteen years. Value comes from selling measured performance, from recurring analytics, and from targeting obsolescence rather than efficiency. Verification rather than equipment is what Korean owners are now actually buying.

Sell Measured Performance Rather Than Installed Capability

Buildings perform roughly 22% below their modelled design because about 63% of control sequences were never functionally verified, and no equipment specification addresses that at all. A supplier offering measured performance against a baseline is selling the thing the owner actually wanted and never received. Retro-commissioning typically pays back inside two years, which is faster than any equipment replacement can offer, and the argument is settled by trend data rather than by competing product claims. Energy disclosure publishes measured consumption, which makes the gap a leasing conversation rather than an engineering footnote.
Market Impact: Performance gap runs about 22% above the design

Convert Installation Accounts To Analytics Contracts

Control system replacement recurs only every fourteen years, so an installation relationship goes quiet for more than a decade while somebody else earns the maintenance and optimisation revenue in between. Ongoing analytics contracts create recurring income and a standing obligation to find faults, which is exactly what the current contractual structure lacks. The conversion costs engineering time rather than capital, and it keeps a supplier present when the replacement decision eventually arrives. Baseline trend data accumulated under a contract is difficult for any new provider to reproduce. Roughly 63% of sequences remain unverified across the installed base.
Market Impact: Replacement recurs only about every 14 years typically

Target Obsolescence Rather Than Efficiency Arguments

Retrofit driven by unsupported controllers and unavailable spare parts happens regardless of any energy business case, and a substantial share of Seoul commercial stock built two decades ago has now reached that point. Efficiency arguments compete against envelope and safety work for the same capital and usually lose. Obsolescence-driven replacement is more reliable demand, and it opens the door to selling commissioning and analytics alongside a project the owner has already decided to fund. A substantial share of stock built two decades ago has passed the 14 year replacement point. Owners funding that work will buy commissioning alongside it.
Market Impact: Replacement cycle now reaches about 14 years typically

Position For Mandatory Commissioning Before It Arrives

Functional commissioning is currently discretionary and accounts for about 4% of installed system cost, which is why it disappears first when a project runs over budget. Code requirements making it mandatory would convert that into a required line item across every project at once. Suppliers holding trained commissioning agents and documented procedures before the change capture that volume, while those building capability afterward compete against established references. Roughly 63% of sequences currently go unverified, which is the volume a code change would convert. Trained agents and documented procedures take time to assemble properly. References matter more than capability afterward.
Market Impact: Commissioning is only 4% of installed system cost

Who Controls the Margin Pool

Concentration reaches 47% across the top five measured on installed control points, and three quite different business models sit inside that figure. Global automation vendors supply platforms and field equipment, Korean conglomerate affiliates hold main contracts and construction relationships, and system integrators perform the configuration work that actually determines building performance. The leader to challenger gap is narrow because a single large development award can move several posit
Competitive activity runs on three fronts. Construction relationship access is the first and most decisive, since building automation is specified inside a main contract rather than tendered independently in most Korean projects. Analytics platform capability is the second, which is where growth and recurring revenue both concentrate. And open protocol integration is the third, increasingly a qualifying requirement as owners resist proprietary lock-in.

Pressure comes from two directions. Independent commissioning agents are selling verification directly to owners, bypassing the contractual chain that failed to deliver it. And Korean equipment manufacturers are moving upward from field devices into supervisory platforms. Both pressures attack the position that construction access and equipment supply historically defended.

Rankings shift on development awards rather than on product cycles.
building-automation-system-industry-analysis-in-ko-company-positioning-matrix-1787301059350

Competitive Moat and Risk Dimensions

SAMSUNG C&T

Moat: Construction relationships and project access

Holding main contracts on large Korean commercial and mixed-use developments determines which automation platform gets specified long before any competitive evaluation occurs, since building controls are decided inside the construction package rather than tendered separately. That access is a construction market position rather than a technology one, and no automation vendor can acquire it by improving a product.
SAMSUNG C&T

Risk: Construction cycle and accountability

Revenue tied to development activity falls with commercial construction in the capital region, and the same contractual structure that secures the work leaves nobody accountable for whether the building performs afterward. Owners increasingly appoint independent commissioning agents in response. A position resting on project access weakens as owners take control back.
SIEMENS KOREA

Moat: Platform depth and analytics capability

A supervisory platform with mature analytics and fault detection addresses precisely the gap that Korean buildings exhibit, where roughly 63% of sequences were never verified and consumption runs above design. Platform positions also persist across a fourteen-year replacement cycle in a way field equipment does not. Building comparable analytics depth requires years of accumulated fault library development.
SIEMENS KOREA

Risk: Field equipment substitution from below

Korean manufacturers supplying controllers, sensors, and field devices at competitive cost are moving upward into supervisory functions, which erodes the hardware revenue that historically funded platform development. Open protocol adoption makes mixing vendors considerably easier for integrators. Platform strength defends the top layer while the layers beneath it are steadily contested.

Key Players

Samsung C&T
LS Electric
Siemens Korea
Honeywell Korea
Johnson Controls Korea

Others

Schneider Electric Korea
ABB Korea
Hyundai Elevator
Daelim Industrial
Naviworks
Hanwha Techwin
Carrier Korea
Daikin Korea
LG Electronics
Azbil Corporation
Yokogawa Electric
KMC Controls
Distech Controls
Delta Controls
Ecosys Korea

Recent Developments

FEBRUARY 2025

Building owner appoints independent commissioning agent for tower

A Korean commercial property owner appointed an owner-side commissioning agent for a capital region office tower, separating functional verification from the main construction contract that had previously absorbed it. The appointment was a procurement decision rather than any joint venture, acquisition, or partnership with an automation supplier.
Signal: Owners are taking verification out of a contractual chain that never delivered it in the first place.
MAY 2025

Retro-commissioning study finds simultaneous heating and cooling

An analytics study across several Seoul office buildings identified air handling units heating and cooling the same air stream continuously since handover, faults present for years without detection. The study was an owner-commissioned analysis rather than any warranty claim, regulatory action, or dispute with the original installer.
Signal: Faults persist for years because nobody in the chain is obliged to look after a handover.
AUGUST 2025

Data centre operator specifies functional verification in contract

A Korean data centre operator wrote functional commissioning and measured performance acceptance into its building controls contract, rather than accepting handover on installation completion alone. The specification was a contract term rather than any joint venture, acquisition, or arrangement with the automation supplier involved. Acceptance testing preceded final payment.
Signal: Customers who pay for outage risk buy the verification that commercial owners decline from their own budgets.

Controllers, Field Devices and Engineering

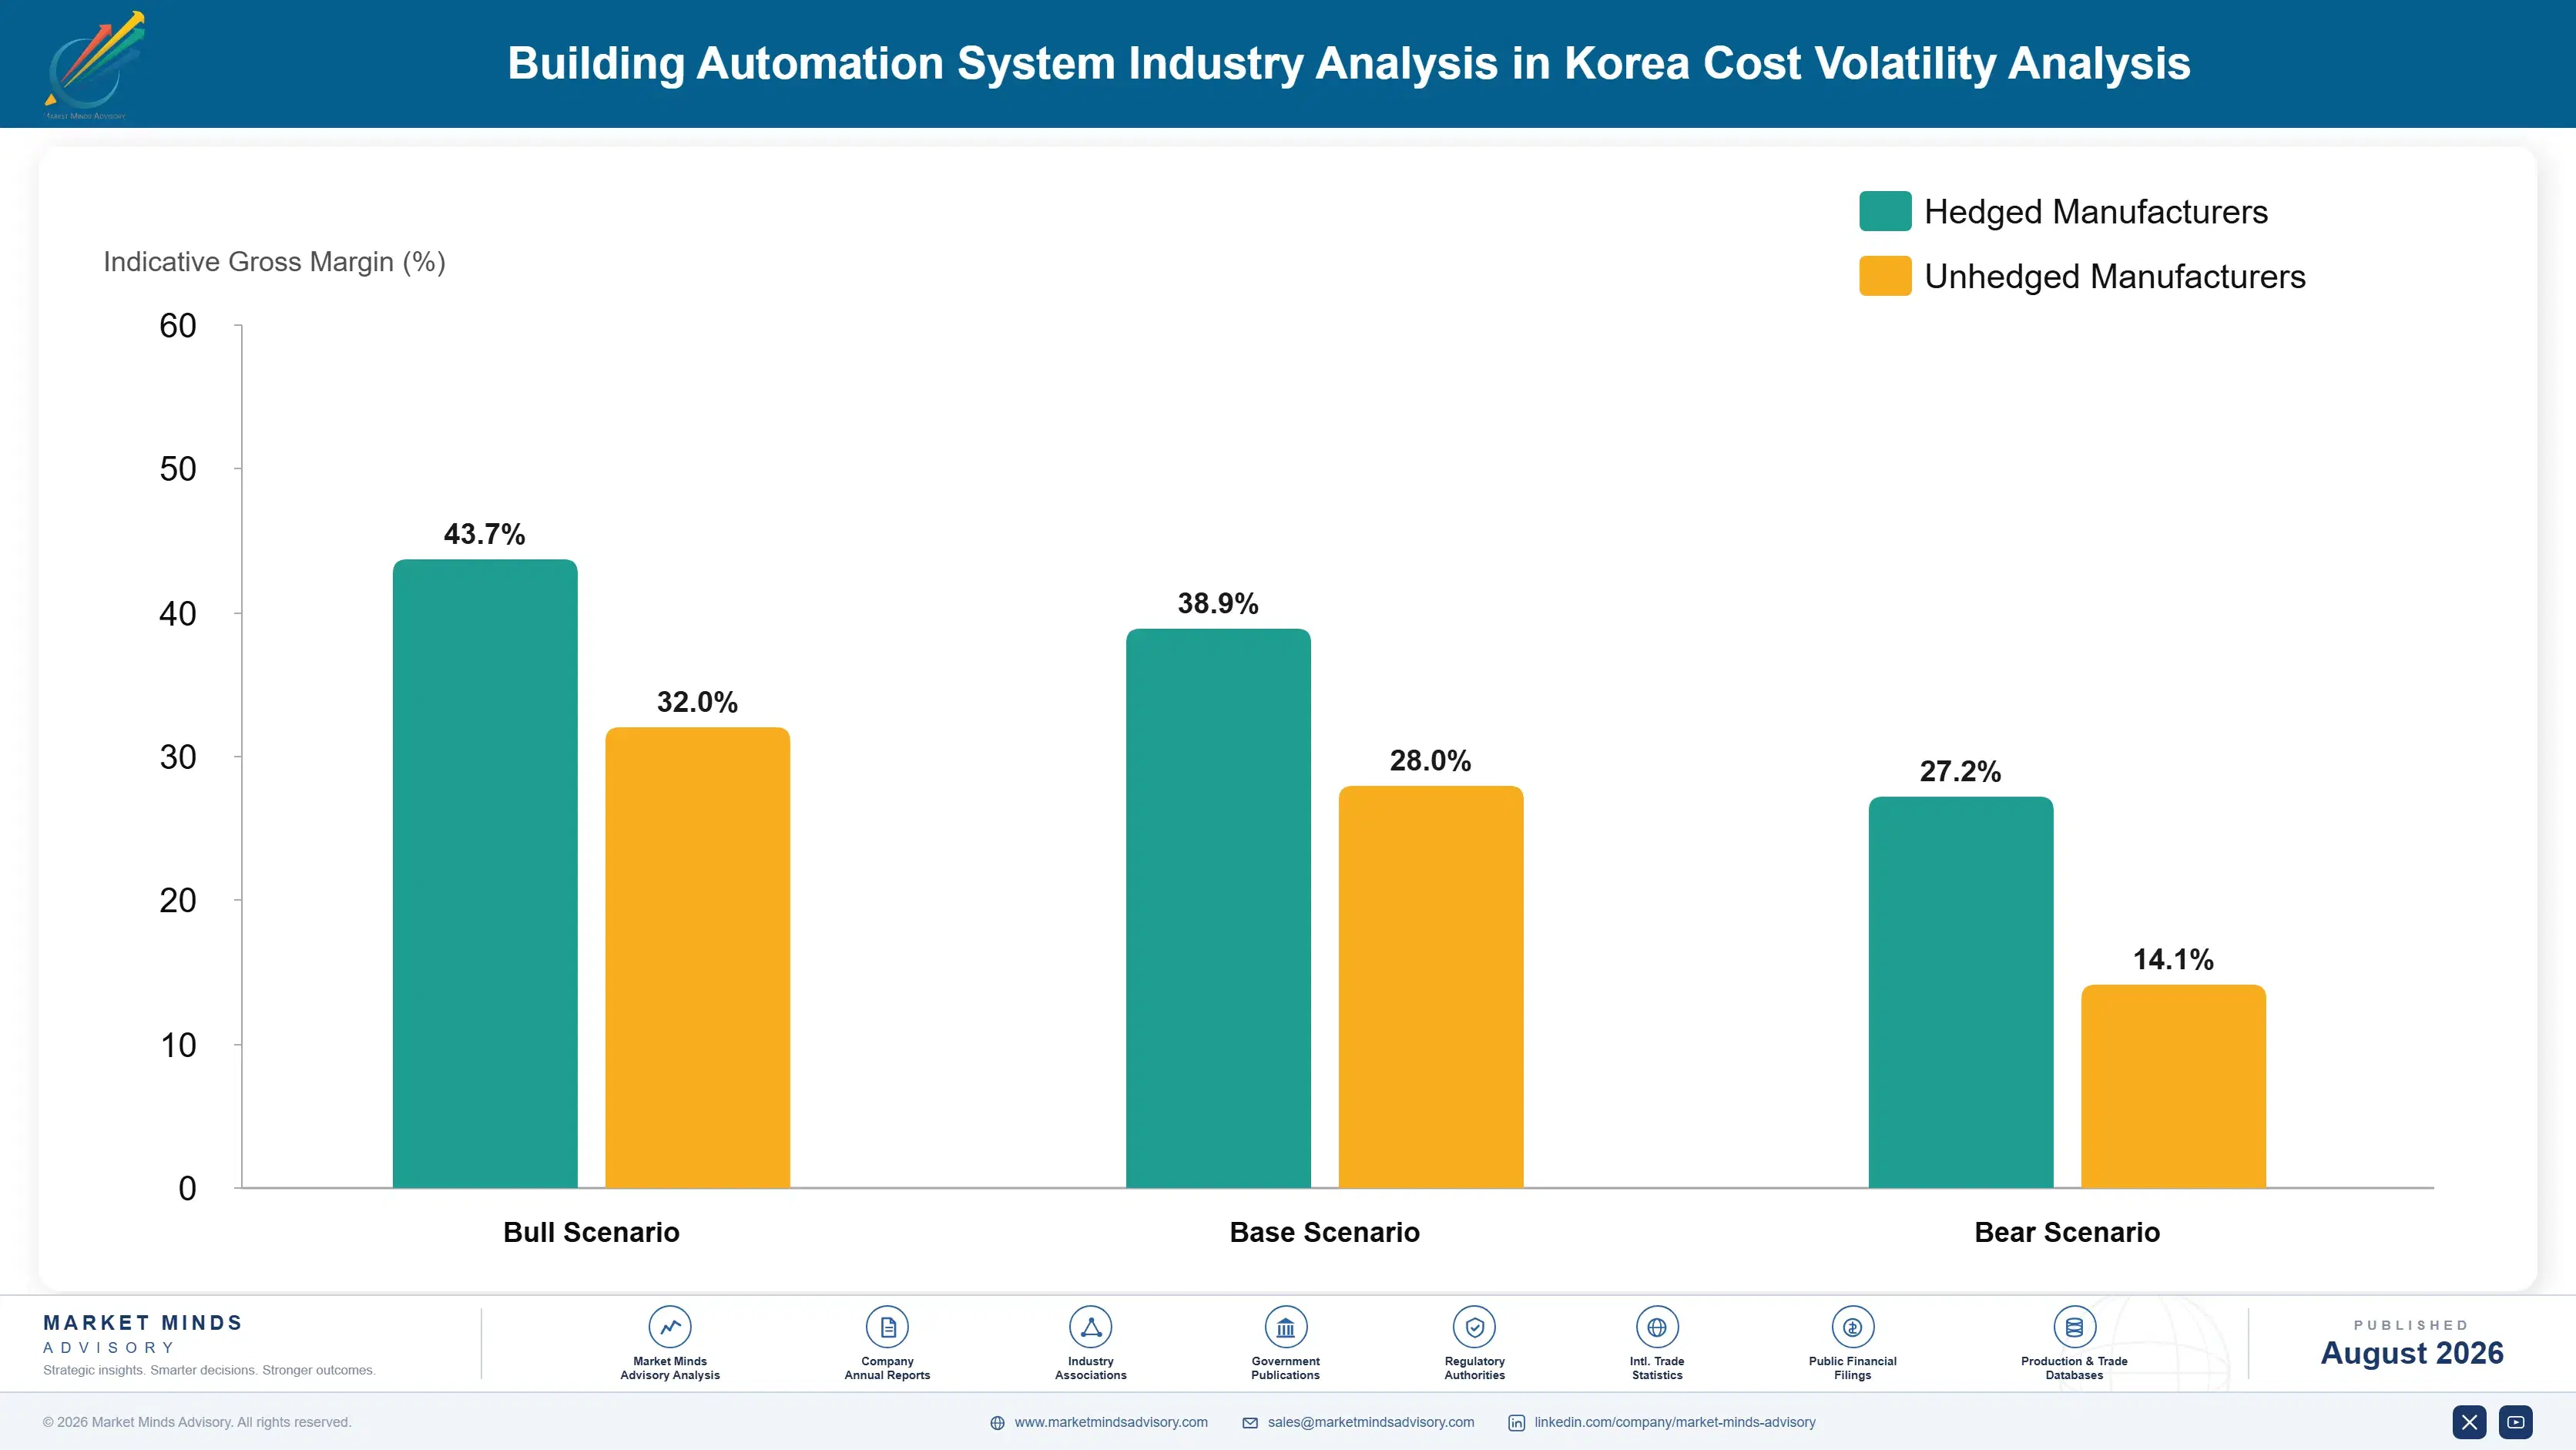
Controllers and supervisory hardware carry roughly 26% of installed system cost, field devices including sensors, valves, and actuators about 24%, engineering and configuration labour near 28%, software licensing around 12%, and cabling, panels, and commissioning the balance. Engineering labour is the largest single input and it is domestic, which makes Korean wage movement more consequential than any equipment sourcing decision.
Semiconductor allocation through 2021 and 2022 constrained controller and sensor availability across the sector, and several automation suppliers disclosed extended lead times and project delays in annual filings covering those years. Component supply has normalised. Korean engineering wages then rose persistently through the recovery and have not retreated, which now represents the larger and more durable cost pressure on integrators and contractors alike. Wage pressure shows no sign of easing.

The competitive disadvantage mechanism runs through engineering productivity rather than through equipment purchasing. Configuration labour is roughly 28% of installed cost and varies enormously between integrators depending on library reuse, standard sequences, and toolchain quality. An integrator rebuilding sequences from scratch on every project pays far more for identical outcomes, and that gap widens as wages rise rather than narrowing with volume.
building-automation-system-industry-analysis-in-ko-cost-volatility-analysis-1787301059544

Build reusable sequence libraries rather than configuring fresh

Engineering and configuration labour is roughly 28% of installed system cost and rises with Korean wages every single year, so productivity in that work matters considerably more than equipment sourcing does. Integrators maintaining tested sequence libraries deploy them across projects at a fraction of the effort. Building that library costs unbillable engineering time upfront.

Standardise on open protocols to widen device sourcing

Proprietary field device lock-in removes any ability to substitute lower-cost sensors, valves, and actuators that carry about 24% of installed cost. Open protocol platforms let an integrator source competitively at the device layer while retaining the supervisory platform. Owners increasingly require it anyway to avoid lock-in, so the commercial and technical arguments now point in the same direction.

Sell commissioning as scope rather than absorbing it

Functional verification costs about 4% of installed system value and is routinely absorbed by contractors as a goodwill activity when budgets tighten, which is precisely why roughly 63% of sequences go unverified. Pricing it as explicit scope makes it visible, defensible, and deliverable. Owners decline it more often than they should, and the ones who accept get buildings that work.

Portfolio Architecture for Margin Defence

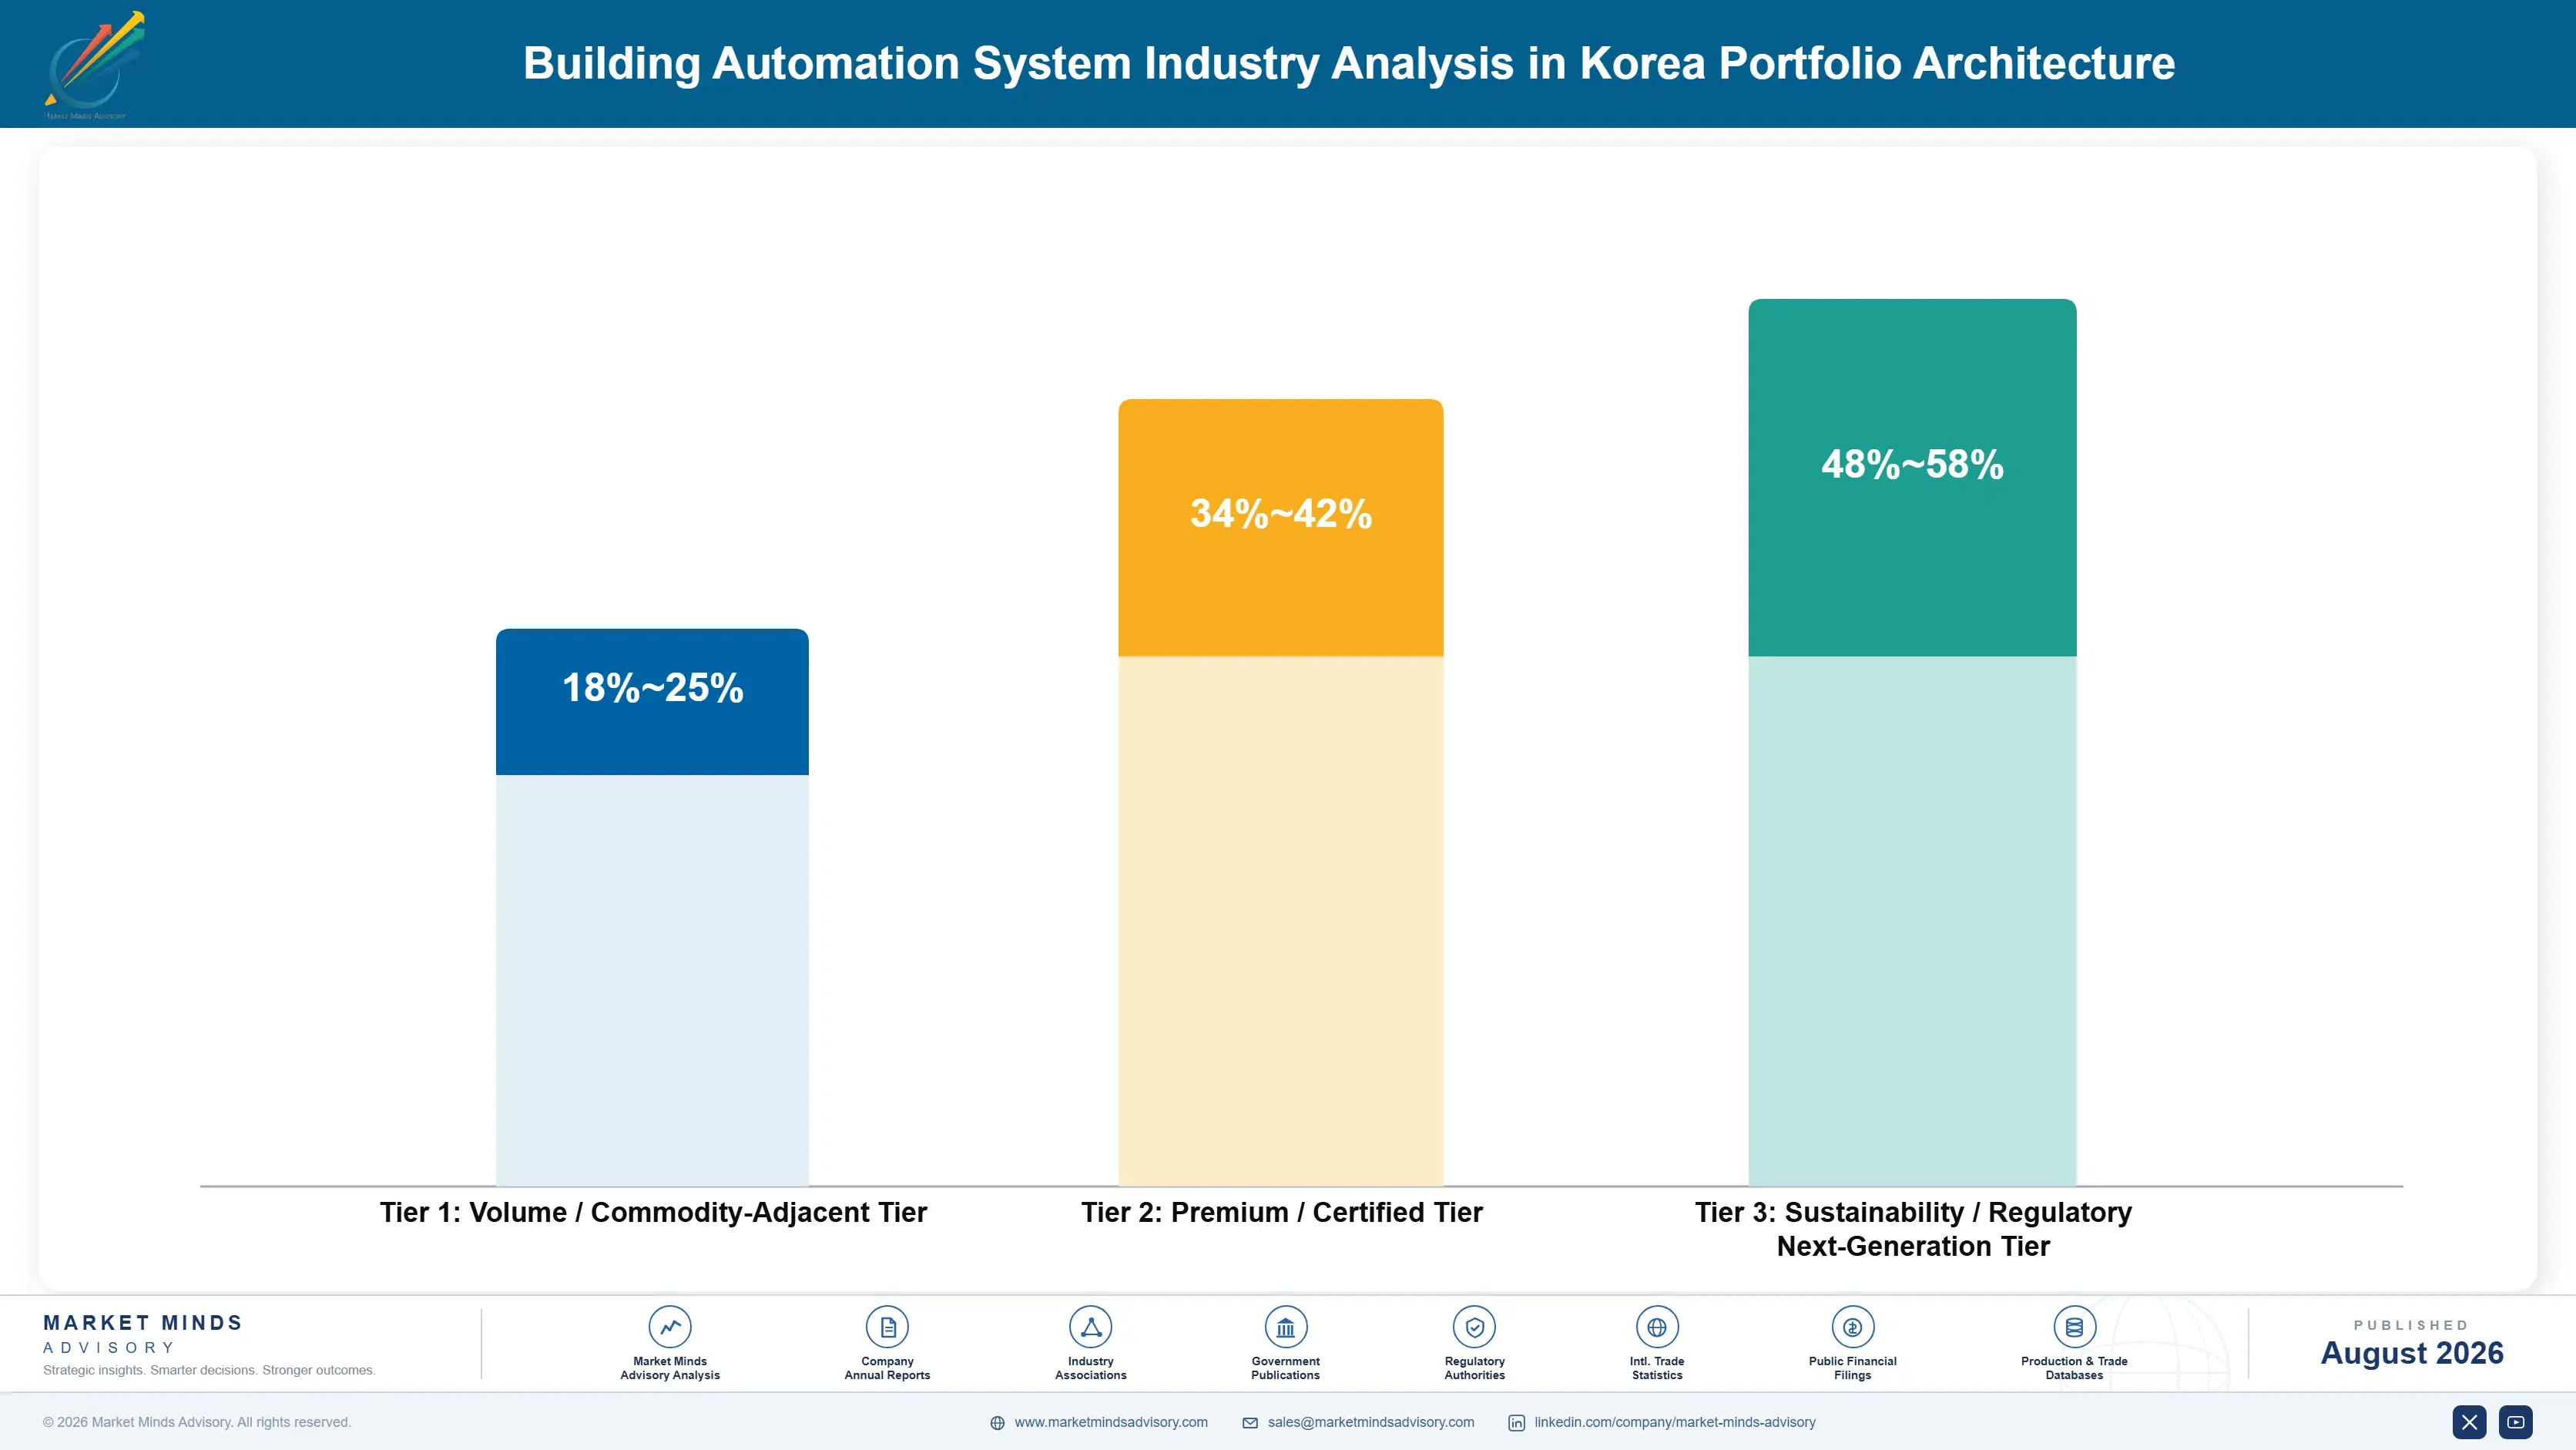
Three tiers describe this business and the spread follows engineering content rather than equipment value. Field devices and cabling sit at the bottom, competing on price where open protocols let an integrator substitute freely. Controllers and supervisory platforms occupy the middle, protected by installed base and configuration effort. Analytics, commissioning, and optimisation services sit at the top, priced on measured outcomes rather than on any hardware bill.
The tension is that hardware wins the project and services carry the margin. An integrator competing on installed cost to secure a development award earns very little on the work itself and holds a relationship worth something only if it converts into ongoing service. Those leading with services struggle to reach projects at all, because building controls are specified inside construction packages rather than tendered independently.

High-value pools concentrate where failure carries consequences beyond comfort. Data centre cooling control is the clearest case, since a control fault damages equipment and interrupts service rather than producing a complaint. Analytics contracts pool value similarly, because accumulated baseline data is difficult for any competitor to reproduce. Both positions sit outside the construction procurement contest entirely.

Volume / Commodity-Adjacent Tier

Field devices, sensors, valves, actuators, and cabling carrying roughly 24% of installed cost, competing on price where open protocols allow free substitution. Korean and Chinese manufacturing has compressed pricing across this layer considerably.
Gross Margin: 18-25%

Premium / Certified Tier

Controllers, supervisory platforms, and software licensing, protected by installed base and by the configuration effort required to replace them. Positions persist across a fourteen-year replacement cycle in a way field equipment simply does not.
Gross Margin: 34-42%

Sustainability / Regulatory / Next-Generation Tier

Analytics, retro-commissioning, and measured performance optimisation services priced on outcomes rather than equipment. Best margin by a clear distance, and the only category addressing the roughly 22% gap between designed and actual building performance.
Gross Margin: 48-58%
building-automation-system-industry-analysis-in-ko-portfolio-architecture-1787301060044

High-value Sub-segments and Strategic Watch-out

Analytics And Retro-Commissioning Services

Fastest growth at 11.7%, exactly 1.50 times the market rate, addressing the roughly 63% of sequences never verified against design. Payback typically arrives inside two years, which is faster than any equipment replacement can offer an owner. Accumulated baseline trend data makes these relationships unusually sticky.
Gross Margin: 48-58%

Data Centre Control Systems

High value and growing quickly, because cooling control failure damages equipment and interrupts service rather than producing comfort complaints. These customers actually pay for functional verification instead of cutting it from the project budget. Specification levels here exceed commercial buildings considerably. Capital region and Busan construction both continue.
Gross Margin: 48-58%

Field Device And Cabling Volume

The volume core, competing on price where open protocol adoption lets integrators substitute devices freely across suppliers. Korean and Chinese manufacturing has compressed pricing here considerably and continues to do so each year. Open protocol adoption removes the substitution obstacle entirely. Margin here is under continuous pressure.
Gross Margin: 18-25%

Unverified Installed Base Exposure

The strategic watch-out, since roughly 63% of installed sequences were never functionally tested and disclosure now publishes measured consumption. Owners discovering a 22% gap ask who configured the system rather than who supplied it. Configuration accountability sits with integrators who carry no brand at all.
Gross Margin: 34-42%

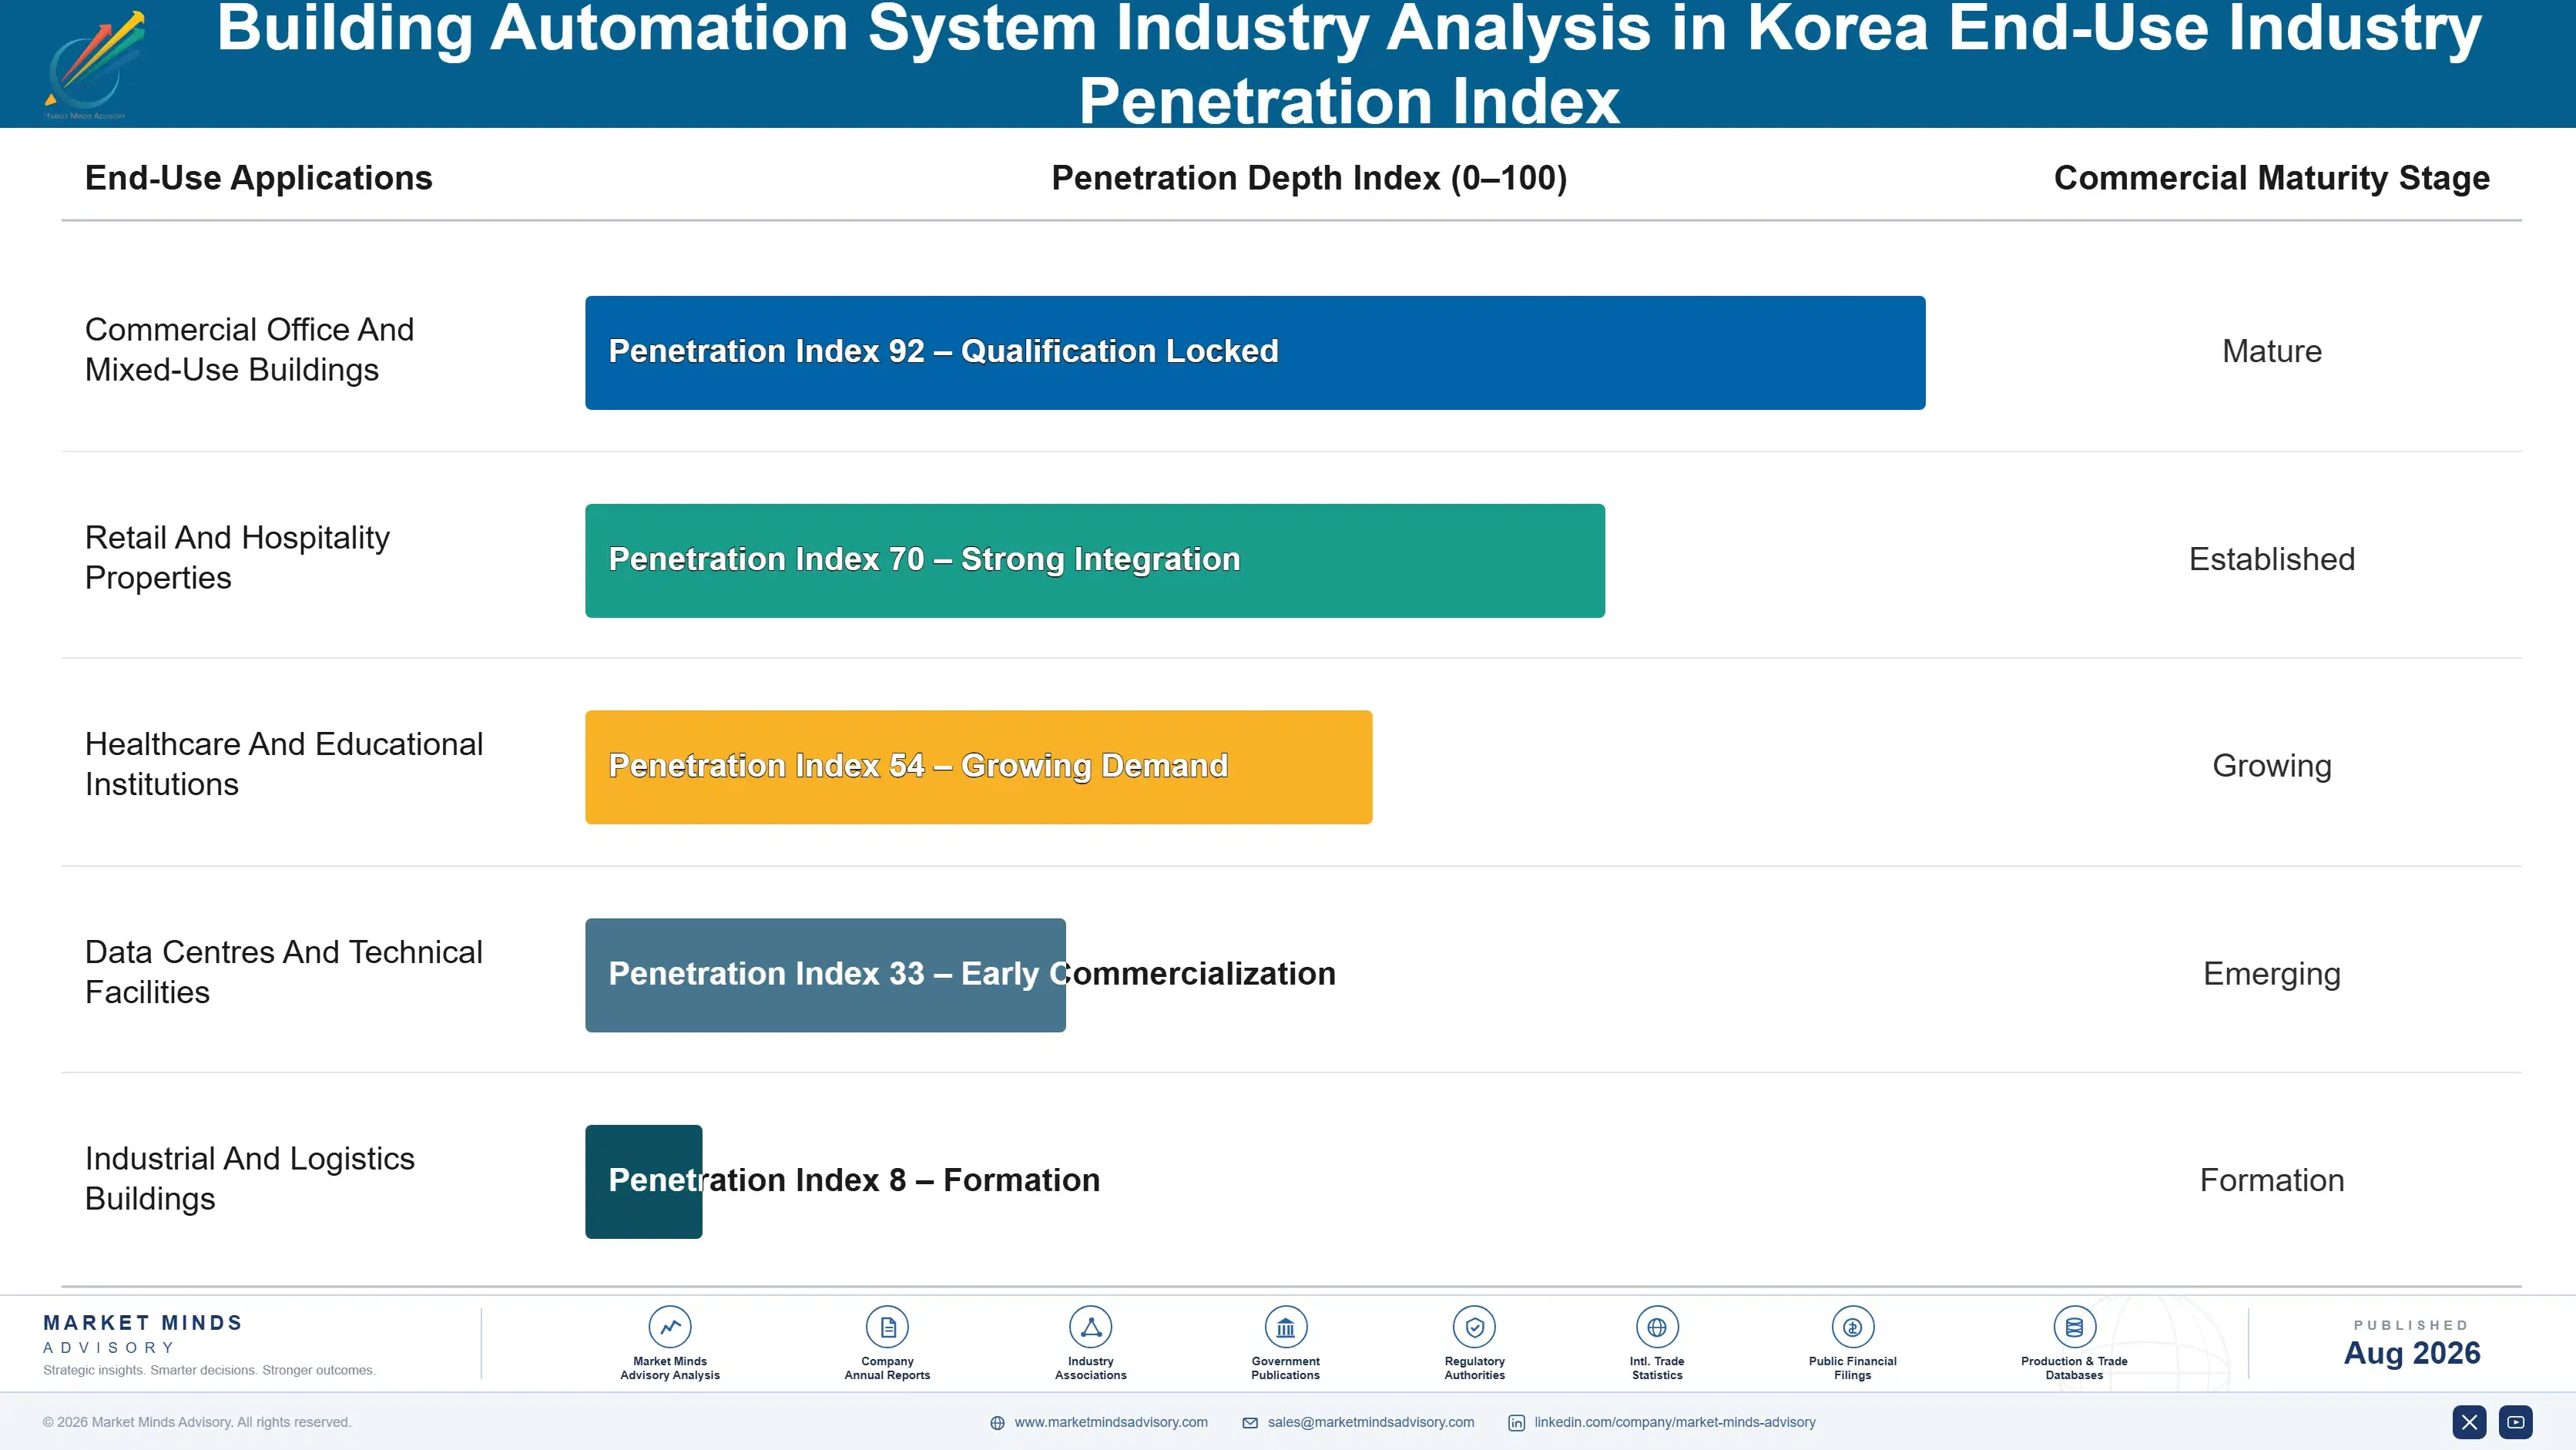
Projects, Cycles and Contracts

Revenue arrives as a project and then goes quiet for more than a decade, since control systems run around fourteen years between replacements and generate very little in between. That pattern makes the installation award disproportionately valuable and explains why construction relationships matter more here than product capability does. Ongoing analytics contracts are the only mechanism that converts a long silence into recurring income.
Stickiness follows configuration effort rather than customer preference. Replacing a supervisory platform means rebuilding every control sequence, regraphing every screen, and retraining the operating staff, which no owner undertakes for a modest saving. Field devices stick hardly at all under open protocols and are substituted routinely at maintenance. Analytics contracts sit in between, defended by accumulated baseline data that a new provider cannot reproduce.

Buyer profiles shifted as energy disclosure made measured consumption public. The earlier decision sat with a construction project manager comparing installed cost. It increasingly involves an asset manager comparing measured performance against leasing position, and asking questions that specification documents were never written to answer. Leasing position rather than construction cost is increasingly what frames the conversation. Specification documents were never written to answer those questions at all.
building-automation-system-industry-analysis-in-ko-end-use-penetration-index-1787301060540

What We Would Tell a Board

These are among the four positions where our research anticipates prominent divergence between winners and laggards over the coming forecast period. Each is grounded in the demand model, the regulatory perimeter, and the announced capacity pipeline.
01 / MEASURED PERFORMANCE SELLING

Sell what the building does, not what it contains

Korean commercial buildings run roughly 22% above their modelled design energy consumption because roughly 63% of installed control sequences were never once functionally verified against the design intent at all. No equipment specification anywhere addresses that gap, and no product comparison between competing vendors settles it either. A supplier offering measured performance against an agreed baseline is selling exactly the thing the owner actually wanted and never received, and retro-commissioning work of this kind typically pays back inside two years.
02 / RECURRING CONTRACT CONVERSION

A fourteen-year silence is not a customer relationship

Control system replacement in Korea recurs only around every fourteen years, so an installation relationship goes quiet for more than a decade while some other party earns the maintenance and optimisation revenue throughout that period. Ongoing analytics contracts create recurring income alongside a standing obligation to find faults, which is precisely what the current Korean contractual structure lacks. Conversion costs engineering time rather than capital investment, and it keeps a supplier present and informed when the replacement decision eventually arrives.
03 / OBSOLESCENCE DEMAND TARGETING

Chase the dead controllers, not the energy business case

Retrofit driven by unsupported controllers and by unavailable spare parts proceeds regardless of any energy argument at all, and a substantial share of Seoul commercial stock built two decades ago has now reached exactly that point. Efficiency arguments compete for capital against envelope and safety work that cannot be deferred, and they usually lose that contest. Obsolescence-driven replacement is far more reliable as a demand base, and it opens the door to selling commissioning and analytics alongside a project already funded.
04 / COMMISSIONING CAPABILITY READINESS

Build the verification capability before the code requires it

Functional commissioning currently costs about 4% of installed system value and remains entirely discretionary, which is exactly why it is the first thing to disappear whenever a Korean project runs over its budget. Code requirements making functional verification mandatory would convert that discretionary work into a required line item across every project simultaneously and largely without warning. Suppliers already holding trained commissioning agents and documented procedures beforehand would capture that volume, while those building the capability afterward compete against established references.

Engagement Snapshot From the Field

A live engagement with an industry participant carrying material or product regulatory and market exposure ahead of a defining policy shift, showing how our research translates into a defensible multi-year portfolio strategy.
MARKET MINDS ADVISORY · CLIENT ENGAGEMENT SUMMARY
Building Automation System Industry Analysis in Korea Producer Strategic Portfolio Review and Transition Roadmap 2026·Investment Scenario on Building Automation System Industry Analysis in Korea Exposure Evaluation 2025-26
CLIENT PROFILE
A Korean building systems integrator with approximately 88 million dollars in annual revenue (client-reported, unverified by MMA), installing control systems across commercial and institutional projects in the capital region under main contracts held by construction groups. Revenue was almost entirely project-based, service income was minimal, and gross margin had declined for three consecutive years despite stable project volume.
STRATEGIC CHALLENGE
Management attributed the margin decline to competitive bidding pressure from smaller integrators and proposed reducing engineering headcount to lower cost. The board wanted an independent read on where margin was actually being lost before cutting the capability that delivers the work. Engineering hours had never been analysed by project. Reuse across projects was unmeasured.
MMA APPROACH
We decomposed project margin across three years, separating equipment cost movement from engineering hours consumed and from bid price erosion. Engineering time was analysed by project against reuse of existing sequences and graphics. Completed installations were reviewed for commissioning scope delivered against scope priced, and comparable analytics service economics were benchmarked externally.
KEY FINDINGS
  1. Engineering hours per project had risen substantially over the period while project scope had not, and sequence and graphics reuse across projects was close to zero.
  2. Bid price erosion was real but explained a considerably smaller share of the margin decline than the engineering hours consumed on each project.
  3. Commissioning work was being performed on most projects without being priced, absorbed as goodwill when construction schedules compressed. Nobody had priced it separately.
  4. Analytics service contracts among comparable providers carried gross margins far above the client's installation business on customers it already served. Recurring revenue was effectively absent.
CLIENT PROFILE
A Korean building systems integrator with approximately 88 million dollars in annual revenue (client-reported, unverified by MMA), installing control systems across commercial and institutional projects in the capital region under main contracts held by construction groups. Revenue was almost entirely project-based, service income was minimal, and gross margin had declined for three consecutive years despite stable project volume.
STRATEGIC CHALLENGE
Management attributed the margin decline to competitive bidding pressure from smaller integrators and proposed reducing engineering headcount to lower cost. The board wanted an independent read on where margin was actually being lost before cutting the capability that delivers the work. Engineering hours had never been analysed by project. Reuse across projects was unmeasured.
MMA APPROACH
We decomposed project margin across three years, separating equipment cost movement from engineering hours consumed and from bid price erosion. Engineering time was analysed by project against reuse of existing sequences and graphics. Completed installations were reviewed for commissioning scope delivered against scope priced, and comparable analytics service economics were benchmarked externally.
KEY FINDINGS
  1. Engineering hours per project had risen substantially over the period while project scope had not, and sequence and graphics reuse across projects was close to zero.
  2. Bid price erosion was real but explained a considerably smaller share of the margin decline than the engineering hours consumed on each project.
  3. Commissioning work was being performed on most projects without being priced, absorbed as goodwill when construction schedules compressed. Nobody had priced it separately.
  4. Analytics service contracts among comparable providers carried gross margins far above the client's installation business on customers it already served. Recurring revenue was effectively absent.
RECOMMENDED STRATEGY
Phase 1: Phase 1 (months one to nine): halt the headcount reduction, build tested sequence and graphics libraries for reuse across future projects. Phase 2: Phase 2 (months nine to twenty-one): price commissioning as explicit scope on every bid rather than absorbing it into project overhead. Phase 3: Phase 3 (months twenty-one to thirty-six): launch analytics service contracts into the existing installed base as recurring revenue. across the capital region.
OUTCOME
The headcount reduction was cancelled. Sequence library reuse cut engineering hours per project materially within three quarters, commissioning appeared as priced scope on a majority of new bids, and the first analytics service contracts were signed with existing customers (client-reported, unverified by MMA). Margin recovery began within the same year.

Frequently Asked Questions

Foundational context covering the market sizes, CAGR, scope, country, region and competition that inform every finding below. This section is provided to cover basics and most often pre-purchase conversations, answered from the MMA Primary Research Dataset.

What is the current size of the Building Automation System market in Korea?

The market is valued at USD 2.1 billion in 2025, rising to USD 2.26 billion in 2026. Scope covers commercial, institutional, and industrial building controls, not residential smart home products or process control.

How large will the Korean Building Automation System market be by 2036?

MMA forecasts USD 4.79 billion by 2036, an increase of USD 2.53 billion over the 2026 base. That represents an expansion multiple of 2.12 times across the forecast period.

What is the CAGR for the Korean Building Automation System market 2026 to 2036?

The base case CAGR is 7.8%, with a bull case of 9.0% and a bear case of 6.6%. The historical rate from 2020 to 2025 was 6.6%, driven by new construction rather than retrofit.

Which segment is growing fastest?

Analytics, commissioning, and optimisation services at 11.7%, exactly 1.50 times the market rate. They address the roughly 22% gap between modelled design and measured building energy consumption.

Who are the major companies in the Korean Building Automation System market?

Samsung C&T, LS Electric, Siemens Korea, Honeywell Korea, and Johnson Controls Korea lead on installed control points. The top five hold 47%, across global vendors, conglomerate affiliates, and integrators.

Which country is growing fastest?

South Korea at 7.8%, which is nominal since this report covers a single national market. Growth varies far more by building type and by system function than by location within Korea.

Report Segmentation Architecture

The full report scope spans multiple orthogonal segmentation dimensions, with cross-tabulated demand data provided for each dimension pair. Coverage extends further to regional breakdowns, trend trajectories, and the competitive detail needed to support segment-level decision-making.

By System Function And Delivery Type

  • Heating, Ventilation And Air Conditioning Control
  • Lighting And Shading Control Systems
  • Energy Metering And Submetering Systems
  • Integrated Security And Access Control
  • Analytics, Commissioning And Optimisation Services

By End-Use Industry

  • Commercial Office And Mixed-Use Buildings
  • Retail And Hospitality Properties
  • Healthcare And Educational Institutions
  • Data Centres And Technical Facilities
  • Industrial And Logistics Buildings

By Commercial Model

  • Specified Within Main Construction Contract
  • Direct Owner Retrofit Procurement
  • Ongoing Analytics And Service Contracts
  • Energy Performance Contracting Arrangements
  • Maintenance And Spare Parts Supply

By Region

  • East Asia
  • North America
  • Western Europe
  • South Asia and Pacific
  • Eastern Europe
  • Latin America
  • Middle East and Africa

Scope, Methodology, and Coverage

Every figure in this report is reproducible from documented input assumptions. The scope below maps the historical period, the forecast horizon, the segmentation dimensions, and the countries covered, alongside the underlying primary and qualitative methodology.
Historical Period
2020 to 2025
Forecast Period
2026 to 2036
Base Year
2025 (USD billions; MMA Primary Research Dataset, August 2026)
Market Definition
This market comprises building automation and control systems installed and serviced in commercial, institutional, and industrial buildings located within South Korea, measured at delivered system and service revenue including equipment, engineering, and configuration labour. Coverage spans heating, ventilation and air conditioning control systems, lighting and shading control, energy metering and submetering systems, integrated security and access control connected to building management platforms, and analytics, commissioning and optimisation services. Residential smart home products, process control systems within manufacturing plants, district heating and cooling network infrastructure, construction electrical installation, elevator control supplied with elevators, and standalone fire alarm systems fall outside scope.
Quantitative Units
USD billions (current prices); installed control points; measured against modelled energy consumption; engineering hours per installed point
Segmentation Dimensions
By System Function And Delivery Type; By End-Use Industry; By Commercial Model; By Region
Regions Covered
East Asia, North America, Western Europe, South Asia and Pacific, Eastern Europe, Latin America, Middle East and Africa
Countries Covered
South Korea, with technology origin coverage across Japan, China, Taiwan, United States, Canada, Germany, Switzerland, France, Netherlands, Sweden, India, Australia, Poland, Czechia, Brazil, Mexico, Israel, and additional origins relevant to this sector
Key Companies Profiled
Samsung C&T, LS Electric, Siemens Korea, Honeywell Korea, Johnson Controls Korea, Schneider Electric Korea, ABB Korea, Hyundai Elevator, Daelim Industrial, Naviworks, Hanwha Techwin, Carrier Korea, Daikin Korea, LG Electronics, Azbil Corporation, Yokogawa Electric, KMC Controls, Distech Controls, Delta Controls, Ecosys Korea
Quantitative Methodology
Primary survey, n=3,800 respondents, Q4 2025, six countries; demand-side model with trade association cross-validation
Qualitative Methodology
47 expert interviews, Q4 2025; applied to validate demand model assumptions, identify emerging dynamics, and assess competitive positioning
Report Format
PDF and XLSX data workbook (Word format preview document)
Publisher
Market Minds Advisory
Report Code
MMA-2026-TEC-637
Published
August 2026
Contact
sales@marketmindsadvisory.com | www.marketmindsadvisory.com

Purchase the full Building Automation System Industry Analysis in Korea Report (2026 to 2036).

The full report sizes Korean building automation across five system functions, five end-use industries, five commercial models, and the domestic market in detail, with technology origin mapped across supplying countries. Measured energy consumption is reconciled against modelled design across the commercial building stock, since that gap describes this market more honestly than installed capacity does. Commissioning scope priced is compared against commissioning scope delivered. Competitive profiling covers twenty companies on installed control points, engineering hours per point are benchmarked across integrators, and obsolescence-driven retrofit demand is separated from efficiency-driven demand throughout.
Measured consumption reconciled against modelled design performance
Commissioning scope priced compared against scope actually delivered
Engineering hours per installed point benchmarked across integrators
Analytics service economics compared against installation project margins
Obsolescence-driven retrofit demand separated from efficiency-driven demand
Open protocol adoption tracked against field device sourcing flexibility

Built For The People Who Decide

From boardroom strategy to bench-side execution, this report is read cover-to-cover by leaders shaping the next decade of their industry, turning demand scenarios, market dynamics and valuation benchmarks into decisions.
CXOs/ Presidents/ VPs/ Managers
M&A and Corporate Development
Strategy Teams and R&D Heads
Procurement and Product Directors
Regulatory and Compliance Leaders
Investor Relations and Equity Analysts