Market Minds Advisory
Buffering & Neutralizing Agents Market

Buffering & Neutralizing Agents Market: Buffering and Neutralizing Agents Market: The Cheapest Line On The Formulation, The Failures Nobody Attributes To It and A Phosphate Exit Without A Drop-In, 2026 to 2036

Buffers are around 1.4% of formulation cost and cause failures worth many multiples of that. Only 11% of stability failures get traced back to buffer capacity loss, and phosphate is leaving without a drop-in replacement.

Lead Analyst

Published

September 2026

Make Smarter Decisions with Customized Research Insights

Request a free sample report and evaluate market opportunities, growth trends, and competitive dynamics relevant to your business needs.

2025 MARKET VALUE$4.6BMarket Size 2025
2036 FORECAST VALUE$8.1BBase Case , 2026 to 2036
CAGR 2026 TO 20365.4 %Bull 6.6% / Bear 4.2%
INCREMENTAL OPPORTUNITY$3.3BNet 10- year value creation
EXPANSION MULTIPLE1.69x2036 value over 2026 base
Strategic Levers
M&A Pipeline
Regional Outlook
Country Rankings
Competitive Intelligence
Segmental Deep-dive
Call-Us : 91 93563 13602

Executive Snapshot and Market Trajectory.

Buffers run around 1.4% of formulation cost and cause failures worth many multiples of that. Only about 11% of stability failures are correctly traced back to buffer capacity loss. The rest get blamed on the active, the packaging, or the preservative. Nobody measures capacity because nobody asks.
Amino alcohol neutralizers grow at 8.1%, half again the market rate of 5.4%, on a decade-long personal care substitution away from older amine chemistry that is now roughly 68% complete. Citrate buffer systems follow at 7.2% as phosphate exits under environmental and dietary pressure. Phosphate buffers grow at 2.9%, slowest of anything covered here. Alkali hydroxide neutralizers track water discharge permits rather than production economics.
East Asia holds 30% of demand across food, personal care, and water treatment formulation. About 27% of category volume still uses phosphate chemistry with no clean drop-in available, since citrate buffers cover a narrower effective range and cost more per unit of capacity. And 61% of specifications name a concentration without stating the buffer capacity required. Those are different properties, and a formulation can hold exactly the right pH with almost no capacity.
Market Definition
This market covers buffering and neutralizing agents used to establish and hold pH in food and beverage, personal care, pharmaceutical, water treatment, and industrial process formulations, including phosphate buffer systems, citrate buffer systems, carbonate and bicarbonate systems, lactate and acetate buffer systems, amino alcohol neutralizers, and alkali hydroxide neutralizers. It excludes chelating and sequestering agents, preservatives, acidulants used for flavour rather than pH control, and pH measurement instrumentation.
Base Year Value
$4.6B in 2025 (MMA Primary Research Dataset, September 2026)
Forecast Period
2026 to 2036, eleven discrete annual values
CAGR
5.4% base case. Bull 6.6%. Bear 4.2%.
Fastest Growth Segment
Amino Alcohol Neutralizers: 8.1% CAGR
Fastest Growth Country
Indonesia: 9.3% CAGR
Fastest Growth Region
South Asia and Pacific: 7.4% CAGR
Largest Region
East Asia: 30% of 2025 global value
Market Leaders
BASF, Dow, Solvay, Innophos, and Jungbunzlauer lead the field. Source: MMA Primary Research Dataset, July 2026.
Primary Survey
n=3,800 procurement and R&D decision-makers, Q4 2025, six countries
Methodology
Demand-side build-up, cross-validated against public data, 47 expert interviews

Buffering & Neutralizing Agents Market Forecast Scenarios

buffering-and-neutralizing-agents-market-size-forecast-scenario-1790016696315
Growth from 2020 to 2025 ran at 4.6% and its composition shifted more than its rate. Phosphate volumes declined in Western markets under eutrophication rules and dietary phosphate scrutiny, while citrate and amino alcohol volumes absorbed the substitution. Asian processed food and personal care manufacture expanded steadily throughout the period and carried most of the absolute volume growth.
The base case at 5.4% rests on three mechanisms. Asian processed food and personal care manufacture keeps adding formulation volume, with Indonesian growth at 9.3% leading every country covered. Personal care substitution away from older amine neutralizers continues from roughly 68% complete toward saturation. And water treatment demand rises as municipal and industrial discharge limits tighten across most regulated markets. None of the three assumes formulators change how they write specifications, which would move considerably more value than any of them.
The bull case at 6.6% depends on formulators starting to specify buffer capacity rather than concentration, which would move a large share of volume toward higher value engineered systems. The bear case at 4.2% is substitution economics: if citrate and lactate pricing rises faster than phosphate regulation tightens, formulators will hold phosphate positions longer than current projections assume.

The Cheapest Thing That Breaks Everything

A buffer is about 1.4% of what a formulation costs and it decides whether the rest of it survives to the end of its stated shelf life. pH drift breaks emulsions, deactivates preservative systems, degrades actives, and corrodes packaging. When that happens the investigation almost always lands somewhere else: about 11% of stability failures get correctly attributed to buffer capacity loss, and the rest are recorded against whatever was most visible.
TOP FIVE CONCENTRATION34%Share of category revenue held by the leading suppliers
FORMULATION COST SHARE1.4%Typical buffer share of a finished formulation's total cost
FAILURE ATTRIBUTION RATE11%Stability failures correctly traced back to buffer capacity loss
PHOSPHATE VOLUME SHARE27%Category volume still using chemistry under environmental and dietary pressure
CAPACITY SPECIFICATION GAP61%Specifications naming concentration without stating the buffer capacity required
AMINE SUBSTITUTION PROGRESS68%Personal care formulations migrated away from older amine neutralizers
The reason is a specification habit. Roughly 61% of specifications name a buffer concentration and a target pH without stating the capacity required, and those are different properties. A formulation can sit at exactly the right pH with almost no capacity to resist a shift, which is fine on day one and not fine after eighteen months of ingredient interaction and temperature cycling. Nobody measures capacity because nobody asked for it.
Meanwhile phosphate is leaving and there is no clean replacement. Around 27% of volume still uses it, held there because citrate covers a narrower effective pH range and costs more per unit of capacity delivered. Eutrophication rules and dietary phosphate scrutiny keep tightening. Formulators choose between a chemistry under pressure and a worse alternative at higher cost.
"This is the cheapest line on almost every formulation sheet and it quietly determines whether the expensive lines above it still work in eighteen months. Nobody gets promoted for specifying the buffer properly, and a great many stability investigations have ended at the wrong ingredient because of it."
Practice Director, Specialty Chemicals and Formulation Systems · MMA Chemicals and Materials Practice · September 2026

Market Trends

Phosphate Exits Without A Clean Replacement Available

Phosphate buffers grow at 2.9%, slowest of the six segments, under eutrophication discharge rules and dietary phosphate scrutiny that keep tightening across regulated markets. About 27% of volume still uses the chemistry, and it stays there because the alternatives are genuinely worse on the two things that matter. Citrate covers a narrower effective pH range and costs more per unit of capacity delivered. Formulators are therefore choosing between regulatory exposure and reduced performance at higher cost, and many are simply deferring the decision until a rule forces it. That deferral is itself a forecastable behaviour.
Market Impact: Country grows at 9.3%

Amine Substitution Reaches Its Final Third

Amino alcohol neutralizers grow at 8.1%, fastest of the six segments, on a personal care substitution away from older amine chemistry that is now roughly 68% complete. The migration has run for over a decade on nitrosamine formation concerns and has been slow because neutralizers sit deep in emulsion systems where any change triggers full stability requalification. The remaining third is concentrated in legacy formulations nobody wants to reopen. That makes the final phase slower per unit of volume than the first two thirds were. Suppliers pricing the tail as commodity are misreading it.
Market Impact: Adds 5.6% regional growth

Market Opportunities and Growth Drivers

Asian Formulation Volume Adds Steadily And Cheaply

Indonesia grows at 9.3%, faster than any country covered, as packaged food and personal care manufacture scales across a large domestic market with rising formal retail penetration. East Asia holds 30% of world demand across food, personal care, and water treatment. Volumes are large and unit prices low, so this is volume growth rather than value growth. Suppliers competing there on commodity phosphate and carbonate grades find local producers hold both cost and proximity, and the margin is correspondingly thin. Suppliers earning there sell pharmaceutical grade documentation and engineered blends rather than tonnage against a certificate.
Market Impact: Covers 61% of specifications

Discharge Limits Pull Water Treatment Demand Upward

Municipal and industrial discharge pH limits keep tightening across regulated markets, and neutralization is the compliance step that cannot be skipped or approximated. Alkali hydroxide and carbonate volumes track that directly, and demand is driven by permit conditions rather than by production economics. This makes water treatment an unusually predictable part of the category. It also means a supplier holding the position rarely loses it on price, because a plant operator changing neutralizer chemistry has to revalidate a discharge permit. Permit revalidation is expensive enough that price alone rarely moves the account.
Market Impact: Only 11% correctly attributed

Market Restraints and Challenges

Specifications Name Concentration Instead Of Buffer Capacity

Around 61% of specifications state a concentration and a target pH without naming the buffer capacity required, and the root cause is that capacity is harder to measure and nobody in the approval chain has historically asked for it. Commercially this caps the category at commodity pricing, because a concentration is a purchasing line and a capacity is a performance requirement. Suppliers respond with capacity measurement services, with formulation stability modelling, and with specification templates that make capacity a stated parameter. None of that works until a customer's own approval chain starts asking the question.
Market Impact: Affects 27% of volume

Failures Get Attributed To The Wrong Ingredient

Only about 11% of stability failures are correctly traced back to buffer capacity loss, and the root cause is that pH drift damages other components which then present as the visible defect. Commercially this is worse than it sounds: a category that never gets credited for preventing failures cannot argue for a higher specification. Suppliers respond by offering root cause investigation support, by publishing accelerated drift data, and by building capacity retention into their technical documentation. Being present during a failure investigation is worth more than any claim made while the product works. Very few are in that room.
Market Impact: Migration is 68% complete
3 additional market trends, 4 additional growth drivers, and 2 additional restraints and challenges are covered in the full report. Contact sales@marketmindsadvisory.com to access the complete intelligence.

Segment CAGR and Growth Architecture

Segmentation follows buffer and neutralizer chemistry class across six categories: phosphate buffer systems, citrate buffer systems, carbonate and bicarbonate systems, lactate and acetate buffer systems, amino alcohol neutralizers, and alkali hydroxide neutralizers. End-use industry, grade specification, and delivery form are treated as separate dimensions rather than folded into this hierarchy. Chelating agents and preservatives fall outside the defined scope entirely.
buffering-and-neutralizing-agents-market-market-share-analysis-1790016696878

Amino Alcohol Neutralizers

Amino alcohol neutralizers grow at 8.1%, half again the market rate of 5.4%, on a personal care substitution away from older amine chemistry now around 68% complete. Aminomethyl propanol and its relatives neutralize carbomer and acrylate thickeners without the nitrosamine formation concerns attached to the chemistry they replaced, and they hold pH in emulsion systems where carbonates are impractical. The migration has been slow because neutralizers sit deep in emulsion architecture and any change triggers full stability requalification. The remaining third sits in legacy formulations nobody wants to reopen, which makes the final phase slower per unit of volume than the earlier ones. Pricing the remaining tail as commodity volume misreads what it costs a customer to change it.
CAGR 8.1%

Citrate Buffer Systems

Citrate systems grow at 7.2% almost entirely on phosphate substitution rather than on any performance advantage of their own. Sodium and potassium citrate buffer effectively between roughly pH three and six, which covers most beverage and many personal care applications but leaves the neutral and mildly alkaline range where phosphate has always been strongest. Cost per unit of capacity delivered runs higher than phosphate, and fermentation feedstock pricing carries agricultural exposure that mineral phosphate does not. Suppliers with fermentation capacity hold a genuine position here. Those buying citric acid on the open market are passing through a cost they cannot control. Blended systems combining citrate with lactate and carbonate cover the gap better than citrate alone.
CAGR 7.2%
Full segment breakdown across 6 segments available in the complete report.

Regional Architecture and Country Demand Map

Regional shares reflect where buffering and neutralizing agents are consumed in formulation and process use rather than where the chemistry is manufactured. One region sits outside the standard bands, for the reason named in its own paragraph and summarised below for operator review. Application mix varies considerably by region.

East Asia

Chinese processed food, personal care, and water treatment consumption together account for the largest single block of demand anywhere, at unit prices that keep regional value below its volume weight. Growth of 6.4% runs above the world rate. Chinese producers hold substantial citrate fermentation and phosphate capacity and set much of the world price floor on commodity grades. Japanese and Korean pharmaceutical and personal care formulation works at the higher value end, specifying buffer capacity more often than any other region. Discharge limits in Chinese industrial zones have tightened materially and pull neutralizer demand with them. Local supply proximity makes the region difficult for Western producers to serve profitably. Documentation depth is the remaining Western advantage.
Share: 30% | CAGR: 6.4% (2026 to 2036)

North America

Pharmaceutical and personal care formulation carry proportionally more of the regional market than food processing does, which lifts average value per tonne well above the world figure. Growth of 4.9% runs a little under the world rate. Environmental Protection Agency discharge rules drive neutralizer demand in industrial water treatment on a compliance basis rather than an economic one. Dietary phosphate scrutiny has moved faster here than in most regions and has accelerated citrate substitution in beverage and processed food formulation. Amino alcohol substitution in personal care is further advanced than the world average. Buffer capacity specification remains rare outside pharmaceutical applications. Suppliers offering capacity measurement find the pharmaceutical conversation easier to start than the food one.
Share: 23% | CAGR: 4.9% (2026 to 2036)
Regional intelligence for 5 additional markets available in the complete report: Western Europe, South Asia and Pacific, Latin America, Middle East and Africa, Eastern Europe. Contact sales@marketmindsadvisory.com.
buffering-and-neutralizing-agents-market-country-cagr-analysis-1790016697425

Where Buffer Suppliers Escape Commodity

Four commercial moves matter in a category priced as a commodity and specified as an afterthought. Each addresses the same underlying problem from a different angle: the buffer is cheap, it is invisible, it is blamed for nothing, and the chemistry under most pressure has no clean replacement waiting. None of the four requires new chemistry to be developed.

Make Buffer Capacity A Specified Parameter

Around 61% of specifications name a concentration and a target pH without stating required capacity, which keeps the whole category on purchasing terms. Suppliers providing capacity measurement and writing it into specification templates report price realisation 2.2 times higher on the same chemistry. Nothing about the molecule changes. What changes is that the line moves from a purchasing decision reviewed annually to a performance requirement that requalification cost protects. The measurement itself is straightforward and cheap to run. What it needs is a customer approval chain willing to ask the question.
Market Impact: Raises achieved price realisation to 2.2 times higher

Own The Stability Failure Investigation Process

Only about 11% of stability failures are correctly traced to buffer capacity loss, so the category gets no credit for the failures it prevents. Suppliers offering root cause investigation support and publishing accelerated pH drift data report specification upgrades in 3.4 times more accounts than those supplying to specification alone. Being present when a formulation fails is worth more than any technical claim made when it is working. Most suppliers are simply not in the room. Publishing accelerated drift data is the cheapest way in, giving technical teams something to check against.
Market Impact: Wins specification upgrades in 3.4 times more accounts

Engineer The Phosphate Replacement Rather Than Substitute

About 27% of volume sits on phosphate under regulatory pressure, and citrate covers a narrower range at higher cost per unit of capacity. Suppliers offering engineered blends that combine citrate, lactate, and carbonate components to reproduce phosphate performance report project values 2.8 times greater than single chemistry substitution. Straight swaps fail on range and cost, which is exactly why formulators keep deferring. A designed system answers the objection that a drop-in cannot. The work is genuinely difficult, which is exactly why it holds against a competitor quoting lower on the drum.
Market Impact: Raises average project values to 2.8 times greater

Hold Fermentation Capacity Behind Citrate Growth

Citrate grows at 7.2% on phosphate substitution, and its cost base sits on agricultural fermentation feedstock rather than mineral extraction. Suppliers owning or contracting fermentation capacity report gross margin 1.7 times better than those buying citric acid on the open market and passing through movements they cannot influence. The segment's growth is driven by regulation rather than demand, which makes supply position more valuable than commercial effort here. Contracting fermentation on multi-year terms achieves most of the same protection without the capital commitment, and it is available to suppliers who will never own a plant. Very few have taken it.
Market Impact: Raises gross margin to 1.7 times better overall

Who Controls the Margin Pool

Concentration is low. Five suppliers hold 34% of category revenue, measured consistently on that basis across all participants, and the remainder spreads very widely across mineral phosphate producers, fermentation businesses, caustic and carbonate manufacturers, pharmaceutical grade specialists, and a large Chinese and Indian production base competing on cost. The leader to challenger gap is narrow because most of the chemistry is entirely undifferentiated. Fragmentation at this level is unusual even among commodity chemical categories.
Competition currently turns on three dimensions: grade documentation and traceability, which decides access to pharmaceutical and regulated food applications; feedstock position, since citrate and phosphate sit on completely unrelated cost bases; and formulation service depth, which is the only route out of purchasing terms in a category priced at 1.4% of a formulation. Price decides wherever a specification names a percentage at standard grade.

Pressure builds from two directions. Chinese and Indian producers hold cost positions on commodity grades that Western assets cannot approach. Phosphate regulation keeps tightening without producing a clean alternative. Rankings will shift toward suppliers holding fermentation capacity and engineered blend capability rather than volume positions in any single chemistry. Suppliers holding only commodity phosphate face the hardest position of anyone here.
buffering-and-neutralizing-agents-market-company-positioning-matrix-1790016697957

Competitive Moat and Risk Dimensions

BASF

Moat: Breadth Across Every Chemistry

Positions spanning amino alcohols, carbonates, and neutralizer chemistry let a single supplier answer a formulation's whole pH question rather than one component of it. That matters more than usual here, because phosphate substitution frequently requires combining several chemistries and a single chemistry producer cannot propose the blend that actually works.
BASF

Risk: Limited Fermentation Feedstock Position

Citrate is the fastest growing buffer chemistry and its cost base sits on agricultural fermentation rather than petrochemical or mineral routes. Buying citric acid rather than producing it means passing through cost movements that competitors with fermentation assets can absorb, on precisely the volume that phosphate substitution keeps adding.
JUNGBUNZLAUER

Moat: Fermentation Capacity And Citrate Depth

Owned fermentation capacity behind citrate and lactate production gives a cost position on the two chemistries absorbing most phosphate substitution volume. That position cannot be replicated by purchasing, and it becomes more valuable each year that eutrophication and dietary phosphate rules tighten across regulated markets.
JUNGBUNZLAUER

Risk: Narrow Chemistry Class Coverage

Depth in organic acid derived buffers leaves limited presence in the amino alcohol and hydroxide chemistries that personal care and water treatment demand. A formulator needing a blended phosphate replacement has to assemble it from several suppliers, and the one that can propose the whole system usually keeps the relationship.

Players Tracked

Prominent Players

BASF
Dow
Solvay
Innophos
Jungbunzlauer

Other Key Players

Tate and Lyle
Cargill
Archer Daniels Midland
Corbion
Prayon
ICL Group
Nippon Chemical Industrial
Mitsubishi Chemical Group
Merck KGaA
Thermo Fisher Scientific
Kemira
Ecolab
Anhui COFCO Biochemical
Weifang Ensign Industry
Shandong Ruifeng Chemical

Recent Developments

APRIL 2026

Jungbunzlauer Expands European Citrate Fermentation Capacity

Jungbunzlauer completed an organic expansion of citrate fermentation capacity at a European site, funded internally with no partner involved. Management cited phosphate substitution demand rather than any shortage in existing beverage and food applications. Contracted substitution volume was cited as underwriting the investment decision entirely.
Signal: Regulatory substitution rather than end demand growth is now driving capacity decisions here. Substitution volume is contracted early.
NOVEMBER 2025

Innophos Publishes Accelerated pH Drift Data Across Buffer Grades

Innophos released accelerated pH drift and capacity retention data across its buffer range, addressing the gap that leaves only about 11% of stability failures correctly traced back to buffer performance rather than to more visible components. The data covers accelerated conditions across eighteen months of simulated storage.
Signal: Suppliers are starting to argue for the failures their chemistry quietly prevents. Drift data gives teams a check.
JULY 2025

Solvay Acquires Engineered Buffer Blend Formulation Business

Solvay completed an acquisition of a specialty business formulating engineered multi-component buffer blends. The transaction was an outright acquisition rather than a joint venture or minority stake, with phosphate replacement capability cited as the rationale. Blend formulation staff transferred with the business as part of the terms.
Signal: Blend capability is being bought because straight phosphate substitution keeps failing on range. Staff rather than assets moved.

What pH Control Costs

Three input groups dominate cost. Fermentation feedstock, principally corn and molasses behind citrate and lactate production, runs 30% to 38% of cost of goods sold across those chemistries. Phosphate rock and mineral inputs take 24% to 32% in the phosphate segment. Caustic soda, soda ash, and the energy behind them account for 20% to 28% across neutralizer grades, and the eight-point range reflects regional power pricing.
Corn and molasses pricing moved through 2024 and 2025 on harvest conditions and competing industrial demand, and United States Department of Agriculture crop statistics documented the underlying movements across the period. Phosphate rock followed an entirely unrelated path shaped by fertiliser demand and export policy, with United States Geological Survey mineral summaries recording the divergence. Several producers described both exposures separately in their annual reports.

The competitive disadvantage mechanism runs through feedstock position rather than through processing scale. A supplier buying citric acid on the open market passes agricultural volatility straight through on the fastest growing chemistry in the category, while a competitor owning fermentation absorbs it. Exposure therefore varies by asset ownership rather than by size, and a mid-sized producer with fermentation is better placed than a larger one without it.
buffering-and-neutralizing-agents-market-cost-volatility-analysis-1790016698156

Own Or Contract Fermentation Behind Citrate Volume

Citrate is absorbing most phosphate substitution volume and its cost base sits on agricultural feedstock that no buyer can influence. Owning fermentation capacity, or contracting it on multi-year terms, converts a pass-through exposure into a margin position on the one chemistry regulation keeps growing regardless of demand conditions. Contracted capacity achieves most of it without the capital.

Hold Phosphate And Fermentation Positions Independently

Phosphate rock and agricultural fermentation feedstock follow completely unrelated cycles driven by fertiliser policy and harvest conditions respectively. Contracting them on separate calendars with separate approaches prevents a single procurement view from carrying exposure to two markets that have never moved together in any useful way. Fertiliser policy and harvest conditions have never moved together usefully.

Site Neutralizer Production Against Regional Power Pricing

Caustic soda and soda ash carry substantial energy content and the eight-point cost range across neutralizer grades is largely regional power pricing rather than process efficiency. Production siting therefore matters more than plant technology, and suppliers serving distant markets from high power cost regions lose on freight and energy together. Freight and energy compound rather than offset.

Portfolio Architecture for Margin Defence

Margin follows documentation and formulation depth rather than chemistry. Commodity phosphate, carbonate, and caustic grades compete on price and freight against Asian producers. Food grade materials earn modestly better on traceability. Pharmaceutical grades earn well on documentation and validation support, and engineered multi-component blends designed to a stated buffer capacity earn most, because they answer a question no single chemistry can.
The tension between volume and premium runs through how the specification arrives. A line naming a percentage of sodium phosphate at food grade is a purchasing exercise decided on price and certificate. A brief describing a target pH, a required capacity, an eighteen-month drift limit, and a phosphate exclusion is a development project, and the supplier who designs that system holds the formulation until it is reformulated for other reasons entirely.

High-value pools concentrate in pharmaceutical grade buffer systems, in engineered phosphate replacements, and in water treatment positions protected by discharge permit validation. Where the brief is a commodity food or industrial grade at an Asian price point, the chemistry is undifferentiated and local producers hold cost and proximity together, which leaves very little for anybody shipping in from elsewhere.

Volume / Commodity-Adjacent

Technical and food grade phosphates, carbonates, caustic soda, and standard citrates supplied against a named percentage and a certificate of analysis. The ten-point range reflects feedstock position, energy cost, and freight rather than any differentiated capability.
Gross Margin: 14% to 24%

Premium / Certified

Pharmaceutical grade buffer systems with full documentation, validation support, and traceability, plus specialty amino alcohol neutralizers for personal care. The twelve-point range separates genuine regulatory support capability from suppliers shipping a compliant certificate alongside the drum.
Gross Margin: 28% to 40%

Sustainability / Regulatory / Next-Generation

Engineered multi-component blends designed to a stated buffer capacity and drift limit, principally as phosphate replacements. The fourteen-point range reflects formulation depth and measurement capability, neither of which can be assembled from a chemistry position alone.
Gross Margin: 44% to 58%
buffering-and-neutralizing-agents-market-portfolio-architecture-1790016698669

High-value Sub-segments and Strategic Watch-out

Engineered Phosphate Replacement Blends

Highest value in the category, answering a substitution problem that single chemistry swaps keep failing on range and cost. The fourteen-point range reflects formulation depth, since combining citrate, lactate, and carbonate to reproduce phosphate performance is genuinely difficult work. Very few suppliers can do it at all.
Gross Margin: 46% to 60%

Pharmaceutical Grade Buffer Systems

High value where documentation, traceability, and validation support matter far more than the unit cost of a common salt. The twelve-point range reflects regulatory support capability rather than any difference in the underlying chemistry being supplied. Requalification cost protects the position once it is won.
Gross Margin: 34% to 46%

Amino Alcohol Neutralizers

Volume core growing fastest in the category on a personal care substitution now about 68% complete. The twelve-point range reflects grade purity and formulation support, with the remaining migration concentrated in legacy products nobody wants to reopen. Pricing that tail as commodity volume misreads it badly.
Gross Margin: 30% to 42%

Commodity Phosphate Grades

The strategic watch-out. Slowest growth of the six segments, tightening regulation, and Asian producers holding cost and proximity together. The ten-point range reflects rock position and freight alone, with nothing else defending the volume at all. Regulation removes the volume rather than simply repricing it downward.
Gross Margin: 12% to 22%

How This Demand Repeats

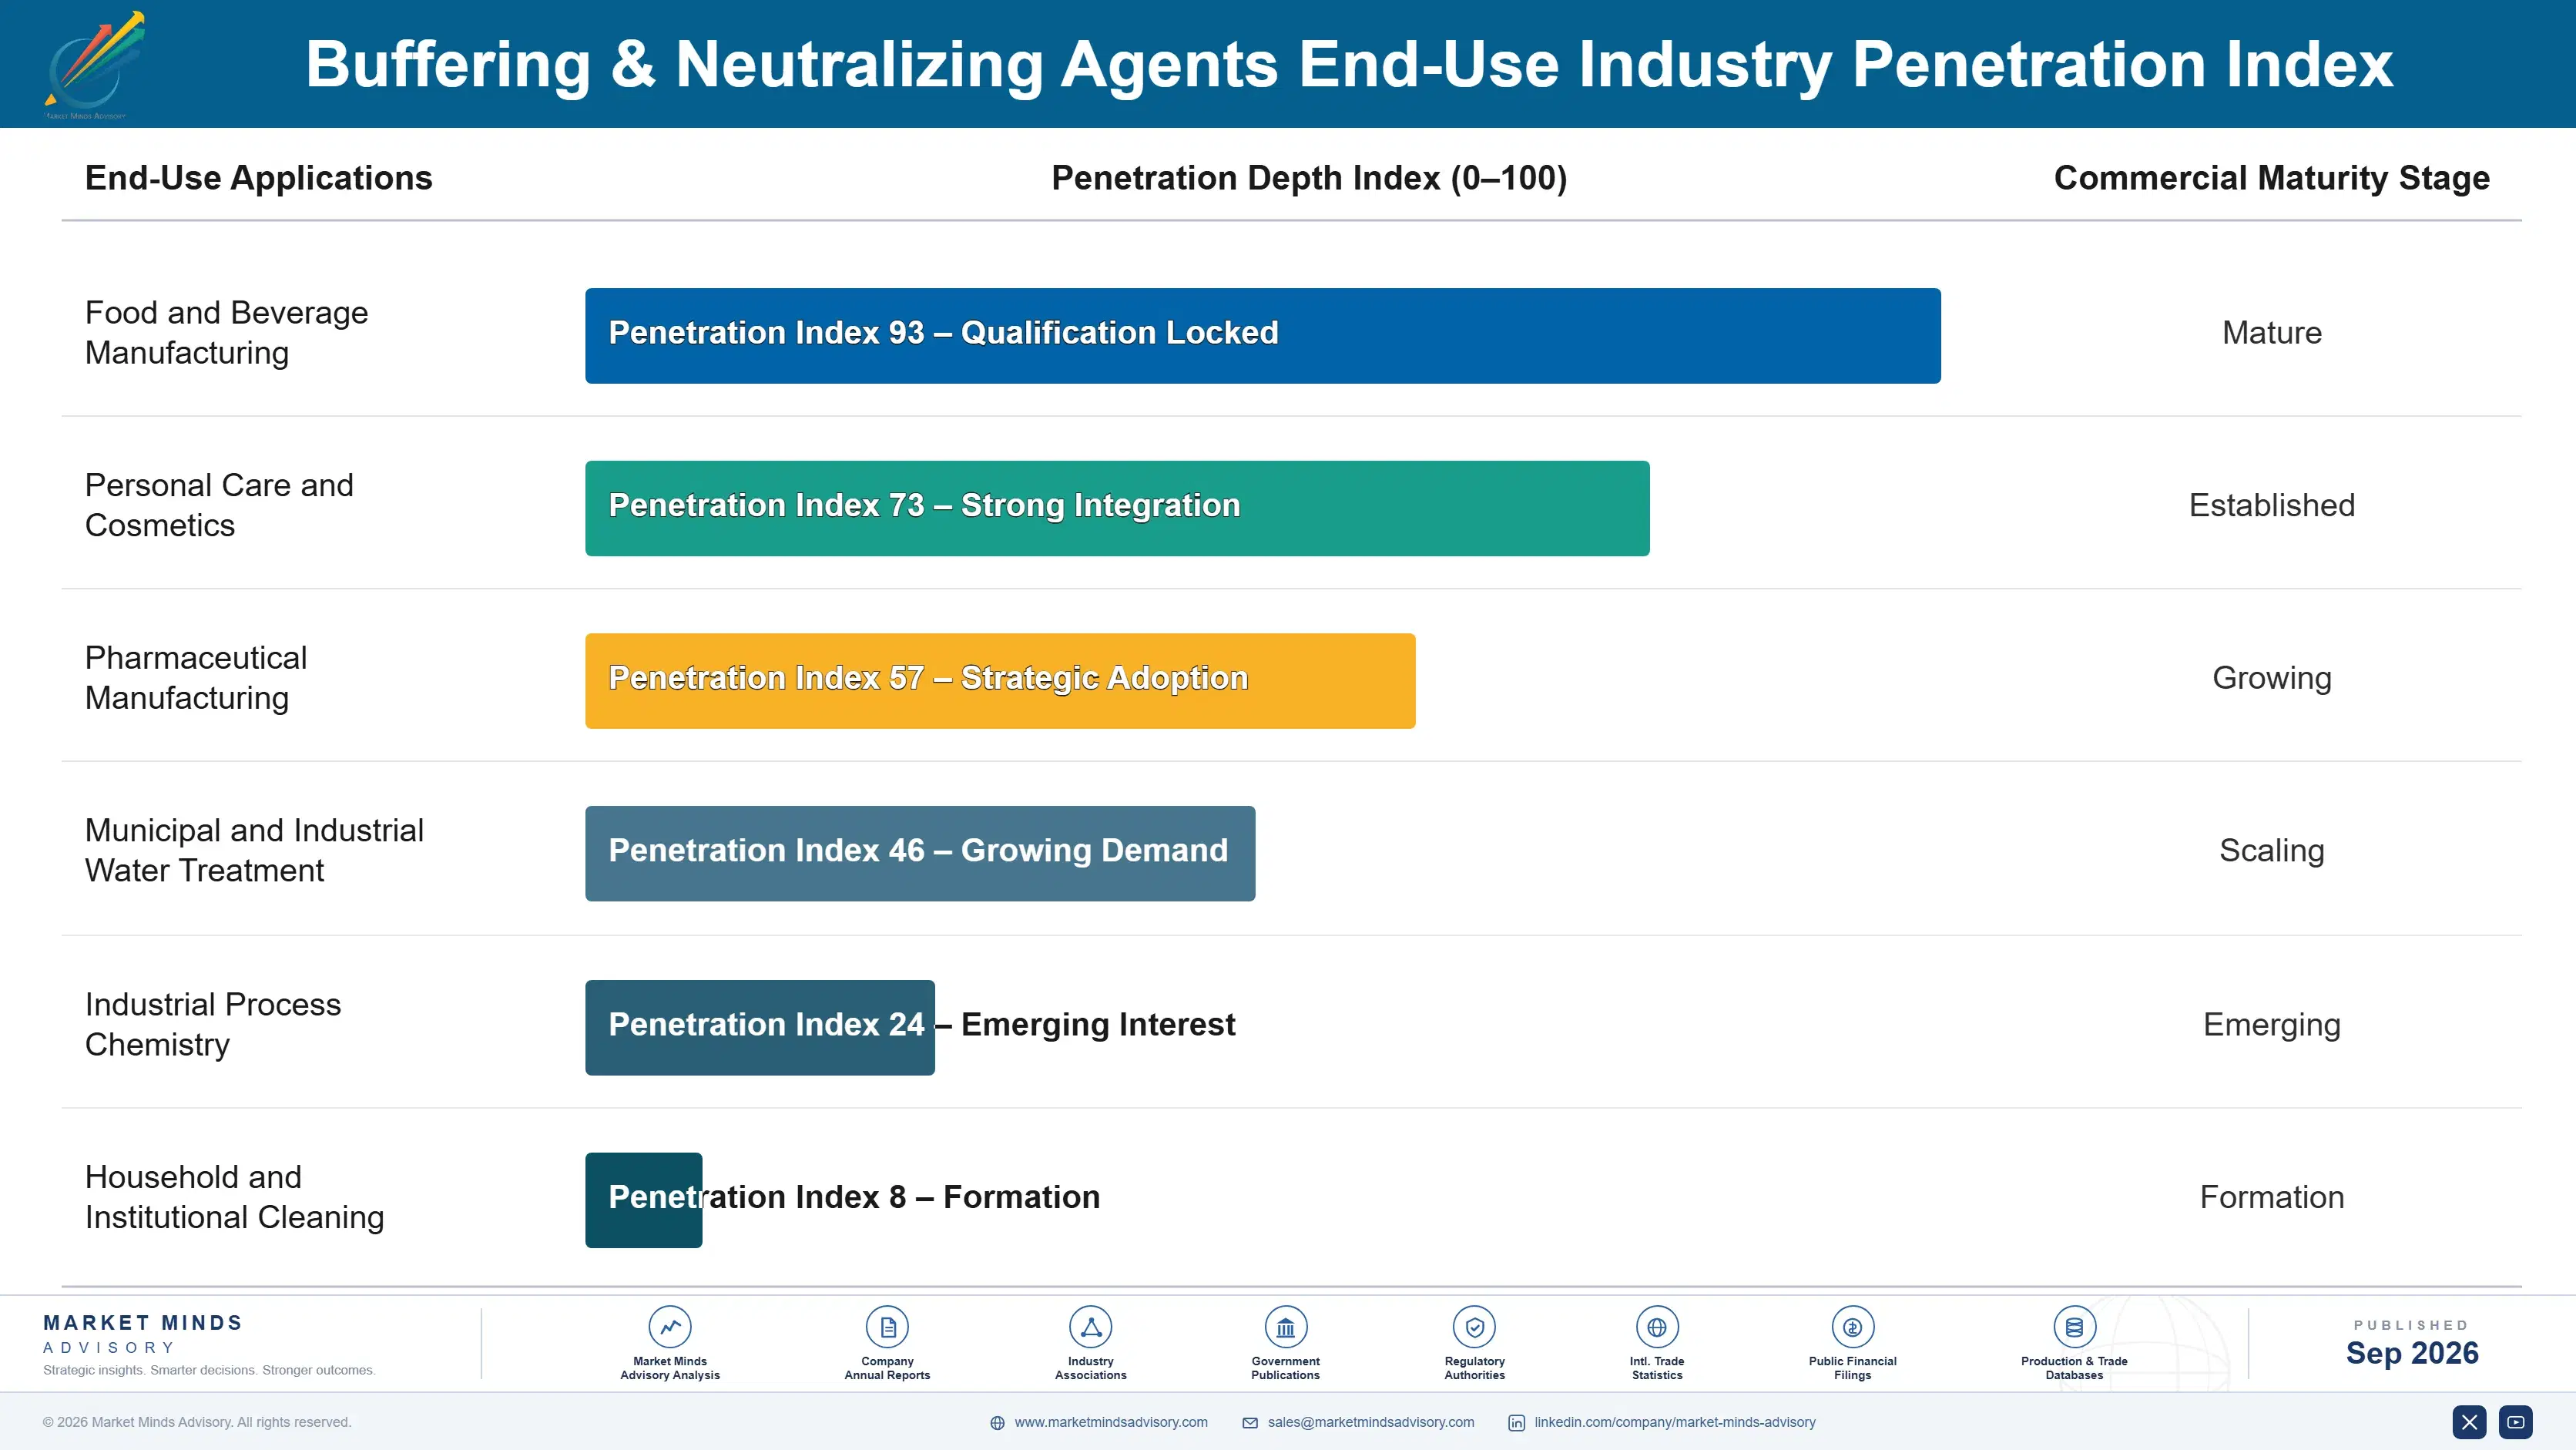
Revenue locks in at formulation approval and then persists far longer than most ingredient categories, because a buffer sits deep in the formulation architecture and changing it triggers full stability requalification. In pharmaceutical and regulated food applications that means repeating validation work costing many multiples of any annual saving on a material running at 1.4% of formulation cost. Incumbency is unusually durable as a result.
Attachment depth follows what the specification names. An engineered blend specified to a stated buffer capacity and drift limit is effectively locked, since no competitor can match a performance requirement they cannot decompose into components. A percentage of sodium citrate at food grade is filled by whoever quotes lowest, and the formulation team is generally not consulted about the change at all.

The buyer is shifting from purchasing toward formulation and regulatory functions as phosphate substitution forces reopening of specifications that had not been touched in years. A team asked to remove phosphate while holding pH range, capacity, and cost needs a designed system rather than a substitute, and a supplier arriving with a single chemistry and a price is answering none of the three constraints.
buffering-and-neutralizing-agents-market-end-use-penetration-index-1790016699161

Where This Market Rewards

These are among the four positions where our research anticipates prominent divergence between winners and laggards over the coming forecast period. Each is grounded in the demand model, the regulatory perimeter, and the announced capacity pipeline.
01 / CAPACITY SPECIFICATION DISCIPLINE

Concentration and capacity are different things

Roughly 61% of specifications state a concentration and a target pH without naming the buffer capacity required, which keeps an entire category priced as a purchasing line rather than a performance requirement. Suppliers providing capacity measurement and writing it into specification templates report price realisation 2.2 times higher on chemistry that has not changed in any way. The measurement itself is straightforward, cheap to run, and almost nobody in this field offers it, and what it needs is a customer approval chain willing to ask for it.
02 / FAILURE INVESTIGATION PRESENCE

Credit for failures nobody attributes correctly

Only about 11% of stability failures are correctly traced back to buffer capacity loss, because pH drift damages other components which then present as the visible defect worth investigating. Suppliers offering root cause investigation support and publishing accelerated drift data report specification upgrades across 3.4 times more accounts than those supplying to specification alone. Being in the room when a formulation fails is worth considerably more than any claim made while it works, and publishing accelerated drift data is the cheapest way into that conversation.
03 / PHOSPHATE REPLACEMENT ENGINEERING

A straight swap keeps failing twice

About 27% of category volume still uses phosphate under tightening pressure, and citrate substitution fails on both effective pH range and cost per unit of capacity delivered. Suppliers offering engineered blends combining citrate, lactate, and carbonate components report project values 2.8 times greater than any single chemistry substitution achieves. Formulators are deferring the decision precisely because nobody has offered them a designed system rather than a replacement drum, and the blend work is difficult enough that a lower quotation on a drum cannot displace it once specified.
04 / FERMENTATION ASSET POSITION

Own the feedstock regulation keeps growing

Citrate grows at 7.2% on phosphate substitution driven by regulation rather than demand, and its cost base sits on agricultural fermentation feedstock that no buyer can influence from the purchasing side. Suppliers owning or contracting fermentation capacity report gross margin 1.7 times better than those buying citric acid and passing movements through. Supply position matters more than commercial effort in a segment whose growth arrives regardless of selling activity, and multi-year contracted capacity achieves most of the same protection without any capital commitment.

Engagement Snapshot From the Field

A live engagement with an industry participant carrying material or product regulatory and market exposure ahead of a defining policy shift, showing how our research translates into a defensible multi-year portfolio strategy.
MARKET MINDS ADVISORY · CLIENT ENGAGEMENT SUMMARY
Buffering & Neutralizing Agents Producer Strategic Portfolio Review and Transition Roadmap 2026·Investment Scenario on Buffering & Neutralizing Agents Exposure Evaluation 2025-26
CLIENT PROFILE
A global beverage manufacturer with formulation spend near USD 380 million (client-reported, unverified by MMA) across forty markets. A phosphate exit programme had been running for three years and had stalled on two product families where every citrate substitution trial had failed shelf-life testing, and the technical team had begun proposing packaging changes instead. Neither family had been reformulated in a decade.
STRATEGIC CHALLENGE
Trials had substituted citrate for phosphate at matched concentration and matched initial pH, and the products drifted out of specification within nine months every time. Nobody had measured buffer capacity in either the incumbent or the replacement, so the failure mode had never actually been identified. Three years of trials had tested the same wrong hypothesis repeatedly.
MMA APPROACH
MMA measured buffer capacity and accelerated pH drift across the incumbent phosphate systems and every failed citrate trial, mapped effective buffering range against the products' actual pH targets, and modelled multi-component blend options combining citrate, lactate, and carbonate against cost and regulatory constraints. Incumbent formulations were measured first so the replacement target was a known quantity rather than an assumption.
KEY FINDINGS
  1. Matched concentration delivered roughly 40% less buffer capacity in citrate than in the incumbent phosphate system, which explained every failure across both product families.
  2. Both stalled products sat near pH five and a half, at the upper edge of citrate's effective range and squarely inside where phosphate performs best.
  3. The proposed packaging change would have cost several times the formulation work and would not have addressed the pH drift causing the failures.
  4. A three-component blend held capacity and range at a unit cost roughly 14% above the incumbent, well inside the programme's approved substitution budget.
CLIENT PROFILE
A global beverage manufacturer with formulation spend near USD 380 million (client-reported, unverified by MMA) across forty markets. A phosphate exit programme had been running for three years and had stalled on two product families where every citrate substitution trial had failed shelf-life testing, and the technical team had begun proposing packaging changes instead. Neither family had been reformulated in a decade.
STRATEGIC CHALLENGE
Trials had substituted citrate for phosphate at matched concentration and matched initial pH, and the products drifted out of specification within nine months every time. Nobody had measured buffer capacity in either the incumbent or the replacement, so the failure mode had never actually been identified. Three years of trials had tested the same wrong hypothesis repeatedly.
MMA APPROACH
MMA measured buffer capacity and accelerated pH drift across the incumbent phosphate systems and every failed citrate trial, mapped effective buffering range against the products' actual pH targets, and modelled multi-component blend options combining citrate, lactate, and carbonate against cost and regulatory constraints. Incumbent formulations were measured first so the replacement target was a known quantity rather than an assumption.
KEY FINDINGS
  1. Matched concentration delivered roughly 40% less buffer capacity in citrate than in the incumbent phosphate system, which explained every failure across both product families.
  2. Both stalled products sat near pH five and a half, at the upper edge of citrate's effective range and squarely inside where phosphate performs best.
  3. The proposed packaging change would have cost several times the formulation work and would not have addressed the pH drift causing the failures.
  4. A three-component blend held capacity and range at a unit cost roughly 14% above the incumbent, well inside the programme's approved substitution budget.
RECOMMENDED STRATEGY
Phase 1: Phase one: abandon single chemistry substitution on both stalled families and specify a three-component engineered blend to a stated capacity target. Phase 2: Phase two: add measured buffer capacity to every specification across the portfolio rather than concentration and target pH alone as before. Phase 3: Phase three: halt the proposed packaging programme and redirect that budget into completing the remaining phosphate exit work instead. Reassess packaging only once pH stability is demonstrated.
OUTCOME
Both product families passed twelve-month stability testing on the engineered blend at a formulation cost increase inside the approved budget (client-reported, unverified by MMA). The packaging programme was cancelled. Buffer capacity is now a stated parameter on every specification the business issues worldwide. The remaining phosphate exit work completed within the year.

Frequently Asked Questions

Foundational context covering the market sizes, CAGR, scope, country, region and competition that inform every finding below. This section is provided to cover basics and most often pre-purchase conversations, answered from the MMA Primary Research Dataset.

What is the current size of the Buffering & Neutralizing Agents Market?

The market was worth USD 4.6 billion in 2025 and stands at USD 4.8 billion in 2026. Value covers buffering and neutralizing agents at producer selling price.

How large will the Buffering & Neutralizing Agents Market be by 2036?

MMA forecasts USD 8.1 billion by 2036, an increase of USD 3.3 billion across the forecast period. That represents 1.69 times the 2026 base of USD 4.8 billion.

What is the CAGR for the Buffering & Neutralizing Agents Market 2026 to 2036?

The base case compound annual growth rate is 5.4%, with a bull case at 6.6% and a bear case at 4.2%. Historical growth from 2020 to 2025 ran at 4.6%.

Which segment is growing fastest?

Amino alcohol neutralizers grow at 8.1%, half again the market rate of 5.4%. A personal care substitution away from older amine chemistry is now around 68% complete.

Who are the major companies in the Buffering & Neutralizing Agents Market?

BASF, Dow, Solvay, Innophos, and Jungbunzlauer lead the field. Together they hold only 34% of category revenue, which makes this among the more fragmented chemical markets covered.

Which country is growing fastest?

Indonesia grows at 9.3%, as packaged food and personal care manufacture scales across a large domestic market with rising formal retail penetration. Volume growth well outpaces value growth there.

Report Segmentation Architecture

The full report scope spans multiple orthogonal segmentation dimensions, with cross-tabulated demand data provided for each dimension pair. Coverage extends further to regional breakdowns, trend trajectories, and the competitive detail needed to support segment-level decision-making.

By Chemistry Class

  • Phosphate Buffer Systems
  • Citrate Buffer Systems
  • Carbonate and Bicarbonate Systems
  • Lactate and Acetate Buffer Systems
  • Amino Alcohol Neutralizers
  • Alkali Hydroxide Neutralizers

By End-Use Industry

  • Food and Beverage Manufacturing
  • Personal Care and Cosmetics
  • Pharmaceutical Manufacturing
  • Municipal and Industrial Water Treatment
  • Industrial Process Chemistry
  • Household and Institutional Cleaning

By Commercial Dimension

  • Direct Producer Supply
  • Specialty Chemical Distribution
  • Contract Manufacturer Supply
  • Pharmaceutical Grade Supply Contracts
  • Engineered Blend Development Contracts
  • Technical Service and Validation Support

By Region

  • East Asia
  • North America
  • Western Europe
  • South Asia and Pacific
  • Latin America
  • Middle East and Africa
  • Eastern Europe

Scope, Methodology, and Coverage

Every figure in this report is reproducible from documented input assumptions. The scope below maps the historical period, the forecast horizon, the segmentation dimensions, and the countries covered, alongside the underlying primary and qualitative methodology.
Historical Period
2020 to 2025
Forecast Period
2026 to 2036
Base Year
2025 (USD billions; MMA Primary Research Dataset, September 2026)
Market Definition
This market covers buffering and neutralizing agents used to establish and hold pH in food and beverage, personal care, pharmaceutical, water treatment, and industrial process formulations, across phosphate buffer systems, citrate buffer systems, carbonate and bicarbonate systems, lactate and acetate buffer systems, amino alcohol neutralizers, and alkali hydroxide neutralizers. It excludes chelating and sequestering agents, preservatives, acidulants used for flavour rather than pH control, and pH measurement instrumentation.
Quantitative Units
USD billions, revenue at producer selling price
Segmentation Dimensions
Chemistry class, end-use industry, commercial dimension, region
Regions Covered
East Asia, North America, Western Europe, South Asia and Pacific, Latin America, Middle East and Africa, Eastern Europe
Countries Covered
China, Japan, South Korea, Taiwan, India, Indonesia, Thailand, Vietnam, Australia, United States, Canada, Mexico, Germany, France, United Kingdom, Italy, Spain, Netherlands, Belgium, Switzerland, Poland, Czechia, Hungary, Brazil, Argentina, Colombia, Saudi Arabia, United Arab Emirates, Egypt, South Africa
Key Companies Profiled
BASF, Dow, Solvay, Innophos, Jungbunzlauer, Tate and Lyle, Cargill, Archer Daniels Midland, Corbion, Prayon, ICL Group, Nippon Chemical Industrial, Mitsubishi Chemical Group, Merck KGaA, Thermo Fisher Scientific, Kemira, Ecolab, Anhui COFCO Biochemical, Weifang Ensign Industry, Shandong Ruifeng Chemical
Quantitative Methodology
Primary survey, n=3,800 respondents, Q4 2025, six countries; demand-side model with trade association cross-validation
Qualitative Methodology
47 expert interviews, Q4 2025; applied to validate demand model assumptions, identify emerging dynamics, and assess competitive positioning
Report Format
PDF and XLSX data workbook (Word format preview document)
Publisher
Market Minds Advisory
Report Code
MMA-2026-CHM-481
Published
September 2026
Contact
sales@marketmindsadvisory.com | www.marketmindsadvisory.com

Purchase the full Buffering & Neutralizing Agents Market Report (2026 to 2036).

The full report sizes the buffering and neutralizing agents market across six chemistry classes, seven regions, and thirty countries, with forecasts to 2036 under base, bull, and bear cases. It quantifies how rarely stability failures are correctly attributed to buffer capacity loss, maps phosphate substitution progress against regulatory timelines by jurisdiction, and separates the feedstock exposures behind mineral and fermentation routes. Competitive analysis covers twenty participants evaluated consistently on category revenue, with detailed treatment of engineered blend capability and grade documentation depth. Cost structure and asset position are analysed throughout. Primary research includes 3,800 survey responses and 47 expert interviews.
Six chemistry classes sized and forecast separately
Twenty participants evaluated on category revenue consistently
Phosphate substitution progress mapped by application and jurisdiction
Buffer capacity specification practice measured across end-use industries
Fermentation and mineral feedstock exposures separated throughout
Engineered blend capability assessed by individual supplier

Built For The People Who Decide

From boardroom strategy to bench-side execution, this report is read cover-to-cover by leaders shaping the next decade of their industry, turning demand scenarios, market dynamics and valuation benchmarks into decisions.
CXOs/ Presidents/ VPs/ Managers
M&A and Corporate Development
Strategy Teams and R&D Heads
Procurement and Product Directors
Regulatory and Compliance Leaders
Investor Relations and Equity Analysts