

Market Minds Advisory
Brush Motor Control Unit Market

Brush Motor Control Unit Market: A Declining Technology With Very Sticky Demand

Everyone has been predicting the end of brushed motors for two decades, yet requalifying a control unit costs more than the brushless savings return across most of the applications still using them.

Lead Analyst

David Horsley

Published

September 2026

Make Smarter Decisions with Customized Research Insights

Request a free sample report and evaluate market opportunities, growth trends, and competitive dynamics relevant to your business needs.

2025 MARKET VALUE$3.6BMarket Size 2025
2036 FORECAST VALUE$5.8BBase Case , 2026 to 2036
CAGR 2026 TO 20364.4 %Bull 5.6% / Bear 3.2%
INCREMENTAL OPPORTUNITY$2.0BNet 10- year value creation
EXPANSION MULTIPLE1.54x2036 value over 2026 base
Strategic Levers
M&A Pipeline
Regional Outlook
Country Rankings
Competitive Intelligence
Segmental Deep-dive
Call-Us : 91 93563 13602

Executive Snapshot and Market Trajectory

Brushed motor control has been declared obsolete since the early two thousands, and it keeps not happening. Switching an existing application to brushless costs roughly 14,000 dollars in requalification and tooling per part number, against unit savings that rarely repay it inside a product's remaining life.
Growth runs at 4.4% and integration carries what growth exists. Integrated control modules with diagnostics grow at 6.6%, exactly 1.50 times the market rate, because a controller reporting brush wear before failure changes a maintenance argument that raw efficiency never won. East Asia holds the largest share at 30%, on Chinese appliance and automotive component manufacturing volume. Aftermarket replacement units follow at 5.4% and carry considerably better pricing than original equipment.
Concentration is low at 38% across the top five measured on units shipped, and it stays low because these are low-value parts sold into fragmented applications where design authority sits with the equipment maker. Component suppliers rarely control the specification, and that has kept pricing power thin for a very long time. Motor manufacturers are also integrating control electronics and selling a single part. Chinese producers supply appliance volume at costs Western suppliers cannot approach.
Market Definition
This market covers electronic control units driving brushed direct current motors, spanning automotive body and comfort motor controllers, appliance and power tool motor control boards, industrial and material handling motor controllers, integrated motor control modules with diagnostic capability, and aftermarket and replacement control units. Brushless direct current motor controllers, alternating current variable frequency drives, traction inverters for electric vehicles, the motors themselves, and general purpose microcontrollers sold uncommitted fall outside scope.
Base Year Value
$3.6B in 2025 (MMA Primary Research Dataset, August 2026)
Forecast Period
2026 to 2036, eleven discrete annual values
CAGR
4.4% base case. Bull 5.6%. Bear 3.2%.
Fastest Growth Segment
Integrated Motor Control Modules with Diagnostics: 6.6% CAGR
Fastest Growth Country
India: 6.0% CAGR
Fastest Growth Region
South Asia and Pacific: 6.4% CAGR
Largest Region
East Asia: 30% of 2025 global value
Market Leaders
Robert Bosch, Denso, Nidec, Mabuchi Motor, Johnson Electric. Source: MMA Analysis based on company annual reports.
Primary Survey
n=3,800 procurement and R&D decision-makers, Q4 2025, six countries
Methodology
Demand-side build-up, cross-validated against public data, 47 expert interviews

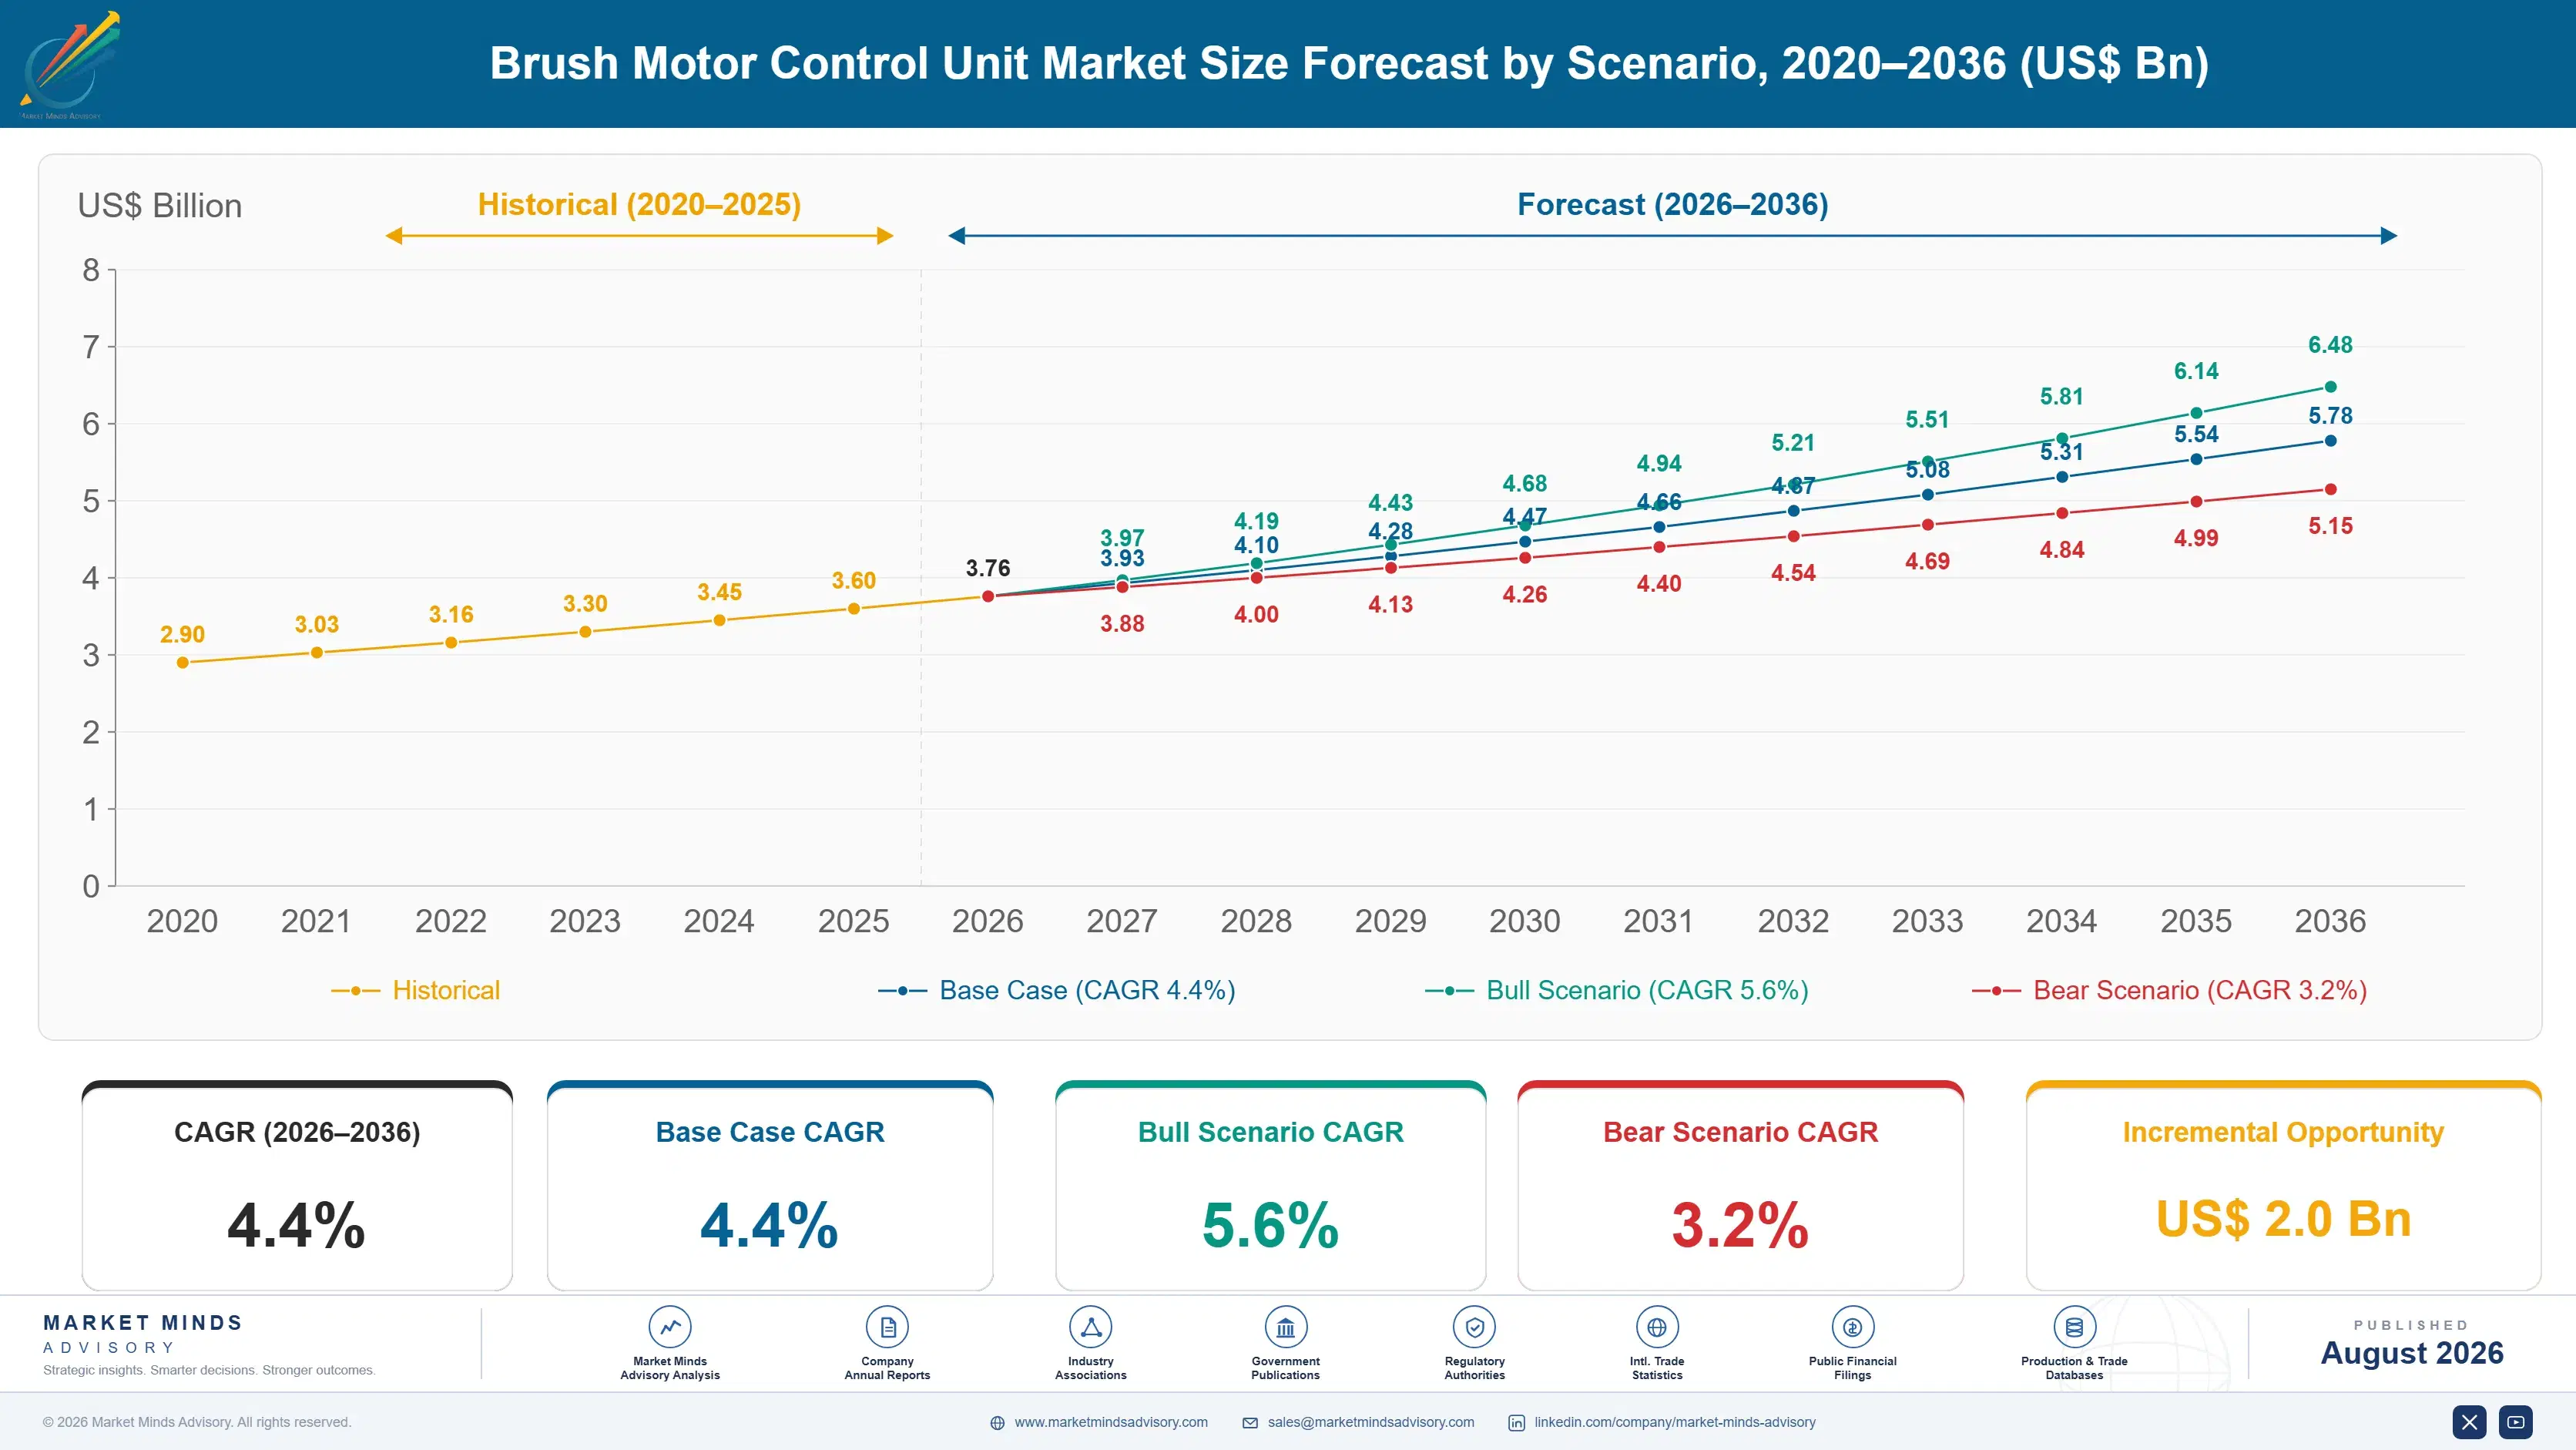
Brush Motor Control Unit Market Forecast Scenarios

brush-motor-control-unit-market-size-forecast-scenario-1787301051790
The 2020 to 2025 period ran at 3.4% and semiconductor allocation shaped it more than any technology transition. Controller supply constrained appliance and automotive production through 2021 and 2022, and several manufacturers redesigned boards around whatever chips were available rather than around cost. Brushless substitution continued at the slow pace it has kept for two decades, concentrated in new designs rather than in replacements.
Three mechanisms carry the 4.4% base case. Diagnostic integration is the largest, since a controller predicting brush wear converts an unplanned failure into scheduled maintenance. Emerging market appliance and two-wheeler volume is the second, where cost sensitivity keeps brushed architectures competitive far longer. And the aftermarket is the third, which grows as installed populations age regardless of what new designs specify. None of the three depends on brushless substitution slowing down at all.
The 5.6% bull case rests on diagnostic modules reaching industrial maintenance applications at scale, where unplanned downtime costs enough to justify a controller that predicts failure. The 3.2% bear case is faster brushless substitution in appliances as component costs fall, combined with weakness in the automotive body applications that still carry substantial brushed motor content per vehicle.

Why the Obituary Keeps Being Wrong

Brushed motors have been on the way out since roughly 2003. They are still about 41% of small motor applications, and the reason is arithmetic rather than nostalgia. Moving an existing application to brushless costs around 14,000 dollars per part number in requalification, tooling, and validation, and the unit cost savings rarely repay that inside the remaining life of the product it sits in.
REQUALIFICATION COST14,000 dollarsPer part number to convert an application to brushless
BRUSHED SHARE OF MOTORS41%Of small motor applications still specified with brushed architecture
SEMICONDUCTOR SHARE OF COGS46%Concentrating cost exposure in a supply base outside supplier control
AFTERMARKET REVENUE SHARE24%Of total market from replacement units into ageing installed populations
TOP FIVE CONCENTRATION38%Low, because design authority sits with equipment makers not suppliers
TYPICAL DESIGN CYCLE LENGTH9 yearsBetween platform redesigns where architecture can actually be reconsidered
Design cycles compound the inertia. Architecture is genuinely reconsidered only at a platform redesign, which arrives roughly every nine years in automotive body applications and less often in appliances. Between those points, an engineer facing a cost reduction target will change a supplier or a component before changing a motor architecture, because the second option triggers validation work that consumes the saving several times over.
So the market persists, and the interesting question is what actually grows inside it. Not efficiency, which never won the argument. Diagnostics does: a controller monitoring current signature and predicting brush wear before it fails converts an unplanned breakdown into scheduled maintenance, and that argument works in industrial and commercial applications where downtime costs real money rather than mild inconvenience.
"I have watched three generations of engineers announce that brushed motors were finished. They were all right about the technology and all wrong about the economics, which is a distinction that costs suppliers a great deal."
Principal, Motor Electronics and Drive Systems Practice · MMA Automotive and Ind

Market Trends

Diagnostics Rather Than Efficiency Justifies A New Controller

Integrated modules monitoring current signature to predict brush wear grow at 6.6% against 4.4% for the market, and they win an argument that efficiency has lost repeatedly. An operator who can schedule a brush replacement instead of discovering the failure mid-shift will readily pay for that controller, particularly in industrial and material handling applications. Efficiency arguments simply fail, because the saving never covers roughly 14,000 dollars of requalification per part number. Diagnostic content is also difficult for an equipment maker to specify precisely, which gives the supplier something to price.
Market Impact: India growing at 6.0%

Substitution Happens At Redesign Or It Does Not Happen

Motor architecture is genuinely reconsidered only at a platform redesign, which arrives around every nine years in automotive body applications and less frequently in appliances. Between those points an engineer under cost pressure changes a supplier or a component rather than an architecture, because architecture change triggers validation consuming the saving several times over. Brushless substitution therefore proceeds in steps rather than continuously, which makes forecasting it a question of design calendars. A supplier can therefore know years ahead exactly when each application becomes genuinely contestable. Commercial effort spread evenly across accounts is largely wasted against that pattern.
Market Impact: Aftermarket is 24% of revenue

Market Opportunities and Growth Drivers

Emerging Market Volume Keeps Brushed Architectures Competitive

Appliance and two-wheeler manufacturing across India, Southeast Asia, and parts of Africa builds to cost targets where brushed motors and their simpler controllers remain the rational choice rather than a legacy one. The controller for a brushed motor needs fewer switching devices, no position sensing, and simpler firmware. Those savings matter enormously at the price points these markets serve, and the volume involved is growing faster than substitution is removing it elsewhere. Domestic controller manufacturing across these markets has expanded specifically to serve that volume. Western suppliers cannot approach the cost positions involved.
Market Impact: Semiconductors are 46% of COGS

Ageing Installed Populations Sustain Replacement Demand

Roughly 24% of market revenue comes from aftermarket and replacement controllers, and that stream grows as installed equipment ages regardless of what new designs specify. A controller failing in a fifteen-year-old material handling vehicle is replaced with a brushed unit because converting the vehicle is not a serious option. Aftermarket pricing is also considerably better than original equipment pricing, which makes this the more profitable half of the business. Distribution reach and catalogue coverage decide this business rather than engineering capability. A supplier selling only into original equipment hands that half to distributors adding nothing.
Market Impact: Concentration remains at 38%

Market Restraints and Challenges

Semiconductor Exposure Sits Outside Supplier Control

Semiconductors carry roughly 46% of cost of goods sold in these controllers, and the root cause is that a control unit is mostly silicon plus a board, with very little else to optimise. Commercial impact was demonstrated through 2021 and 2022 when allocation forced redesigns around available parts rather than around cost. Mitigation runs through multi-sourced designs, second-source qualification during development rather than after shortage, and buffer stock on constrained device families. Purchasing volume helps considerably less than expected, since allocation during shortage follows strategic relationships rather than order size.
Market Impact: Diagnostics growing at 6.6%

Design Authority Sits With Equipment Makers Not Suppliers

Concentration stays near 38% because the equipment maker specifies the motor, the controller, and frequently the semiconductor, leaving the control unit supplier to build to a drawing. The root cause is that these are low-value components inside a larger product where the brand and warranty belong elsewhere. Commercial impact is thin and persistent pricing power. Mitigation runs through diagnostic capability that a customer cannot easily specify in a drawing, and through aftermarket channels where the supplier owns the relationship. Diagnostic content is the one thing a customer cannot easily write into a drawing.
Market Impact: Cycles run about 9 years
3 additional market trends, 4 additional growth drivers, and 2 additional restraints and challenges are covered in the full report. Contact sales@marketmindsadvisory.com to access the complete intelligence.

Segment CAGR and Growth Architecture

Segmentation follows application environment and control unit capability, because those determine qualification requirements, expected life, diagnostic content, and whether the buyer is an equipment maker or an end user. Motor size and voltage class both cut across every application rather than separating them, which makes either a weaker primary dimension here. Application environment decides who actually holds the specification.
brush-motor-control-unit-market-market-share-analysis-1787301052318

Integrated Motor Control Modules With Diagnostics

The fastest category at 6.6%, exactly 1.50 times the market rate, and the only one selling on something other than cost. Current signature monitoring predicts brush wear before failure, which converts an unplanned breakdown into scheduled maintenance in applications where downtime costs money. Industrial and material handling users buy readily; appliance makers do not, because a domestic failure is an inconvenience rather than an expense. Diagnostic content is also difficult for an equipment maker to specify precisely, which finally gives the controller supplier something to price on. Maintenance and operations functions increasingly make this purchase, and they have never bought a control unit before. Efficiency arguments never reached those buyers at all.
CAGR 6.6%

Aftermarket And Replacement Control Units

Second fastest at 5.4% and roughly 24% of total revenue, growing as installed equipment populations age regardless of what new designs specify. A controller failing in a fifteen-year-old material handling vehicle is replaced with a brushed unit because converting the machine is never a serious option at that point. Pricing is considerably better than original equipment supply because the buyer needs a working part quickly rather than the lowest quotation. Distribution and catalogue coverage matter more here than engineering capability does. Independent suppliers frequently serve replacement demand into an original manufacturer's own installed base. That is the more profitable half of the business being handed away, and most suppliers have not noticed. Catalogue presence decides it.
CAGR 5.4%
Full segment breakdown across 5 segments available in the complete report.

Regional Architecture and Country Demand Map

East Asia leads at 30% on Chinese appliance and automotive component manufacturing volume, where brushed architectures remain widespread. North America and Western Europe follow on automotive body content and industrial equipment. South Asia and Pacific grows fastest on appliance and two-wheeler production. Substitution pace differs sharply between these regions.

East Asia

Thirty percent, the largest share, and appliance and component manufacturing volume explains it rather than any technology preference. Chinese production of washing machines, vacuum cleaners, power tools, and automotive body motors runs at a scale nothing else approaches, and cost targets in the domestic segments of those markets keep brushed architectures firmly competitive. Japanese and Korean suppliers hold the higher specification automotive and industrial positions. Growth at 5.2% runs above the market rate, supported by domestic appliance volume rather than by any diagnostic adoption. Domestic Chinese controller manufacturers compete at cost positions Western suppliers cannot approach. Diagnostic module adoption remains limited outside the higher specification industrial and automotive applications here.
Share: 30% | CAGR: 5.2% (2026 to 2036)

North America

Twenty-three percent, and automotive body content combined with industrial material handling carries most of it. Vehicles still contain substantial brushed motor content in seats, windows, wipers, and closures, and those applications change architecture only at platform redesign roughly every nine years. Material handling and warehouse equipment is where diagnostic modules sell best, since unplanned downtime in a distribution centre has an obvious cost. Growth at 4.0% sits near the market rate, with diagnostic adoption offsetting slow automotive substitution. Aftermarket replacement demand across ageing vehicle and industrial populations is substantial and poorly served by original suppliers. Independent distributors capture much of it. Diagnostic module adoption is furthest advanced anywhere in this region.
Share: 23% | CAGR: 4.0% (2026 to 2036)
Regional intelligence for 5 additional markets available in the complete report: Western Europe, South Asia and Pacific, Latin America, Middle East and Africa, Eastern Europe. Contact sales@marketmindsadvisory.com.
brush-motor-control-unit-market-country-cagr-analysis-1787301052837

Selling Prediction Instead of Efficiency

Requalification costs roughly 14,000 dollars per part number, brushed remains 41% of small motor applications, semiconductors carry 46% of cost, and aftermarket is 24% of revenue. Value comes from diagnostics, from aftermarket channel ownership, and from second-sourcing silicon during design. Substitution happens at redesign or it does not happen at all. Calendars matter more than pipelines.

Sell Predicted Failure Rather Than Improved Efficiency

Efficiency arguments have lost this debate for two decades because the saving never covers roughly 14,000 dollars of requalification per part number. Diagnostics wins where efficiency failed: current signature monitoring predicting brush wear converts an unplanned breakdown into scheduled maintenance, and industrial and material handling operators pay for that readily. Diagnostic content is also difficult for an equipment maker to specify precisely, which finally gives a controller supplier something to price on rather than a drawing to build to. Maintenance and operations buyers increasingly make this purchase, and efficiency arguments never reached them.
Market Impact: Diagnostic modules are now growing at 6.6% annually

Own The Aftermarket Channel Rather Than Supplying It

Aftermarket and replacement units carry roughly 24% of market revenue at pricing considerably better than original equipment supply, because a buyer needs a working part quickly rather than the lowest quotation available. Distribution reach and catalogue coverage decide that business rather than engineering capability. A supplier selling only into original equipment has handed the more profitable half of its own installed base to distributors who add nothing beyond availability. Independent suppliers already serve replacement demand into installed bases their original manufacturers built. Roughly 41% of small motor applications remain brushed, so those populations keep growing.
Market Impact: Aftermarket carries about 24% of total market revenue

Second-Source Silicon During Design Not After Shortage

Semiconductors carry roughly 46% of cost of goods sold, and the 2021 allocation forced manufacturers to redesign boards around whatever parts were available rather than around cost. Qualifying alternate devices during development costs engineering time and almost no money; doing it during a shortage costs a redesign and a production stoppage. Very few controller designs currently carry qualified second sources on their constrained device families, which is a preventable exposure. Purchasing volume helps considerably less than expected, since allocation follows strategic relationships rather than order size. Buffer stock addresses the symptom rather than the exposure.
Market Impact: Semiconductors carry 46% of the cost of goods

Track Platform Redesign Calendars Rather Than Chasing Volume

Motor architecture is reconsidered only at platform redesign, roughly every nine years in automotive body applications and less often in appliances, so a supplier can know years ahead exactly when each application is genuinely contestable. Commercial effort spread evenly across accounts is largely wasted against a decision pattern this discontinuous. Engaging during design rather than during purchasing is what decides these awards, and the calendars are entirely knowable to anyone who maintains them. Requalification costs around 14,000 dollars per part number, which is what makes those windows so decisive. Between them, an engineer changes suppliers rather than architectures.
Market Impact: Design cycles run about 9 years between redesigns

Who Controls the Margin Pool

Concentration is low at 38% across the top five measured on units shipped, and it stays low because design authority sits with equipment makers rather than with component suppliers. An appliance or vehicle manufacturer specifies the motor, the controller, and frequently the semiconductor, which leaves a supplier building to a drawing with very little to differentiate on. The leader to challenger gap is narrow, and awards move on cost and delivery.
Competitive activity concentrates on three fronts. Diagnostic capability is the first and the only one offering genuine escape from cost competition, since an equipment maker cannot easily specify what it does not fully understand. Semiconductor sourcing resilience is the second, which the 2021 shortage moved from a procurement detail to a qualifying requirement. And aftermarket distribution reach is the third, where the better margins actually sit.

Pressure arrives from two directions. Motor manufacturers are integrating control electronics into the motor assembly and selling a single part. And Chinese controller manufacturers supply appliance and two-wheeler volume at costs Western suppliers cannot approach. Both pressures attack the volume tier where design authority already sits with the customer.

Rankings move at platform redesigns rather than continuously.
brush-motor-control-unit-market-company-positioning-matrix-1787301053357

Competitive Moat and Risk Dimensions

ROBERT BOSCH

Moat: Automotive qualification and platform presence

Holding qualified positions across automotive body applications at multiple vehicle manufacturers gives access to platform redesign decisions years before any competitive evaluation happens, and automotive qualification itself is a barrier that takes years to clear. Semiconductor design capability in-house also insulates the position from the sourcing exposure that constrains competitors. Neither advantage can be assembled quickly.
ROBERT BOSCH

Risk: Brushed content declines at redesign

Automotive body applications substitute toward brushless at each platform redesign, and a supplier deeply qualified in brushed control faces steady erosion of exactly the content its position rests on. Efficiency regulation accelerates that in Europe specifically. Deep qualification in a declining architecture is a position that defends itself well and shrinks anyway.
JOHNSON ELECTRIC

Moat: Motor and controller integration

Supplying motor and control electronics as a single assembly removes an interface the customer would otherwise manage and lets one supplier capture value that would sit with two. It also makes the controller considerably harder to substitute, since replacing it means requalifying the motor as well. Customers value the reduced supplier count more than the technical integration itself.
JOHNSON ELECTRIC

Risk: Integration invites motor-side competition

Selling an integrated assembly puts a controller supplier into direct competition with motor manufacturers pursuing exactly the same integration from the other direction, and those competitors hold the mechanical content. Winning on the electronics alone becomes harder once the comparison is assembly against assembly. Integration widens the addressable value and widens the competitive field simultaneously.

Key Players

Robert Bosch
Denso
Nidec
Mabuchi Motor
Johnson Electric

Others

Melexis
Infineon Technologies
STMicroelectronics
Texas Instruments
Allegro MicroSystems
Rohm Semiconductor
Mitsuba Corporation
Valeo
Brose Fahrzeugteile
Buhler Motor
Portescap
Maxon Motor
Shinano Kenshi
Wellings Holding
Zhejiang Founder Motor

Recent Developments

JANUARY 2025

Material handling maker specifies brush wear prediction across fleet

A warehouse equipment manufacturer specified control units with current signature monitoring and brush wear prediction across its vehicle range, citing unplanned downtime cost rather than energy efficiency. The specification was a procurement decision rather than any joint venture, acquisition, or development agreement with a controller supplier.
Signal: Downtime cost sells controllers that efficiency arguments have failed to sell for decades of trying to.
APRIL 2025

Controller supplier qualifies second sources across constrained devices

A motor control unit manufacturer completed second-source qualification across the semiconductor families most affected during earlier allocation, embedding alternatives into designs rather than holding buffer inventory. The work was internal engineering investment rather than any acquisition, joint venture, or supply agreement with a semiconductor producer.
Signal: Second sourcing designed in costs engineering time; done under shortage it costs a redesign and a stoppage.
AUGUST 2025

Vehicle maker retains brushed architecture at platform redesign

A vehicle manufacturer reviewed body motor architecture at a platform redesign and retained brushed motors across several applications, citing requalification cost against projected savings over the platform life. The review was an internal engineering decision rather than any supply agreement, joint venture, or arrangement with a component supplier.
Signal: Even at the one point substitution can happen, the arithmetic often still refuses it against the projected savings.

Silicon, Boards and Assembly

Semiconductors carry roughly 46% of cost of goods sold, spanning microcontrollers, gate drivers, power switching devices, and current sensing, sourced from a small number of global suppliers. Printed circuit boards and passive components add about 17%, connectors and housings near 13%, assembly and test around 15%, and logistics and quality overhead the balance. A control unit is mostly silicon with very little else available to optimise.
Semiconductor allocation through 2021 and 2022 constrained microcontroller and gate driver supply severely, and several motor electronics manufacturers disclosed redesign work, expedite premiums, and production interruptions in annual filings covering those years. Availability has normalised and pricing has not fully retreated. Assembly labour cost rose alongside in the regions where these units are built, and that increase has proved similarly persistent. Expedite premiums have not fully reversed either.

The competitive disadvantage mechanism runs through design flexibility rather than through purchasing scale. A controller designed around a single microcontroller family carries full exposure to that supplier's allocation decisions, while one carrying qualified alternates can shift production within weeks. Purchasing volume helps considerably less than most manufacturers expect, because allocation during shortage follows strategic relationships rather than order size alone.
brush-motor-control-unit-market-cost-volatility-analysis-1787301053555

Qualify alternate devices during design rather than during shortage

Semiconductors carry roughly 46% of cost of goods sold, and designing around a single microcontroller family transfers full allocation exposure to a supplier the manufacturer does not control. Qualifying alternates during development costs engineering time and very little money. Doing the same work during a shortage costs a redesign, an expedite premium, and frequently a production stoppage as well.

Design boards for assembly automation rather than for density

Assembly and test carry around 15% of cost of goods sold and rise with labour rates in the regions where these units are actually built. Boards laid out for automated placement and automated test rather than for minimum area reduce that cost permanently. The layout discipline constrains the designer and returns more than component negotiation.

Standardise housings and connectors across product families

Connectors and housings carry about 13% of cost of goods sold, and tooling for each variant is amortised across whatever volume that specific part achieves. Families sharing housings and connector footprints spread that tooling far wider. Customers frequently specify their own connector interfaces, so the standardisation has to be negotiated at design rather than imposed afterward.

Portfolio Architecture for Margin Defence

Three tiers describe this business and the spread follows who holds the specification rather than technical complexity. Appliance and consumer controllers sit at the bottom, built to a customer drawing at cost targets that leave nothing to defend. Automotive body controllers occupy the middle, protected by qualification barriers rather than by any product attribute. Diagnostic modules and aftermarket units sit at the top, where the supplier finally holds something.
The tension is that volume sits at the bottom and margin at the top, and the two require different organisations. Appliance controller volume funds the fixed cost of an electronics manufacturing operation, while diagnostic and aftermarket business needs application engineering and channel management that volume manufacturing does not develop. Suppliers who chased volume alone became contract manufacturers by degrees without ever deciding to.

High-value pools concentrate where the buyer feels the failure. Industrial and material handling applications are the clearest case, because unplanned downtime has an immediate and quantifiable cost that a domestic appliance failure never carries. Aftermarket replacement pools value similarly, because a buyer needing a working part quickly does not shop on price. Both pools sit outside the drawing-based contest entirely.

Volume / Commodity-Adjacent Tier

Appliance, power tool, and consumer motor control boards built to customer drawings at cost targets leaving nothing to differentiate on. Chinese manufacturers compete here at costs Western suppliers cannot approach, and design authority sits entirely elsewhere.
Gross Margin: 14-20%

Premium / Certified Tier

Automotive body and comfort motor controllers protected by qualification barriers taking years to clear rather than by any product attribute. Content declines at each platform redesign, so the position defends itself well while steadily shrinking.
Gross Margin: 22-29%

Sustainability / Regulatory / Next-Generation Tier

Integrated diagnostic modules predicting brush wear plus aftermarket replacement units. Best margin by a clear distance, because diagnostic content resists customer specification and aftermarket buyers need a working part quickly rather than the cheapest quotation.
Gross Margin: 32-42%
brush-motor-control-unit-market-portfolio-architecture-1787301054052

High-value Sub-segments and Strategic Watch-out

Integrated Diagnostic Control Modules

Fastest growth at 6.6%, exactly 1.50 times the market rate, winning the argument that efficiency lost for two decades. Diagnostic content resists precise customer specification, which finally gives a controller supplier something to price on. Maintenance and operations buyers rather than purchasing engineers now decide it.
Gross Margin: 32-42%

Aftermarket Replacement Units

Roughly 24% of revenue at pricing well above original equipment supply, growing as installed populations age regardless of new design decisions. Distribution reach and catalogue coverage decide this business rather than any engineering capability at all. Independent suppliers currently capture much of this stream instead.
Gross Margin: 32-42%

Appliance And Consumer Controllers

The volume core, built to customer drawings where design authority sits entirely elsewhere and Chinese manufacturers compete at unreachable costs. Volume funds electronics manufacturing fixed cost and contributes very little else to the business. Margin here has been thin for a very long time. Nothing available suggests that changing.
Gross Margin: 14-20%

Automotive Body Content Erosion

The strategic watch-out here, since brushed motor content declines at every single platform redesign and European efficiency regulation accelerates that further. Deep qualification in a declining architecture defends itself well and shrinks anyway across each cycle. Qualification barriers slow that erosion considerably without ever stopping it.
Gross Margin: 22-29%

Platforms, Programmes and Spares

Revenue arrives against production schedules once a part is qualified, which makes this business unusually predictable across a platform life and unusually static between awards. A controller qualified into an automotive body application ships against build rates for years without any commercial activity at all. The decision points are separated by roughly nine years, so the addressable opportunity in any given year is a small fraction of the installed base.
Stickiness runs through qualification rather than through relationship. Replacing a qualified automotive controller means repeating validation, environmental testing, and production part approval, which no customer undertakes for a modest unit saving. Appliance controllers stick considerably less, since qualification is lighter and cost pressure constant. Aftermarket demand sticks through catalogue presence and distributor stocking rather than through any technical qualification at all.

Buyer profiles shifted as diagnostics moved the conversation. The earlier buyer was a purchasing engineer comparing unit prices against a fixed drawing. Diagnostic modules increasingly involve a maintenance or operations function that values predicted failure and has never bought a control unit before. Those buyers evaluate downtime cost rather than unit price, which changes the entire conversation. A supplier organised around purchasing engineers is talking to the wrong function.
brush-motor-control-unit-market-end-use-penetration-index-1787301054540

What We Would Tell a Board

These are among the four positions where our research anticipates prominent divergence between winners and laggards over the coming forecast period. Each is grounded in the demand model, the regulatory perimeter, and the announced capacity pipeline.
01 / DIAGNOSTIC VALUE POSITIONING

Efficiency lost this argument; prediction can win it

Efficiency arguments have failed here for two decades, because the unit saving never covers roughly 14,000 dollars of requalification per part number across a product's remaining life. Diagnostics succeeds precisely where efficiency did not: current signature monitoring that predicts brush wear converts an unplanned breakdown into scheduled maintenance, and industrial operators pay for that willingly. Diagnostic content also resists precise customer specification, which finally gives a controller supplier something genuine to price on rather than a drawing to build to.
02 / AFTERMARKET CHANNEL OWNERSHIP

You are giving away the profitable half of your base

Aftermarket and replacement units carry roughly 24% of market revenue at pricing considerably better than original equipment supply, because a buyer in that position needs a working part quickly rather than the lowest available quotation. Distribution reach and catalogue coverage decide that particular business rather than any engineering capability a supplier has spent years developing. A manufacturer selling only into original equipment has handed the more profitable half of its own installed base to independent distributors who add nothing beyond simple availability.
03 / SILICON SOURCING RESILIENCE

Second-source at design, because shortage costs a redesign

Semiconductors carry roughly 46% of cost of goods sold, and the semiconductor allocation through 2021 and 2022 forced manufacturers to redesign boards around whatever devices happened to be available rather than around cost or performance. Qualifying alternate devices during development costs engineering time and almost no money at all, which is the whole point. Doing exactly the same work during a shortage instead costs a full redesign, an expedite premium, and frequently a production stoppage on top of both of those.
04 / REDESIGN CALENDAR DISCIPLINE

Applications are contestable once every nine years

Motor architecture is genuinely reconsidered only at a platform redesign, arriving roughly every nine years in automotive body applications and considerably less often than that in appliances and industrial equipment. Commercial effort spread evenly across accounts is very largely wasted against a decision pattern that is this discontinuous and this predictable. Engaging during design rather than during purchasing is what actually decides these awards, and the redesign calendars themselves are entirely knowable to any supplier prepared to maintain them properly.

Engagement Snapshot From the Field

A live engagement with an industry participant carrying material or product regulatory and market exposure ahead of a defining policy shift, showing how our research translates into a defensible multi-year portfolio strategy.
MARKET MINDS ADVISORY · CLIENT ENGAGEMENT SUMMARY
Brush Motor Control Unit Producer Strategic Portfolio Review and Transition Roadmap 2026·Investment Scenario on Brush Motor Control Unit Exposure Evaluation 2025-26
CLIENT PROFILE
A motor control electronics manufacturer with approximately 118 million dollars in annual revenue (client-reported, unverified by MMA), supplying brushed motor control units into appliance, automotive body, and industrial applications from two plants. Appliance volume carried most of the revenue, aftermarket sales were negligible, and management viewed the whole brushed portfolio as a declining business to be harvested.
STRATEGIC CHALLENGE
Management proposed winding down brushed controller investment and redirecting engineering toward brushless products where competition was considerably stronger. The board wanted an independent view on whether the brushed business was genuinely declining before abandoning a position it had held profitably for years. The portfolio had never been analysed by application. Aftermarket demand was entirely unmeasured.
MMA APPROACH
We analysed the client's own volumes by application against platform redesign timing to identify where substitution had actually occurred. Aftermarket demand for the client's installed base was estimated from distributor and independent supplier activity. Margins were compared across appliance, automotive, industrial, and diagnostic-capable products, and semiconductor sourcing exposure was reviewed across every active design.
KEY FINDINGS
  1. Substitution had occurred almost entirely in Western European appliance and automotive applications, while industrial and emerging market volumes had grown steadily across the same period.
  2. Independent suppliers were serving replacement demand into the client's own installed base, at prices well above what the client charged its original equipment customers.
  3. Diagnostic-capable units sold into industrial customers carried gross margins far above the appliance volume that dominated the client's revenue and engineering attention.
  4. A majority of active designs depended on single-sourced microcontroller families with no qualified alternates, repeating the exposure that had halted production earlier.
CLIENT PROFILE
A motor control electronics manufacturer with approximately 118 million dollars in annual revenue (client-reported, unverified by MMA), supplying brushed motor control units into appliance, automotive body, and industrial applications from two plants. Appliance volume carried most of the revenue, aftermarket sales were negligible, and management viewed the whole brushed portfolio as a declining business to be harvested.
STRATEGIC CHALLENGE
Management proposed winding down brushed controller investment and redirecting engineering toward brushless products where competition was considerably stronger. The board wanted an independent view on whether the brushed business was genuinely declining before abandoning a position it had held profitably for years. The portfolio had never been analysed by application. Aftermarket demand was entirely unmeasured.
MMA APPROACH
We analysed the client's own volumes by application against platform redesign timing to identify where substitution had actually occurred. Aftermarket demand for the client's installed base was estimated from distributor and independent supplier activity. Margins were compared across appliance, automotive, industrial, and diagnostic-capable products, and semiconductor sourcing exposure was reviewed across every active design.
KEY FINDINGS
  1. Substitution had occurred almost entirely in Western European appliance and automotive applications, while industrial and emerging market volumes had grown steadily across the same period.
  2. Independent suppliers were serving replacement demand into the client's own installed base, at prices well above what the client charged its original equipment customers.
  3. Diagnostic-capable units sold into industrial customers carried gross margins far above the appliance volume that dominated the client's revenue and engineering attention.
  4. A majority of active designs depended on single-sourced microcontroller families with no qualified alternates, repeating the exposure that had halted production earlier.
RECOMMENDED STRATEGY
Phase 1: Phase 1 (months one to nine): halt the wind-down, qualify second-source devices across the constrained microcontroller families in active designs. Phase 2: Phase 2 (months nine to twenty-four): build an aftermarket catalogue and distributor channel serving the client's own installed base directly. Phase 3: Phase 3 (months twenty-four to forty-two): shift engineering toward diagnostic-capable modules for industrial and material handling customers. across both regions served.
OUTCOME
The wind-down was cancelled. Second-source qualification was completed across the majority of active designs within three quarters, the first aftermarket catalogue revenue arrived within two, and diagnostic module development was funded from the appliance business rather than replacing it (client-reported, unverified by MMA). Engineering headcount was retained throughout.

Frequently Asked Questions

Foundational context covering the market sizes, CAGR, scope, country, region and competition that inform every finding below. This section is provided to cover basics and most often pre-purchase conversations, answered from the MMA Primary Research Dataset.

What is the current size of the Brush Motor Control Unit Market?

The market is valued at USD 3.6 billion in 2025, rising to USD 3.76 billion in 2026. Scope covers electronic control units driving brushed direct current motors, not brushless controllers, variable frequency drives, or the motors themselves.

How large will the Brush Motor Control Unit Market be by 2036?

MMA forecasts USD 5.78 billion by 2036, an increase of USD 2.02 billion over the 2026 base. That represents an expansion multiple of 1.54 times across the forecast period.

What is the CAGR for the Brush Motor Control Unit Market 2026 to 2036?

The base case CAGR is 4.4%, with a bull case of 5.6% and a bear case of 3.2%. The historical rate from 2020 to 2025 was 3.4%, shaped more by semiconductor allocation than by substitution.

Which segment is growing fastest?

Integrated motor control modules with diagnostics at 6.6%, exactly 1.50 times the market rate. Predicting brush wear converts unplanned breakdown into scheduled maintenance, which efficiency arguments never achieved.

Who are the major companies in the Brush Motor Control Unit Market?

Robert Bosch, Denso, Nidec, Mabuchi Motor, and Johnson Electric lead on units shipped. The top five hold only 38%, because design authority sits with equipment makers rather than with component suppliers.

Which country is growing fastest?

India at 6.0%, where appliance and two-wheeler manufacturing builds to cost targets that make brushed architectures the rational engineering choice rather than a legacy one.

Report Segmentation Architecture

The full report scope spans multiple orthogonal segmentation dimensions, with cross-tabulated demand data provided for each dimension pair. Coverage extends further to regional breakdowns, trend trajectories, and the competitive detail needed to support segment-level decision-making.

By Application Environment And Capability

  • Automotive Body And Comfort Motor Controllers
  • Appliance And Power Tool Control Boards
  • Industrial And Material Handling Controllers
  • Integrated Modules With Diagnostic Capability
  • Aftermarket And Replacement Control Units

By End-Use Industry

  • Automotive Vehicle Manufacturing
  • Domestic Appliances And Consumer Products
  • Power Tools And Garden Equipment
  • Warehouse And Material Handling Equipment
  • Industrial Machinery And Automation

By Commercial Model

  • Direct Supply To Equipment Manufacturers
  • Build To Customer Drawing Contract Supply
  • Integrated Motor And Controller Assembly
  • Aftermarket Distribution And Catalogue Sales
  • Design Services And Application Engineering

By Region

  • East Asia
  • North America
  • Western Europe
  • South Asia and Pacific
  • Latin America
  • Middle East and Africa
  • Eastern Europe

Scope, Methodology, and Coverage

Every figure in this report is reproducible from documented input assumptions. The scope below maps the historical period, the forecast horizon, the segmentation dimensions, and the countries covered, alongside the underlying primary and qualitative methodology.
Historical Period
2020 to 2025
Forecast Period
2026 to 2036
Base Year
2025 (USD billions; MMA Primary Research Dataset, August 2026)
Market Definition
This market comprises electronic control units designed to drive brushed direct current motors, measured at manufacturer revenue across original equipment and aftermarket channels. Coverage spans automotive body and comfort motor controllers, appliance and power tool motor control boards, industrial and material handling motor controllers, integrated motor control modules incorporating diagnostic capability, and aftermarket and replacement control units. Brushless direct current motor controllers, alternating current variable frequency drives, traction inverters and power electronics for electric vehicle propulsion, the electric motors themselves whether sold separately or integrated, servo and stepper motor drives, and general purpose microcontrollers sold without a committed motor control application fall outside scope.
Quantitative Units
USD billions (current prices); control units shipped annually; average selling price by application; original equipment against aftermarket split
Segmentation Dimensions
By Application Environment And Capability; By End-Use Industry; By Commercial Model; By Region
Regions Covered
East Asia, North America, Western Europe, South Asia and Pacific, Latin America, Middle East and Africa, Eastern Europe
Countries Covered
China, Japan, South Korea, Taiwan, United States, Canada, Mexico, Germany, France, Italy, Spain, United Kingdom, India, Thailand, Vietnam, Australia, Brazil, Argentina, Saudi Arabia, United Arab Emirates, South Africa, Poland, Czechia, Slovakia, and additional markets relevant to this sector
Key Companies Profiled
Robert Bosch, Denso, Nidec, Mabuchi Motor, Johnson Electric, Melexis, Infineon Technologies, STMicroelectronics, Texas Instruments, Allegro MicroSystems, Rohm Semiconductor, Mitsuba Corporation, Valeo, Brose Fahrzeugteile, Buhler Motor, Portescap, Maxon Motor, Shinano Kenshi, Wellings Holding, Zhejiang Founder Motor
Quantitative Methodology
Primary survey, n=3,800 respondents, Q4 2025, six countries; demand-side model with trade association cross-validation
Qualitative Methodology
47 expert interviews, Q4 2025; applied to validate demand model assumptions, identify emerging dynamics, and assess competitive positioning
Report Format
PDF and XLSX data workbook (Word format preview document)
Publisher
Market Minds Advisory
Report Code
MMA-2026-AUT-644
Published
August 2026
Contact
sales@marketmindsadvisory.com | www.marketmindsadvisory.com

Purchase the full Brush Motor Control Unit Market Report (2026 to 2036).

The full report sizes brush motor control units across five application categories, five end-use industries, five commercial models, and seven regions, with original equipment separated from aftermarket revenue throughout. Requalification economics are modelled against remaining product life, since that calculation rather than any technology comparison explains why substitution keeps failing to arrive. Platform redesign calendars are mapped by application to identify when architecture is genuinely contestable. Competitive profiling covers twenty companies on units shipped, semiconductor sourcing exposure is assessed across active design populations, and diagnostic module adoption is analysed by downtime cost sensitivity.
Original equipment separated from aftermarket revenue throughout
Requalification economics modelled against remaining product life
Platform redesign calendars mapped by application and region
Semiconductor sourcing exposure assessed across active designs
Diagnostic module adoption analysed by downtime cost sensitivity
Brushless substitution tracked by application rather than in aggregate

Built For The People Who Decide

From boardroom strategy to bench-side execution, this report is read cover-to-cover by leaders shaping the next decade of their industry, turning demand scenarios, market dynamics and valuation benchmarks into decisions.
CXOs/ Presidents/ VPs/ Managers
M&A and Corporate Development
Strategy Teams and R&D Heads
Procurement and Product Directors
Regulatory and Compliance Leaders
Investor Relations and Equity Analysts