Market Minds Advisory
Brominated Vegetable Oil Market

Brominated Vegetable Oil Market: Brominated Vegetable Oil Market. Regulatory Withdrawal, Substitute Emulsifiers, and Residual Market Supply Shape Beverage Additive Value.

Brominated vegetable oil once held citrus flavour in soft drinks, and regulatory bans, reformulation to substitutes, and shrinking permitted markets now decide how quickly remaining demand fades and who supplies the last volumes.

Lead Analyst

Published

September 2026

Make Smarter Decisions with Customized Research Insights

Request a free sample report and evaluate market opportunities, growth trends, and competitive dynamics relevant to your business needs.

2025 MARKET VALUE$0.1BMarket Size 2025
2036 FORECAST VALUE$0.1BBase Case , 2026 to 2036
CAGR 2026 TO 2036-3.8 %Bull -2.5% / Bear -5.1%
INCREMENTAL OPPORTUNITY$-0.0BNet 10- year value creation
EXPANSION MULTIPLE0.68x2036 value over 2026 base
Strategic Levers
M&A Pipeline
Regional Outlook
Country Rankings
Competitive Intelligence
Segmental Deep-dive
Call-Us : 91 93563 13602

Executive Snapshot and Market Trajectory.

Brominated vegetable oil is a market in retreat. It kept citrus flavour oil suspended in soft drinks, then regulators in the United States, Europe, Japan, and other markets took it off the permitted list. What remains is a shrinking pool of legacy demand where rules have not yet changed.
Export and residual-market beverage supply declines least, as brand owners in markets where authorisation remains keep buying while reformulation lags. Latin America holds the largest share because permitted-market soft drink makers still use it, while Middle East and Africa follows and South Asia and Pacific declines slowest. Rules set the ceiling. Substitutes set the pace. Cost keeps the last buyers. Buyers reward consistency over novelty.
Competition is concentrated among bromine and specialty chemical suppliers, with an Israeli bromine group, two American chemical groups, a German chemical group, and a Japanese chemical group competing alongside small toll processors on supply continuity, purity, and price. Regulation is the dominant force. Suppliers own bromine. Processors own blending. Compliance decides who may sell. Buyers reward consistency over novelty. Supply contracts decide renewal. Delivery reliability decides supplier rankings. Margins follow sourcing discipline.
Market Definition
The brominated vegetable oil market covers vegetable oil chemically modified with bromine and used as a weighting agent to keep citrus flavour oils suspended in beverages, sold to beverage and flavour makers in markets where its use remains authorised, including carbonated citrus soft drink weighting agent, sports and energy drink emulsions, flavour emulsion concentrates, export and residual-market beverage supply, and specialty and non-beverage emulsion uses. The scope excludes substitute weighting agents such as ester gum and sucrose acetate isobutyrate, bromine chemicals, and flame retardants.
Base Year Value
$0.1B in 2025 (MMA Primary Research Dataset, September 2026)
Forecast Period
2026 to 2036, eleven discrete annual values
CAGR
-3.8% base case. Bull -2.5%. Bear -5.1%.
Fastest Growth Segment
Export and Residual-Market Beverage Supply: 1.6% CAGR
Fastest Growth Country
Brazil: 0.8% CAGR
Fastest Growth Region
South Asia and Pacific: -1.8% CAGR
Largest Region
Latin America: 30% of 2025 global value
Market Leaders
ICL Group, Albemarle, Lanxess, Tosoh Corporation, Gulf Resources. Source: MMA Analysis, company annual reports.
Primary Survey
n=3,800 procurement and R&D decision-makers, Q4 2025, six countries
Methodology
Demand-side build-up, cross-validated against public data, 47 expert interviews

Brominated Vegetable Oil Market Forecast Scenarios

brominated-vegetable-oil-market-size-forecast-scenario-1789830187403
From 2020 to 2025, brominated vegetable oil declined as brand owners in the United States, Canada, and other markets reformulated ahead of regulatory action, and authorities withdrew authorisation. Vegetable oil and bromine costs rose from 2021, and suppliers passed on part of the increase to shrinking customer lists. The decline ran slightly faster than the forecast pace as several major
The base case rests on three commercial mechanisms. First, additional markets tighten rules on brominated additives, removing more volume. Second, brand owners in remaining permitted markets reformulate to ester gum, sucrose acetate isobutyrate, and starch systems for global consistency. Third, a small tail of legacy and specialty demand persists where authorisation stays and substitutes cost more. Suppliers plan inventory, exit timing, and substitute supply around all three, and pricing follows. Beverage makers review suppliers every season.
The upside case needs slower regulatory action in permitted markets, which would extend legacy demand. The downside case is faster bans combined with brand owner pledges to remove the additive globally, which would remove volume within a few seasons. Batch records protect future sales. Cost control separates leaders from followers. Clear specifications build buyer trust. Technical reach compounds over time.

Regulatory Withdrawal, Substitute Emulsifiers, and Residual Supply Decide Brominated Oil Outcomes

The brominated vegetable oil market spans a supply chain from bromine mine to beverage bottle. Suppliers extract bromine from brines, chemical processors react it with vegetable oil such as soybean or corn oil, purify the product, and sell it to flavour houses and beverage makers. Flavour emulsions containing the oil are then blended into citrus soft drinks and sports beverages. Buyers reward consistency over novelty.
MARKET CONCENTRATION58% CR5Leading five suppliers hold a high combined share
VEGETABLE OIL SHARE62%Portion of goods cost taken by vegetable oil feedstock
BROMINE CONTENT8%Typical bromine share of the modified oil by weight
TYPICAL USE LEVEL15 ppmHighest use level formerly permitted in finished beverages
SUBSTITUTE PRICE PREMIUM25%Typical extra cost of substitute weighting agent systems
PERMITTED MARKET SHARE32%Portion of global soft drink volume where use remains authorised
Regulatory access, purity, and cost decide value. Buyers judge the oil on density adjustment, emulsion stability, residual bromine, and price, so a supplier needs bromine supply, processing control, and compliance records. Bromine producers own feedstock and scale, while processors own blending skill. Suppliers with consistent lots, reliable delivery, and clear compliance files win because beverage makers reorder only from suppliers that never lose regulatory standing.
Buyers judge weighting agents on stability, clarity, regulatory status, and cost. Brand owners want emulsions that keep flavour suspended for months, retailers want no ingredients that draw criticism, and regulators want safe additives. Price sensitivity is high because substitutes exist, which pushes suppliers toward long contracts in permitted markets, substitute portfolios, and careful inventory management. Supply contracts decide renewal. Delivery reliability decides supplier rankings.
"Brominated vegetable oil is a case study in how fast a functional additive can become a liability. It worked well and cost little. That did not matter once regulators and brands decided the risk was not worth carrying. The only open question is how long the tail lasts."
Senior Analyst, Specialty Additives Practice · MMA Brominated Vegetable Oil Practice · September 2026

Market Trends

Regulators Withdraw Authorisation in Major Beverage Markets Ahead of Reformulation

The United States revoked authorisation in 2024 after safety findings on thyroid and other effects, following earlier withdrawals in the European Union and Japan, and other markets are reviewing their rules. Regulators in the largest beverage markets now treat the additive as unacceptable. The trend removes volume in steps, forces reformulation deadlines, and rewards suppliers that plan orderly exits and offer substitute systems. Margins follow sourcing discipline. Beverage makers review suppliers every season. Batch records protect future sales. Cost control separates leaders from followers. Clear specifications build buyer trust. Small suppliers feel every regulatory change.
Market Impact: substitutes add 15-40% to weighting cost
Ester Gum, Isobutyrate, and Starch Systems Replace Brominated Weighting Agents

Beverage makers reformulate with glycerol ester of wood rosin, sucrose acetate isobutyrate, and modified starch or gum arabic systems, at costs 15% to 40% above the brominated oil. Substitute weighting systems already hold most of the global market. The trend accelerates the decline of brominated oil and rewards suppliers that offer application support, stability trials, and multi-system portfolios for reformulating brands. Technical reach compounds over time. Buyers reward consistency over novelty. Supply contracts decide renewal. Delivery reliability decides supplier rankings. Margins follow sourcing discipline. Beverage makers review suppliers every season. Batch records protect future sales.
Market Impact: soft drinks grow 3-5% yearly

Market Opportunities and Growth Drivers

Cost and Performance Advantages Keep Some Buyers Where Use Remains

Brominated vegetable oil adjusts density precisely at use levels near 15 parts per million and costs less than substitute systems, so smaller beverage makers in markets where authorisation remains keep using it. Substitute systems can add 15% to 40% to weighting agent cost. The driver supports a shrinking tail of demand and rewards suppliers that offer reliable supply, stable pricing, and clear compliance documentation for those buyers. Cost control separates leaders from followers. Clear specifications build buyer trust. Small suppliers feel every regulatory change. Technical reach compounds over time. Buyers reward consistency over novelty.
Market Impact: one ban removes 15-30% of demand

Emerging Market Soft Drink Growth Sustains Some Residual Demand

Soft drink volumes grow 3% to 5% a year in parts of Latin America, Africa, and Asia, and local bottlers using citrus flavour emulsions may keep legacy formulas where rules are lenient. Residual-market supply grows about 1.6% a year even as the global market declines. The driver supports the least-declining segment and rewards suppliers with regional distributors and flexible pack sizes. Supply contracts decide renewal. Delivery reliability decides supplier rankings. Margins follow sourcing discipline. Beverage makers review suppliers every season. Batch records protect future sales. Cost control separates leaders from followers. Clear specifications build buyer trust.
Market Impact: pledges remove volume within 2-3 seasons

Market Restraints and Challenges

Regulatory Bans and Health Concerns Remove Volume From Major Markets

Brominated vegetable oil can accumulate in body fat and studies linked high intake to thyroid and nervous system effects, so regulators in the United States and other large markets withdrew authorisation. The root cause is safety evidence and precaution. Suppliers respond with exit plans and substitute portfolios, though a single regulatory decision can remove 15% to 30% of demand within a year and stranded inventory becomes a write-off. Small suppliers feel every regulatory change. Technical reach compounds over time. Buyers reward consistency over novelty. Supply contracts decide renewal. Delivery reliability decides supplier rankings.
Market Impact: United States revoked authorisation in 2024

Brand Pledges and Retailer Policies Accelerate Reformulation Beyond Laws

Global beverage brands and retailers set policies to remove controversial additives ahead of laws, and consumer groups publicise ingredient lists. The root cause is reputation risk and the availability of substitutes. Suppliers respond with grace-period pricing and support for reformulation, though brand pledges can remove volume in permitted markets within two to three seasons and leave contracts unfulfilled. Margins follow sourcing discipline. Beverage makers review suppliers every season. Batch records protect future sales. Cost control separates leaders from followers. Clear specifications build buyer trust. Small suppliers feel every regulatory change. Technical reach compounds over time.
Market Impact: substitutes cost 15-40% more
3 additional market trends, 2 additional growth drivers, and 4 additional restraints and challenges are covered in the full report. Contact sales@marketmindsadvisory.com to access the complete intelligence.

Segment CAGR and Growth Architecture

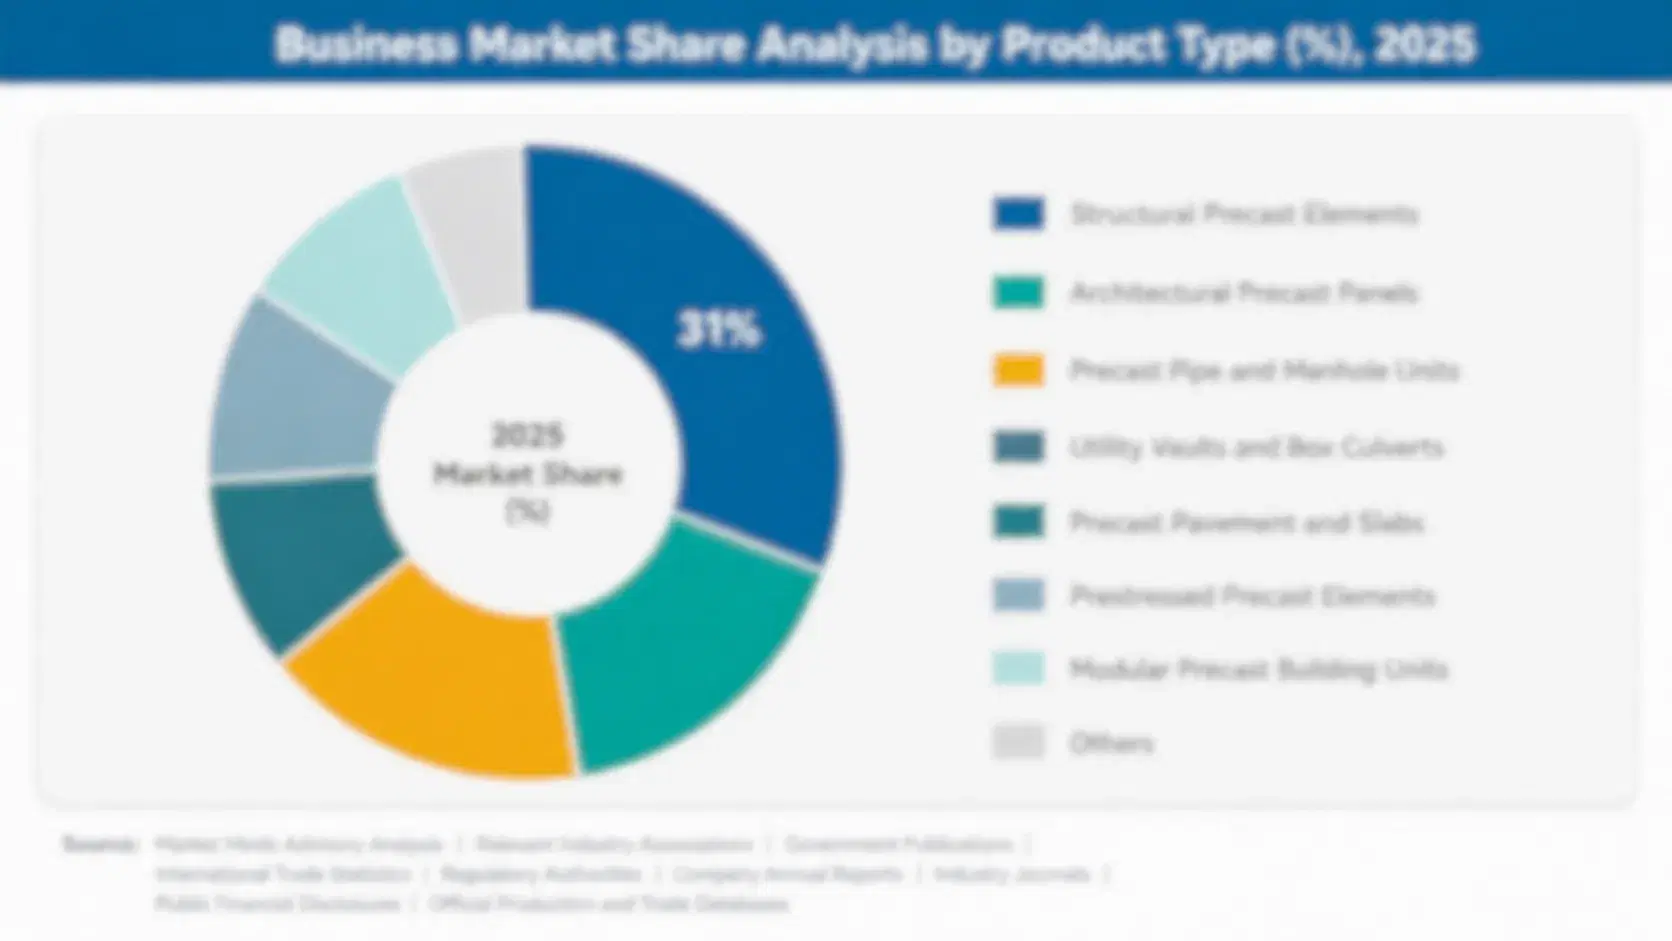
The brominated vegetable oil market is segmented by application, which shows where residual demand persists and where volume is being lost fastest. Five segments cover carbonated citrus soft drink weighting agent, sports and energy drink emulsions, flavour emulsion concentrates, export and residual-market beverage supply, and specialty and non-beverage emulsion uses. Two segments decline least on permitted-market supply and
brominated-vegetable-oil-market-market-share-analysis-1789830187735

Export and Residual-Market Beverage Supply

Export and Residual-Market Beverage Supply is the least-declining segment, growing 1.6% a year while the overall market falls 3.8%. Bottlers in markets where authorisation remains and substitutes are costly keep buying, and pricing can hold at premiums of 10% to 20% over legacy levels because few suppliers remain. Regulatory change and brand pledges are the main risks, since one decision can end a customer. Suppliers with compliance files and inventory control win. Buyers reward consistency over novelty. Supply contracts decide renewal. Delivery reliability decides supplier rankings. Margins follow sourcing discipline. Beverage makers review suppliers every season. Batch records protect future sales. Cost control separates leaders from followers. Clear specifications build buyer trust.
CAGR 1.6%

Specialty and Non-Beverage Emulsion Uses

Specialty and Non-Beverage Emulsion Uses grows 0.9% a year, because industrial and specialty formulators in markets where rules allow keep using brominated oils for density and stability in niche emulsions, and buyers accept premiums of 10% to 25% for supply continuity. Volume is small and depends on a few customers, which makes the segment fragile. Suppliers with technical service and long contracts hold price better than followers while regulators review rules. Small suppliers feel every regulatory change. Technical reach compounds over time. Buyers reward consistency over novelty. Supply contracts decide renewal. Delivery reliability decides supplier rankings. Margins follow sourcing discipline. Beverage makers review suppliers every season. Batch records protect future sales. Cost control separates leaders from followers.
CAGR 0.9%
Full segment breakdown across 5 segments available in the complete report.

Regional Architecture and Country Demand Map

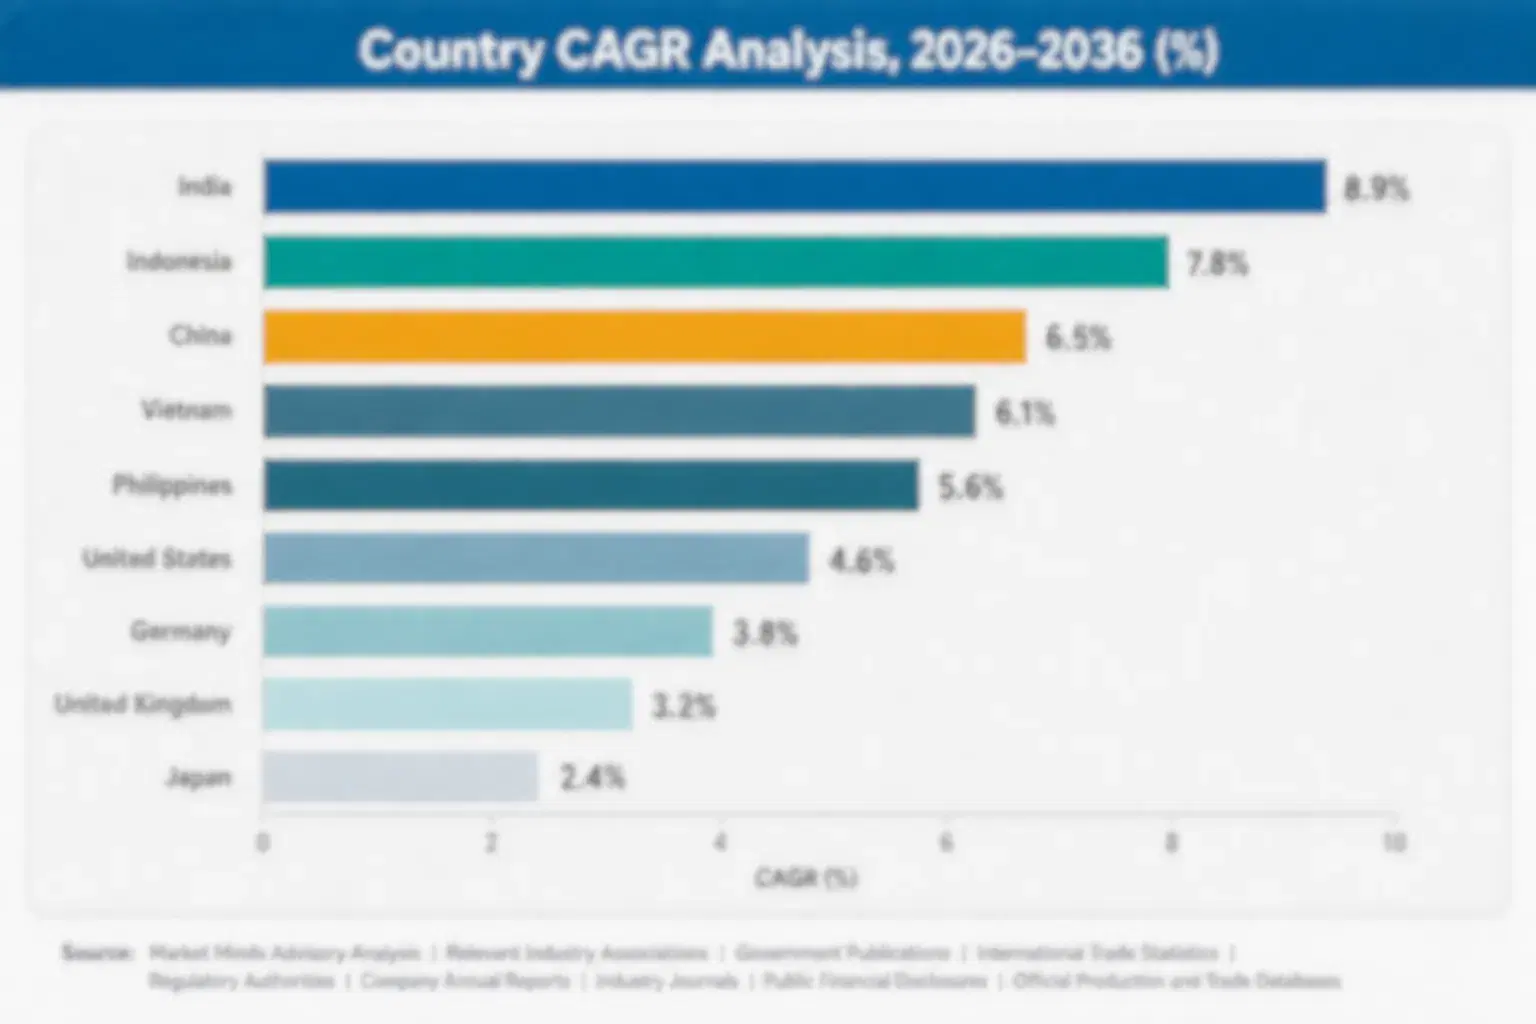
Latin America holds the largest share because bottlers in markets where authorisation remains still use the additive, while Middle East and Africa follows. South Asia and Pacific declines slowest, and North America, East Asia, and Western Europe hold below-band shares after bans, with Eastern Europe smaller.

Latin America

Latin America holds 30% share, far above its usual band, because soft drink makers in several markets where authorisation remains have kept brominated weighting agents in citrus and flavour emulsion recipes, and regional bottlers and flavour houses hold most remaining volume. Decline is slower than the global rate as regulatory action lags. Currency swings, brand owner pledges, and substitute availability restrain margins, and rules are under review in several countries. Clear specifications build buyer trust. Small suppliers feel every regulatory change. Technical reach compounds over time. Buyers reward consistency over novelty. Supply contracts decide renewal. Delivery reliability decides supplier rankings. Margins follow sourcing discipline. Beverage makers review suppliers every season. Batch records protect future sales.
Share: 30% | CAGR: -3.4% (2026 to 2036)

Middle East and Africa

Middle East and Africa holds 24% share, far above its usual band, because Gulf, North African, and sub-Saharan bottlers in markets where authorisation remains buy imported weighting agents for citrus drinks, with local distributors supplying small lots. Decline tracks the global rate as global brands standardise formulas. Currency shortages, import documentation, and regulatory review restrain margins, and volumes depend on a few large bottlers. Cost control separates leaders from followers. Clear specifications build buyer trust. Small suppliers feel every regulatory change. Technical reach compounds over time. Buyers reward consistency over novelty. Supply contracts decide renewal. Delivery reliability decides supplier rankings. Margins follow sourcing discipline. Beverage makers review suppliers every season. Batch records protect future sales.
Share: 24% | CAGR: -3.9% (2026 to 2036)
Regional intelligence for 5 additional markets available in the complete report: South Asia and Pacific, North America, East Asia, Western Europe, Eastern Europe. Contact sales@marketmindsadvisory.com.
brominated-vegetable-oil-market-country-cagr-analysis-1789830188034

Four Margin Routes for Brominated Oil Suppliers

Margin in a shrinking market comes from managed exits, substitute portfolios, premium pricing in residual markets, and bromine redeployment rather than volume alone. The routes below apply to bromine producers, chemical processors, and flavour houses, and each can start inside one planning cycle, with clear measures in gross margin points, inventory days, and customers converted or retained.

Building Substitute Weighting Agent Portfolios to Convert Reformulating Beverage Customers

Reformulating brands need ester gum, sucrose acetate isobutyrate, and starch systems, and substitute systems earn gross margins of 22% to 30% against 12% to 18% for the legacy oil, so suppliers that add substitute portfolios, run stability trials, and support conversions keep customers and report gross margin gains of 4 to 8 points on the mix. Application labs cost $500,000 to $1.5 million. Cost control separates leaders from followers. Clear specifications build buyer trust. Small suppliers feel every regulatory change. Technical reach compounds over time. Buyers reward consistency over novelty. Supply contracts decide renewal.
Market Impact: substitute portfolios lift gross margin by 4-8 points

Pricing Residual-Market Supply at Premiums While Managing Inventory Tightly

Few suppliers remain in markets where authorisation continues, so pricing can hold at premiums of 10% to 20% over legacy levels, but demand can vanish with one decision. Suppliers that run make-to-order production, limit inventory to 60 days, and secure prepayment or short contracts protect cash and margin. Inventory write-offs can cost 5% to 10% of annual sales, so discipline matters. Delivery reliability decides supplier rankings. Margins follow sourcing discipline. Beverage makers review suppliers every season. Batch records protect future sales. Cost control separates leaders from followers. Clear specifications build buyer trust.
Market Impact: residual pricing holds 10-20% premiums with 60-day stock

Planning Orderly Exits and Redeploying Bromine Into Higher-Growth Chemical Uses

Bromine supply can be redeployed into water treatment, flame retardants, and oilfield brines that grow 2% to 4% a year, so suppliers that plan exit dates, redirect brine capacity, and redeploy processing lines recover 40% to 60% of stranded asset value. Redeployment costs $1 million to $5 million per line. Suppliers should set exit triggers tied to regulatory milestones. Small suppliers feel every regulatory change. Technical reach compounds over time. Buyers reward consistency over novelty. Supply contracts decide renewal. Delivery reliability decides supplier rankings. Margins follow sourcing discipline. Beverage makers review suppliers every season.
Market Impact: redeployment recovers 40-60% of stranded asset value yearly

Monitoring Regulatory Change and Brand Pledges to Time Contract Terms

A single regulatory decision can remove 15% to 30% of demand within a year and brand pledges can remove volume in two to three seasons, so suppliers that track regulators, brand announcements, and retailer policies and set contract terms with exit clauses reduce stranded risk. Monitoring programmes cost $100,000 to $300,000 a year. Suppliers should review contract terms quarterly. Batch records protect future sales. Cost control separates leaders from followers. Clear specifications build buyer trust. Small suppliers feel every regulatory change. Technical reach compounds over time. Buyers reward consistency over novelty. Supply contracts decide renewal.
Market Impact: monitoring reduces stranded risk in 15-30% demand swings

Who Controls the Margin Pool

The brominated vegetable oil market is concentrated, with a CR5 of 58%, and small toll processors, regional distributors, and flavour houses sit outside the leading five. This assessment measures participants on estimated bromine and brominated additive supply volume, held constant across all players. ICL Group leads through bromine reserves and global reach, while Albemarle, Lanxess, Tosoh Corporation, and Gulf Resources follow, with a clear gap between the leader and the
Competition runs on four dimensions today: regulatory standing and compliance files, bromine feedstock supply, substitute portfolios, and delivery reliability in remaining markets. Bromine producers win on feedstock and scale, while flavour houses win on customer access and substitutes. Imitators enter only where rules allow, so pricing depends on regulatory windows, and competition appears in tender negotiations for shrinking volume. Delivery reliability decides supplier rankings. Margins follow sourcing discipline.

Emerging pressure comes from substitute weighting agent suppliers, brand owner pledges, and regulators in additional markets. Rankings shift where a supplier exits early, converts customers to substitutes, or wins the last permitted-market contracts. Small processors can remain profitable in residual niches, since low overheads and local relationships matter more than global scale. Beverage makers review suppliers every season.
brominated-vegetable-oil-market-company-positioning-matrix-1789830188345

Competitive Moat and Risk Dimensions

ICL GROUP

Moat: Bromine Reserves and Global Reach

ICL Group, an Israeli specialty minerals and chemicals group, is one of the world's largest bromine producers, with reserves in the Dead Sea and downstream chemical plants. Its feedstock position, chemical expertise, and customer relationships give it cost and reach advantages, and its ability to redeploy bromine into other products reduces stranded asset risk.
ICL GROUP

Risk: Regulatory and Reputation Exposure

ICL Group faces reputation and regulatory risk from brominated additives in food applications, and demand for beverage grades is falling fast. Beverage additives are a small share of its earnings, so investment is minimal, and any residual sales invite scrutiny from brand owners and regulators. Batch records protect future sales.
ALBEMARLE

Moat: Bromine Scale and Chemical Range

Albemarle, an American specialty chemicals group, produces bromine and a wide range of bromine derivatives for industrial, energy, and specialty uses. Its bromine scale, process chemistry skills, and broad customer base give it flexibility to redirect capacity, and its diversified portfolio limits exposure to any single additive market.
ALBEMARLE

Risk: Food Additive Wind-Down

Albemarle sees little strategic value in food additive applications where regulation is turning, and a wind-down risks stranded inventory and customer disputes. Specialty processors with local relationships can capture residual niches, while brand owner pledges and regulatory action reduce volumes further. Cost control separates leaders from followers.

Players Tracked

Prominent Players

ICL Group
Albemarle
Lanxess
Tosoh Corporation
Gulf Resources

Other Key Players

Spectrum Chemical
TIC Gums
Ingredion
Ashland
Ingevity
Kerry Group
Symrise
Döhler
Givaudan
Sensient Technologies
Cargill
Archer Daniels Midland
Eastman Chemical
Nexira
Ajinomoto

Recent Developments

JANUARY 2026

Beverage Makers Complete Reformulation Away From Brominated Weighting Agents Ahead of Deadlines

Several large beverage makers completed reformulation away from brominated weighting agents ahead of regulatory deadlines, moving to ester gum and starch systems. It is a reformulation programme, not an acquisition, and it tests how quickly volume leaves legacy suppliers. Volumes were not disclosed. Clear specifications build buyer trust.
Signal: Confirms that large beverage makers are completing reformulation ahead of deadlines, accelerating the decline of legacy weighting agent demand.
FEBRUARY 2026

ICL Group Redirects Bromine Capacity Toward Water Treatment and Flame Retardant Customers

ICL Group redirected bromine capacity toward water treatment and flame retardant customers, reducing exposure to declining food additive uses. It is a capacity redeployment, not an acquisition, and it tests whether bromine can find higher-growth outlets. Investment figures were not disclosed. Small suppliers feel every regulatory change.
Signal: Indicates bromine producers are redirecting capacity into industrial uses as food additive demand fades under regulatory pressure.
MARCH 2026

Flavour Houses Launch Ester Gum and Starch Emulsion Systems as Drop-In Replacements for Bottlers

Flavour houses launched ester gum and starch emulsion systems as drop-in replacements for bottlers using brominated weighting agents. It is a product launch programme, and it tests whether substitute systems can match clarity and stability. Sales volumes were not disclosed. Technical reach compounds over time. Supply contracts decide renewal.
Signal: Suggests flavour houses are launching drop-in substitute emulsion systems to convert bottlers in markets where authorisation is ending.

What Drives Brominated Oil Production Costs

Vegetable oil feedstock, mainly soybean and corn oil, accounts for roughly 62% of cost of goods, bromine about 15%, reaction, purification, and processing about 10%, packaging about 3%, and labour, freight, and compliance about 10%. Bromine comes mainly from Israel, Jordan, China, and the United States, so exposure differs by brine supply and regulation. Beverage makers review suppliers every season.
The clearest recent shock came from regulation rather than feedstock. ICL Group reported in its annual report that specialty chemical demand shifted as regulatory decisions reshaped additive markets, and USDA Foreign Agricultural Service oilseeds data showed soybean oil prices rising in 2021 and 2022. Suppliers raised prices by 10% to 15% on shrinking volume and demand fell faster than cost. Batch records protect future sales. Cost control separates leaders from followers.

The competitive disadvantage falls on small processors, which buy oil and bromine on spot terms, hold stranded inventory, and rely on a few customers. Large bromine producers own feedstock, redeploy capacity, and spread cost across many products. Exposure also varies by geography, since suppliers in markets with bans face immediate loss while those in permitted markets face gradual decline.
brominated-vegetable-oil-market-cost-volatility-analysis-1789830188646

Producing to Order and Limiting Inventory Days

Suppliers switch to make-to-order production, limit finished inventory to 60 days, and secure short contracts or prepayment for remaining customers. Matching production to orders cuts write-off risk by roughly half, though it needs flexible plants and close customer communication. Discipline matters more than forecasts in a shrinking market. Clear specifications build buyer trust. Small suppliers feel every regulatory change.

Writing Exit Clauses and Regulatory Triggers Into Contracts

Suppliers write exit clauses and regulatory triggers into customer contracts so supply can stop when authorisation ends. Clauses cut stranded inventory risk by 30% to 50% and clarify liability. The main challenge is customer acceptance, so suppliers explain regulatory monitoring, offer substitute support, and pair terms with price certainty. Technical reach compounds over time. Buyers reward consistency over novelty.

Redeploying Bromine and Processing Lines Into Other Products

Suppliers redirect bromine and processing lines into water treatment, flame retardants, and oilfield chemicals with growth of 2% to 4% a year. Redeployment recovers 40% to 60% of stranded asset value. The main challenge is capital and requalification, so suppliers phase changes and use existing customer relationships in industrial markets. Supply contracts decide renewal. Delivery reliability decides supplier rankings.

Portfolio Architecture for Margin Defence

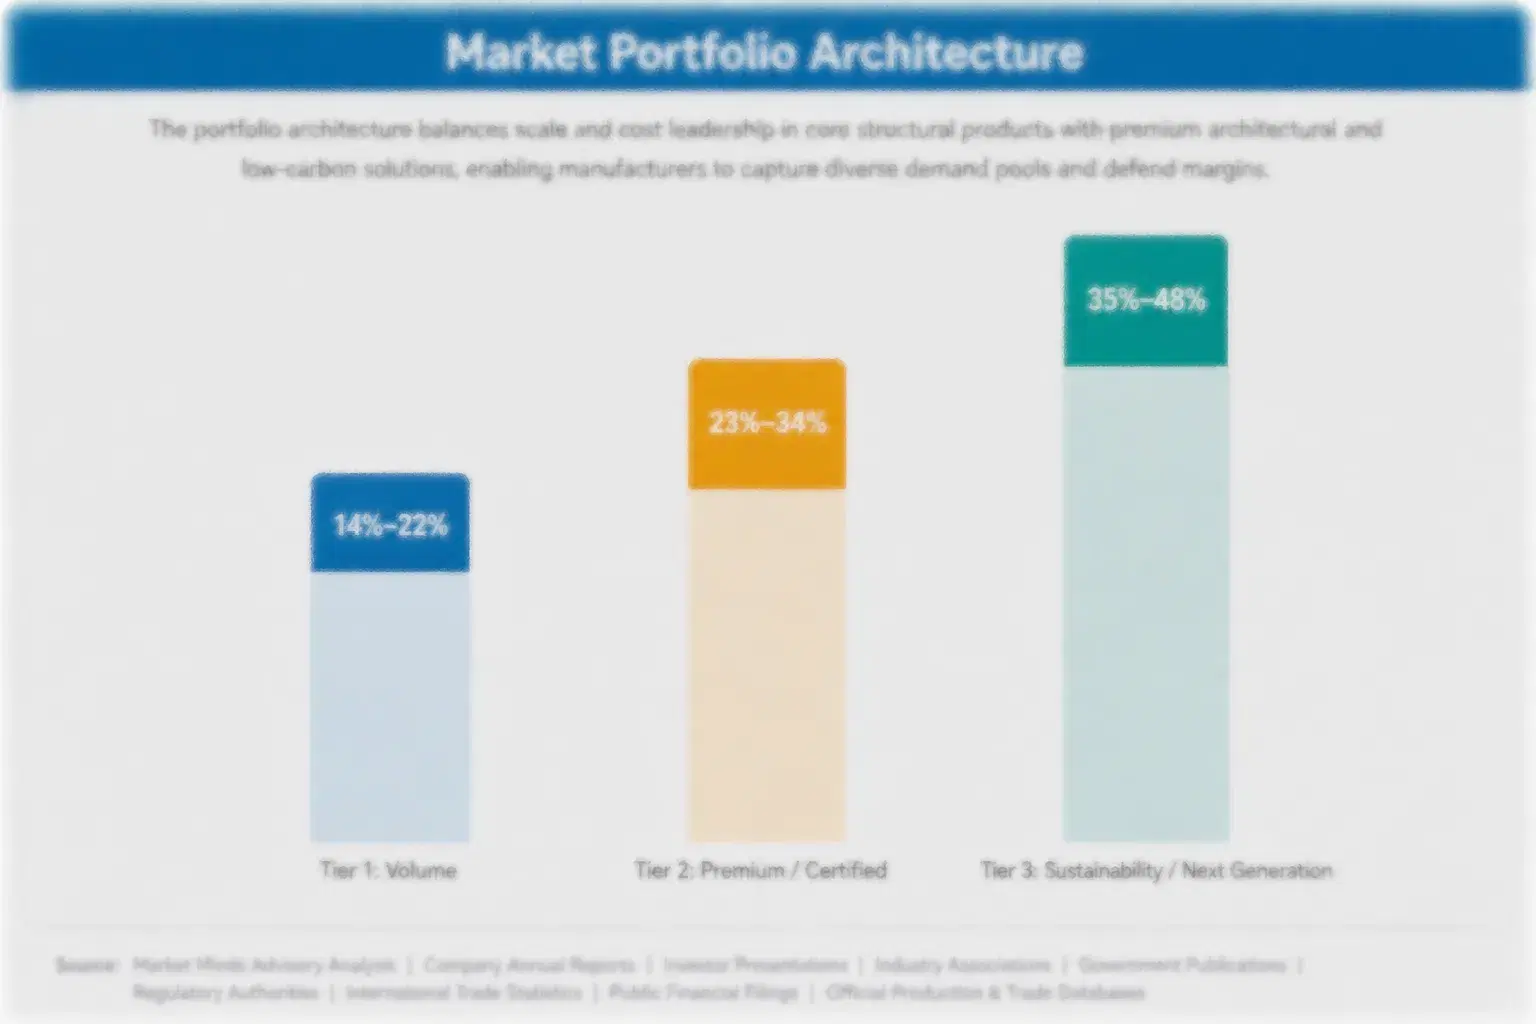
Margins run from thin and shrinking returns on carbonated soft drink weighting agent to moderate returns on residual-market supply sold at premiums, and stronger returns on substitute systems sold with application support. Three tiers separate volume products, certified lines, and next-generation formats, and each tier draws on different customer groups, regulatory status, and contract terms. Cost control separates leaders from followers.
The tension between volume and premium is sharp. Volume brominated oil for soft drinks is losing customers to regulation and reformulation, while premium residual-market supply earns higher margins on smaller volumes and depends on regulatory windows and a few bottlers. Suppliers that run only legacy volume face stranded assets, while suppliers that pivot early to substitute systems lack the customer base to replace lost tonnes quickly. Clear specifications build buyer trust.

High-value pools concentrate in substitute weighting agent systems sold to reformulating brands and in residual-market supply sold at premiums to remaining bottlers. They gather where buyers pay for continuity, compliance support, and application help rather than tonnes. Specialty non-beverage emulsions add small value, since niche formulators ask for density control. Small suppliers feel every regulatory change. Technical reach compounds over time.

Volume / Commodity-Adjacent Tier

Brominated weighting agent for carbonated citrus soft drinks and flavour emulsion concentrates, with shrinking volume, regulatory risk, and constant pressure from substitutes, where buyers reformulate as authorisation ends. Buyers reward consistency over novelty.
Gross Margin: 8%-14%

Premium / Certified Tier

Residual-market supply and specialty non-beverage emulsions with documented purity, regulatory files, and reliable delivery, sold to remaining bottlers and niche formulators that value continuity and pay premiums for scarce supply. Supply contracts decide renewal.
Gross Margin: 14%-22%

Sustainability / Regulatory / Next-Generation Tier

Substitute weighting agent systems using ester gum, sucrose acetate isobutyrate, and starch with application support, sold to reformulating brands that pay for stability, regulatory safety, and clean-label ingredient lists. Delivery reliability decides supplier rankings.
Gross Margin: 22%-30%
brominated-vegetable-oil-market-portfolio-architecture-1789830188962

High-value Sub-segments and Strategic Watch-out

Export and Residual-Market Beverage Supply

Export and residual-market beverage supply declines least, as bottlers in markets where authorisation remains keep buying, and pricing holds at premiums of 10% to 20% because few suppliers remain. Regulatory windows and brand pledges limit duration, and suppliers with compliance files and disciplined inventory win. Volume erodes as rules
Gross Margin: 14%-22%

Specialty and Non-Beverage Emulsion Uses

Specialty and non-beverage emulsion uses hold volume, since niche formulators in permitted markets accept premiums of 10% to 25% for supply continuity and density control. Volume is small and customers are few, so one loss matters. Suppliers with technical service and long contracts win, and exit clauses protect against
Gross Margin: 14%-22%

Carbonated Citrus Soft Drink Weighting Agent

Carbonated citrus soft drink weighting agent forms the volume core but declines about 6.0% a year as global brands reformulate and regulators withdraw authorisation. Margins are thin, stranded inventory is a risk, and suppliers anchor plant utilisation on customers who are leaving. Exit planning and substitute offers decide profit.
Gross Margin: 8%-14%

Sports and Energy Drink Emulsions

Sports and energy drink emulsions are the strategic watch-out, since global brands moved first, volumes fall about 4.0% a year, and remaining customers are small and price sensitive. Suppliers should convert these customers to substitute systems before authorisation ends, because late conversions can cut sales and leave unsellable inventory.
Gross Margin: 8%-14%

Why Beverage Makers Stop Reordering Oil

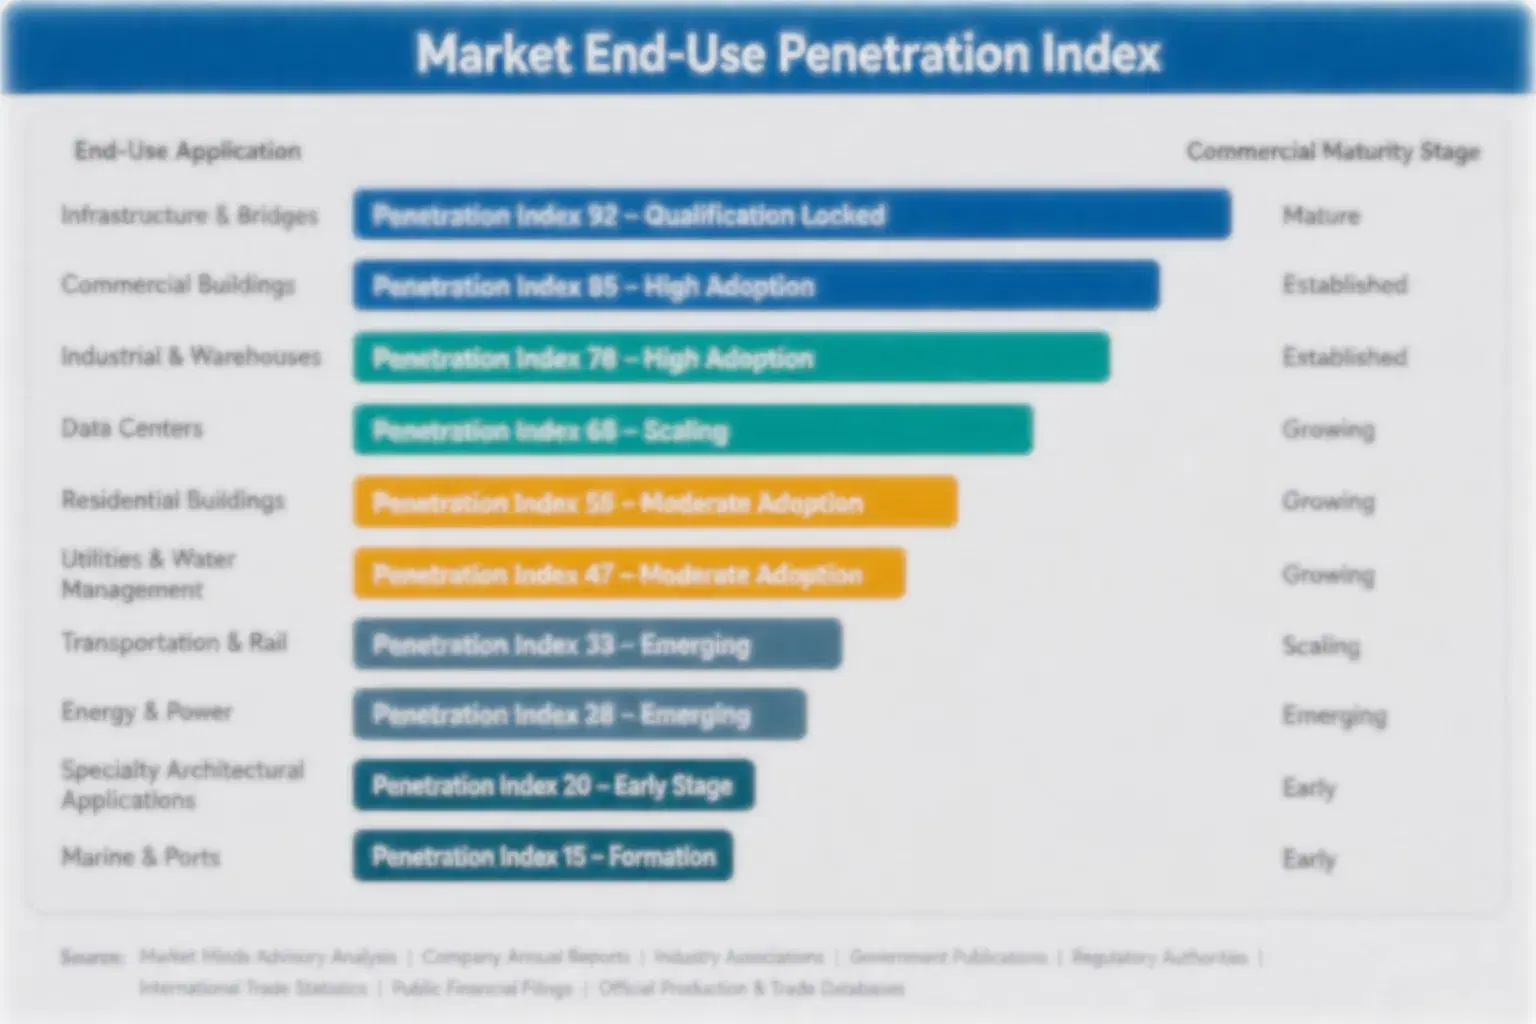
Brominated vegetable oil demand behaves like a wasting annuity. Once a bottler qualifies a weighting agent, it repeats the order every month, but each regulatory decision or brand pledge cancels part of the stream permanently. Bottlers use last quarter's regulatory news and brand policy to decide renewals, so suppliers face steadier volume only in markets where rules are stable and substitutes are costly. Margins follow sourcing discipline.
Adoption stickiness differs by end-use vertical. Small regional bottlers in permitted markets are the deepest, since reformulation costs money and needs technical help, and they change when rules or brand owners force it. Global brand owners are shallow and switch first. Flavour houses follow customers, while niche formulators stay until substitutes match performance. Beverage makers review suppliers every season. Batch records protect future sales.

Buyer profiles are shifting between generations. Older technologists relied on brominated oil for cheap density control, while younger product developers and retail buyers reject controversial additives and ask for clean labels and documented safety. Regulators add a third group that sets the deadlines. Suppliers that offer substitute systems and clear exit plans keep relationships as formulations change. Clear specifications build buyer trust.
brominated-vegetable-oil-market-end-use-penetration-index-1789830189285

MMA Verdict on Brominated Oil Strategy

These are among the four positions where our research anticipates prominent divergence between winners and laggards over the coming forecast period. Each is grounded in the demand model, the regulatory perimeter, and the announced capacity pipeline.
01 / SUBSTITUTE PORTFOLIO STRATEGY

Build Substitute Weighting Agent Portfolios Before Reformulating Brands Choose Rival Suppliers

Reformulating brands need ester gum, sucrose acetate isobutyrate, and starch systems, and substitute systems earn gross margins of 22% to 30% against 12% to 18% for the legacy oil, which is declining 3.8% a year. Suppliers should add substitute portfolios, run stability trials, fund application labs costing $500,000 to $1.5 million, and support conversions. Those that stay with the legacy oil will lose customers to rivals with substitutes, and suppliers with portfolios will keep relationships as authorisation ends across more markets.
02 / RESIDUAL MARKET DISCIPLINE

Price Residual-Market Supply at Premiums and Limit Inventory to Protect Cash

Few suppliers remain in markets where authorisation continues and pricing can hold at premiums of 10% to 20%, but one regulatory decision can end demand and stranded inventory can cost 5% to 10% of annual sales. Suppliers should produce to order, limit stock to 60 days, secure prepayment or short contracts, and write exit clauses into customer agreements. Those that hold large inventory will face write-offs, and disciplined suppliers will collect the remaining premium while rivals absorb losses and unsold stock when the next rule change arrives.
03 / ASSET REDEPLOYMENT STRATEGY

Redeploy Bromine Capacity Into Growing Chemical Uses Before Stranded Assets Erode Value

Bromine can be redirected into water treatment, flame retardants, and oilfield brines that grow 2% to 4% a year, while beverage additive volume falls. Suppliers should set exit triggers tied to regulatory milestones, redirect brine capacity, redeploy processing lines at $1 million to $5 million each, and recover 40% to 60% of stranded asset value. Those that delay will hold idle plants and lose value, and suppliers that move early will redeploy capital into growth markets that reward their capital.
04 / REGULATORY INTELLIGENCE INVESTMENT

Track Regulators and Brand Pledges Closely Before the Next Decision Removes Demand

A single regulatory decision can remove 15% to 30% of demand within a year and brand pledges can remove volume in two to three seasons, while additional markets are opening consultations. Suppliers should track regulators, brand announcements, and retailer policies, budget $100,000 to $300,000 a year for monitoring, review contract terms quarterly, and align production plans with milestones. Those that ignore signals will be caught with inventory, and informed suppliers will exit or convert customers on time and protect cash.

Engagement Snapshot From the Field

A live engagement with an industry participant carrying material or product regulatory and market exposure ahead of a defining policy shift, showing how our research translates into a defensible multi-year portfolio strategy.
MARKET MINDS ADVISORY · CLIENT ENGAGEMENT SUMMARY
Brominated Vegetable Oil Producer Strategic Portfolio Review and Transition Roadmap 2026·Investment Scenario on Brominated Vegetable Oil Exposure Evaluation 2025-26
CLIENT PROFILE
The client is a mid-sized specialty chemical producer with annual sales near $900 million (client-reported, unverified by MMA), a portfolio of bromine derivatives, water treatment chemicals, and a small line of beverage weighting agents sold to flavour houses and bottlers. It had no substitute systems, held six months of finished inventory, and had two customers accounting for 55% of weighting agent sales.
STRATEGIC CHALLENGE
Regulators in major markets had withdrawn authorisation, brand pledges were removing volume in permitted markets, and inventory write-offs threatened earnings. Management needed to decide whether to add substitute systems, run the line for residual markets, or redeploy assets, with limited capital and one dedicated processing unit. Small suppliers feel every regulatory change.
MMA APPROACH
MMA analysed sales, cost, and inventory data across 12 products, interviewed 10 bottler, flavour house, and regulatory contacts, six equipment vendors, and five substitute suppliers, and ran a customer survey on reformulation timing, stability, and price across three regions. It modelled margin by product and customer, tested regulatory scenarios, and ranked options by payback and execution risk.
KEY FINDINGS
  1. Substitute systems sold to reformulating customers could keep 40% of legacy customers and lift margin by six points (client-reported, unverified by MMA). Technical reach compounds over time.
  2. Make-to-order production and 60-day inventory limits could cut expected write-offs from 8% to 3% of annual sales. Buyers reward consistency over novelty. Supply contracts decide renewal.
  3. Redeploying the dedicated unit into water treatment chemicals could recover 50% of stranded asset value within three years. Delivery reliability decides supplier rankings. Margins follow sourcing discipline.
  4. Exit clauses in all remaining contracts could cut expected stranded inventory losses by about 40%. Beverage makers review suppliers every season. Batch records protect future sales.
CLIENT PROFILE
The client is a mid-sized specialty chemical producer with annual sales near $900 million (client-reported, unverified by MMA), a portfolio of bromine derivatives, water treatment chemicals, and a small line of beverage weighting agents sold to flavour houses and bottlers. It had no substitute systems, held six months of finished inventory, and had two customers accounting for 55% of weighting agent sales.
STRATEGIC CHALLENGE
Regulators in major markets had withdrawn authorisation, brand pledges were removing volume in permitted markets, and inventory write-offs threatened earnings. Management needed to decide whether to add substitute systems, run the line for residual markets, or redeploy assets, with limited capital and one dedicated processing unit. Small suppliers feel every regulatory change.
MMA APPROACH
MMA analysed sales, cost, and inventory data across 12 products, interviewed 10 bottler, flavour house, and regulatory contacts, six equipment vendors, and five substitute suppliers, and ran a customer survey on reformulation timing, stability, and price across three regions. It modelled margin by product and customer, tested regulatory scenarios, and ranked options by payback and execution risk.
KEY FINDINGS
  1. Substitute systems sold to reformulating customers could keep 40% of legacy customers and lift margin by six points (client-reported, unverified by MMA). Technical reach compounds over time.
  2. Make-to-order production and 60-day inventory limits could cut expected write-offs from 8% to 3% of annual sales. Buyers reward consistency over novelty. Supply contracts decide renewal.
  3. Redeploying the dedicated unit into water treatment chemicals could recover 50% of stranded asset value within three years. Delivery reliability decides supplier rankings. Margins follow sourcing discipline.
  4. Exit clauses in all remaining contracts could cut expected stranded inventory losses by about 40%. Beverage makers review suppliers every season. Batch records protect future sales.
RECOMMENDED STRATEGY
Phase 1: Phase 1 (Months 1-6): Move to make-to-order production, add exit clauses, and select substitute partners. Cost control separates leaders from followers. Phase 2: Phase 2 (Months 7-24): Launch substitute systems to customers and plan redeployment of the processing unit. Clear specifications build buyer trust. Phase 3: Phase 3 (Months 25-42): Complete redeployment, wind down legacy sales in step with rules, and review margin quarterly. Small suppliers feel every regulatory change.
OUTCOME
Within 42 months, substitute systems replaced 38% of legacy weighting agent sales, inventory write-offs fell to 2% of annual sales, and the processing unit was redeployed at 52% recovery of stranded value (client-reported, unverified by MMA). The client cut top-two customer share to 44% and kept gross margin on beverage additives near 20%.

Frequently Asked Questions

Foundational context covering the market sizes, CAGR, scope, country, region and competition that inform every finding below. This section is provided to cover basics and most often pre-purchase conversations, answered from the MMA Primary Research Dataset.

What is the current size of the Brominated Vegetable Oil Market?

The brominated vegetable oil market was valued at $0.11 billion in 2025. Demand is shrinking as regulators withdraw authorisation and brand owners reformulate, leaving a tail of residual demand in permitted markets.

How large will the Brominated Vegetable Oil Market be by 2036?

The market is projected to fall to $0.07 billion by 2036, from $0.11 billion in 2026. The decline of $0.03 billion reflects regulatory bans, brand pledges, and substitute adoption.

What is the CAGR for the Brominated Vegetable Oil Market 2026 to 2036?

The market is forecast to decline at a rate of 3.8% a year from 2026 to 2036. The upside case reaches minus 2.5% and the downside case minus 5.1%, depending on the pace of regulatory action.

Which segment is growing fastest?

Export and Residual-Market Beverage Supply is the only segment still growing, at 1.6% a year against a market decline of 3.8%. Specialty and Non-Beverage Emulsion Uses follows at 0.9% a year.

Who are the major companies in the Brominated Vegetable Oil Market?

Major suppliers include ICL Group, Albemarle, Lanxess, Tosoh Corporation, and Gulf Resources. Spectrum Chemical, TIC Gums, Ingredion, Ashland, and Ingevity also participate in related emulsifier and weighting agent supply.

Which country is growing fastest?

Brazil is the least-declining country in this market at a growth rate of 0.8% a year, driven by residual soft drink demand where authorisation remains. All other covered countries are flat or shrinking.

Report Segmentation Architecture

The full report scope spans multiple orthogonal segmentation dimensions, with cross-tabulated demand data provided for each dimension pair. Coverage extends further to regional breakdowns, trend trajectories, and the competitive detail needed to support segment-level decision-making.

By Primary Market Dimension

  • Carbonated Citrus Soft Drink Weighting Agent
  • Sports and Energy Drink Emulsions
  • Flavour Emulsion Concentrates
  • Export and Residual-Market Beverage Supply
  • Specialty and Non-Beverage Emulsion Uses

By End-Use Industry

  • Carbonated Soft Drinks
  • Sports and Energy Drinks
  • Flavour and Fragrance Houses
  • Industrial and Specialty Emulsions
  • Export Trading

By Commercial Dimension

  • Direct Bottler Contracts
  • Flavour House Supply
  • Distributors and Traders
  • Toll Processing Arrangements
  • Regulated Export Programmes

By Region

  • Latin America
  • Middle East and Africa
  • South Asia and Pacific
  • North America
  • East Asia
  • Western Europe
  • Eastern Europe

Scope, Methodology, and Coverage

Every figure in this report is reproducible from documented input assumptions. The scope below maps the historical period, the forecast horizon, the segmentation dimensions, and the countries covered, alongside the underlying primary and qualitative methodology.
Historical Period
2020 to 2025
Forecast Period
2026 to 2036
Base Year
2025 (USD billions; MMA Primary Research Dataset, September 2026)
Market Definition
The brominated vegetable oil market covers vegetable oil chemically modified with bromine and used as a weighting agent to keep citrus flavour oils suspended in beverages, sold to beverage and flavour makers in markets where its use remains authorised, including carbonated citrus soft drink weighting agent, sports and energy drink emulsions, flavour emulsion concentrates, export and residual-market beverage supply, and specialty and non-beverage emulsion uses. The scope excludes substitute weighting agents such as ester gum and sucrose acetate isobutyrate, bromine chemicals, and flame retardants.
Quantitative Units
USD billions (sales value); tonnes for volume references
Segmentation Dimensions
By Application; By End-Use Industry; By Commercial Dimension; By Region
Regions Covered
Latin America, Middle East and Africa, South Asia and Pacific, North America, East Asia, Western Europe, Eastern Europe
Countries Covered
Brazil, Mexico, Argentina, Nigeria, Egypt, Saudi Arabia, Indonesia, Australia, United States, Canada, Japan, Germany, and additional markets relevant to this sector
Key Companies Profiled
ICL Group, Albemarle, Lanxess, Tosoh Corporation, Gulf Resources, Spectrum Chemical, TIC Gums, Ingredion, Ashland, Ingevity, Kerry Group, Symrise, Döhler, Givaudan, Sensient Technologies, Cargill, Archer Daniels Midland, Eastman Chemical, Nexira, Ajinomoto
Quantitative Methodology
Primary survey, n=3,800 respondents, Q4 2025, six countries; demand-side model with trade association cross-validation
Qualitative Methodology
47 expert interviews, Q4 2025; applied to validate demand model assumptions, identify emerging dynamics, and assess competitive positioning
Report Format
PDF and XLSX data workbook (Word format preview document)
Publisher
Market Minds Advisory
Report Code
MMA-2026-CHM-535
Published
September 2026
Contact
sales@marketmindsadvisory.com | www.marketmindsadvisory.com

Purchase the full Brominated Vegetable Oil Market Report (2026 to 2036).

The full report delivers a detailed assessment of the brominated vegetable oil market through 2036, covering application, end-use, and channel forecasts, competitive benchmarking of leading suppliers, and input cost analysis. It combines MMA primary research, including a six-country survey of 3,800 respondents and 47 expert interviews, with public statistical and company data. Analysts also model regulatory timelines, substitute adoption paths, and inventory risk. Clients receive segment margin ranges, regulatory maps, and a case study on portfolio strategy. Exit planning and contract clause frameworks are also included for planning.
Ten-year application and end-use decline forecasts
Oil, bromine, and processing cost tracking
Competitive benchmarking of top twenty additive suppliers
Regulatory decision and consultation tracker updates
Regional demand mechanism comparative analysis included
Quarterly primary survey data update access

Built For The People Who Decide

From boardroom strategy to bench-side execution, this report is read cover-to-cover by leaders shaping the next decade of their industry, turning demand scenarios, market dynamics and valuation benchmarks into decisions.
CXOs/ Presidents/ VPs/ Managers
M&A and Corporate Development
Strategy Teams and R&D Heads
Procurement and Product Directors
Regulatory and Compliance Leaders
Investor Relations and Equity Analysts