Market Minds Advisory
Bridge Expansion Joints Market

Bridge Expansion Joints Market: Movement Capacity as the Deciding Specification

Aging highway networks now trigger replacement cycles faster than new bridge construction absorbs, transportation agencies specify movement rating and seismic performance over price, and suppliers without long-span modular systems lose the largest infrastructure contracts outright.

Lead Analyst

David Horsley

Published

September 2026

Make Smarter Decisions with Customized Research Insights

Request a free sample report and evaluate market opportunities, growth trends, and competitive dynamics relevant to your business needs.

2025 MARKET VALUE$3.9BMarket Size 2025
2036 FORECAST VALUE$6.3BBase Case , 2026 to 2036
CAGR 2026 TO 20364.4 %Bull 5.6% / Bear 3.2%
INCREMENTAL OPPORTUNITY$2.2BNet 10- year value creation
EXPANSION MULTIPLE1.54x2036 value over 2026 base
Strategic Levers
M&A Pipeline
Regional Outlook
Country Rankings
Competitive Intelligence
Segmental Deep-dive
Call-Us : 91 93563 13602

Executive Snapshot and Market Trajectory

Transportation agencies increasingly treat expansion joint replacement as a structural safety priority rather than routine maintenance, since joint failure accelerates deck deterioration and can force full bridge closure long before the structure itself reaches the end of its designed service life, creating disruption disproportionate to the component's modest replacement cost.
Modular expansion joints lead growth at 5.8%, roughly 1.32 times the overall rate, as long-span and seismic-zone bridges increasingly require multi-cell systems that single-gap designs cannot accommodate reliably across the movement ranges modern traffic loading and thermal cycling demand. East Asia now holds the largest regional share at 26%, driven by China's sustained high-speed rail and expressway bridge construction program across multiple provinces and municipalities simultaneously, from coastal megacities to inland corridors.
Competitive intensity stays moderate at 32% held by five suppliers, since engineering-intensive custom specification fragments share across dozens of regional fabricators rather than concentrating around a handful of global platforms the way more standardized construction categories often do. Agencies increasingly select suppliers on documented movement capacity and seismic testing data rather than unit price alone across most major infrastructure tenders and design-build procurement processes.
Market Definition
Base Year Value
$3.9B in 2025 (MMA Primary Research Dataset, August 2026)
Forecast Period
2026 to 2036, eleven discrete annual values
CAGR
4.4% base case. Bull 5.6%. Bear 3.2%.
Fastest Growth Segment
Modular Expansion Joints: 5.8% CAGR
Fastest Growth Country
China: 6.5% CAGR
Fastest Growth Region
South Asia and Pacific: 6.3% CAGR
Largest Region
East Asia: 26% of 2025 global value
Market Leaders
Primary Survey
n=3,800 procurement and R&D decision-makers, Q4 2025, six countries
Methodology
Demand-side build-up, cross-validated against public data, 47 expert interviews

Bridge Expansion Joints Market Forecast Scenarios

bridge-expansion-joints-market-size-forecast-scenario-1787300450837
Between 2020 and 2025 the market grew at an estimated 3.9% annually, slowed initially by pandemic-driven construction delays before recovering as deferred infrastructure maintenance programs resumed funding across most major highway networks worldwide. Growth accelerated further after 2022 as new infrastructure funding legislation took effect across several major economies simultaneously, from the United States to the European Union.
Three mechanisms carry the base case to 4.4%. First, aging bridge stock built during the mid-twentieth century infrastructure boom is reaching the end of its original joint service life simultaneously across many networks. Second, seismic retrofit programs in earthquake-prone regions specify modern movement-rated joints replacing outdated rigid designs. Third, new long-span bridge construction in East Asia and the Middle East keeps adding large modular joint demand independent of replacement cycles entirely.
The bull case at 5.6% assumes sustained infrastructure funding commitments across major economies accelerate replacement programs beyond currently budgeted pace and timeline. The bear case at 3.2% assumes fiscal constraints delay planned bridge maintenance programs, pushing agencies to extend joint service life through patching rather than full replacement wherever safety margins still permit that more conservative approach.

Movement Rating as the Governing Specification

Bridge expansion joints sit at the center of structural durability for any highway or rail agency managing an aging bridge inventory, since joint failure accelerates deck corrosion and can force costly emergency closures long before the surrounding structure itself requires attention or major rehabilitation work. Movement capacity engineering, not raw material cost, increasingly separates competing suppliers across major infrastructure tenders and design-build procurement processes worldwide.
MARKET CONCENTRATION (CR5)32%Five suppliers hold moderate share across fragmented fabricator field
AVERAGE SERVICE LIFE20 to 30 yearsTypical operating duration before major joint replacement occurs
TOP PRODUCING COUNTRY SHARE21%China supplies largest share of installed joint manufacturing capacity
REPLACEMENT CYCLE LENGTH15 to 25 yearsJoint systems typically require replacement within this operating window
ELASTOMER COST SHARE28-36% of COGSRubber and steel inputs weigh heavily on production costs today
TRADE INTENSITY24% cross-borderJoint components frequently cross borders before final bridge installation
Commercially, the category behaves like a specialized structural engineering business wrapped inside a broader construction procurement relationship. Suppliers bundle joint hardware with design engineering and installation supervision services under project-specific contracts, which locks agencies into a single qualified vendor across an entire bridge program rather than encouraging component-by-component shopping on price alone. Requalifying a new supplier requires fresh seismic and movement testing documentation.
Over the next decade, expect modular multi-cell systems to keep displacing single-gap designs on major bridges, as seismic design codes tighten and movement demands grow with longer spans across expanding highway and rail networks. Digital monitoring sensors embedded in joint assemblies will also become more common, letting agencies schedule replacement proactively rather than reactively after visible deterioration appears.
"Nobody notices an expansion joint until it fails. Then it's the only thing anyone talks about, and the bridge closes regardless of how sound the deck actually is."
Director, Infrastructure and Structural Components Practice · MMA Construction /

Market Trends

Seismic Retrofit Codes Drive Modular Joint Adoption

Updated seismic design codes across California, Japan, and Turkey now require expansion joints to accommodate significantly larger movement ranges than legacy rigid designs were ever engineered to handle during a major earthquake event. Caltrans and Japan's Ministry of Land, Infrastructure, Transport and Tourism have both mandated modular multi-cell systems on new bridge construction and major retrofit projects across seismically active corridors. Mageba and Maurer have both expanded seismic-rated product lines specifically to meet these tightening requirements, and agencies increasingly specify documented shake-table testing data during vendor qualification rather than relying on calculated movement capacity alone.
Market Impact: Adds 18,000 bridges needing joints
Infrastructure Funding Legislation Accelerates Replacement Cycles

Major infrastructure funding legislation passed across the United States, European Union, and China since 2021 has directed substantial new capital toward bridge rehabilitation programs that had been deferred for years due to constrained state and municipal budgets. Each newly funded bridge rehabilitation project typically includes expansion joint replacement as a core scope item, since deteriorated joints represent one of the most visible and safety-critical deficiencies inspectors flag during routine structural evaluation. Suppliers with proven rapid-installation systems are capturing disproportionate share of these newly funded replacement programs across multiple jurisdictions simultaneously.
Market Impact: Adds 40 long-span bridges yearly

Market Opportunities and Growth Drivers

Aging Bridge Stock Reaches Simultaneous End-of-Life

A substantial share of bridges across North America, Western Europe, and Japan were built during the mid-twentieth century highway construction boom, and their original expansion joints are now reaching or exceeding their designed service life within a compressed multi-year window rather than spreading evenly across decades. The American Society of Civil Engineers has repeatedly flagged bridge joint deterioration as a leading structural deficiency in its infrastructure report cards, citing thousands of structurally deficient bridges nationwide. That concentrated need creates sustained demand independent of any single funding cycle, since agencies cannot indefinitely defer replacement once deterioration reaches critical thresholds.
Market Impact: Adds 5 to 10 lane-closure days

Long-Span Bridge Construction Expands Modular Joint Demand

China, the Middle East, and Southeast Asia continue commissioning long-span suspension and cable-stayed bridges that require modular multi-cell expansion joints engineered for movement ranges far beyond what standard highway overpasses ever demand. Each new long-span project commits to a custom-engineered joint system carrying substantially higher unit value than standard replacement units, given the specialized movement and load requirements involved. Mageba and Maurer have both disclosed expanding long-span project backlogs through 2030, and suppliers with proven mega-project engineering credentials are capturing a disproportionate share of this high-value segment of the market.
Market Impact: Delays replacement 3 to 5 years

Market Restraints and Challenges

Installation Requires Extended Traffic Lane Disruption

Expansion joint replacement typically requires closing one or more traffic lanes for days or weeks, creating significant disruption that transportation agencies must weigh against the structural risk of delaying replacement further into the future. The root cause is installation complexity: proper joint installation requires precise concrete removal, curing time, and calibration that cannot be safely rushed without compromising long-term performance and durability. That disruption pushes some agencies to delay replacement past the ideal window, accepting elevated deterioration risk rather than accepting near-term traffic disruption. Suppliers are responding with rapid-cure materials and prefabricated systems that meaningfully compress installation timelines.
Market Impact: Adds 30% movement capacity requirement

Budget Constraints Delay Planned Replacement Programs

Many transportation agencies operate under multi-year capital planning cycles that struggle to keep pace with the actual rate of joint deterioration across their aging bridge inventory, forcing difficult prioritization decisions across competing infrastructure needs. The root cause is funding structure: maintenance and replacement budgets typically compete directly against new construction and other capital priorities within the same constrained annual appropriation. That constraint pushes agencies toward interim patching solutions that extend joint life modestly without addressing underlying deterioration. Suppliers are responding with lower-cost interim repair products designed to bridge the gap until full replacement funding becomes available.
Market Impact: Funds 12,000 bridge joint replacements
3 additional market trends, 4 additional growth drivers, and 2 additional restraints and challenges are covered in the full report. Contact sales@marketmindsadvisory.com to access the complete intelligence.

Segment CAGR and Growth Architecture

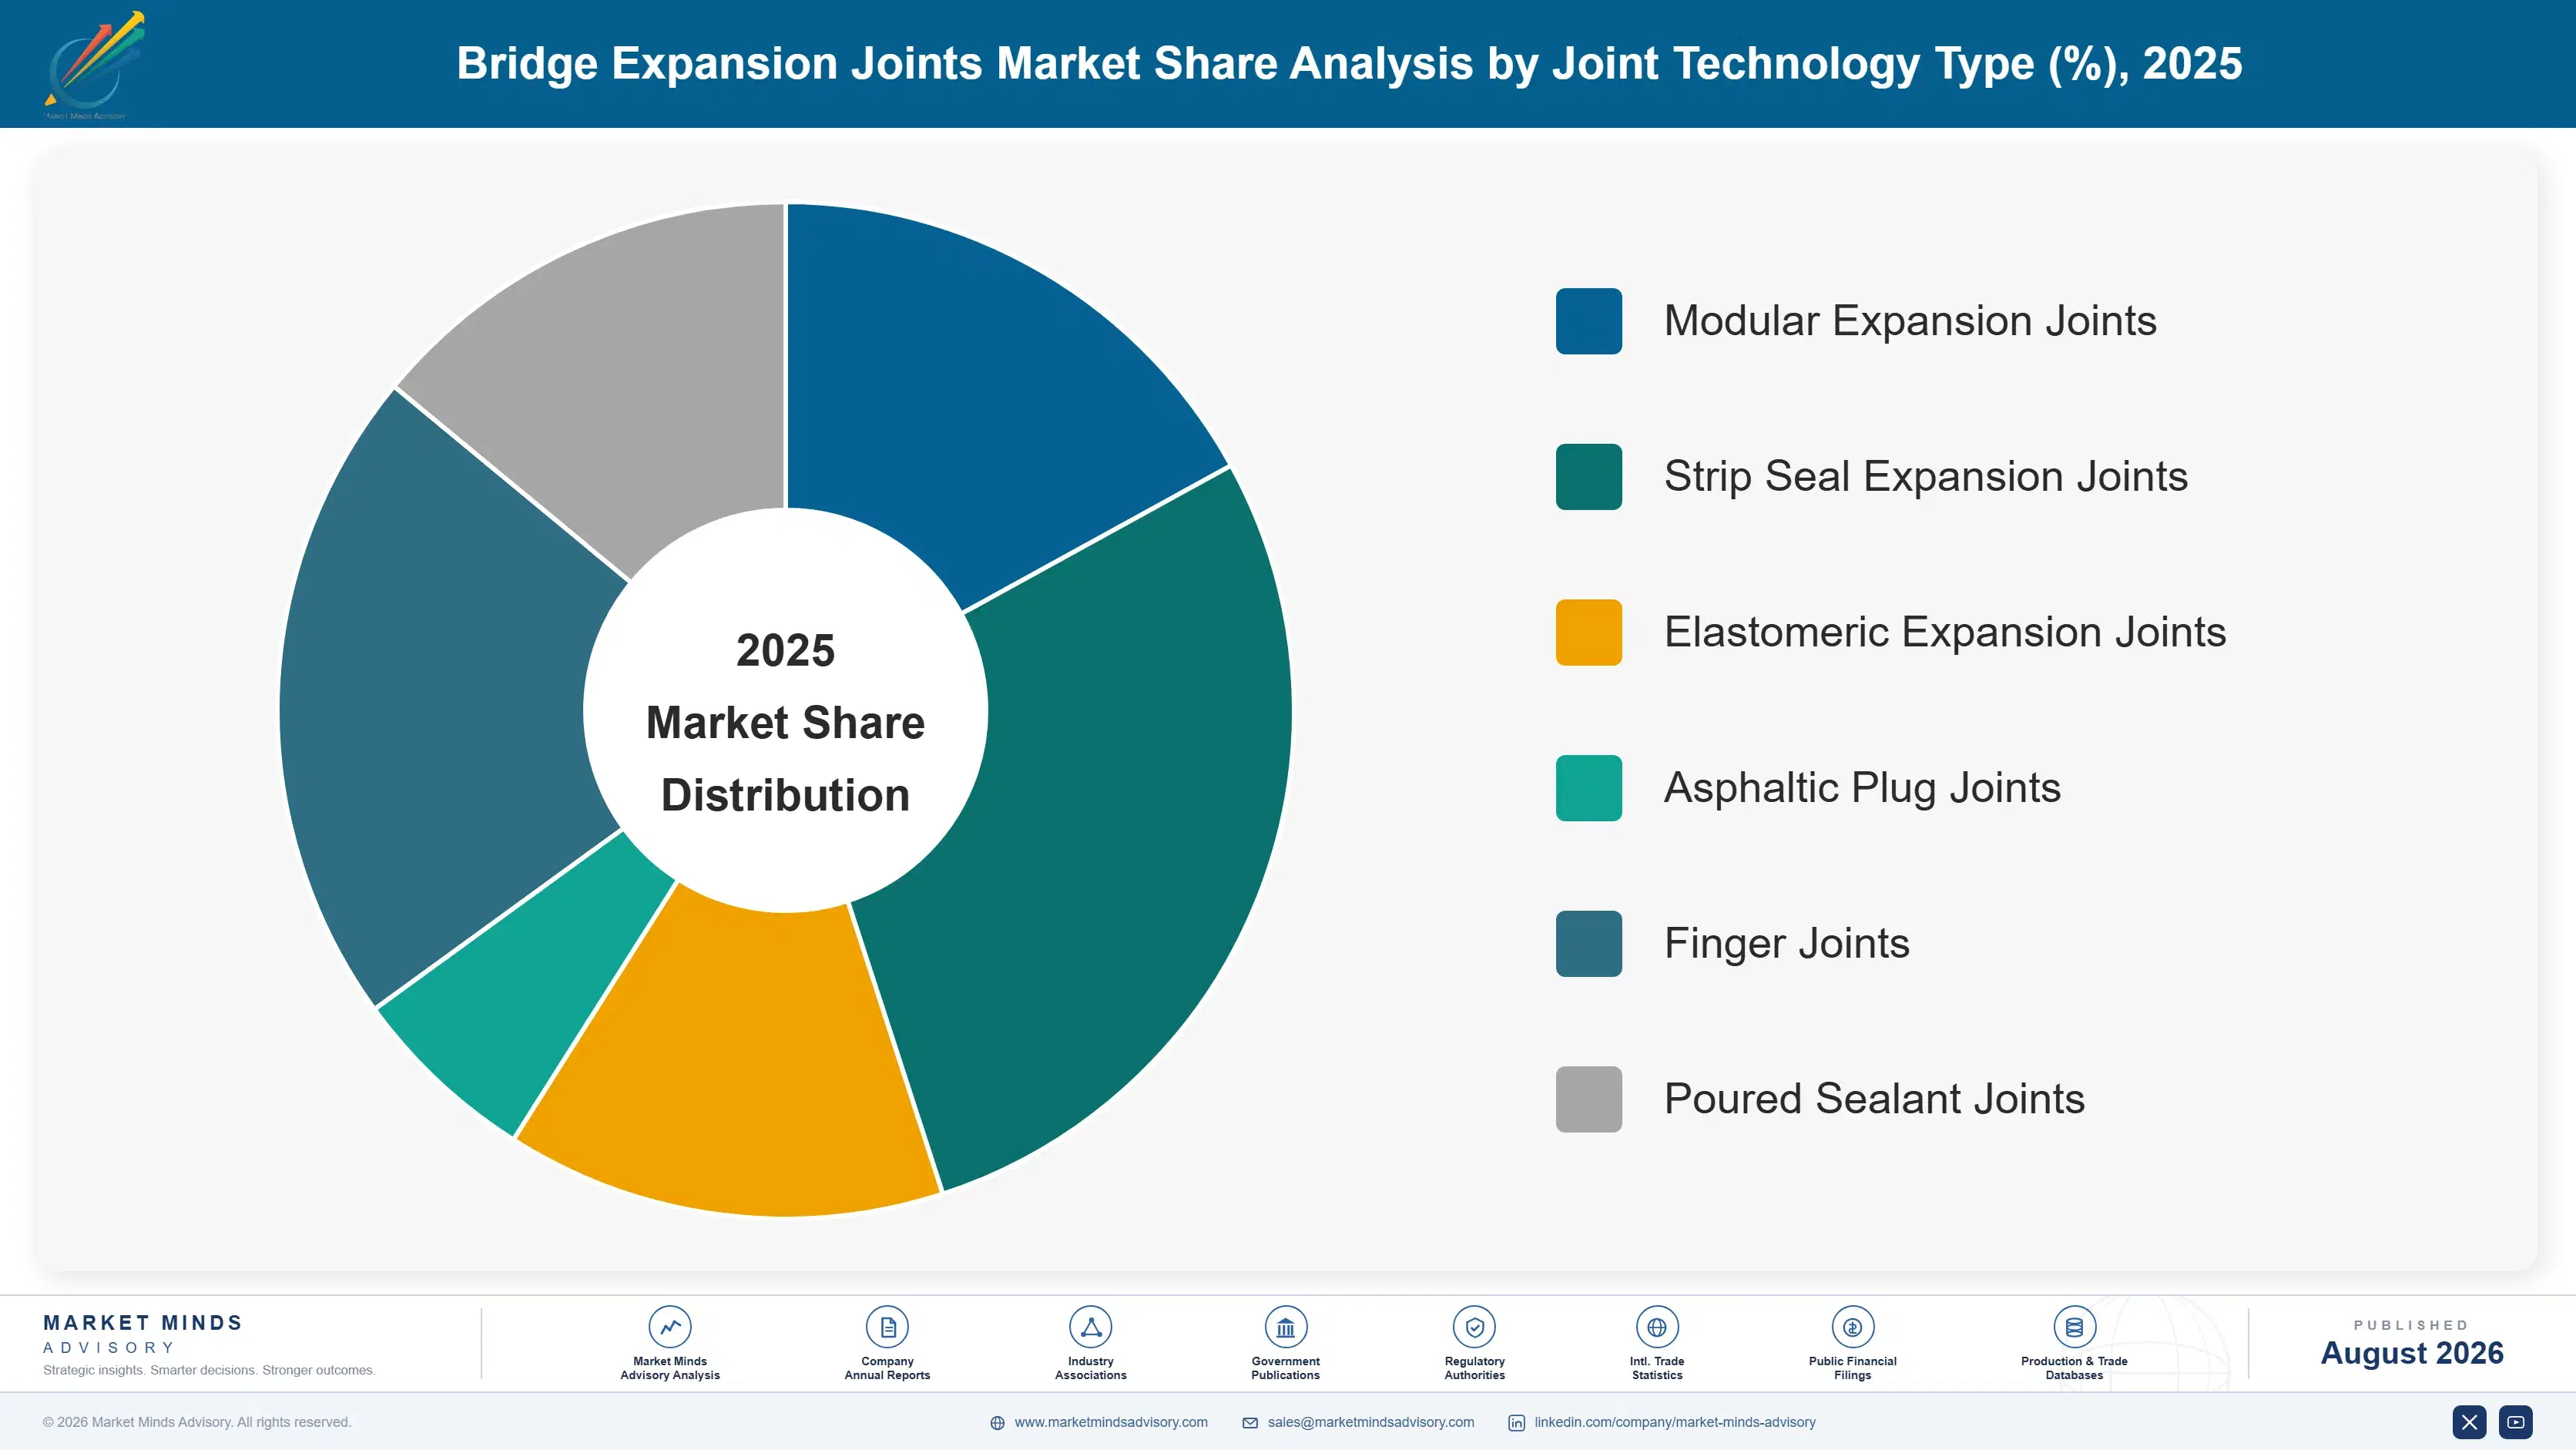
Segmentation follows joint technology type, a single movement-mechanism logic spanning modular, strip seal, elastomeric, asphaltic plug, finger, and poured sealant joints. Each technology carries distinct movement capacity, installation method, and cost and installation structure, so commercial position tracks the underlying mechanism rather than the specific bridge type, span length, or agency it happens to serve.
bridge-expansion-joints-market-market-share-analysis-1787300451410

Modular Expansion Joints

Modular expansion joints grow fastest at 5.8%, about 1.32 times the overall market rate, as long-span and seismic-zone bridges increasingly require multi-cell systems capable of accommodating movement ranges that single-gap designs simply cannot handle reliably over a comparable service life. China's continued high-speed rail and expressway construction program, alongside seismic retrofit mandates across California and Japan, is driving much of this growth as agencies specify modular systems by default on major new structures. Mageba and Maurer have both expanded modular product lines and engineering capacity, and agencies increasingly specify documented shake-table testing data during vendor qualification rather than relying on calculated movement capacity claims alone, particularly for signature and mega-project structures worldwide.
CAGR 5.8%

Finger Joints

Finger joints grow second-fastest at 5.0%, driven by long-span bridge construction requiring large movement capacity without the full mechanical complexity and maintenance burden of a modular system. Their simpler design and lower installation cost make them the preferred choice for many mid-range movement applications where full modular systems would be over-engineered relative to actual structural needs. D.S. Brown and Watson Bowman Acme have both expanded finger joint manufacturing capacity to serve this segment, and agencies increasingly specify finger joints as a cost-effective alternative to modular systems wherever movement requirements fall within their proven and well-documented capacity range, avoiding unnecessary mechanical complexity and long-term maintenance cost across the structure's full service life.
CAGR 5.0%
Full segment breakdown across 6 segments available in the complete report.

Regional Architecture and Country Demand Map

East Asia leads at 26% of global value on China's sustained bridge construction program, followed by North America at 24% on infrastructure funding-driven replacement and Western Europe at 20% on aging network maintenance. Remaining regions together account for the balance of overall global demand today.

North America

United States highway agencies anchor North American demand, where the Infrastructure Investment and Jobs Act directed substantial new capital toward bridge rehabilitation programs deferred for years under constrained state budgets and shrinking gas tax revenue. California's seismic retrofit mandates add a distinct high-value modular joint demand layer separate from routine replacement volume elsewhere in the country, requiring documented shake-table testing on every qualifying supplier. Canada's aging highway network, concentrated in Ontario and Quebec, sustains steady replacement demand at smaller absolute scale than its southern neighbor. Growth of 5.0% outpaces the global rate as funding-driven replacement compounds with a genuinely aging bridge inventory reaching simultaneous end-of-life across many states and metropolitan transportation districts.
Share: 24% | CAGR: 5.0% (2026 to 2036)

Western Europe

Germany's extensive autobahn bridge network, much of it built during the post-war reconstruction era, sustains a large installed base requiring continuous joint replacement as the original structures age past their designed service life. France and the United Kingdom maintain comparable replacement programs, though budget constraints have slowed the pace considerably compared with the region's peak reconstruction-era investment decades ago. The European Union's structural cohesion funding supports bridge maintenance in lower-income member states, though at meaningfully smaller absolute scale than the largest economies. Growth of 2.9% trails the global average because the region's bridge stock, while aging, is being replaced more slowly than funding constraints elsewhere in the world would otherwise suggest.
Share: 20% | CAGR: 2.9% (2026 to 2036)
Regional intelligence for 5 additional markets available in the complete report: East Asia, South Asia and Pacific, Latin America, Middle East and Africa, Eastern Europe. Contact sales@marketmindsadvisory.com.
bridge-expansion-joints-market-country-cagr-analysis-1787300451933

Where Fabricators Can Defend Margin

Suppliers can defend margin against commoditized joint pricing in several distinct ways beyond simply fabricating more units for a growing bridge inventory. The four levers below identify genuine commercial advantage: seismic testing documentation, rapid-installation systems, long-span project qualification, and digital monitoring attachment across major infrastructure programs worldwide and their multi-year renewal and rebidding cycles.

Document Seismic Testing Ahead of Code Updates

Agencies in seismically active regions increasingly require shake-table testing data before qualifying a supplier for major projects, and completing that testing takes many months of lead time that suppliers cannot compress once a bid deadline approaches. Suppliers with completed and documented seismic testing can charge premiums of 15% to 25% over untested alternatives during the qualification window, since agencies have no practical alternative but to pay for compliance regardless of relative unit cost. Mageba has built a durable reputation around proactive seismic testing investment across multiple movement rating classes ahead of anticipated code updates.
Market Impact: Commands a durable 15% to 25% price premium

Engineer Rapid-Installation Systems for Traffic-Sensitive Projects

Standard joint installation requires extended lane closures that agencies increasingly resist approving given the traffic disruption and public complaint volume involved, creating a genuine engineering differentiation opportunity for suppliers investing in prefabricated and rapid-cure systems. Suppliers with proven rapid-installation designs can charge meaningfully more, often 20% to 30% above standard systems, because agencies value avoiding weeks of lane closure more than the incremental material cost involved. D.S. Brown has built a specific reputation around this capability, winning share among agencies managing high-traffic-volume urban corridors where closures draw the sharpest political scrutiny.
Market Impact: Commands a durable 20% to 30% price premium

Qualify for Long-Span Mega-Project Bids Early

Winning a long-span mega-project contract creates reference credentials that smaller regional fabricators cannot easily replicate, since qualification for signature structures requires demonstrated engineering capability across movement ranges standard highway projects never demand. Suppliers that secure these landmark projects early build a portfolio that wins future mega-project bids almost automatically, since agencies overseeing high-visibility structures avoid unproven suppliers regardless of price offered. Mageba and Maurer both hold long-standing mega-project relationships worth well over 50 million dollars annually that smaller regional competitors cannot easily displace, replicate, or even credibly bid against in future procurement rounds.
Market Impact: Secures contracts worth well over 50 million dollars

Attach Digital Monitoring Sensors to Joint Assemblies

Selling bare joint hardware alone commoditizes quickly, since competing systems often meet similar movement specifications within a given price band across most conventional applications and standard highway crossings. Suppliers that bundle embedded monitoring sensors, charging a modest premium of roughly 5,000 to 10,000 dollars per installation, let agencies schedule replacement proactively rather than reactively, generating a data relationship that extends well beyond the initial installation sale itself. Watson Bowman Acme has begun piloting this attachment strategy across several state agency accounts nationwide, with encouraging early adoption results reported across the first several installations.
Market Impact: Adds roughly 7,500 dollars per instrumented joint sold

Who Controls the Margin Pool

Concentration stays moderate at 32% held by the top five suppliers, evaluated on revenue from bridge expansion joint product lines specifically. Mageba and Maurer lead on engineering scale and long-span project credentials, while D.S. Brown, Watson Bowman Acme, and Freyssinet compete across different regional footprints and movement rating specialties. The gap between leader and challenger is meaningful but not decisive, since agencies often qualify multiple regional vendors.
Competitive activity currently runs along three dimensions. Seismic and movement testing documentation matters most, as suppliers race to qualify against tightening code requirements across major infrastructure markets. Rapid-installation engineering runs a close second, as traffic-sensitive urban projects favor shorter closure windows. Long-span mega-project qualification is the third, converting signature structure wins into reference credentials that carry forward into future bids.

Pressure is building from two directions. Chinese domestic fabricators are scaling rapidly and narrowing the technology gap on modular systems, threatening incumbents' share in price-sensitive emerging infrastructure markets. Meanwhile specialty sensor technology firms are commercializing embedded monitoring systems that could reshape how agencies specify and maintain joints going forward. Rankings will shift toward suppliers combining defensible engineering credentials with genuine digital monitoring capability.
bridge-expansion-joints-market-company-positioning-matrix-1787300452455

Competitive Moat and Risk Dimensions

MAGEBA SA

Moat: Long-Span Mega-Project Credentials

Mageba holds reference installations on some of the world's most prominent long-span bridges, giving it engineering credibility that smaller regional fabricators cannot easily replicate. That reputation lets Mageba win signature structure bids where agencies specifically require demonstrated mega-project experience before it will even consider qualifying a new supplier.
MAGEBA SA

Risk: Exposure to Mega-Project Timing

Mageba's revenue mix skews toward large signature projects whose timing depends on sporadic government infrastructure funding decisions, creating lumpier revenue than competitors focused on steadier routine replacement volume. That exposure creates earnings volatility tied to political and budgetary cycles beyond Mageba's own direct commercial control entirely.
MAURER SE

Moat: Seismic Engineering Testing Depth

Maurer has invested heavily in shake-table testing infrastructure and documented seismic performance data across multiple movement rating classes, positioning it favorably as seismic codes tighten globally. That testing depth creates a durable qualification advantage in earthquake-prone markets that newer entrants cannot quickly or affordably replicate.
MAURER SE

Risk: Concentrated Seismic Market Exposure

Maurer's engineering investment concentrates heavily around seismic-zone markets, leaving it more exposed than diversified competitors if seismic retrofit funding slows or shifts toward other structural priorities. That concentration creates a narrower demand base than competitors serving broader and steadier routine replacement markets across many regions.

Key Players

Mageba SA
Maurer SE
D.S. Brown Company
Watson Bowman Acme Corporation
Freyssinet SAS

Others

Trelleborg AB
RJ Watson, Inc.
EMSEAL Joint Systems Ltd.
Reid Construction Systems
Sumitomo Riko Company Limited
Goodco Z-Tech Inc.
Wuxi Jiacheng Rubber Co., Ltd.
Jiangsu Sanli Engineering Materials Co., Ltd.
Migua Fugensysteme GmbH
Sika AG
Structural Technologies, LLC
Kwang Sung Corporation
VSL International Ltd.
Tensa International SA
China Railway Bridge Science Research Institute

Recent Developments

MAY 2025

Mageba wins expansion joint contract for major Southeast Asian suspension bridge

Mageba secured the expansion joint supply contract for a major new suspension bridge project in Southeast Asia, engineering a modular system rated for the structure's substantial thermal and seismic movement range. This was a project-specific supply contract, not an acquisition or joint venture, extending Mageba's long-span reference portfolio significantly.
Signal: Shows leading suppliers continuing to win signature mega-projects that reinforce their engineering credibility globally and durably.
NOVEMBER 2024

Watson Bowman Acme launches embedded sensor monitoring pilot program

Watson Bowman Acme launched a pilot program embedding condition monitoring sensors directly into new joint installations across several state transportation agency accounts. This was an internal product development initiative, not a corporate transaction, reflecting organic investment in digital monitoring capability ahead of broader industry adoption.
Signal: Indicates suppliers increasingly investing in digital differentiation ahead of broader industry adoption of monitoring technology overall.
FEBRUARY 2025

D.S. Brown acquires rapid-cure materials technology developer

D.S. Brown acquired a privately held rapid-cure concrete and sealant technology developer specializing in compressed installation timelines for traffic-sensitive projects. The acquisition was a full corporate purchase, not a licensing arrangement or joint venture, giving D.S. Brown direct ownership of the underlying formulation technology outright.
Signal: Indicates suppliers increasingly prefer owning installation-speed technology outright rather than licensing it externally from smaller specialists.

Steel and Elastomer Feedstock Exposure

Structural steel and specialty elastomer seal materials together account for roughly 32% to 40% of joint system COGS, sourced primarily from steel mills in the United States, Germany, and China and from elastomer compounders concentrated in Germany and the United States. Stainless steel fasteners and anchorage components add a further 8% to 12%, sourced from specialty metals producers across multiple qualified regions.
Steel prices rose meaningfully through 2024 as tariff policy shifts and construction demand recovery pushed benchmark structural steel prices higher across most major producing regions, according to trade data. Mageba's 2024 annual report disclosed higher input costs attributable to steel inflation, noting that fabrication cost rose meaningfully faster than the company could pass through to agency customers without margin compression across its modular joint segment.

Smaller regional fabricators carry more exposure than the largest diversified suppliers, since they lack the purchasing scale to negotiate favorable long-term steel contracts with primary mills. Suppliers sourcing elastomer compounds from a concentrated set of producers face additional exposure to capacity constraints, while those with diversified global sourcing absorb volatility more predictably across their broader and more diversified global supply chain.
bridge-expansion-joints-market-cost-volatility-analysis-1787300452650

Lock Steel Pricing Through Project-Specific Contracts

Structural steel is the largest single volatile input across most joint product lines and the most actively traded on organized metals markets globally. Project-specific forward purchase agreements timed to bid awards, common practice among larger diversified fabricators, smooth quarter-to-quarter volatility and let commercial teams quote multi-year infrastructure contracts with genuine confidence rather than repricing constantly.

Diversify Elastomer Sourcing Across Compounders

Reliance on a single elastomer compounder concentrates both price and availability risk unnecessarily across an entire product line and every movement rating class offered. Qualifying secondary compounders across multiple regions, even at modestly higher unit cost, protects continuity when any single supplier faces capacity outage or a sudden demand spike from competing industrial sectors worldwide.

Bring Fabrication Capacity In-House Where Feasible

Suppliers that bring steel fabrication in-house rather than relying entirely on contract fabricators capture manufacturing margin previously paid to a third party while gaining direct visibility into actual material consumption and lead times across every project. That integration also shortens delivery timelines meaningfully during periods of tight global fabrication capacity and rising steel demand.

Portfolio Architecture for Margin Defence

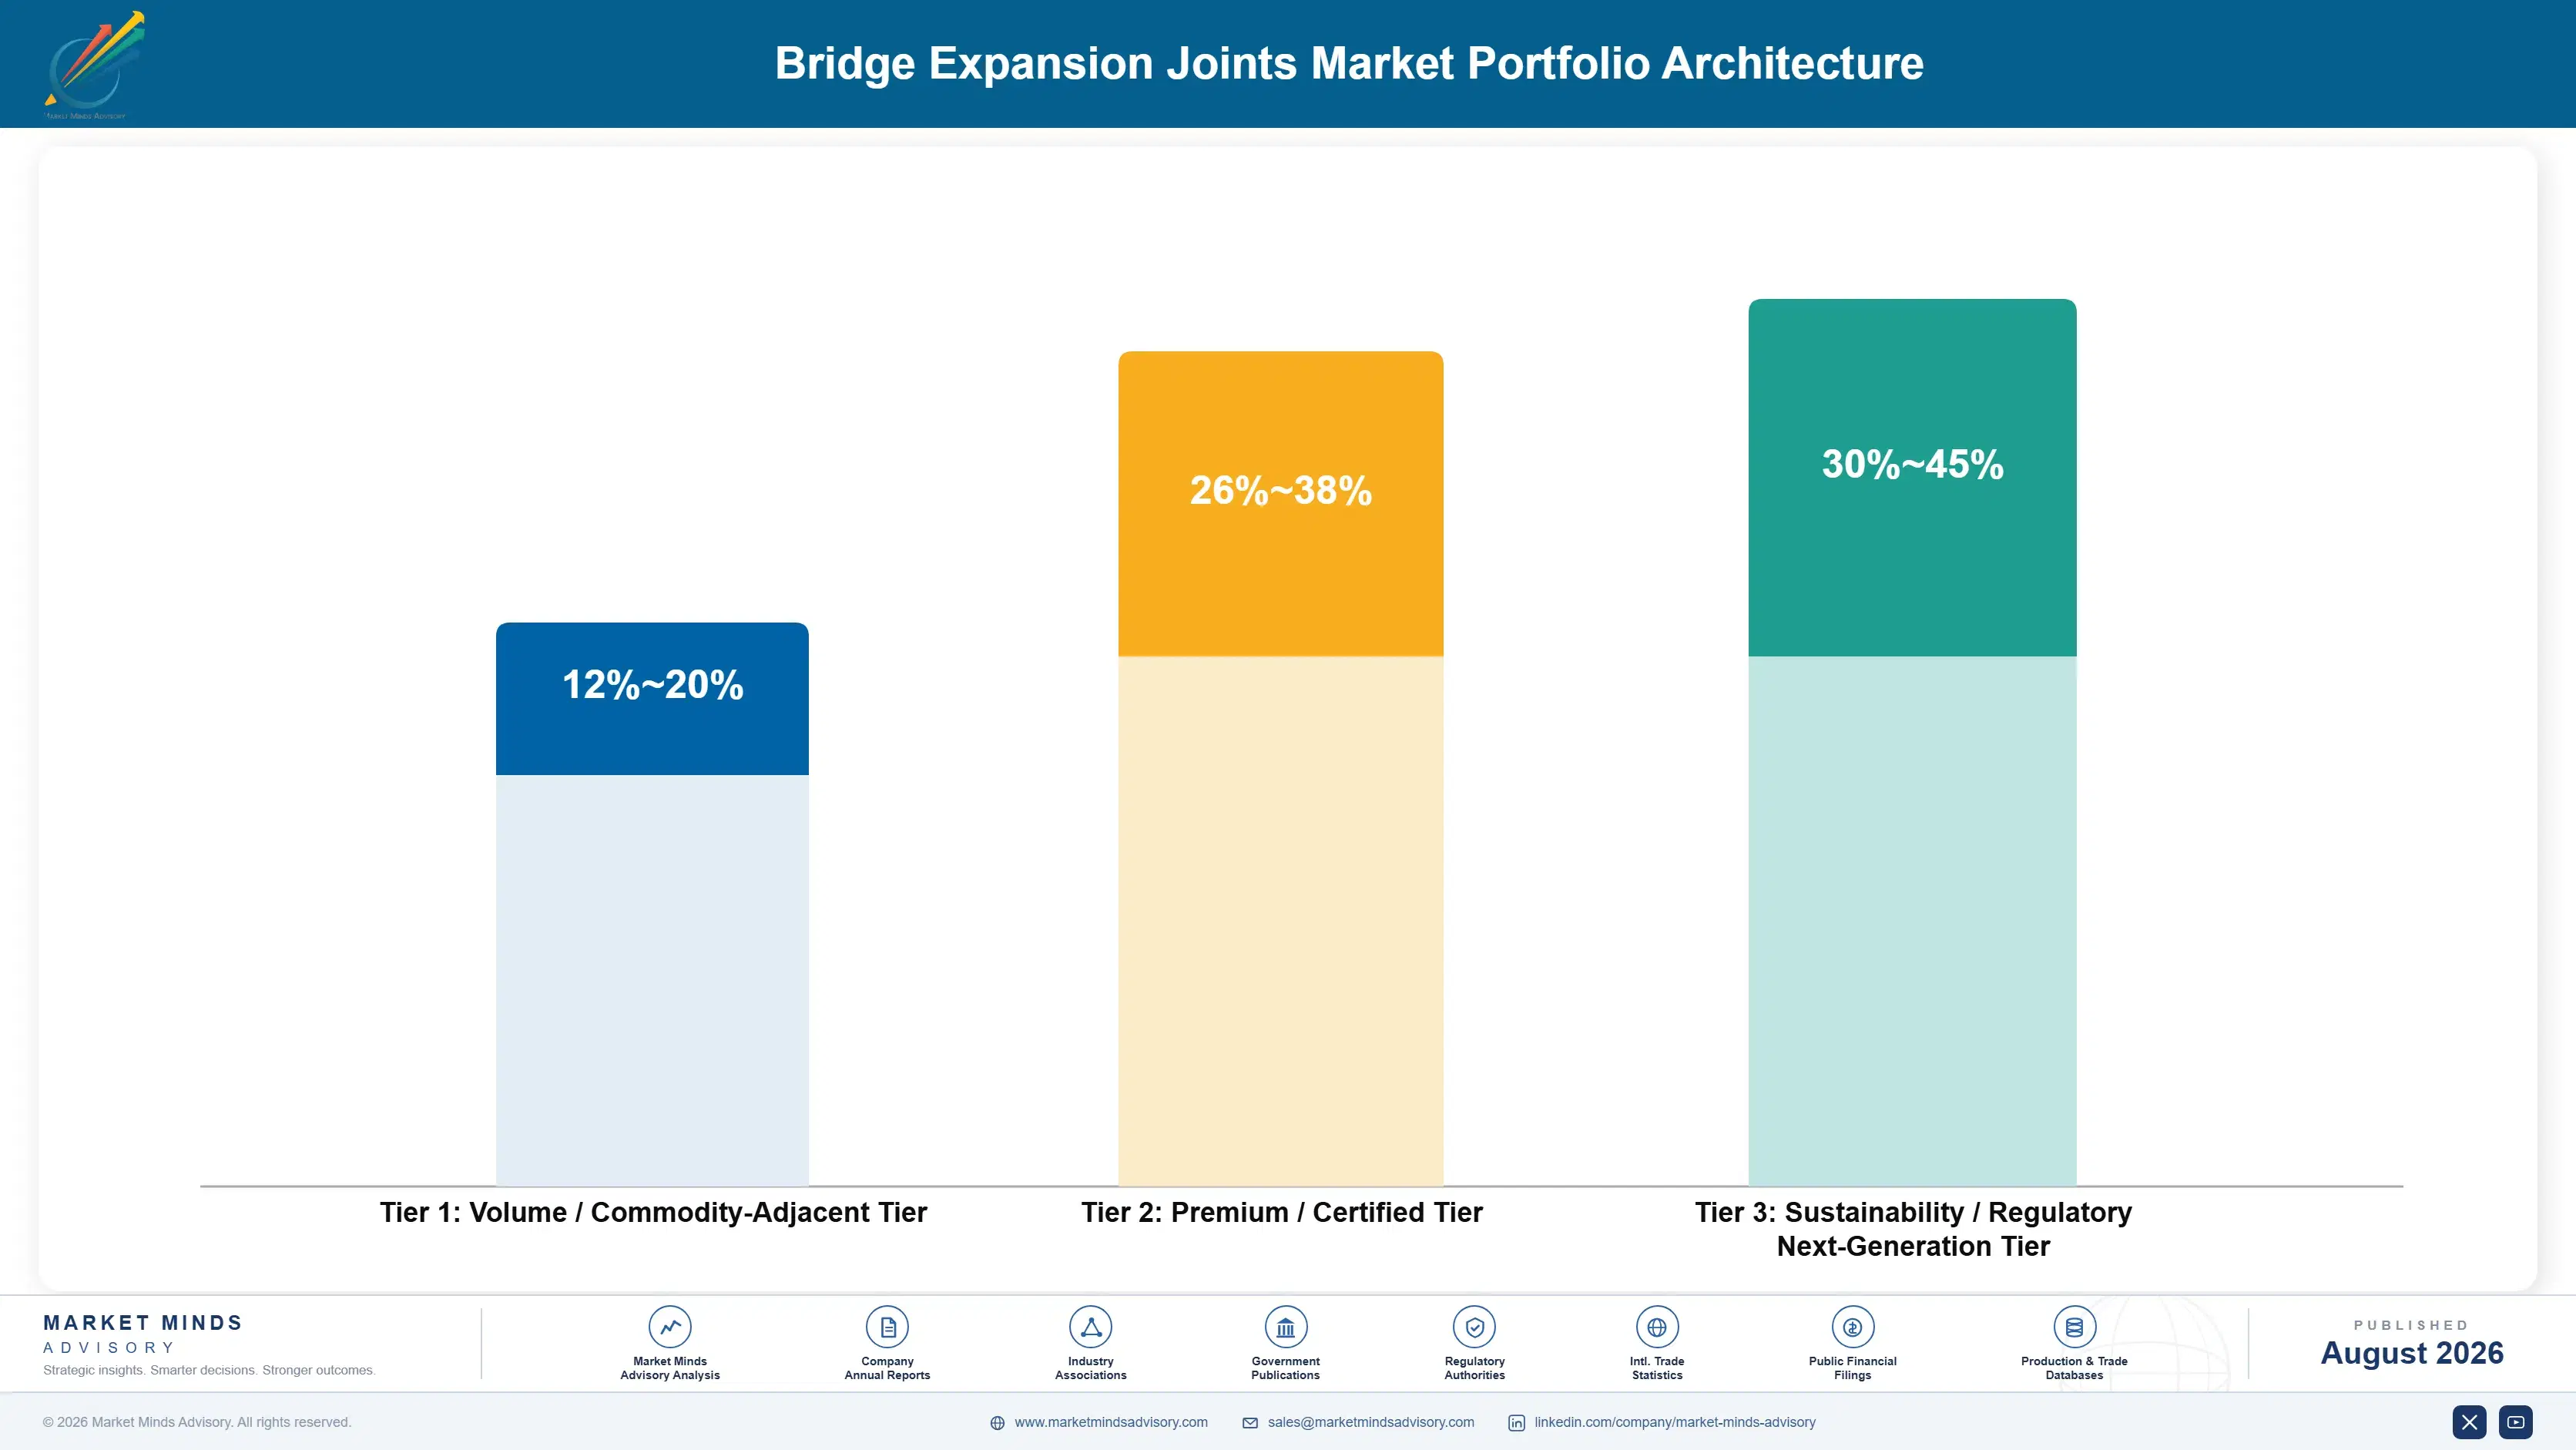
The portfolio splits into three tiers with meaningful margin separation tied to engineering complexity and testing documentation depth. Volume tier products carry standard strip seal and elastomeric configurations for conventional highway overpasses, competing largely on price against a crowded field of regional fabricators. Premium certified products carry seismic-rated and rapid-installation designs backed by documented testing data. Sustainability and next-generation products, including digit
The tension between volume and premium runs through nearly every supplier's product roadmap. Volume products fund the fabrication scale and regional distribution network premium products eventually depend on, yet volume margins keep compressing as domestic Chinese and regional fabricators scale aggressively on conventional designs. Suppliers that under-invest in premium engineering risk commoditization within their own category, while those chasing premium exclusively struggle to fund the manufacturing base for routine replacement demand.

High-value margin pools concentrate specifically in seismic-zone and long-span mega-project applications where failure consequences carry the largest financial and safety stakes, and where documented testing data commands genuine pricing power. Conventional highway replacement generates steadier volume but thinner margin, since that segment competes against a wider set of lower-cost regional suppliers with adequate but genuinely unremarkable engineering.

Volume / Commodity-Adjacent Tier

Standard strip seal and elastomeric configurations for conventional highway overpasses, competing largely on price against a crowded field of regional fabricators offering broadly comparable specifications and materials at similar cost.
Gross Margin: 12-20%

Premium / Certified Tier

Seismic-rated and rapid-installation designs backed by documented shake-table testing data and formal agency qualification, commanding meaningful pricing premiums over conventional equivalents across most major infrastructure markets globally, particularly in earthquake-prone regions.
Gross Margin: 26-38%

Sustainability / Regulatory / Next-Generation Tier

Digitally monitored modular systems still scaling rapidly across major infrastructure programs, targeting proactive maintenance and safety outcomes that conventional hardware simply cannot match consistently across every application and movement rating class offered today.
Gross Margin: 30-45%
bridge-expansion-joints-market-portfolio-architecture-1787300453144

High-value Sub-segments and Strategic Watch-out

Seismic-Rated Modular Joint Systems

High value and high growth, driven by tightening seismic design codes across California, Japan, and Turkey, with shake-table testing barriers protecting incumbent suppliers from new entrant price competition on the largest infrastructure accounts nationwide and internationally across seismic-prone regions and their steadily expanding infrastructure investment programs.
Gross Margin: 30-45%

Long-Span Mega-Project Systems

High value with moderate growth, anchored by recovering global infrastructure investment across China, the Middle East, and Southeast Asia, where reference project credentials increasingly decide vendor qualification for signature structures worldwide, from suspension bridges to cable-stayed crossings across multiple continents and increasingly complex structural typologies.
Gross Margin: 26-38%

Conventional Strip Seal Replacement Units

The category's largest volume base by unit count, competing on price against a crowded field of regional suppliers, generating steady but thin margin as conventional highway replacement demand matures across most developed economies, from North America to Western Europe and increasingly Eastern Europe as well.
Gross Margin: 12-20%

Legacy Asphaltic Plug Joint Systems

Strategic watch-out where documented shorter service life and higher failure rates threaten to displace asphaltic plug designs across harsh climate applications, creating genuine technology risk for suppliers slow to transition product lines toward more durable and better-performing alternatives quickly enough before regulators mandate outright replacement.
Gross Margin: 10-18%

Service Life Economics of Bridge Programs

Joint demand behaves like an annuity tied directly to the total bridge inventory rather than to any single replacement event, since every operating bridge eventually needs joint replacement regardless of whether new construction happens that year. That structure gives suppliers with strong agency relationships a predictable revenue floor even during periods without major new infrastructure funding, since existing bridges keep deteriorating on a roughly twenty to thirty year cycle independent of
Adoption depth varies sharply by end-use vertical. Seismic-zone and long-span signature bridges have adopted modern movement-rated and monitored joint systems almost universally, since failure consequences there carry severe safety and political implications. Conventional highway overpasses lag well behind, treating premium engineering as optional rather than standard, partly because failure consequences are genuinely lower and partly because budget scrutiny is tighter outside signature structures.

Buyer profiles have shifted generationally. Procurement decisions that once sat primarily with individual bridge inspectors now route through centralized structural engineering and asset management functions at larger transportation agencies, rewarding suppliers able to present integrated performance data rather than relationship selling alone. Younger structural engineers entering leadership roles treat documented testing data as a baseline procurement input rather than a marketing claim.
bridge-expansion-joints-market-end-use-penetration-index-1787300453631

MMA's Read on Bridge Infrastructure

These are among the four positions where our research anticipates prominent divergence between winners and laggards over the coming forecast period. Each is grounded in the demand model, the regulatory perimeter, and the announced capacity pipeline.
01 / SEISMIC TESTING STRATEGY

Documented shake-table data will separate winners from unqualified challengers

Seismic codes keep tightening across earthquake-prone regions, which means suppliers without completed shake-table testing documentation increasingly cannot bid competitively on major infrastructure projects regardless of their conventional engineering reputation. Testing takes many months of lead time that cannot be compressed once a bid deadline approaches, creating a genuine first-mover advantage for suppliers who invest ahead of code updates rather than reactively. Suppliers building this documentation now, before mandates take full effect, will hold qualification advantages rivals cannot quickly or affordably replicate.
02 / RAPID INSTALLATION POSITIONING

Traffic-sensitive installation speed will define share gains through 2036

Urban agencies increasingly resist approving extended lane closures given mounting public complaint volume and political pressure around traffic disruption during joint replacement projects across dense metropolitan corridors. Suppliers without proven rapid-installation systems increasingly lose bids among agencies managing high-traffic-volume corridors, regardless of reputation built on conventional installation methods over decades. Those investing in prefabricated and rapid-cure technology now, ahead of competitors still using legacy methods, will capture disproportionate share as urban infrastructure programs keep expanding nationwide and internationally at pace.
03 / LONG-SPAN PROJECT POSITIONING

Mega-project reference credentials will decide signature structure contracts

Long-span bridge construction across China, the Middle East, and Southeast Asia keeps generating high-value mega-project opportunities that require demonstrated engineering capability standard highway projects never demand. Suppliers without existing reference installations cannot simply buy their way into this segment quickly, since agencies overseeing signature structures will not risk unproven suppliers regardless of price offered. Incumbent suppliers with proven mega-project credentials are positioned to capture a disproportionate share of this recovering global infrastructure investment cycle over the coming decade of forecast growth.
04 / DIGITAL MONITORING ADOPTION

Embedded sensor technology will reshape how agencies specify future joints

Agencies are increasingly demanding proactive maintenance data rather than reactive inspection-based replacement scheduling, creating genuine demand for embedded monitoring technology that conventional joint hardware simply cannot provide on its own. Suppliers without credible monitoring platforms increasingly risk losing accounts to competitors offering integrated data relationships that extend well beyond the initial installation sale. Those investing in sensor technology now, ahead of broader industry adoption, will capture disproportionate share as agencies standardize proactive, data-driven maintenance programs nationwide across every major transportation agency.

Engagement Snapshot From the Field

A live engagement with an industry participant carrying material or product regulatory and market exposure ahead of a defining policy shift, showing how our research translates into a defensible multi-year portfolio strategy.
MARKET MINDS ADVISORY · CLIENT ENGAGEMENT SUMMARY
Bridge Expansion Joints Producer Strategic Portfolio Review and Transition Roadmap 2026·Investment Scenario on Bridge Expansion Joints Exposure Evaluation 2025-26
CLIENT PROFILE
A state department of transportation responsible for approximately 4,800 bridges statewide, managing an annual capital program of roughly 620 million dollars, approached MMA after a routine structural inspection flagged an unexpectedly large share of its inventory for near-term joint replacement, exceeding the agency's current budgeted capacity considerably ahead of the next fiscal year (client-reported, unverified by MMA).
STRATEGIC CHALLENGE
Leadership faced pressure to prioritize replacement across thousands of bridges without a consistent framework for ranking urgency, since inspection data alone did not capture financial risk or traffic impact if a given joint failed unexpectedly. Engineering staff wanted the most technically conservative approach, while budget officials needed a defensible multi-year capital plan that could survive legislative scrutiny during appropriation hearings.
MMA APPROACH
MMA developed a risk-scoring framework combining structural condition data, traffic volume, and replacement cost across the agency's full bridge inventory, benchmarked supplier capabilities against the state's seismic and movement requirements, and modeled a multi-year capital program sequencing replacement by combined risk score, projected traffic impact, and estimated replacement cost efficiency.
KEY FINDINGS
  1. Roughly 15% of flagged bridges accounted for most of the traffic-weighted risk, suggesting a sequencing approach could meaningfully reduce overall exposure faster than a purely condition-based ranking.
  2. Bundling geographically clustered projects into combined contracts reduced modeled unit cost meaningfully compared with awarding each bridge separately across the state's geographically dispersed bridge network.
  3. Two qualified suppliers offered comparable seismic performance data, preserving negotiating leverage without meaningfully compromising documented technical quality standards (client-reported, unverified by MMA).
  4. Rapid-installation systems commanded a modest price premium but reduced modeled traffic disruption cost enough to justify the additional expense on the highest-volume corridors.
CLIENT PROFILE
A state department of transportation responsible for approximately 4,800 bridges statewide, managing an annual capital program of roughly 620 million dollars, approached MMA after a routine structural inspection flagged an unexpectedly large share of its inventory for near-term joint replacement, exceeding the agency's current budgeted capacity considerably ahead of the next fiscal year (client-reported, unverified by MMA).
STRATEGIC CHALLENGE
Leadership faced pressure to prioritize replacement across thousands of bridges without a consistent framework for ranking urgency, since inspection data alone did not capture financial risk or traffic impact if a given joint failed unexpectedly. Engineering staff wanted the most technically conservative approach, while budget officials needed a defensible multi-year capital plan that could survive legislative scrutiny during appropriation hearings.
MMA APPROACH
MMA developed a risk-scoring framework combining structural condition data, traffic volume, and replacement cost across the agency's full bridge inventory, benchmarked supplier capabilities against the state's seismic and movement requirements, and modeled a multi-year capital program sequencing replacement by combined risk score, projected traffic impact, and estimated replacement cost efficiency.
KEY FINDINGS
  1. Roughly 15% of flagged bridges accounted for most of the traffic-weighted risk, suggesting a sequencing approach could meaningfully reduce overall exposure faster than a purely condition-based ranking.
  2. Bundling geographically clustered projects into combined contracts reduced modeled unit cost meaningfully compared with awarding each bridge separately across the state's geographically dispersed bridge network.
  3. Two qualified suppliers offered comparable seismic performance data, preserving negotiating leverage without meaningfully compromising documented technical quality standards (client-reported, unverified by MMA).
  4. Rapid-installation systems commanded a modest price premium but reduced modeled traffic disruption cost enough to justify the additional expense on the highest-volume corridors.
RECOMMENDED STRATEGY
Phase 1: Phase 1 (0 to 12 months): Replace the highest traffic-weighted risk bridges first, prioritizing corridors identified in the risk-scoring framework as most exposed. Phase 2: Phase 2 (12 to 36 months): Bundle geographically clustered remaining projects into combined multi-bridge contracts to capture cost efficiencies identified in the analysis. Phase 3: Phase 3 (36 to 60 months): Complete remaining lower-risk replacements on a standard cycle, reassessing prioritization annually against updated inspection data.
OUTCOME
The agency adopted the risk-scoring framework as its standing capital planning methodology and secured legislative approval for the proposed multi-year program on its first submission. Bundled contracting reduced projected program cost meaningfully versus the original bridge-by-bridge estimate across the agency's first three years of program execution (client-reported, unverified by MMA).

Frequently Asked Questions

Foundational context covering the market sizes, CAGR, scope, country, region and competition that inform every finding below. This section is provided to cover basics and most often pre-purchase conversations, answered from the MMA Primary Research Dataset.

What is the current size of the Bridge Expansion Joints Market?

The market reached an estimated 3.9 billion dollars in 2025. That figure reflects global revenue across modular, strip seal, elastomeric, asphaltic plug, finger, and poured sealant joint systems.

How large will the Bridge Expansion Joints Market be by 2036?

MMA projects the market will reach approximately 6.3 billion dollars by 2036 under the base case scenario. That represents roughly 1.54 times the 2026 market value.

What is the CAGR for the Bridge Expansion Joints Market 2026 to 2036?

The base case CAGR is 4.4% annually across the full ten-year forecast period. Bull and bear scenarios run 5.6% and 3.2% respectively, reflecting infrastructure funding uncertainty.

Which segment is growing fastest?

Modular expansion joints grow fastest at 5.8% CAGR, about 1.32 times the overall market rate. Long-span and seismic-zone bridge construction requiring multi-cell systems is the primary driver.

Who are the major companies in the Bridge Expansion Joints Market?

Mageba, Maurer, D.S. Brown, Watson Bowman Acme, and Freyssinet lead the category by a consistent revenue basis, together holding roughly 32% of joint system revenue.

Which country is growing fastest?

China leads national growth at an estimated 6.5% CAGR, driven by its sustained high-speed rail and expressway bridge construction program. Provincial infrastructure investment keeps intensifying steadily.

Report Segmentation Architecture

The full report scope spans multiple orthogonal segmentation dimensions, with cross-tabulated demand data provided for each dimension pair. Coverage extends further to regional breakdowns, trend trajectories, and the competitive detail needed to support segment-level decision-making.

By Joint Technology Type

  • Modular Expansion Joints
  • Strip Seal Expansion Joints
  • Elastomeric Expansion Joints
  • Asphaltic Plug Joints
  • Finger Joints
  • Poured Sealant Joints

By End-Use Application

  • Highway and Expressway Bridges
  • Rail and High-Speed Rail Bridges
  • Urban Transit and Pedestrian Bridges
  • Long-Span and Signature Structures
  • Industrial and Port Infrastructure

By Commercial Dimension

  • Direct Agency Contract Sales
  • Design-Build Project Contracts
  • Distributor and Fabricator Sales
  • Retrofit and Rehabilitation Services

By Region

  • North America
  • Western Europe
  • East Asia
  • South Asia and Pacific
  • Latin America
  • Middle East and Africa
  • Eastern Europe

Scope, Methodology, and Coverage

Every figure in this report is reproducible from documented input assumptions. The scope below maps the historical period, the forecast horizon, the segmentation dimensions, and the countries covered, alongside the underlying primary and qualitative methodology.
Historical Period
2020 to 2025
Forecast Period
2026 to 2036
Base Year
2025 (USD billions; MMA Primary Research Dataset, August 2026)
Market Definition
The bridge expansion joints market covers modular, strip seal, elastomeric, asphaltic plug, finger, and poured sealant joint systems used to accommodate thermal, seismic, and traffic-load movement in bridge decks. It includes original installation, replacement units, and related engineering services. Bridge bearings, structural steel superstructure components, and non-bridge expansion joint applications are excluded.
Quantitative Units
USD billions (current prices); unit shipment volume where applicable
Segmentation Dimensions
By Joint Technology Type; By End-Use Application; By Commercial Dimension; By Region
Regions Covered
North America, Western Europe, East Asia, South Asia and Pacific, Latin America, Middle East and Africa, Eastern Europe
Countries Covered
USA, China, Germany, France, UK, Japan, South Korea, India, Australia, Canada, Brazil, Mexico, Indonesia, Vietnam, Thailand, Malaysia, UAE, Saudi Arabia, South Africa, Nigeria, Turkey, Poland, Netherlands, Italy, Spain, Sweden, Switzerland, Argentina, Colombia, Singapore, and additional markets relevant to this sector
Key Companies Profiled
Mageba SA; Maurer SE; D.S. Brown Company; Watson Bowman Acme Corporation; Freyssinet SAS; Trelleborg AB; RJ Watson, Inc.; EMSEAL Joint Systems Ltd.; Reid Construction Systems; Sumitomo Riko Company Limited; Goodco Z-Tech Inc.; Wuxi Jiacheng Rubber Co., Ltd.; Jiangsu Sanli Engineering Materials Co., Ltd.; Migua Fugensysteme GmbH; Sika AG; Structural Technologies, LLC; Kwang Sung Corporation; VSL International Ltd.; Tensa International SA; China Railway Bridge Science Research Institute
Quantitative Methodology
Primary survey, n=3,800 respondents, Q4 2025, six countries; demand-side model with trade association cross-validation
Qualitative Methodology
47 expert interviews, Q4 2025; applied to validate demand model assumptions, identify emerging dynamics, and assess competitive positioning
Report Format
PDF and XLSX data workbook (Word format preview document)
Publisher
Market Minds Advisory
Report Code
MMA-2026-CON-105
Published
August 2026
Contact
sales@marketmindsadvisory.com | www.marketmindsadvisory.com

Purchase the full Bridge Expansion Joints Market Report (2026 to 2036).

The full MMA Bridge Expansion Joints report sizes the market across six technology categories, five end-use applications, four commercial contracting models, and seven regions through 2036. It profiles twenty participants on a consistent basis of joint system revenue, scoring the top five on seismic testing depth, rapid-installation capability, and long-span project credentials. Scenario models quantify how infrastructure funding legislation, seismic code updates, and steel price volatility move both demand and achievable pricing. The report also includes delivered cost modeling by technology category, a bridge inventory age tracker across major markets, and a supplier displacement risk assessment built for agencies, fabricators, and investors.
Six-segment technology demand model through 2036
Bridge inventory age and replacement cycle tracker
Seismic testing competitive positioning assessment tool
Rapid-installation system benchmarking dataset and analysis
Steel and elastomer feedstock cost sensitivity model
Supplier displacement risk scoring by technology

Built For The People Who Decide

From boardroom strategy to bench-side execution, this report is read cover-to-cover by leaders shaping the next decade of their industry, turning demand scenarios, market dynamics and valuation benchmarks into decisions.
CXOs/ Presidents/ VPs/ Managers
M&A and Corporate Development
Strategy Teams and R&D Heads
Procurement and Product Directors
Regulatory and Compliance Leaders
Investor Relations and Equity Analysts