Market Minds Advisory
Brand Protection Tools Market Share Analysis

Brand Protection Tools Market Share Analysis: Brand Protection Tools Market Share Analysis: Detection, Enforcement and Synthetic Impersonation Response, 2026 to 2036

A brand can remove four hundred thousand listings a year and change nothing, because sellers relist within hours under new accounts. Takedown counts measure the tool working, not the problem shrinking.

Lead Analyst

Published

September 2026

Make Smarter Decisions with Customized Research Insights

Request a free sample report and evaluate market opportunities, growth trends, and competitive dynamics relevant to your business needs.

2025 MARKET VALUE$3.9BMarket Size 2025
2036 FORECAST VALUE$14.4BBase Case , 2026 to 2036
CAGR 2026 TO 203612.6 %Bull 13.8% / Bear 11.4%
INCREMENTAL OPPORTUNITY$10.0BNet 10- year value creation
EXPANSION MULTIPLE3.27x2036 value over 2026 base
Strategic Levers
M&A Pipeline
Regional Outlook
Country Rankings
Competitive Intelligence
Segmental Deep-dive
Call-Us : 91 93563 13602

Executive Snapshot and Market Trajectory.

A large brand programme removes about 412,000 listings a year. Roughly 78% of the sellers behind them return under a new account, and measured availability of counterfeit product falls by around 6%. The industry reports the first number and rarely the third. Activity and outcome have parted company.
Enforcement is also running into a target it was not designed for. Synthetic media and AI impersonation detection grows at 18.9%, half again the market rate of 12.6%, because a generated video of a chief executive endorsing a fraud has no listing to remove and no seller to identify. Reported incidents of that kind rose 214% in a year. North America holds 32% of spend, following brand ownership rather than counterfeit origin.
Five vendors hold 37% of contracted spend and the field is still consolidating, with detection specialists, physical authentication providers, and security firms converging on the same buyers from different origins. What separates the winners is not detection breadth. It is whether the programme can show a change in availability rather than a bigger removal count each quarter. Removal counts are becoming an operational statistic rather than a result.
Market Definition
The brand protection tools market covers software and managed services detecting and enforcing against unauthorised use of brand assets, including marketplace listing detection and takedown, domain and phishing site enforcement, social media and impersonation monitoring, synthetic media and AI impersonation detection, grey market and diversion tracking, and physical authentication and serialisation services. It excludes trademark registration and prosecution, general cyber threat intelligence, supply chain logistics platforms, and consumer product recall systems.
Base Year Value
$3.9B in 2025 (MMA Primary Research Dataset, September 2026)
Forecast Period
2026 to 2036, eleven discrete annual values
CAGR
12.6% base case. Bull 13.8%. Bear 11.4%.
Fastest Growth Segment
Synthetic Media And AI Impersonation Detection: 18.9% CAGR
Fastest Growth Country
India: 17.2% CAGR
Fastest Growth Region
South Asia and Pacific: 14.8% CAGR
Largest Region
North America: 32% of 2025 global value
Market Leaders
Corsearch, MarkMonitor, Red Points, OpSec Security, and ZeroFox lead the field. Source: MMA Primary Research Dataset, July 2026.
Primary Survey
n=3,800 procurement and R&D decision-makers, Q4 2025, six countries
Methodology
Demand-side build-up, cross-validated against public data, 47 expert interviews

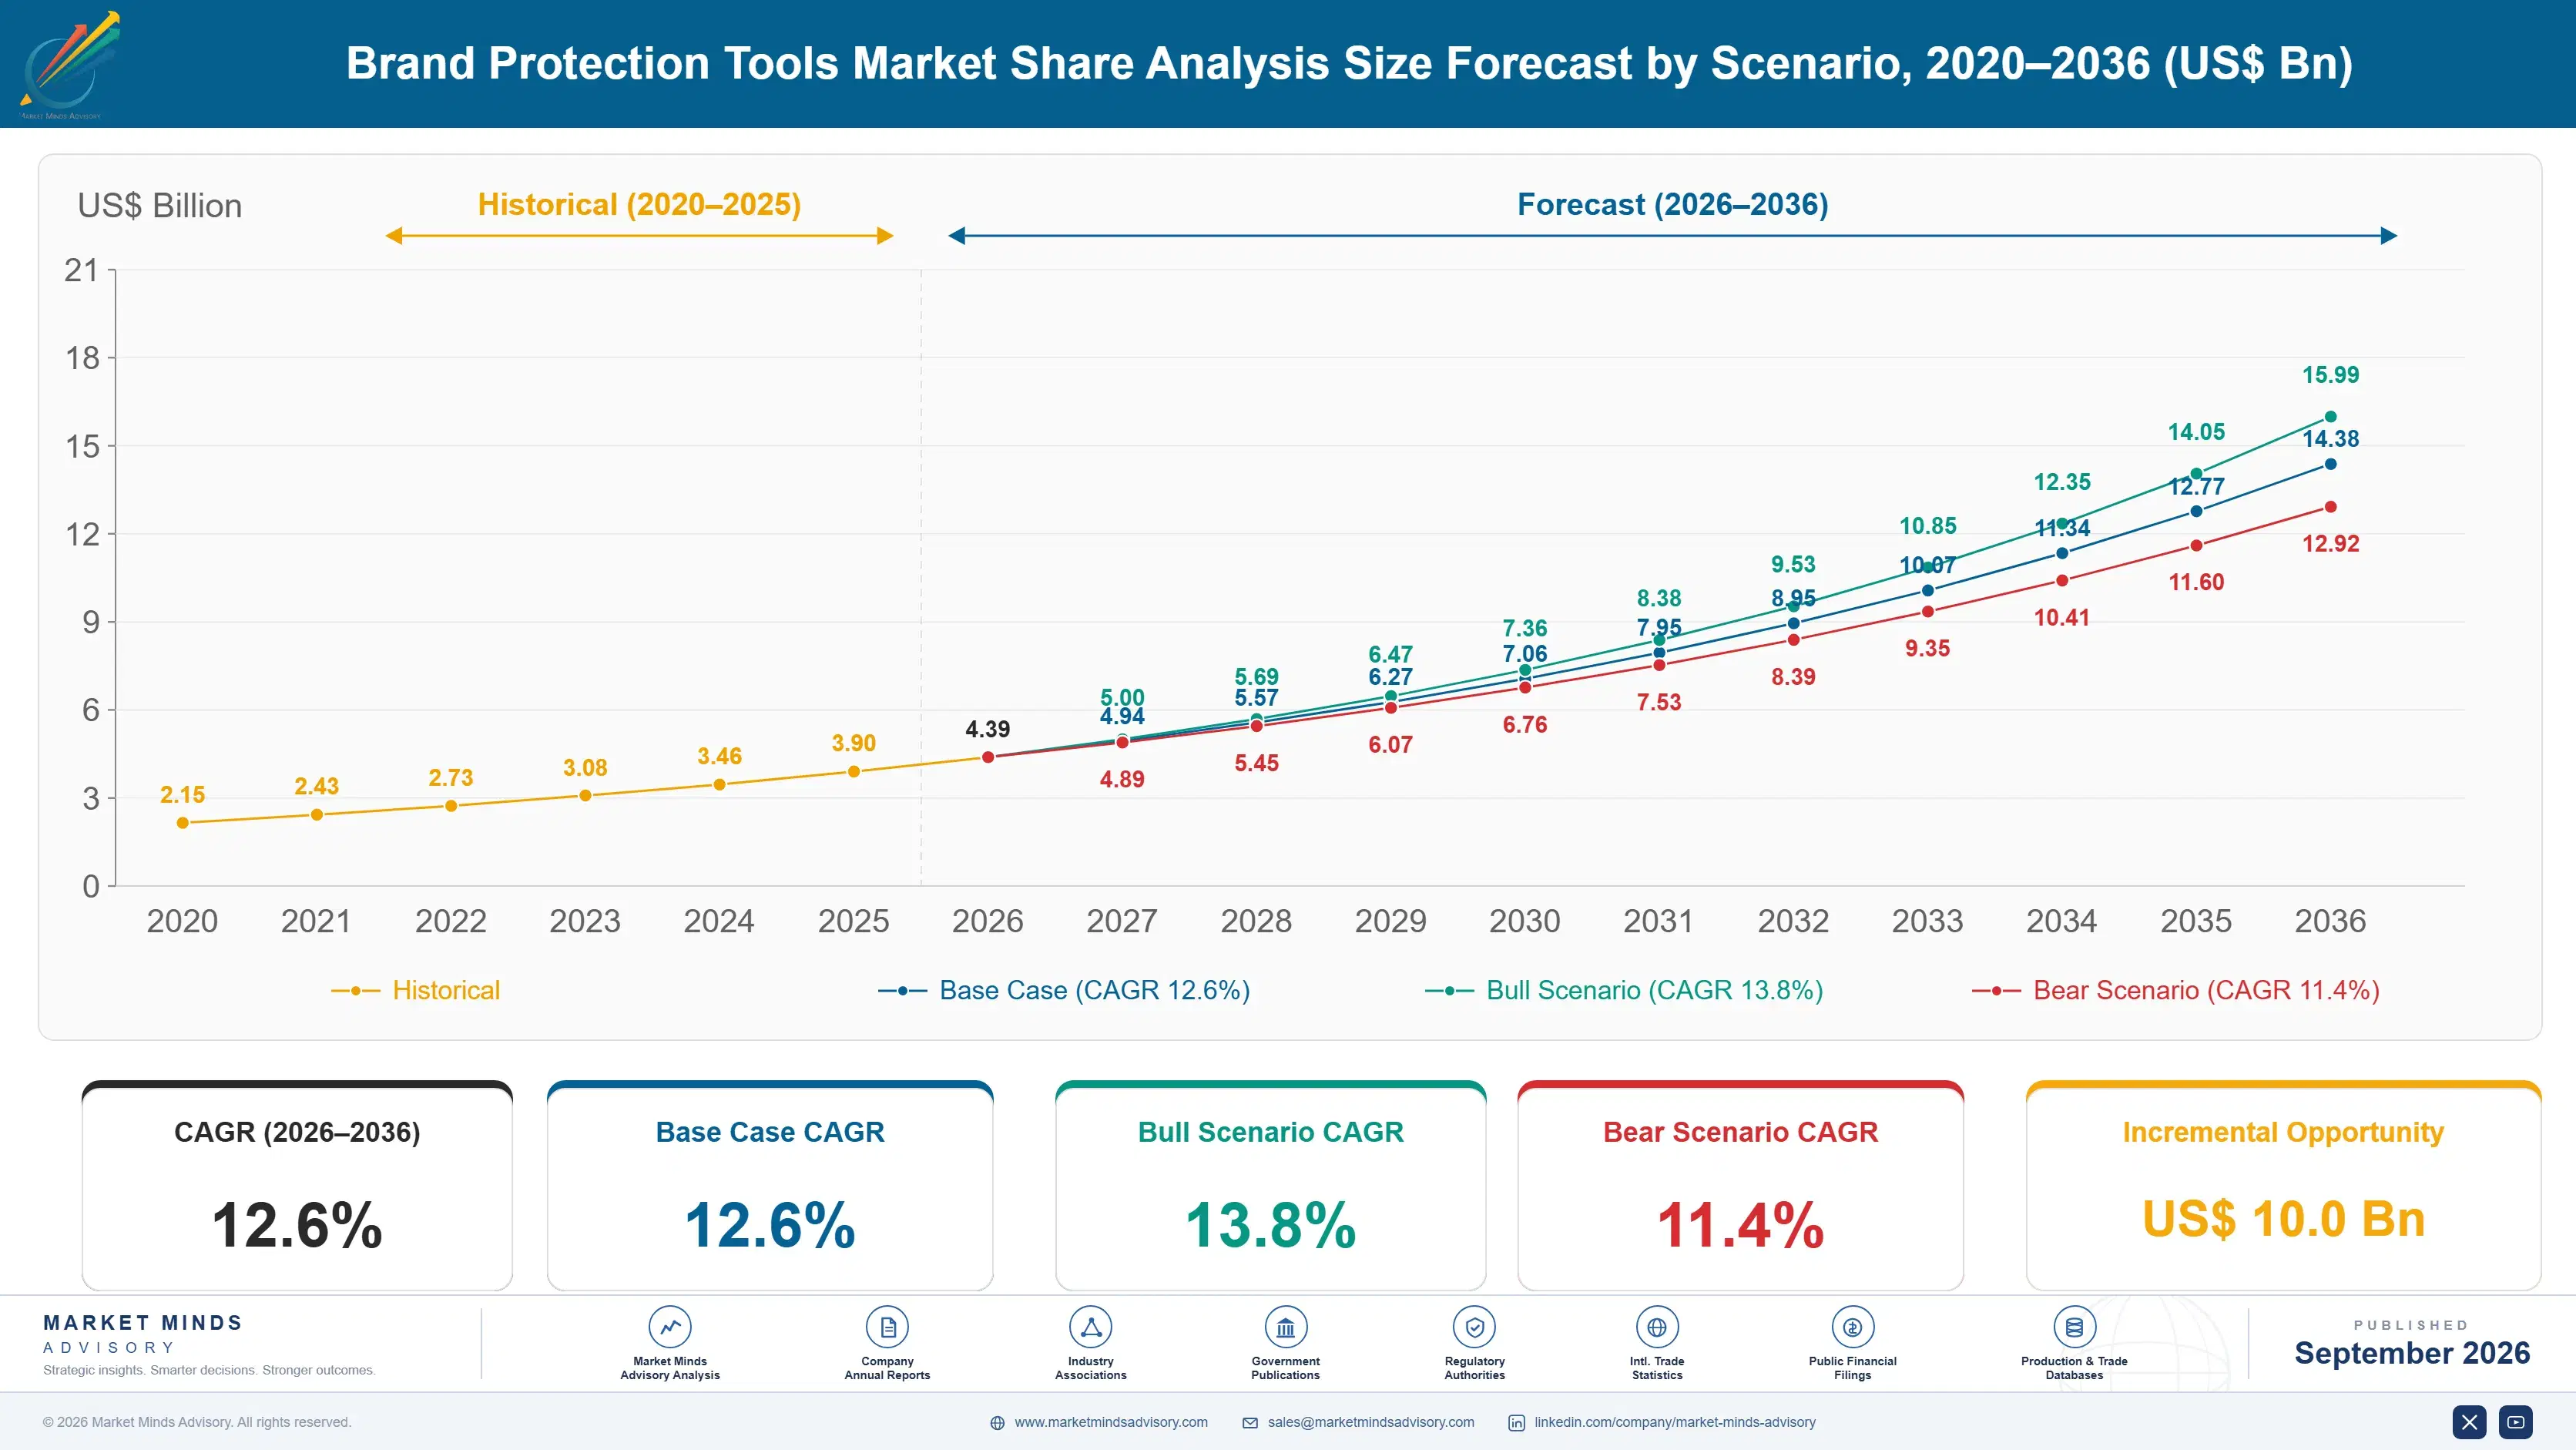
Brand Protection Tools Market Forecast Scenarios

brand-protection-tools-market-share-analysis-size-forecast-scenario-1790005497815
Growth between 2020 and 2025 tracked the expansion of online selling rather than any improvement in enforcement outcomes. Marketplace and social commerce volumes rose sharply, counterfeit listings rose with them, and brands bought detection capacity to keep pace. Historical growth of 11.2% reflects that arms race, in which programme budgets expanded steadily while measured availability of counterfeit product barely moved in either direction.
The base case at 12.6% rests on three mechanisms. Synthetic media impersonation creates a threat category with no established enforcement path, which brands are funding out of urgency rather than analysis. Marketplace liability rules in the European Union and several other jurisdictions shift responsibility toward platforms, which changes what brands must evidence and how. And grey market diversion, always present, has become measurable enough through serialisation data that enforcement finally has something to act on.
The bull case at 13.8% turns on platform liability regimes requiring documented brand cooperation, which would make programme spend a compliance obligation rather than a discretionary choice. The bear case at 11.4% is disillusionment: if enough brands measure availability rather than takedowns and conclude the programmes are not working, budgets contract toward the physical authentication and diversion work that demonstrably does.

Takedowns Are Not The Outcome

The reported metric and the actual outcome have drifted a long way apart. A large programme removes some 412,000 listings a year, which sounds decisive until you note that 78% of the sellers reappear under new accounts within days and measured availability of counterfeit product falls by roughly 6%. The tool is counting its own activity. Nothing about that arrangement is deliberate deception.
TOP FIVE CONCENTRATION37%Share of contracted spend held by the leading vendors
ANNUAL TAKEDOWN VOLUME412,000Listings removed per year by a large brand programme
SELLER RELISTING RATE78%Removed sellers returning under a new account identity
AVAILABILITY REDUCTION6%Measured decline in counterfeit product available after enforcement
MEDIAN PROGRAMME COSTUSD 890,000Annual spend by a large consumer brand owner
SYNTHETIC INCIDENT GROWTH214%Increase in impersonation cases using generated media yearly
Brands that measure availability instead behave differently. They concentrate enforcement on repeat sellers rather than on listing volume, they pursue payment and logistics chokepoints, and they accept much lower removal counts in exchange for outcomes they can demonstrate to a board. Vendors who support that shift lose an impressive dashboard and gain a defensible programme. Boards find the second version considerably more convincing.
Synthetic impersonation has broken the model that both approaches assumed. Incidents using generated media rose 214% in a year, and none of them present a listing to remove or a seller to identify. Detection now has to run against content that is created faster than it can be catalogued, which is a different technical problem and a different commercial proposition entirely. Vendors from security backgrounds are arriving faster than trademark specialists.
"We have sat in reviews where a brand celebrated removing more listings than the year before, which is the same as a pest controller celebrating a bigger catch. The programmes worth paying for are the ones willing to report a smaller number and explain why it is better."
Practice Director, Brand Integrity and Digital Risk · MMA Technology Practice · September 2026

Market Trends

Synthetic Impersonation Removes The Target Enforcement Assumed

Every established enforcement workflow assumes something identifiable to act against: a listing, a domain, a seller account. A generated video of a company executive endorsing an investment fraud has none of these, and by the time it is detected it has been reposted across platforms that each require separate notice. Incidents rose 214% in a year, and detection grows at 18.9% as brands fund response out of urgency rather than analysis. The commercial character differs sharply from listing enforcement, since success is measured in hours to containment rather than in volume removed.
Market Impact: Restructured 41% of programmes

Serialisation Data Makes Grey Market Diversion Actionable

Diversion has always been the quiet problem in brand protection, costing more than counterfeiting at many companies and going unenforced because nobody could prove where a unit left the authorised channel. Serialisation across packaging and logistics has changed that: a scanned code recovered from an unauthorised seller identifies the distributor it was shipped to. Grey market tracking grows at 16.1% on that basis, and the enforcement is contractual rather than legal, which makes it faster, cheaper, and considerably more effective than pursuing anonymous marketplace sellers. Sales relationships are the obstacle, not the data.
Market Impact: Drives 17.2% Indian growth

Market Opportunities and Growth Drivers

Marketplace Liability Rules Shift Responsibility Toward Platforms

European Union rules and comparable measures elsewhere place obligations on marketplaces to act on notified infringement and to verify trader identity, which changes what a brand must evidence and how quickly platforms must respond. Brands with documented notice programmes now obtain faster action and, in disputes, a considerably stronger position. Around 41% of large brand programmes have restructured their evidence and notice processes specifically to meet these requirements, which converts enforcement tooling from an operational choice into part of a legal posture the company must maintain. Notice quality now determines platform response times.
Market Impact: Relisting rate reaches 78%

Social Commerce Growth Outpaces Marketplace Enforcement Practice

Selling through short video platforms and messaging applications has grown quickly in Asia and is spreading, and the enforcement mechanisms there are far less developed than on established marketplaces. Notice processes are inconsistent, seller identity is weaker, and content disappears before evidence can be captured. Indian growth of 17.2% leads every country covered largely on this. Brands are buying monitoring capability for channels where takedown may not even be available, accepting evidence gathering as the realistic objective until enforcement practice catches up. Evidence capture precedes any enforcement route here. Practice will catch up eventually.
Market Impact: Availability falls just 6%

Market Restraints and Challenges

Removed Sellers Return Within Days Under New Accounts

About 78% of sellers removed from a marketplace reappear under a fresh account identity, and the root cause is that account creation costs nothing while enforcement costs money on every cycle. The economics favour the infringer permanently. Commercially this caps what listing enforcement can achieve, produces the 6% availability reduction that most programmes actually deliver, and undermines vendor credibility once a brand measures properly. Participants respond by targeting repeat sellers across identities, by pursuing payment and logistics chokepoints, and by pushing platforms toward stronger trader verification. Trader verification is the only durable answer.
Market Impact: Incidents rose 214% yearly

Programme Success Is Reported In Activity Not Outcome

Takedown volume is easy to count, rises reliably, and tells nobody whether counterfeit availability changed. The root cause is that availability measurement requires independent test purchasing and category-level sampling, which costs money and frequently produces uncomfortable answers. Commercially this sustains programmes that do not work and delays the shift toward approaches that do, while exposing vendors to a reckoning when a brand finally measures. Mitigation runs through independent availability panels, test purchase programmes, and reporting that leads with availability while retaining takedown counts as an operational statistic. Independent panels are the honest instrument.
Market Impact: Grows 16.1% each year
3 additional market trends, 4 additional growth drivers, and 2 additional restraints and challenges are covered in the full report. Contact sales@marketmindsadvisory.com to access the complete intelligence.

Segment CAGR and Growth Architecture

Segmentation follows the protection function performed. Six segments cover the field: marketplace listing detection and takedown, domain and phishing site enforcement, social media and impersonation monitoring, synthetic media and AI impersonation detection, grey market and diversion tracking, and physical authentication and serialisation services. Listing enforcement dominates spending today. Diversion and synthetic work carry the growth.
brand-protection-tools-market-share-analysis-market-share-analysis-1790005498416

Synthetic Media And AI Impersonation Detection

Synthetic detection grows at 18.9%, half again the market rate of 12.6%, and it is the only segment where brands are buying without a settled view of what success looks like. Incidents rose 214% in a year. The target has no listing, no seller account, and frequently no jurisdiction, so the workflow is containment speed rather than removal volume, measured in hours from publication to platform action across every surface the content reached. Detection has to run against material generated faster than any catalogue can index it, which is a genuinely different technical problem and attracts vendors from security rather than from trademark enforcement backgrounds. Procurement standards have not yet formed.
CAGR 18.9%

Grey Market And Diversion Tracking

Diversion tracking grows at 16.1% and quietly delivers better outcomes than listing enforcement at most companies that run both. Serialisation makes the problem actionable: a code recovered from an unauthorised seller identifies the distributor the unit was shipped to, which converts an anonymous enforcement problem into a contractual conversation with a named partner. That conversation is faster, cheaper, and far more final than pursuing marketplace sellers who relist within days. The obstacle is internal rather than technical, since the distributor concerned is frequently a significant customer, and commercial teams resist enforcement that sales relationships have to absorb. Brands that run both approaches consistently find diversion enforcement delivers the better measured outcome per dollar spent.
CAGR 16.1%
Full segment breakdown across 6 segments available in the complete report.

Regional Architecture and Country Demand Map

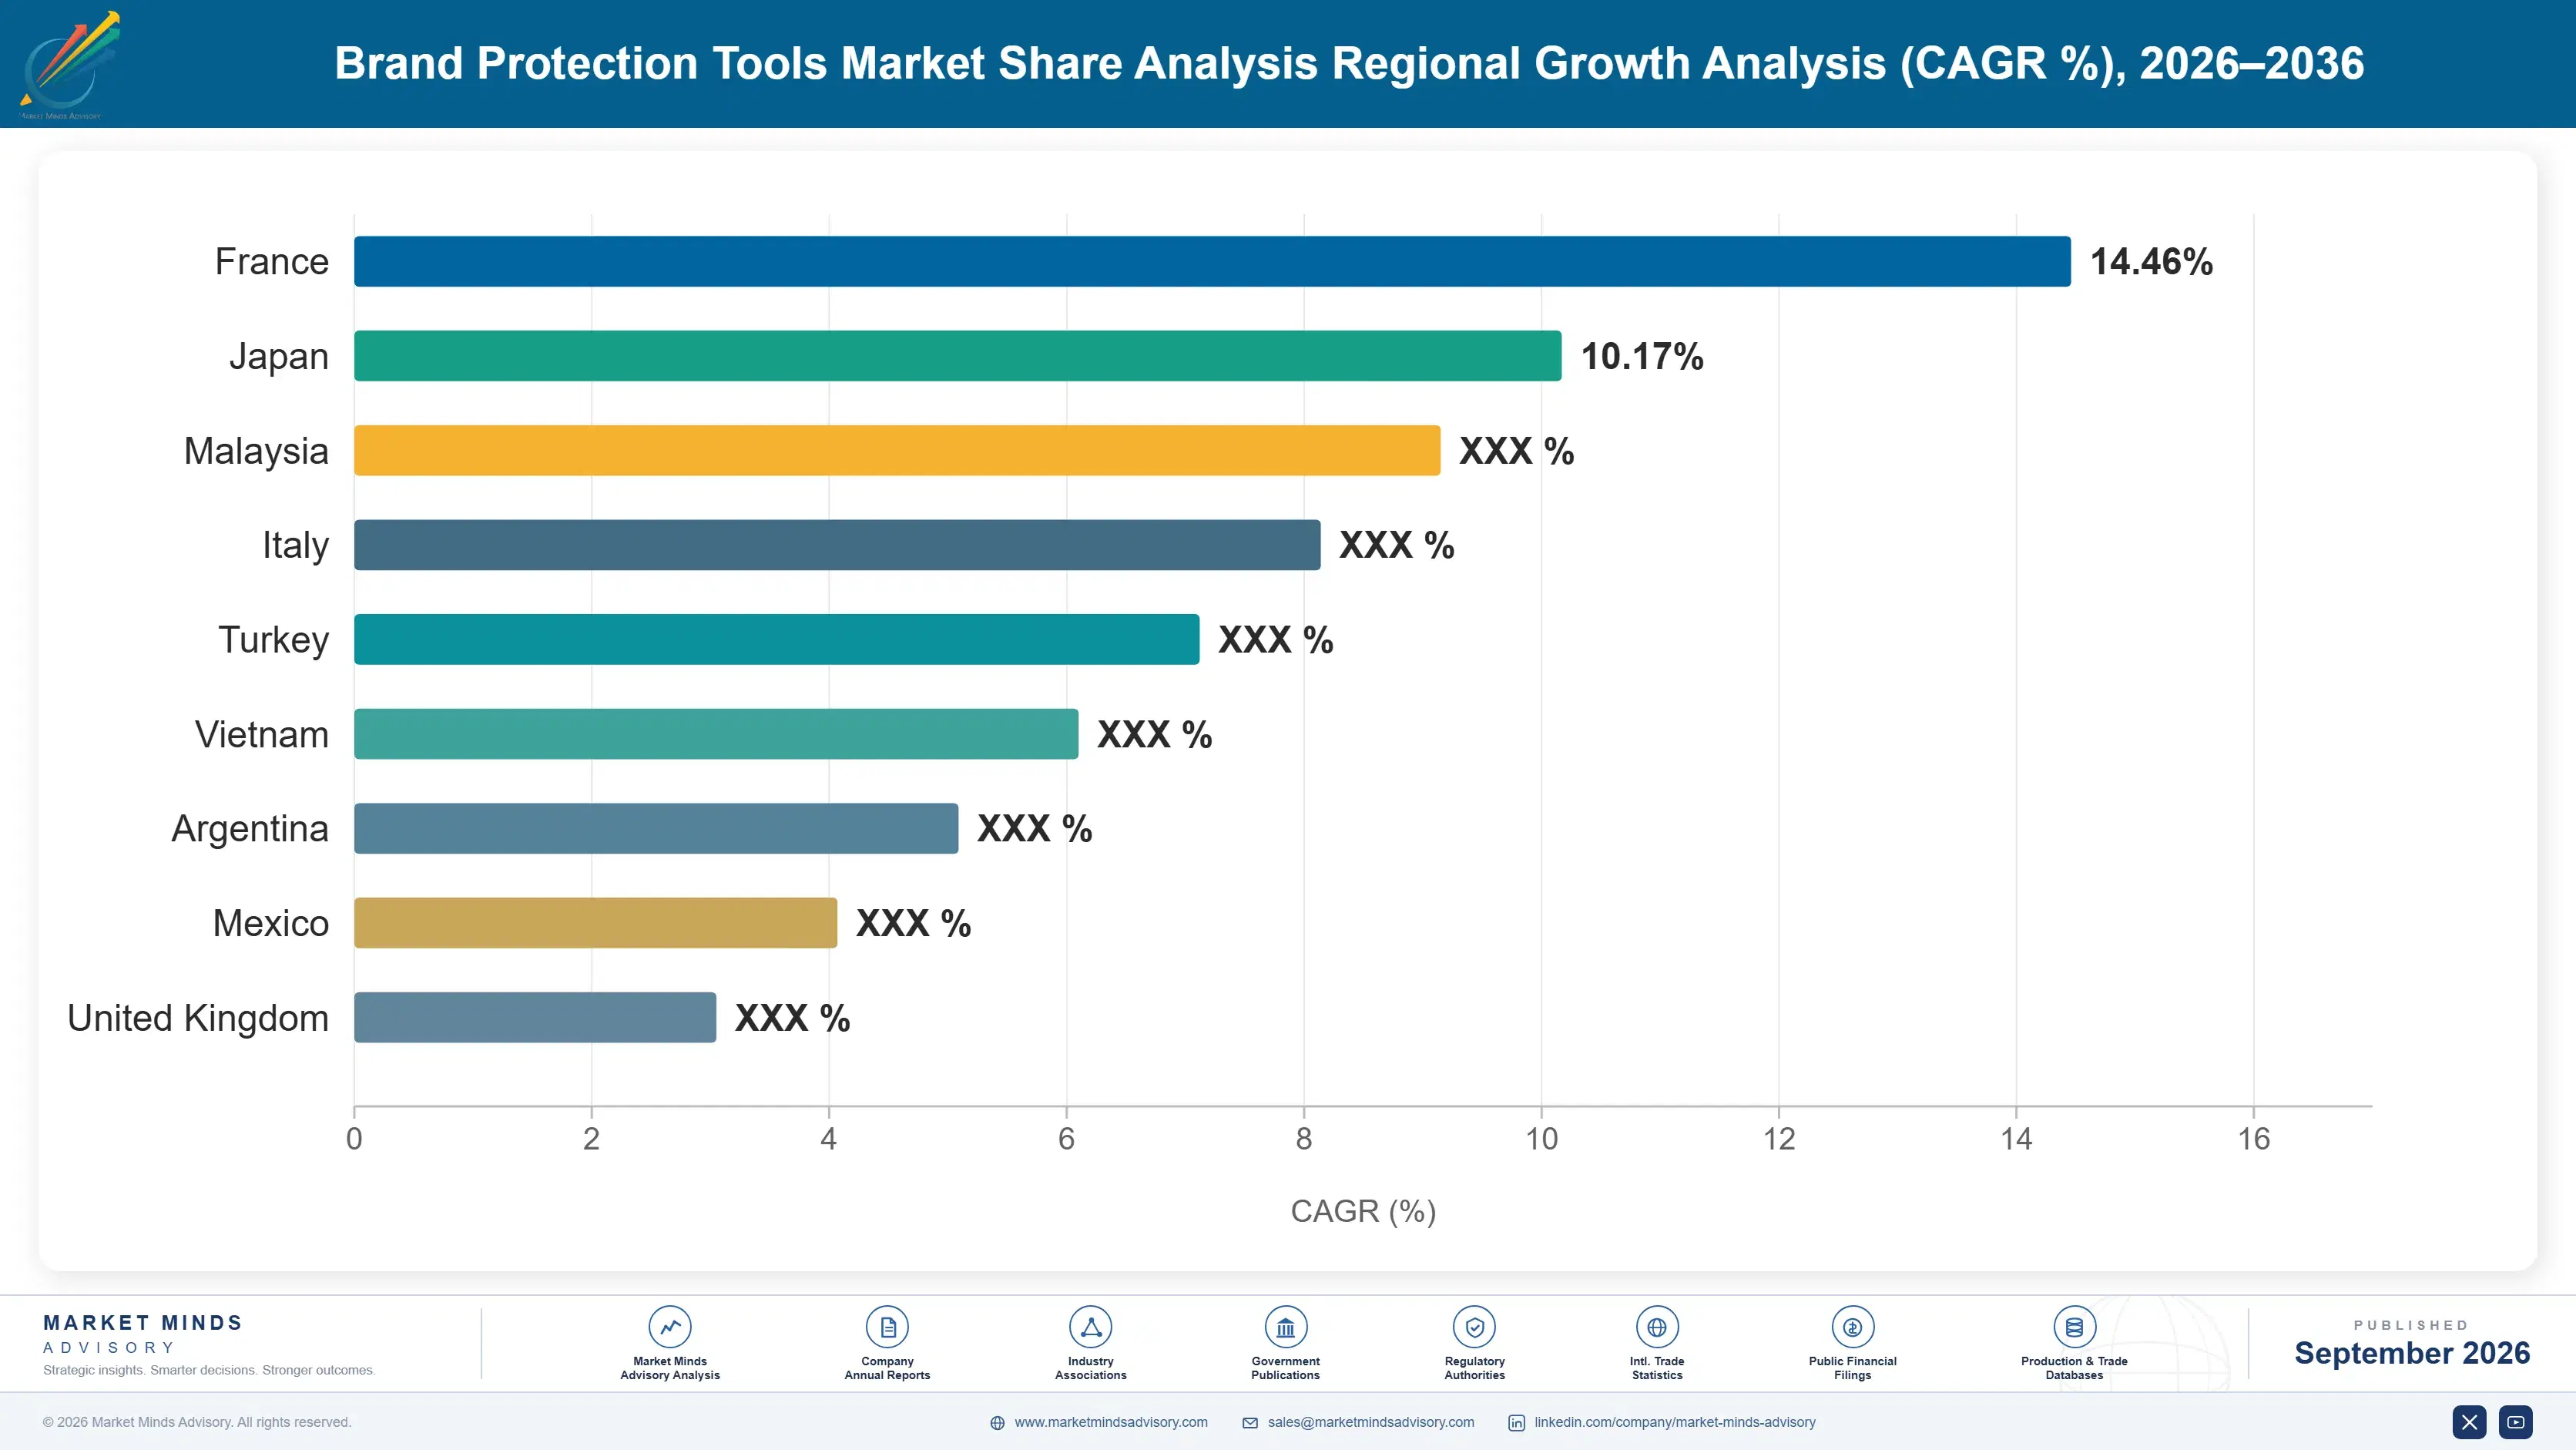
Regional shares follow where brand owners are headquartered and fund enforcement, not where infringement originates. The two are almost inversely related, which makes this table a map of who pays rather than of where the problem physically sits. Enforcement budgets follow headquarters, not factories. The distinction matters commercially.

North America

Enforcement spending follows brand ownership, and the concentration of large consumer, pharmaceutical, and technology brand portfolios here explains a 32% share on a counterfeit origin base that is comparatively small. Programme budgets averaging near USD 890,000 at large brand owners are the highest anywhere. Synthetic impersonation response has been funded fastest here, driven by executive impersonation fraud that reached several very public incidents. Growth of 11.8% is moderate, held back by a maturing listing enforcement market and by a growing number of brands measuring availability rather than takedown volume and reconsidering what they are buying. Executive impersonation fraud accelerated synthetic response funding considerably here. Programme budgets here are the largest anywhere covered.
Share: 32% | CAGR: 11.8% (2026 to 2036)

Western Europe

Marketplace liability rules changed the commercial character of enforcement here before anywhere else, obliging platforms to act on notified infringement and verify trader identity. Brands with well-documented notice programmes obtain faster action and stronger positions in dispute, which converts tooling into part of a legal posture rather than an operational preference. Luxury goods, pharmaceuticals, and automotive parts drive most spending. Growth of 11.1% is the slowest of the seven regions, reflecting a mature buyer base where most large brand owners already run programmes and expansion depends on adding functions rather than adding customers. Notice documentation has become part of the legal posture itself. Most large brand owners already run a programme here.
Share: 25% | CAGR: 11.1% (2026 to 2036)
Regional intelligence for 5 additional markets available in the complete report: East Asia, South Asia and Pacific, Latin America, Middle East and Africa, Eastern Europe. Contact sales@marketmindsadvisory.com.
brand-protection-tools-market-share-analysis-country-cagr-analysis-1790005498955

Where Vendors Build Defensible Programmes

Four commercial moves separate vendors building durable programmes from those selling takedown volume that will not survive proper measurement. Each accepts an uncomfortable premise: the metric the industry reports is not the outcome the buyer wanted, and the reckoning arrives whenever a brand finally checks. Brands are starting to check. That is the commercial risk.

Report Availability Instead Of Removal Counts

Independent test purchasing and category sampling measure whether counterfeit product is actually harder to buy, which is what the brand wanted and what takedown volume never showed. Vendors leading with availability lose an impressive dashboard and gain a programme that survives board scrutiny, with retention roughly 44% higher than volume-reported engagements. The number reported gets smaller and the contract gets safer. It also positions the vendor correctly when a brand runs its own measurement, which is increasingly when relationships end. Volume dashboards impress nobody once availability is on the page.
Market Impact: Improves client retention by roughly 44% overall today

Target Repeat Sellers Across Multiple Account Identities

Since 78% of removed sellers return under new accounts, enforcement aimed at listings is a treadmill by design. Identifying the operator behind many accounts, through payment details, logistics patterns, and listing fingerprints, allows action that actually removes capacity rather than inventory. Programmes structured this way reduce measured availability by 3 to 5 times more than volume-based enforcement at comparable cost. The analytical work is harder and the reported numbers are smaller, which is precisely why so few programmes are structured this way. Capacity removal outlasts inventory removal entirely. Smaller numbers, better outcomes.
Market Impact: Reduces availability 3 to 5 times more effectively

Convert Serialisation Data Into Diversion Enforcement

A serialised code recovered from an unauthorised seller names the distributor it shipped to, which turns an anonymous problem into a contractual conversation with a known partner. Diversion frequently costs more than counterfeiting at consumer and pharmaceutical brands, and enforcement is faster and cheaper because it runs through commercial agreements rather than courts. Vendors offering this alongside listing enforcement carry contract values roughly 50% to 75% above detection-only engagements, and they reach a budget holder in supply chain rather than in legal. Supply chain budgets are separate and considerably larger.
Market Impact: Lifts contract value by roughly 50% to 75%

Sell Containment Speed For Synthetic Impersonation

Generated impersonation content has no listing to remove, so the deliverable is hours from publication to containment across every surface it reached. Incidents rose 214% in a year and brands are funding response without a settled view of success, which makes this the one segment where a vendor can define the metric rather than inherit it. Early movers are establishing containment time as the standard and reporting median response under four hours. Whoever sets that benchmark shapes procurement for the whole segment. No competitor can later argue against a benchmark buyers already accepted.
Market Impact: Sets containment under 4 hours as the standard

Who Controls the Margin Pool

Concentration is moderate and the field is still forming. Five vendors hold 37% of contracted spend, measured consistently on that basis across all participants, and they arrive from three different origins: trademark and domain services, physical authentication and serialisation, and cyber security. The gap between the leader and the fifth is narrow, and acquisition rather than organic growth has moved positions most in recent years. No participant approaches anything resembling dominance today.
Competition currently turns on three things: whether the vendor can measure availability rather than activity, coverage of social commerce channels where notice processes are immature, and speed of response on synthetic impersonation. Detection breadth, long the standard pitch, differentiates less than it did because most credible vendors now cover the major marketplaces adequately. Coverage claims differentiate far less than they once did.

Pressure comes from two directions. Security firms are taking synthetic impersonation work where trademark heritage confers nothing useful. Meanwhile serialisation providers are reaching supply chain budgets that detection vendors never touched. Rankings will shift toward whoever can combine availability measurement with diversion enforcement, which is where demonstrable outcomes currently sit. Demonstrable outcomes are becoming the scarce commodity here.
brand-protection-tools-market-share-analysis-company-positioning-matrix-1790005499486

Competitive Moat and Risk Dimensions

CORSEARCH

Moat: Breadth Across Enforcement Functions

Coverage spanning trademark screening, marketplace enforcement, and domain protection lets a brand consolidate several vendor relationships, which matters because brand protection teams are typically small and each additional supplier carries genuine management overhead. That breadth wins programme-level decisions single-function specialists cannot compete for at all.
CORSEARCH

Risk: Volume Reporting Legacy Exposure

A large installed base built on takedown volume reporting is exposed as more brands measure availability and find the numbers disappointing. Repositioning means reporting smaller figures to existing clients and explaining why that is progress, which is a conversation competitors without the legacy never have to hold.
ZEROFOX

Moat: Security Heritage For Synthetic Threats

Origins in external threat intelligence rather than trademark enforcement suit synthetic impersonation, where the work is rapid detection and containment across many surfaces rather than notice and takedown against an identified seller. That positioning matches the fastest growing segment in the category almost exactly. Trademark heritage confers very little advantage in that work.
ZEROFOX

Risk: Physical Enforcement Capability Absent

Diversion tracking and serialisation reach supply chain budgets that digital-only vendors cannot address, and those engagements carry higher contract values with demonstrable outcomes. Competing there requires physical authentication capability that must be acquired rather than built, in a segment where established providers hold long manufacturer relationships.

Players Tracked

Prominent Players

Corsearch
MarkMonitor
Red Points
OpSec Security
ZeroFox

Other Key Players

Authentix
SICPA
De La Rue
Systech
Bolster
Doppel
BrandShield
Pointer Brand Protection
Netcraft
Fortra
Recorded Future
ReliaQuest
Cloudflare
Verisign
Avery Dennison

Recent Developments

JANUARY 2026

Red Points Releases Synthetic Impersonation Detection With Containment Reporting

Red Points released detection for generated video and audio impersonation, reporting performance as median hours from publication to containment across affected platforms rather than as volume of content removed, which is the established measure elsewhere. Coverage spans video, audio, and static imagery across major social platforms.
Signal: Vendors are defining the success metric themselves in a segment where no procurement standard yet exists.
SEPTEMBER 2025

Corsearch Acquires Serialisation And Diversion Tracking Specialist

Corsearch completed an acquisition of a diversion tracking specialist, adding the ability to trace serialised units recovered from unauthorised sellers back to the distributor they shipped to, and reaching supply chain budgets its detection business never addressed. Enforcement then proceeds contractually rather than through platform notice.
Signal: Detection vendors are buying physical capability because diversion enforcement produces outcomes that listing takedown never can.
MAY 2025

OpSec Security Awarded Enforcement Programme By Luxury Goods Group

OpSec Security was selected to run enforcement across a luxury goods group's brand portfolio, with the award specifying independently measured counterfeit availability as the reporting standard instead of the takedown volume metric used previously. Independent test purchasing across four product categories establishes the baseline for reporting.
Signal: Availability measurement is entering contracts, which will eventually expose programmes that only report their own activity.

What Enforcement Costs To Run

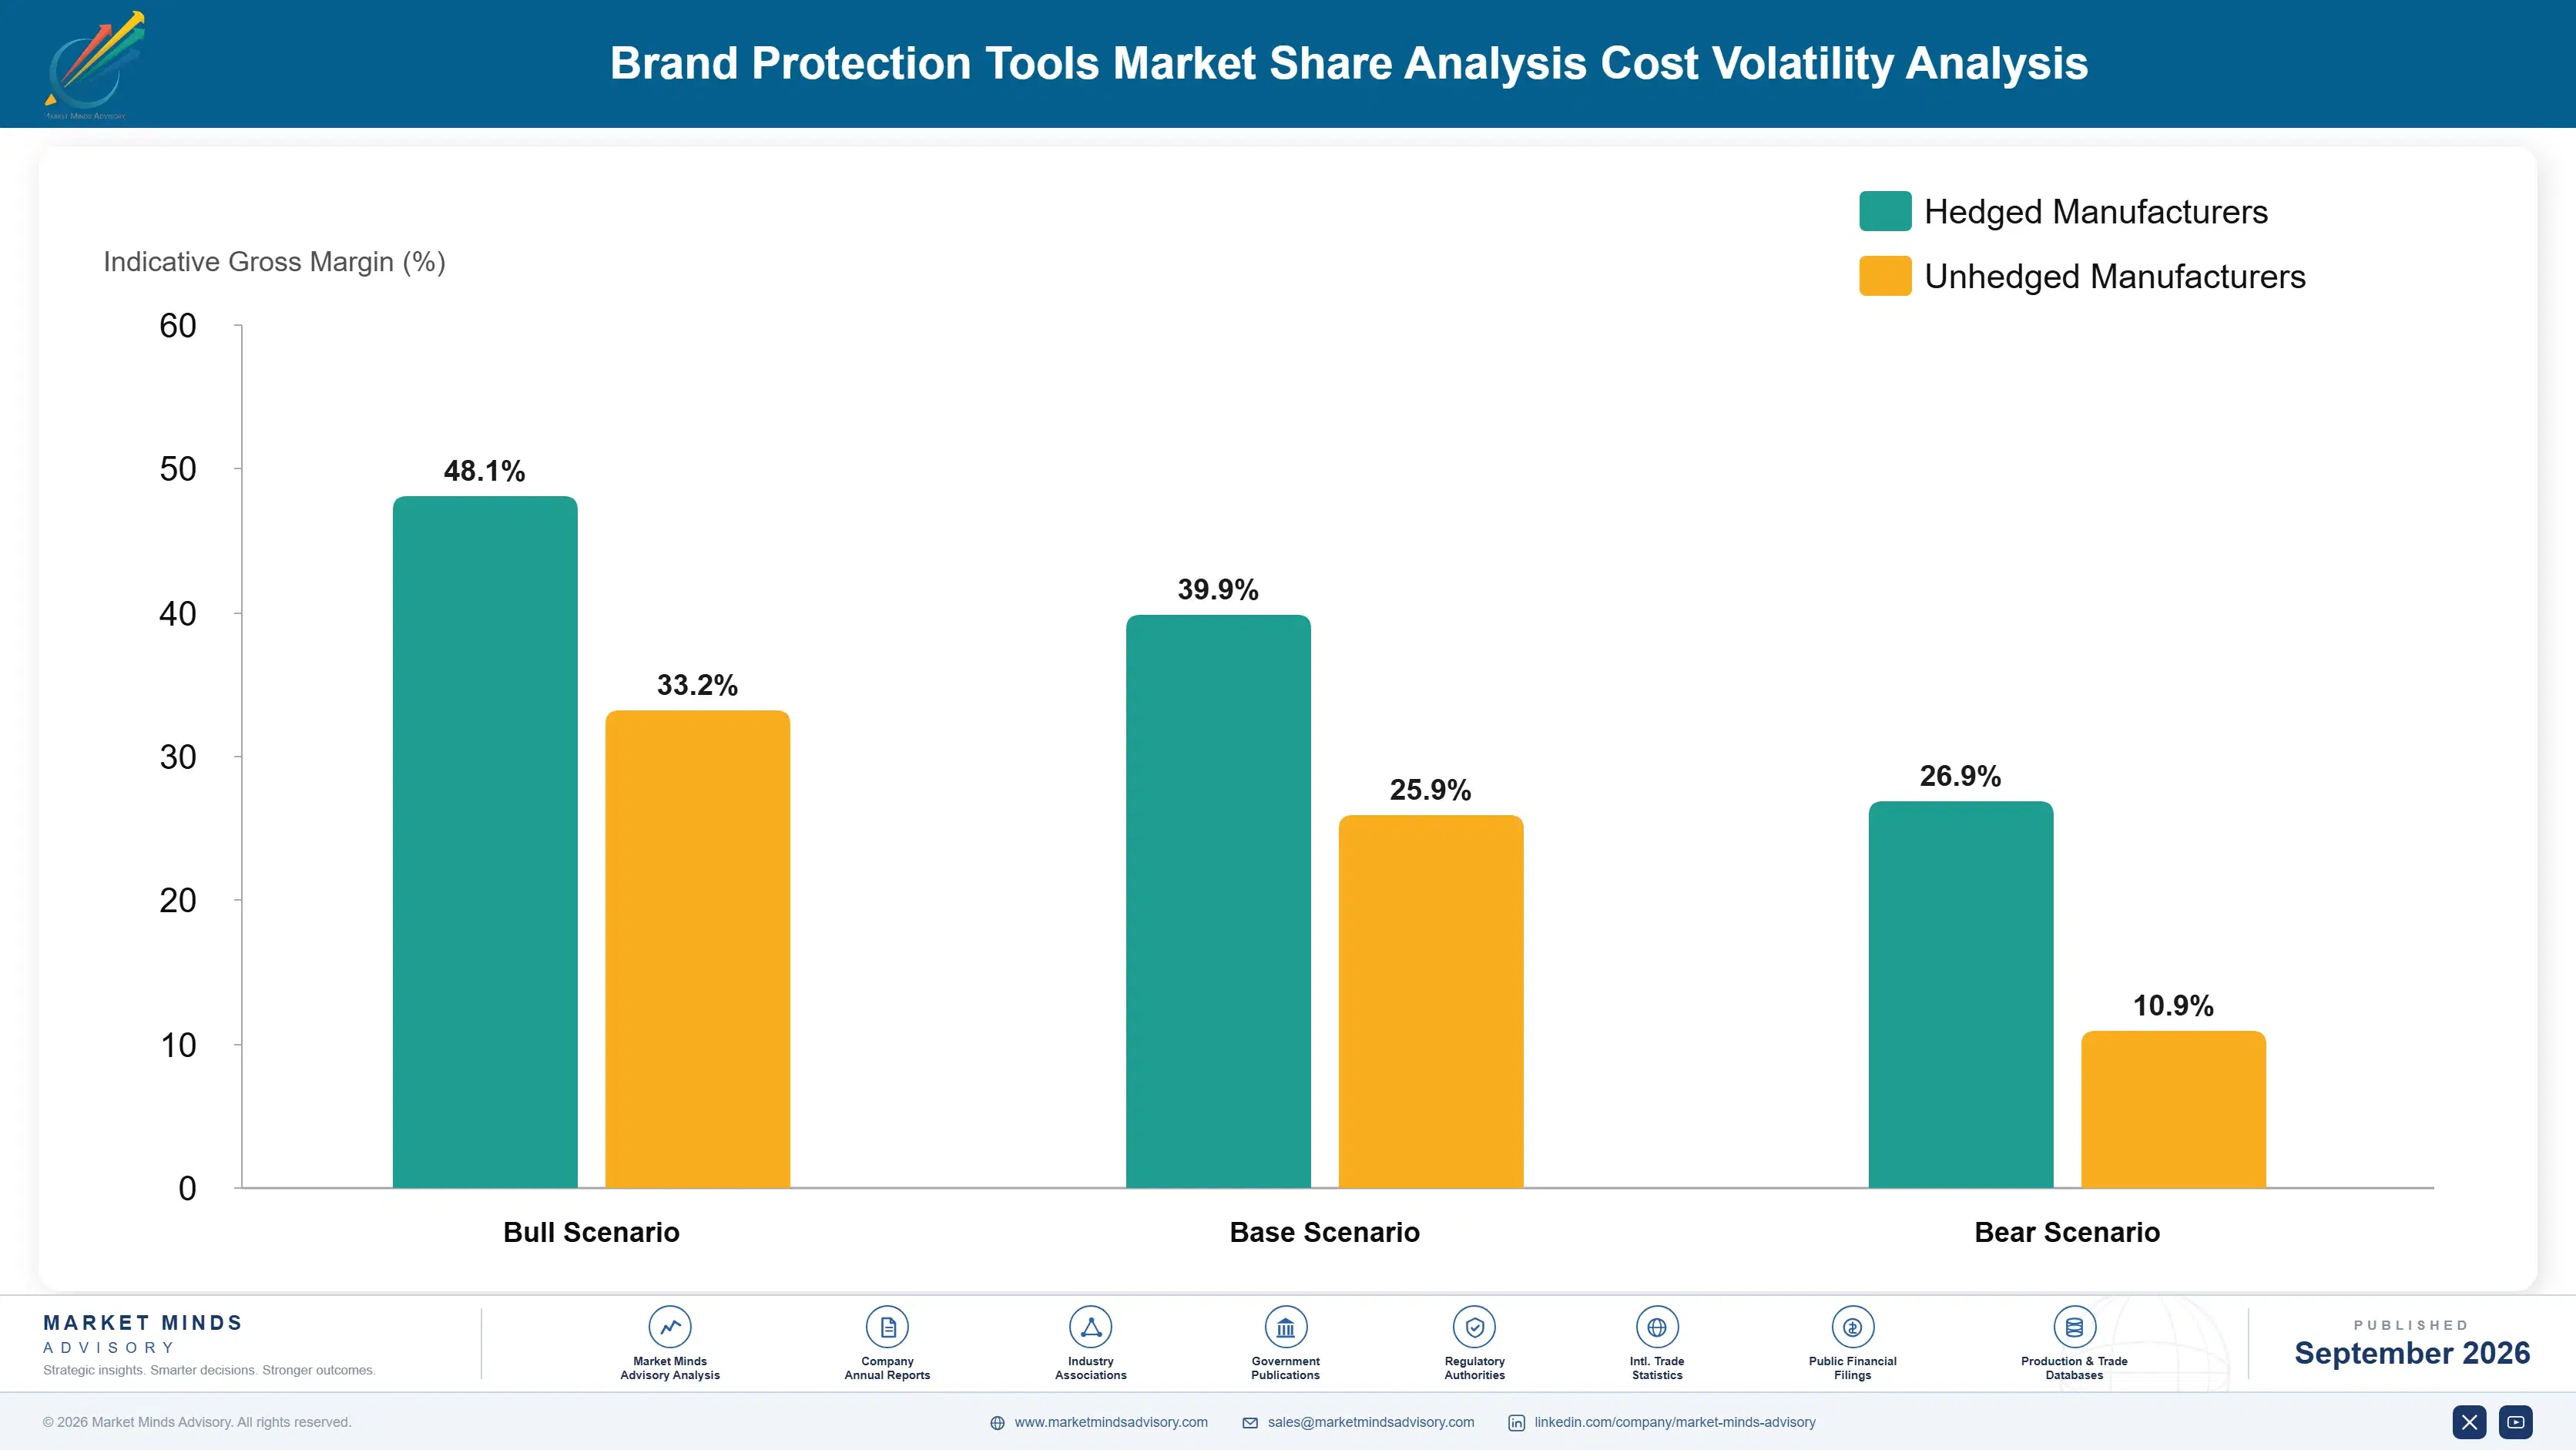
Three inputs dominate. Data acquisition and crawling infrastructure runs 22% to 28% of cost of goods sold, human analyst review of flagged items takes 30% to 38%, and legal notice preparation with filing costs adds a further 12% to 18%. Data access depends on platforms that increasingly restrict automated collection, which concentrates operational exposure on parties with no commercial interest in cooperating.
Platform access repricing and expanded anti-collection measures through 2024 and 2025 raised acquisition cost materially, and several vendors described the resulting gross margin pressure in their annual reports for those years. Fixed-fee enforcement contracts absorbed the difference entirely, since brand programmes are budgeted annually and rarely repriced mid-term. Volume-based commercial terms have become more common as a direct result. Buyers now carry more of that exposure than they once did.

The competitive disadvantage mechanism runs through analyst review rather than through detection. A vendor whose detection produces high false positive rates carries human review cost that a better-tuned competitor does not, and cannot price against it when the buyer compares annual programme fees. Exposure varies by player type. Large vendors amortise detection development across many brands. Single-category specialists carry review staff against fewer programmes and feel every miss.
brand-protection-tools-market-share-analysis-cost-volatility-analysis-1790005499683

Reduce False Positives Before Adding Detection Coverage

Analyst review is the largest single cost line, and it scales with false positives rather than with genuine infringement. Vendors who invested in precision rather than in coverage breadth report review hours per programme falling by roughly a third, which converts directly into margin and into competitiveness on annual programme fees. Precision beats coverage on the income statement.

Move To Volume Based Commercial Terms

Fixed annual fees leave the vendor carrying platform access cost increases that nobody can forecast, on contracts that rarely reprice mid-term. Structuring terms around monitored volume shifts that exposure to a buyer better placed to absorb it, and brands generally accept the arrangement once the access cost position is explained. Access cost is transparent enough to explain.

Prioritise Enforcement By Measured Availability Impact

Filing notice on every detected listing consumes legal cost against a relisting rate near four in five. Ranking enforcement by likely effect on measured availability concentrates the same budget on repeat operators and chokepoints, which lowers cost per programme while improving the outcome the brand actually wanted. Legal spend concentrates where it changes something measurable.

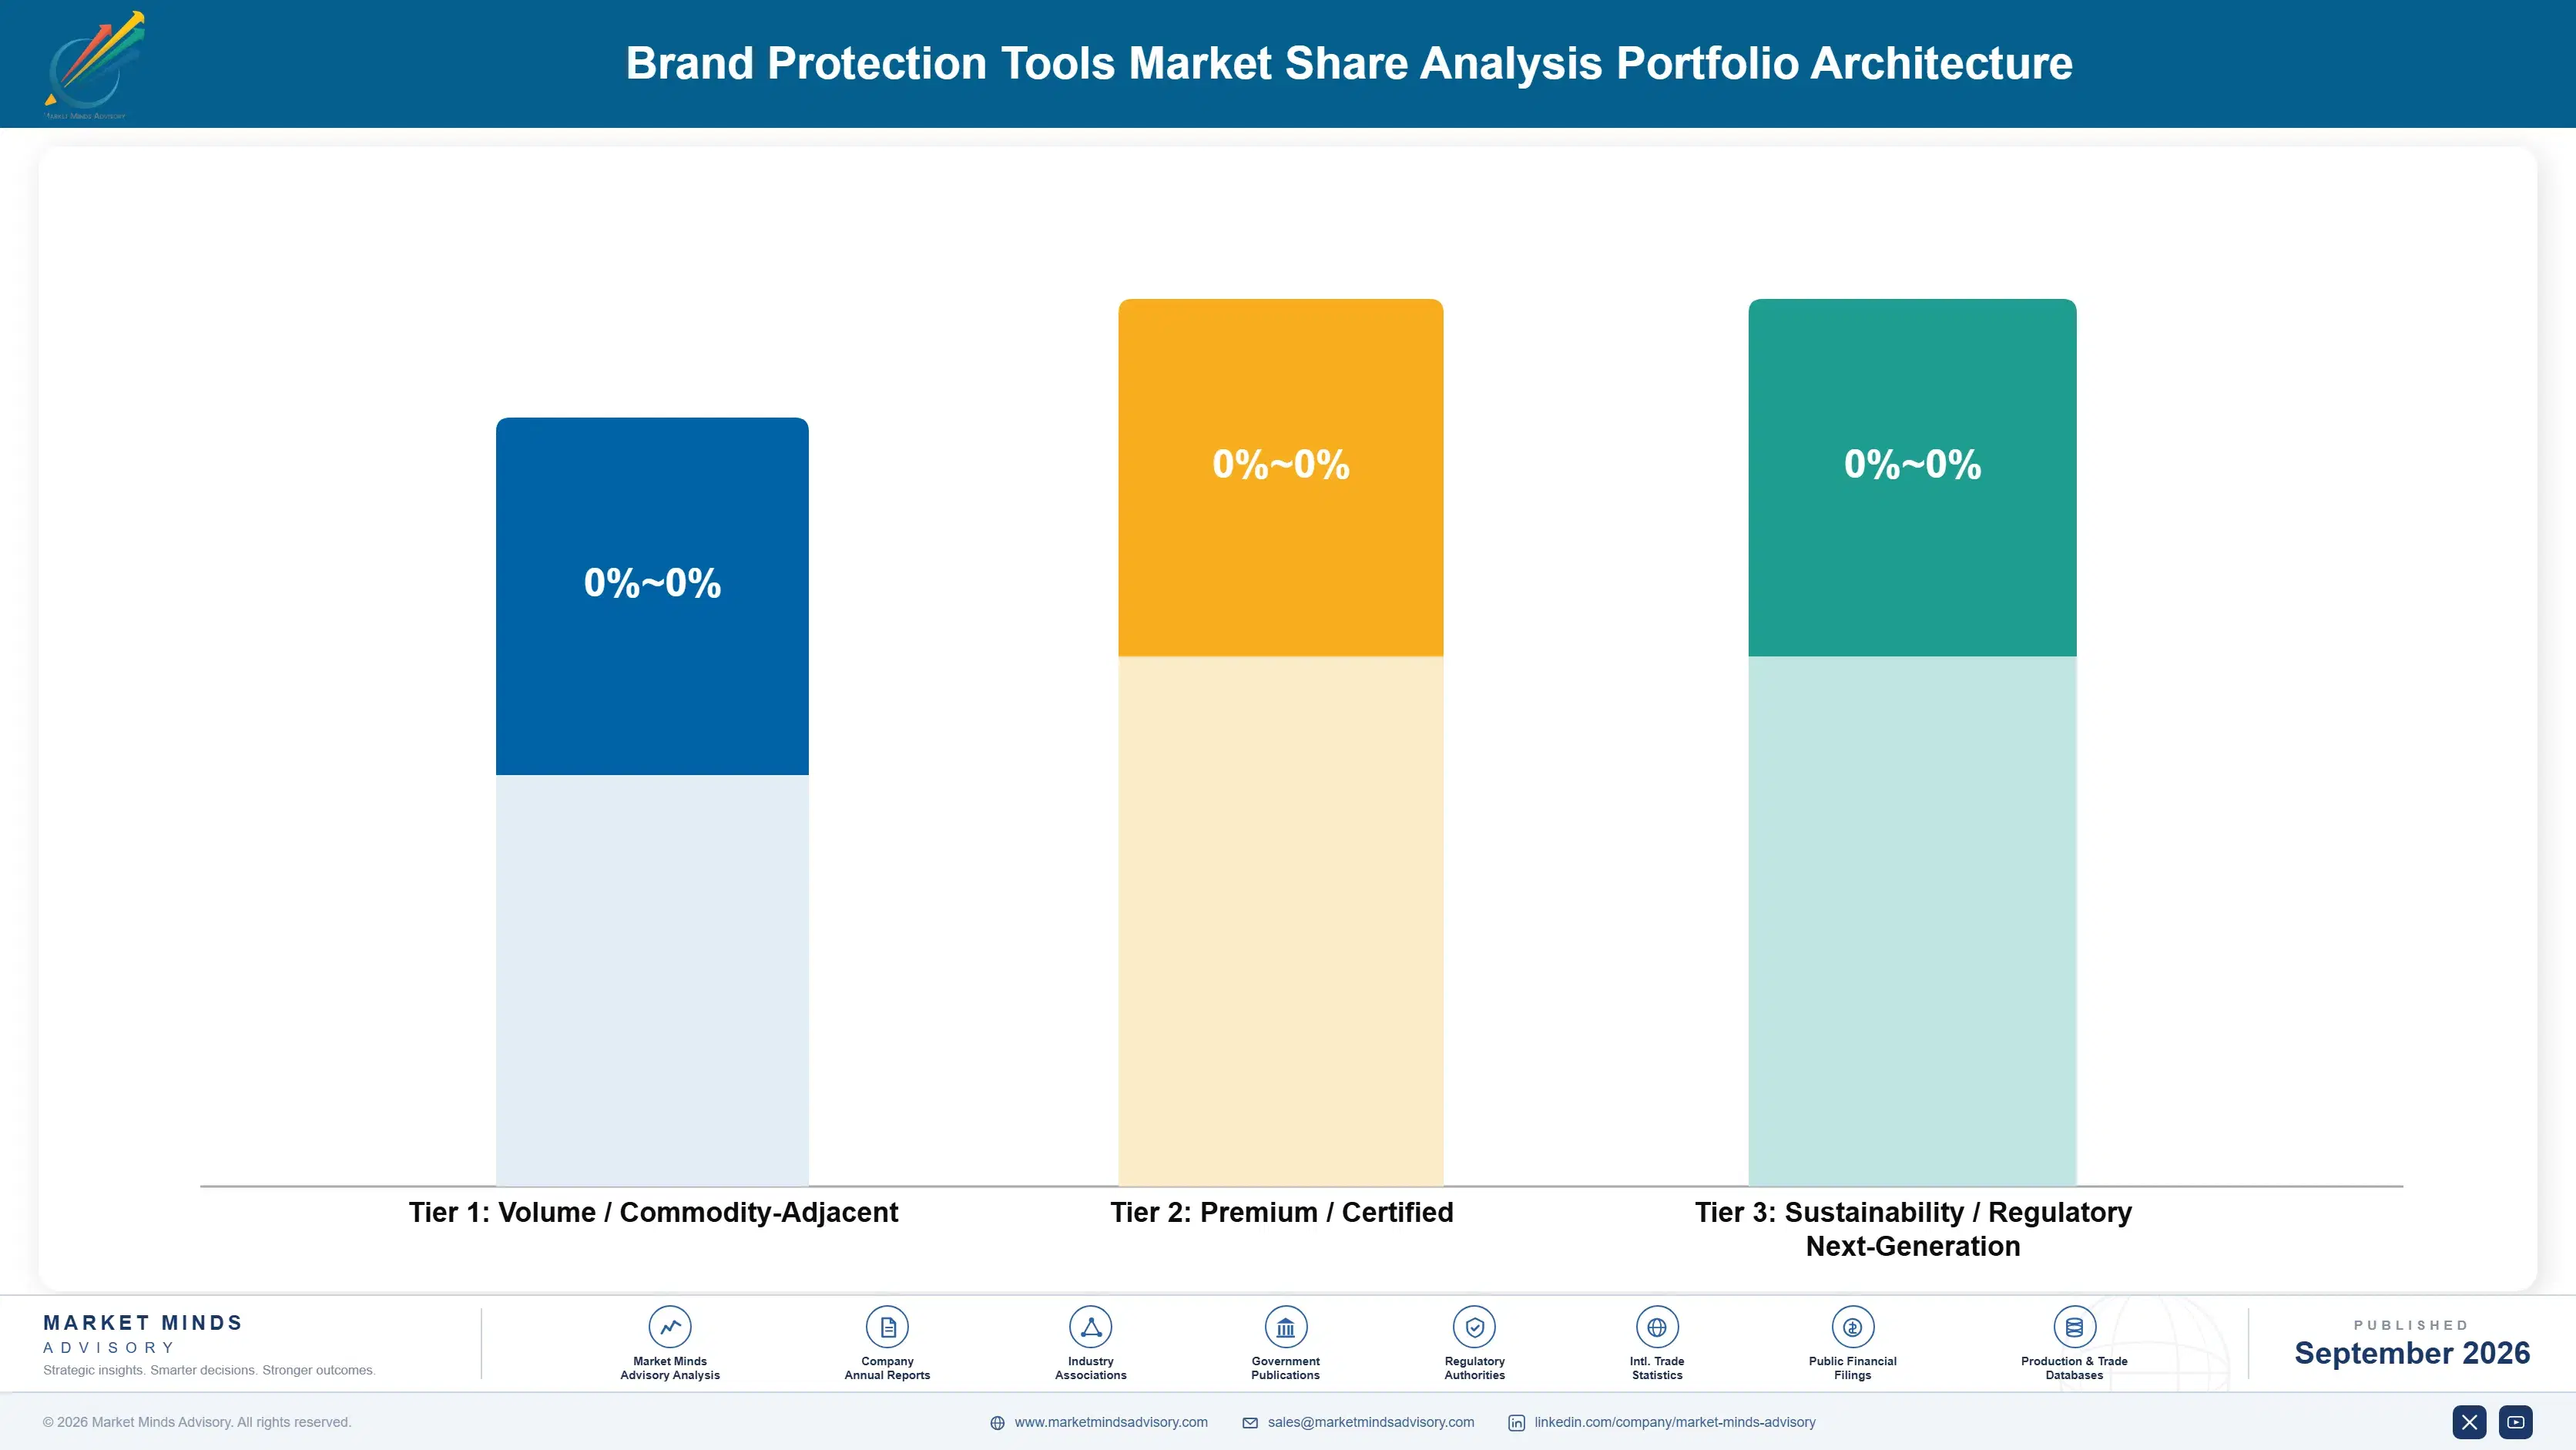
Portfolio Architecture for Margin Defence

Margin follows how demonstrable the outcome is. Listing detection and takedown is drifting toward commodity, since most credible vendors cover the major marketplaces adequately and buyers compare annual fees against volume reported. Availability-measured enforcement and diversion tracking earn considerably more. Synthetic impersonation response earns most, because urgency is high, capability is scarce, and no procurement standard yet constrains pricing. Demonstrability sets the entire margin ladder.
The tension between volume and premium runs through analyst review cost. High-volume listing programmes are profitable only where detection precision is genuinely good, and vendors compensating for false positives with human review lose margin on every additional brand. Premium diversion and synthetic work carries far better economics but scales with scarce capability rather than with monitoring capacity. Scarce capability, not monitoring capacity, limits the premium tiers.

High-value pools concentrate where enforcement produces something the buyer can point to: diversion cases resolved contractually with named distributors, synthetic incidents contained within hours, and pharmaceutical authentication with genuine safety consequence. These share a demonstrable outcome. Where the deliverable is a larger removal count than last year, procurement compares annual fees and the work behaves exactly like a commodity.

Volume / Commodity-Adjacent

Marketplace listing detection and takedown reported as removal volume. Most credible vendors cover the major platforms adequately and buyers compare annual fees directly. The nine-point range reflects wide variation in detection precision and therefore in human review cost.
Gross Margin: 44% to 53%

Premium / Certified

Availability-measured enforcement, repeat seller analysis, and domain protection with documented notice programmes. Outcomes can be demonstrated to a board rather than asserted. The nine-point range separates vendors running independent test purchase panels from those reporting platform data alone.
Gross Margin: 59% to 68%

Sustainability / Regulatory / Next-Generation

Synthetic impersonation containment, serialisation-based diversion enforcement, and pharmaceutical authentication with safety consequence. Capability is scarce and no procurement standard yet constrains pricing. The eleven-point range reflects how differently vendors price work with no established comparison.
Gross Margin: 67% to 78%
brand-protection-tools-market-share-analysis-portfolio-architecture-1790005500219

High-value Sub-segments and Strategic Watch-out

Synthetic Impersonation Containment

Highest value and fastest growth at 18.9%, with incidents rising 214% in a year and no settled definition of success. Vendors can define the metric rather than inherit it. The ten-point range reflects the absence of any procurement comparison to anchor pricing against. Urgency funds it.
Gross Margin: 70% to 80%

Serialisation Based Diversion Enforcement

High value with strong growth at 16.1%, reaching supply chain budgets that detection vendors never addressed. Enforcement runs through commercial agreements rather than courts, which is faster and cheaper. Internal resistance from sales relationships is the principal obstacle to adoption. Named partners answer quickly. Data is available already.
Gross Margin: 64% to 73%

Availability Measured Enforcement

The premium core of listing work, reporting whether counterfeit product became harder to buy rather than how much was removed. Retention runs materially higher than volume-reported programmes. Adoption is limited by vendors reluctant to report smaller numbers to existing clients. Smaller numbers, safer contracts. Boards accept the reporting.
Gross Margin: 58% to 66%

Volume Reported Listing Takedown

The strategic watch-out. Removal counts rise reliably while measured availability falls around 6%, and every brand that checks properly reconsiders the programme. The thirteen-point range reflects the gap between vendors with precise detection and those absorbing false positive review cost. Measurement ends these relationships. Every audit ends one.
Gross Margin: 38% to 51%

Why These Programmes Renew

Renewal in this market has rested on a metric that flatters everybody. Takedown volume rises every year, the programme looks productive, and nobody is required to ask whether counterfeit availability moved. That produces stable revenue with a latent fragility, since the relationship frequently ends the first time a brand commissions independent measurement and finds a 6% availability reduction against a very large removal count.
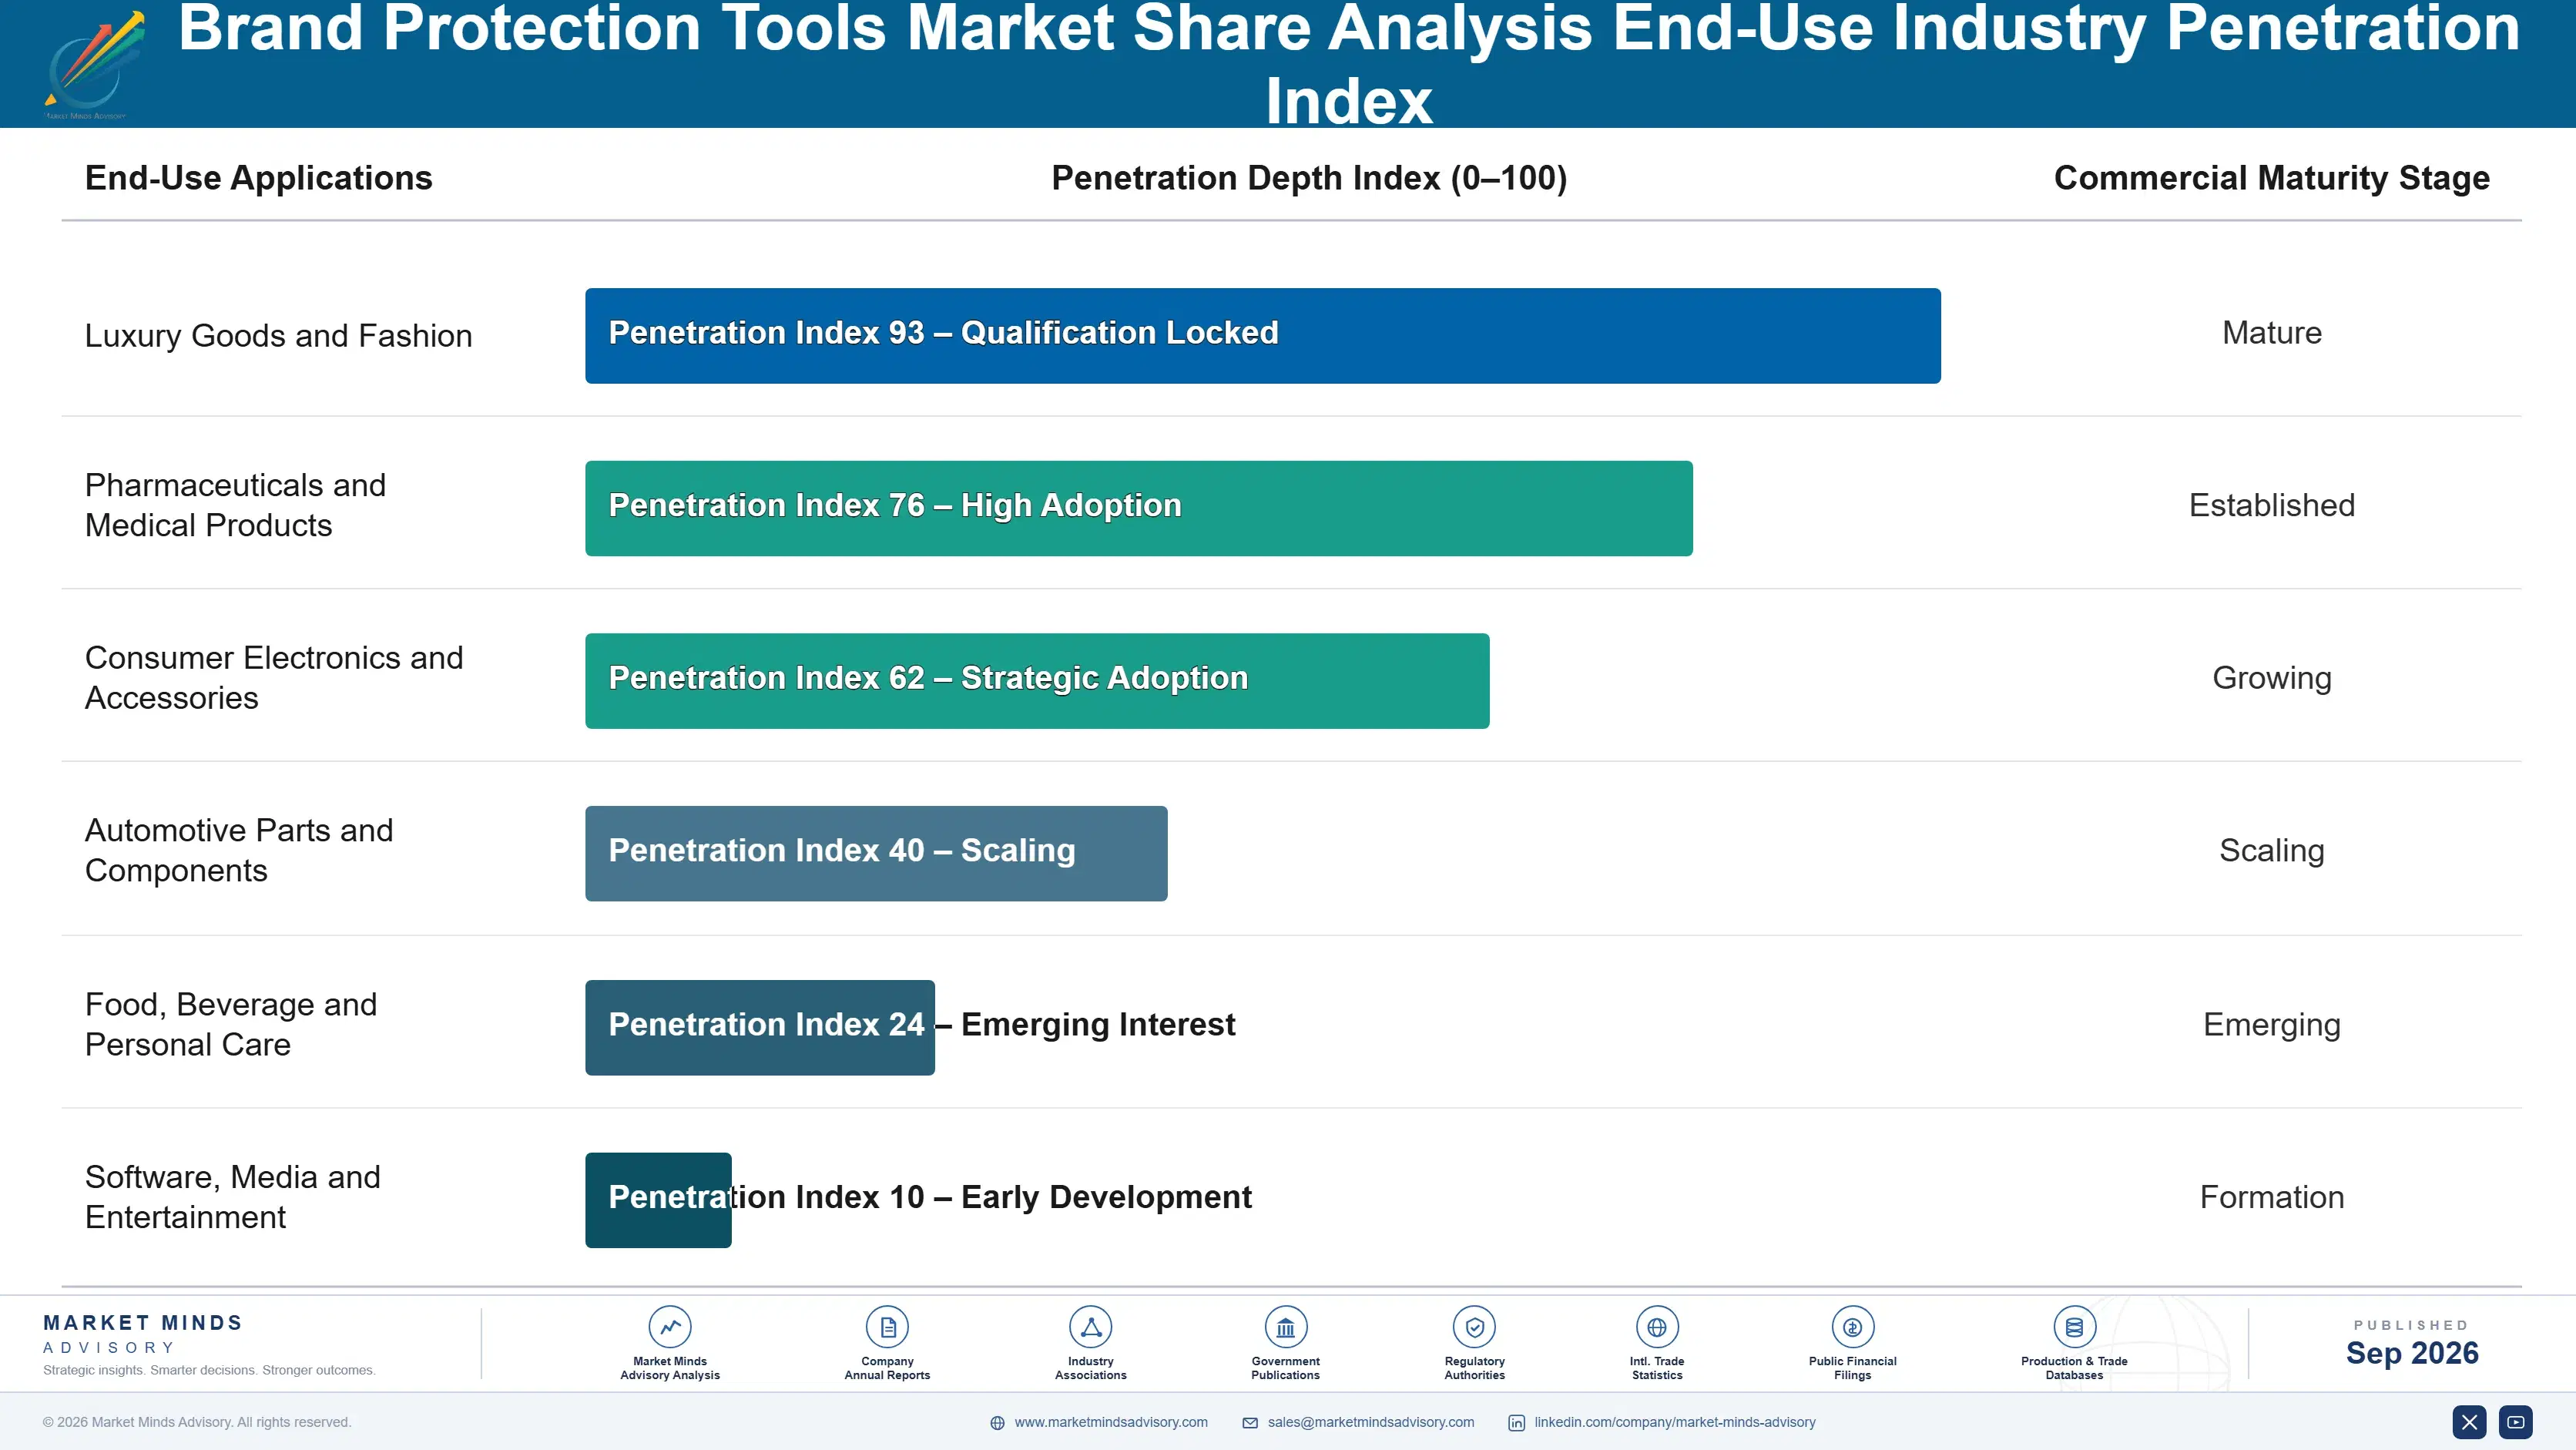
Depth of adoption varies sharply by category. Pharmaceutical and automotive parts brands embed enforcement deeply, because counterfeit product carries genuine safety consequence and regulators take an interest. Luxury goods programmes are similarly durable, driven by exclusivity rather than safety. Consumer electronics and apparel brands are the least committed, treating enforcement as a discretionary cost that competes directly with marketing budget every year.

The buyer profile is shifting in a way that will change the category. Legal and trademark counsel drove purchasing historically and bought on enforcement volume and coverage. Supply chain functions now control diversion budgets, security functions control synthetic impersonation response, and both ask outcome questions that trademark buyers never posed. Vendors calibrated to the legal buyer are meeting evaluators with entirely different expectations.
brand-protection-tools-market-share-analysis-end-use-penetration-index-1790005500743

Where This Market Rewards

These are among the four positions where our research anticipates prominent divergence between winners and laggards over the coming forecast period. Each is grounded in the demand model, the regulatory perimeter, and the announced capacity pipeline.
01 / OUTCOME MEASUREMENT SHIFT

Report a smaller number and keep the account

A large programme removes about 412,000 listings while measured counterfeit availability falls roughly 6%, and 78% of removed sellers return under new accounts within days. Vendors reporting independently measured availability instead of removal volume retain clients about 44% better, because the number they report survives board scrutiny. The reckoning arrives whenever a brand commissions its own measurement, and that is increasingly when volume-reported relationships end, and independent measurement is becoming a contract term rather than an occasional audit of the programme.
02 / REPEAT OPERATOR TARGETING

Removing capacity beats removing inventory every time

Account creation costs an infringer nothing while every enforcement cycle costs the brand money, which makes listing-level enforcement a treadmill by design rather than by execution failure. Identifying the operator behind many accounts through payment details, logistics patterns, and listing fingerprints reduces measured availability 3 to 5 times more at comparable cost. The analytical work is harder and the reported figures are smaller, which explains why so few programmes attempt it, and why the ones that do rarely advertise the removal count.
03 / DIVERSION BUDGET ACCESS

Serialisation reaches money detection never touched

A serialised code recovered from an unauthorised seller names the distributor it shipped to, converting an anonymous enforcement problem into a contractual conversation with a known commercial partner. Diversion costs more than counterfeiting at many consumer and pharmaceutical brands, and vendors offering this alongside detection carry contract values roughly 50% to 75% higher. The budget holder sits in supply chain rather than legal, which is an entirely separate procurement with different questions and a different approval path from the legal one.
04 / SYNTHETIC STANDARD SETTING

Define the metric before procurement defines it

Generated impersonation content offers no listing to remove and no seller to identify, and incidents rose 214% in a year while brands fund response without any settled view of what success means. That makes this the one segment where a vendor can establish the measure rather than inherit it, and early movers are fixing containment time under four hours as the benchmark. Whoever sets it shapes procurement across the whole segment afterwards, which is a position no later entrant can dislodge cheaply.

Engagement Snapshot From the Field

A live engagement with an industry participant carrying material or product regulatory and market exposure ahead of a defining policy shift, showing how our research translates into a defensible multi-year portfolio strategy.
MARKET MINDS ADVISORY · CLIENT ENGAGEMENT SUMMARY
Brand Protection Tools Share Analysis Producer Strategic Portfolio Review and Transition Roadmap 2026·Investment Scenario on Brand Protection Tools Share Analysis Exposure Evaluation 2025-26
CLIENT PROFILE
A global consumer electronics brand with annual revenue above USD 24 billion (client-reported, unverified by MMA), selling through authorised retail, direct channels, and thirty-one online marketplaces across forty markets. Brand protection had run with the same vendor for six years, reporting rising takedown volumes annually, and the programme had never been assessed against any independent measure of outcome.
STRATEGIC CHALLENGE
Finance had questioned a programme costing above USD 1.1 million annually whose only reported output was a removal count that rose every year. Counterfeit accessories were visibly available through the same marketplaces the programme covered. Nobody internally could say whether enforcement had reduced availability, increased it, or done nothing measurable at all.
MMA APPROACH
MMA commissioned independent test purchasing across six marketplaces and four product categories, measuring counterfeit availability before and after enforcement cycles. Removed seller identities were matched against subsequent listings to establish relisting behaviour. Diversion exposure was assessed separately using serialisation data the company already collected but had never analysed for this purpose.
KEY FINDINGS
  1. Counterfeit accessory availability fell by 4% across the measured period, against a takedown volume that had risen 31% year on year in the same categories.
  2. Roughly 81% of removed sellers relisted within eleven days, and 34 operators accounted for more than half of all listings removed during the period.
  3. Serialisation records identified three authorised distributors as the origin of grey market units representing an estimated USD 40 million in diverted annual revenue.
  4. The incumbent vendor had no capability to trace serialised units and had never been asked to report anything other than removal volume.
CLIENT PROFILE
A global consumer electronics brand with annual revenue above USD 24 billion (client-reported, unverified by MMA), selling through authorised retail, direct channels, and thirty-one online marketplaces across forty markets. Brand protection had run with the same vendor for six years, reporting rising takedown volumes annually, and the programme had never been assessed against any independent measure of outcome.
STRATEGIC CHALLENGE
Finance had questioned a programme costing above USD 1.1 million annually whose only reported output was a removal count that rose every year. Counterfeit accessories were visibly available through the same marketplaces the programme covered. Nobody internally could say whether enforcement had reduced availability, increased it, or done nothing measurable at all.
MMA APPROACH
MMA commissioned independent test purchasing across six marketplaces and four product categories, measuring counterfeit availability before and after enforcement cycles. Removed seller identities were matched against subsequent listings to establish relisting behaviour. Diversion exposure was assessed separately using serialisation data the company already collected but had never analysed for this purpose.
KEY FINDINGS
  1. Counterfeit accessory availability fell by 4% across the measured period, against a takedown volume that had risen 31% year on year in the same categories.
  2. Roughly 81% of removed sellers relisted within eleven days, and 34 operators accounted for more than half of all listings removed during the period.
  3. Serialisation records identified three authorised distributors as the origin of grey market units representing an estimated USD 40 million in diverted annual revenue.
  4. The incumbent vendor had no capability to trace serialised units and had never been asked to report anything other than removal volume.
RECOMMENDED STRATEGY
Phase 1: Phase one: restructure the existing contract to report independently measured availability, retaining takedown counts only as an internal operational statistic. Phase 2: Phase two: redirect enforcement toward the 34 repeat operators identified, accepting a substantially lower removal count in exchange for measurable capacity reduction. Phase 3: Phase three: procure diversion tracking separately through the supply chain function, pursuing the three identified distributors contractually rather than through enforcement.
OUTCOME
Nine months after restructuring, measured counterfeit availability fell 19% while reported takedown volume dropped by more than half (client-reported, unverified by MMA). Two of the three distributors accepted contractual remedies without dispute. Total programme cost rose 14% while the outcome finally became demonstrable to the finance function.

Frequently Asked Questions

Foundational context covering the market sizes, CAGR, scope, country, region and competition that inform every finding below. This section is provided to cover basics and most often pre-purchase conversations, answered from the MMA Primary Research Dataset.

What is the current size of the Brand Protection Tools Market Share Analysis?

The market was worth USD 3.9 billion in 2025 and reaches USD 4.4 billion in 2026. Value covers contracted software and managed enforcement services combined.

How large will the Brand Protection Tools Market Share Analysis be by 2036?

MMA forecasts USD 14.4 billion by 2036, an increase of USD 10.0 billion across the forecast period. That represents 3.27 times the 2026 base of USD 4.4 billion.

What is the CAGR for the Brand Protection Tools Market Share Analysis 2026 to 2036?

The base case compound annual growth rate is 12.6%, with a bull case at 13.8% and a bear case at 11.4%. Historical growth from 2020 to 2025 ran at 11.2%.

Which segment is growing fastest?

Synthetic media and AI impersonation detection grows at 18.9%, half again the market rate of 12.6%. Reported incidents using generated media rose 214% in a year.

Who are the major companies in the Brand Protection Tools Market Share Analysis?

Corsearch, MarkMonitor, Red Points, OpSec Security, and ZeroFox lead, holding 37% of contracted spend between them. Security firms are the most active recent entrants into the category.

Which country is growing fastest?

India grows at 17.2%, driven by social commerce expanding far faster than enforcement practice on those channels. Monitoring frequently precedes any available takedown route entirely.

Report Segmentation Architecture

The full report scope spans multiple orthogonal segmentation dimensions, with cross-tabulated demand data provided for each dimension pair. Coverage extends further to regional breakdowns, trend trajectories, and the competitive detail needed to support segment-level decision-making.

By Protection Function

  • Marketplace Listing Detection and Takedown
  • Domain and Phishing Site Enforcement
  • Social Media and Impersonation Monitoring
  • Synthetic Media and AI Impersonation Detection
  • Grey Market and Diversion Tracking
  • Physical Authentication and Serialisation Services

By End-Use Industry

  • Luxury Goods and Fashion
  • Pharmaceuticals and Medical Products
  • Consumer Electronics and Accessories
  • Automotive Parts and Components
  • Food, Beverage and Personal Care
  • Software, Media and Entertainment

By Commercial Dimension

  • Direct Brand Owner Contract
  • Managed Enforcement Service
  • Law Firm Delivered Programme
  • Platform Cooperation Programme
  • Supply Chain Function Purchase
  • Industry Association Collective Programme

By Region

  • North America
  • Western Europe
  • East Asia
  • South Asia and Pacific
  • Latin America
  • Middle East and Africa
  • Eastern Europe

Scope, Methodology, and Coverage

Every figure in this report is reproducible from documented input assumptions. The scope below maps the historical period, the forecast horizon, the segmentation dimensions, and the countries covered, alongside the underlying primary and qualitative methodology.
Historical Period
2020 to 2025
Forecast Period
2026 to 2036
Base Year
2025 (USD billions; MMA Primary Research Dataset, September 2026)
Market Definition
The brand protection tools market covers software and managed services detecting and enforcing against unauthorised use of brand assets, including marketplace listing detection and takedown, domain and phishing site enforcement, social media and impersonation monitoring, synthetic media and AI impersonation detection, grey market and diversion tracking, and physical authentication and serialisation services. It excludes trademark registration and prosecution, general cyber threat intelligence, supply chain logistics platforms, and consumer product recall systems.
Quantitative Units
USD billions, contracted software and services spend
Segmentation Dimensions
Protection function, end-use industry, commercial dimension, region
Regions Covered
North America, Western Europe, East Asia, South Asia and Pacific, Latin America, Middle East and Africa, Eastern Europe
Countries Covered
United States, Canada, United Kingdom, Germany, France, Italy, Spain, Switzerland, Netherlands, China, Japan, South Korea, India, Australia, Indonesia, Brazil, Mexico, Argentina, Saudi Arabia, United Arab Emirates, South Africa, Nigeria, Poland, Turkey
Key Companies Profiled
Corsearch, MarkMonitor, Red Points, OpSec Security, ZeroFox, Authentix, SICPA, De La Rue, Systech, Bolster, Doppel, BrandShield, Pointer Brand Protection, Netcraft, Fortra, Recorded Future, ReliaQuest, Cloudflare, Verisign, Avery Dennison
Quantitative Methodology
Primary survey, n=3,800 respondents, Q4 2025, six countries; demand-side model with trade association cross-validation
Qualitative Methodology
47 expert interviews, Q4 2025; applied to validate demand model assumptions, identify emerging dynamics, and assess competitive positioning
Report Format
PDF and XLSX data workbook (Word format preview document)
Publisher
Market Minds Advisory
Report Code
MMA-2026-TEC-431
Published
September 2026
Contact
sales@marketmindsadvisory.com | www.marketmindsadvisory.com

Purchase the full Brand Protection Tools Market Share Analysis Report (2026 to 2036).

The full report sizes the brand protection tools market across six protection functions, seven regions, and twenty-four countries, with forecasts to 2036 under base, bull, and bear cases. It examines why takedown volume and measured counterfeit availability have diverged so far, what repeat operator targeting changes, and how synthetic impersonation removes the target enforcement was built around. Competitive analysis covers twenty participants evaluated consistently on contracted spend, with detailed treatment of the three vendor origins now converging on the same buyers. Cost structure, margin architecture by function, and regional enforcement drivers are analysed in full. Primary research includes 3,800 survey responses and 47 expert interviews.
Six protection functions sized and forecast separately
Twenty participants evaluated on contracted spend consistently
Regional enforcement and liability drivers across seven geographies
Margin architecture by function and reporting standard
Availability versus takedown volume outcome analysis
Synthetic impersonation containment benchmarks by vendor origin

Built For The People Who Decide

From boardroom strategy to bench-side execution, this report is read cover-to-cover by leaders shaping the next decade of their industry, turning demand scenarios, market dynamics and valuation benchmarks into decisions.
CXOs/ Presidents/ VPs/ Managers
M&A and Corporate Development
Strategy Teams and R&D Heads
Procurement and Product Directors
Regulatory and Compliance Leaders
Investor Relations and Equity Analysts