
Market Minds Advisory
Bottle Filling Machines Market

Bottle Filling Machines Market Study 2026-2036: Size, Share and Trends

Premiumization across beverages and personal care is pushing manufacturers toward volumetric and net weight filling technology that cuts product giveaway and improves fill accuracy, displacing the simpler gravity systems that filled commodity bottles for decades.

Lead Analyst

Bilal Shaikh

Published

November 2026

Make Smarter Decisions with Customized Research Insights

Request a free sample report and evaluate market opportunities, growth trends, and competitive dynamics relevant to your business needs.

2025 MARKET VALUE$3.4BMarket Size 2025
2036 FORECAST VALUE$6.3BBase Case , 2026 to 2036
CAGR 2026 TO 20365.8 %Bull 7.0% / Bear 4.6%
INCREMENTAL OPPORTUNITY$2.7BNet 10- year value creation
EXPANSION MULTIPLE1.76x2036 value over 2026 base
Strategic Levers
M&A Pipeline
Regional Outlook
Country Rankings
Competitive Intelligence
Segmental Deep-dive
Call-Us : 91 93563 13602

Bottle Filling Machines Demand Outlook

Product giveaway, the small overfill manufacturers once accepted as a cost of doing business, has become a line item precise enough to justify entirely new filling technology across beverage and personal care categories alike. Buyers now weigh precision dosing as heavily as throughput when evaluating a new line.
Volumetric flow meter fillers are growing fastest as manufacturers demand tighter fill accuracy that cuts product giveaway, while net weight gravimetric fillers hold the second-fastest growth rate among premium personal care manufacturers requiring the highest dosing precision. North America carries the largest share given its extensive beverage bottling network and consumer goods manufacturing base, while South Asia and Pacific posts the fastest regional growth as manufacturing capacity expands.
Competition splits between established European and American beverage filling specialists with decades of high-speed line integration experience and newer entrants competing on precision dosing technology and total cost of ownership. Product giveaway reduction increasingly shapes purchasing decisions industrywide, since even a fraction of a percent in reduced overfill compounds into meaningful annual savings across the enormous volumes modern bottling lines process. Buyers increasingly weigh service reliability as heavily as price now. Buyers care.
Market Definition
The bottle filling machines market covers equipment that fills liquid and semi-liquid products into bottles across beverage, personal care, household, and pharmaceutical applications, including gravity, pressure and overflow, piston, volumetric, and net weight filling technologies. It excludes aerosol filling equipment for pressurized products, capsule filling machines used in solid-dose pharmaceutical manufacturing, cup filling equipment for dairy and food products, and the bottles themselves as physical containers. MMA estimates the capsule filling machines market will be worth USD 2.8 billion by 2036.
Base Year Value
$3.4B in 2025 (MMA Primary Research Dataset, October 2026)
Forecast Period
2026 to 2036, eleven discrete annual values
CAGR
5.8% base case. Bull 7.0%. Bear 4.6%.
Fastest Growth Segment
Volumetric Flow Meter Fillers: 8.8% CAGR
Fastest Growth Country
Philippines: 8.4% CAGR
Fastest Growth Region
South Asia and Pacific: 7.8% CAGR
Largest Region
North America: 28% of 2025 global value
Market Leaders
Krones AG, KHS GmbH, Sidel, GEA Group, and Tetra Pak lead by installed machine base. Source: MMA Analysis based on company annual reports.
Primary Survey
n=3,800 procurement and R&D decision-makers, Q4 2025, six countries
Methodology
Demand-side build-up, cross-validated against public data, 47 expert interviews

Bottle Filling Machines Market Forecast Scenarios

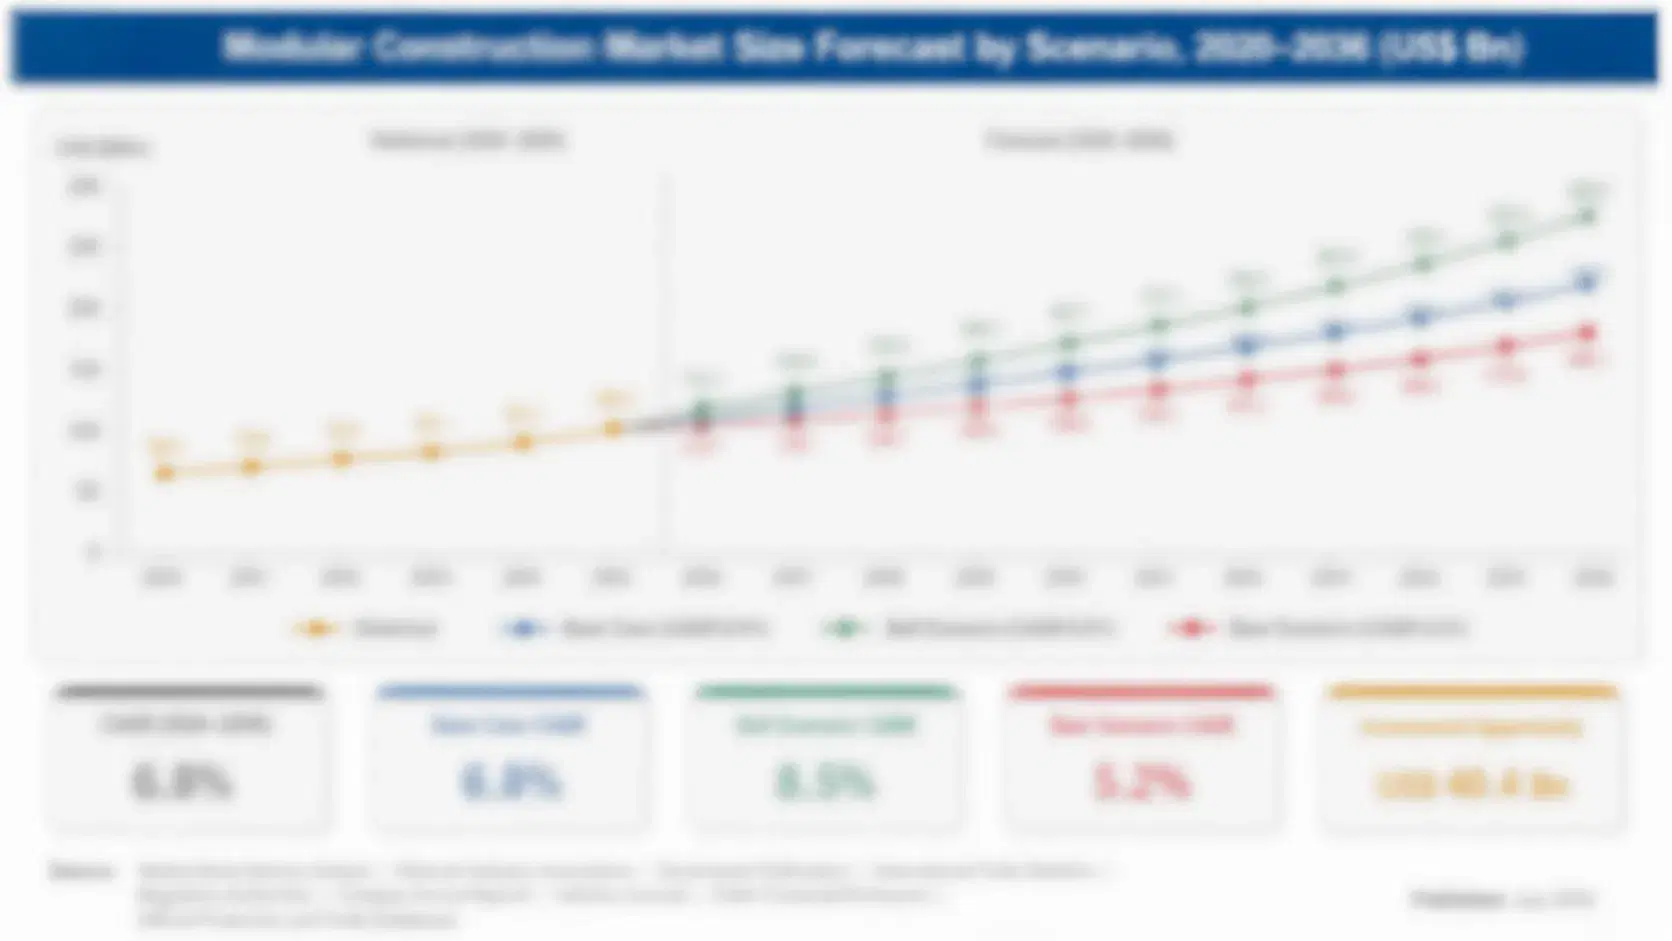
bottle-filling-machines-market-size-forecast-scenario-1791467137410
Between 2020 and 2025 the market grew at an estimated 5.2% annually, tracking beverage and personal care production volume closely, with precision filling adoption beginning to accelerate meaningfully only in the final two years as premiumization trends and rising input costs made product giveaway reduction a more urgent financial priority. Early conversion activity concentrated among the largest bottlers facing the most acute cost pressure.
The base case assumes 5.8% compound growth through 2036, driven by three reinforcing mechanisms: first, premiumization across beverage and personal care categories that rewards precision volumetric and net weight filling over simpler gravity and pressure systems; second, rising input costs that make even small reductions in product giveaway financially meaningful across high-volume production; and third, beverage and personal care manufacturing capacity expansion across South and Southeast Asia that lifts baseline equipment demand regardless of which specific technology ultimately wins.
The bull case rests on input cost inflation accelerating further, pulling precision filling conversion demand forward sharply as manufacturers chase every available giveaway reduction. The bear case centers on a prolonged consumer goods production slowdown that delays capital equipment purchases even as premiumization trends continue regardless of broader manufacturing output trends across the industry. Timing varies regionally.

Precision Dosing Economics Reshaping a Mature Category

Product giveaway reduction has shifted from a minor operational detail into a primary purchasing criterion, as manufacturers facing rising input costs increasingly calculate that even a fraction of a percent in reduced overfill justifies upgrading to precision volumetric or net weight filling technology. Manufacturers that once accepted overfill as the cost of running fast now dedicate finance review cycles to it directly.
MARKET CONCENTRATION (CR5)45%Top five equipment makers hold under half of global volume
AVERAGE SYSTEM PRICE$520,000Mid-tier automated high-speed filling line typically costs this installed
TOP PRODUCING COUNTRY SHARE21%Germany leads global bottle filling equipment manufacturing output
CAPACITY UTILIZATION71%Equipment makers run assembly operations below full nameplate capacity
TYPICAL PRODUCT GIVEAWAY RATE0.5-1.5%Standard overfill range across conventional filling technology types
AVERAGE EQUIPMENT REPLACEMENT CYCLE12-18 yearsTypical service life before a filling line needs full replacement
Commercially, the market rewards equipment makers who can demonstrate measurable fill accuracy improvements at full production line speeds, since a manufacturer running millions of bottles annually recovers precision equipment's price premium quickly through reduced product giveaway alone, independent of any other operational benefit. Equipment makers without comparable precision track records increasingly find themselves relegated to smaller, less cost-sensitive accounts.
Over the next decade, expect continued conversion from gravity and basic pressure filling toward volumetric and net weight technology as premiumization and input cost pressure both intensify, expanding beverage and personal care manufacturing capacity across Asia that lifts baseline demand, and growing demand for flexible lines that handle varied bottle formats and viscosities on shared equipment. a dynamic that increasingly rewards equipment makers investing in dedicated metrology and precision engineering over those competing purely on upfront machine price alone. For a connected opportunity, MMA values the aerosol filling machines market at USD 1.4 billion in 2025.
"Manufacturers used to accept a little overfill as the cost of running fast. Now that overfill is a budget line executives ask about by name, and that single change is reshaping which filling technology wins every new line order."
Director, Packaging Automation Practice · MMA Packaging Automation / Liquid Filling Equipment Practice · October 2026

Bottle Filling Machines Technology Trends

Precision Filling Displacing Gravity and Basic Pressure Systems

Volumetric and net weight filling technologies achieve meaningfully tighter fill accuracy than traditional gravity or basic pressure systems, letting manufacturers reduce product giveaway across the enormous volumes modern bottling lines process annually, a savings that compounds into substantial recovered revenue even at a fraction of a percent improvement. Rising input costs across beverage and personal care formulations have made this giveaway reduction a more urgent financial priority than when ingredient costs sat lower. Equipment makers report precision orders now outpacing basic equipment orders across nearly every account. Equipment makers report rising demand across nearly every account facing this pressure directly. A closely related view comes from the cosmetic filling machines market, which MMA projects to grow at a 6.4% CAGR to USD 2.08 billion by 2036.
Market Impact: Drives roughly 12% of demand
Flexible Multi-Format Lines Rewarding Changeover Capability

Manufacturers running varied bottle formats and liquid viscosities across an expanding product catalog increasingly specify filling lines engineered for rapid changeover between formats, rather than dedicated single-format equipment that previously dominated the category given long, stable production runs common in prior decades. This flexibility matters increasingly as premiumization pushes brands toward more frequent product variants and limited editions that a single dedicated line cannot support economically without constant retooling between runs. Equipment makers are responding with modular platforms that reduce changeover time meaningfully compared with legacy dedicated equipment. Converters investing early capture accounts before competitors respond with comparable modular equipment. The multi-head filling machines market moves on similar drivers, with MMA projecting an 8.6% CAGR over 2026-2036.
Market Impact: Adds roughly 6% baseline volume yearly

Bottle Filling Machines Market Opportunities

Rising Input Costs Make Giveaway Reduction Urgent

Rising costs across beverage concentrates, personal care formulations, and other liquid product inputs have made even small reductions in product giveaway financially meaningful at the enormous volumes modern bottling lines process, turning precision filling conversion from a nice-to-have efficiency improvement into a direct and measurable cost lever manufacturers increasingly cannot ignore. This input cost pressure shows no sign of reversing within the forecast period, giving equipment makers that have already developed reliable precision filling technology a durable addressable market independent of broader economic cycles affecting other capital equipment categories. This gives equipment makers a durable demand source through broader cycles. Adjacent demand is captured in the injectable liquid filling machines market, which MMA expects to grow from USD 4.2 billion in 2025 to USD 10.8 billion by 2036.
Market Impact: Adds $70,000 to $120,000 entry cost

Beverage and Personal Care Manufacturing Expansion Lifts Demand

Beverage and personal care manufacturing capacity expansion across South and Southeast Asia is lifting baseline bottle filling equipment demand as rising disposable income and expanding modern retail distribution drive consumption across growing consumer markets with expanding middle-class populations. Each new manufacturing facility requires filling equipment from the outset, and these facilities increasingly specify flexible, precision-capable equipment given the varied product catalog a modern beverage or personal care manufacturer typically runs across an expanding regional brand portfolio serving diverse local tastes. Equipment makers increasingly court these expansion projects directly through regional trade show presence and dedicated local sales teams. The same pressures carry over to the Japan cup filling machines market, where MMA forecasts USD 1.91 billion by 2036 at a 5.6% CAGR.
Market Impact: Limits universal platforms to 70%

Bottle Filling Machines Challenges and Constraints

High Capital Cost Slows Smaller Manufacturer Adoption

Precision volumetric and net weight filling equipment carries meaningfully higher capital cost than traditional gravity or basic pressure systems, creating a genuine adoption barrier for smaller manufacturers facing the same input cost pressure as larger competitors but lacking comparable capital budgets to justify immediate conversion across their entire production footprint. The root cause is that precision filling mechanisms require more sophisticated metering and control electronics that cost meaningfully more to manufacture than simpler mechanical conveying and dosing mechanisms. Equipment makers are mitigating the barrier by introducing leasing programs and modular upgrade paths that let smaller manufacturers add capability incrementally. MMA expects the related floor standing filtered bottle filling stations market to be worth USD 1.42 billion by 2036.
Market Impact: Precision share up 5 points

Viscosity Variation Complicates Universal Equipment Design

Filling equipment calibrated for one liquid viscosity does not always transfer reliably to another, complicating manufacturers' efforts to standardize on a single flexible platform across their full product catalog spanning thin beverages and thick personal care formulations simultaneously. The root cause is that precise dosing mechanisms must account for how a specific liquid flows under pressure, and no single calibration serves every viscosity equally well without compromising accuracy somewhere across the range. Equipment makers are mitigating the constraint by developing adjustable dosing systems that recalibrate quickly between viscosity profiles. Manufacturers running broad catalogs face this constraint acutely.
Market Impact: Cuts changeover time by roughly 45%
3 additional market trends, 3 additional growth drivers, and 2 additional restraints and challenges are covered in the full report. Contact sales@marketmindsadvisory.com to access the complete intelligence.

Bottle Filling Machines Segment CAGR Comparison

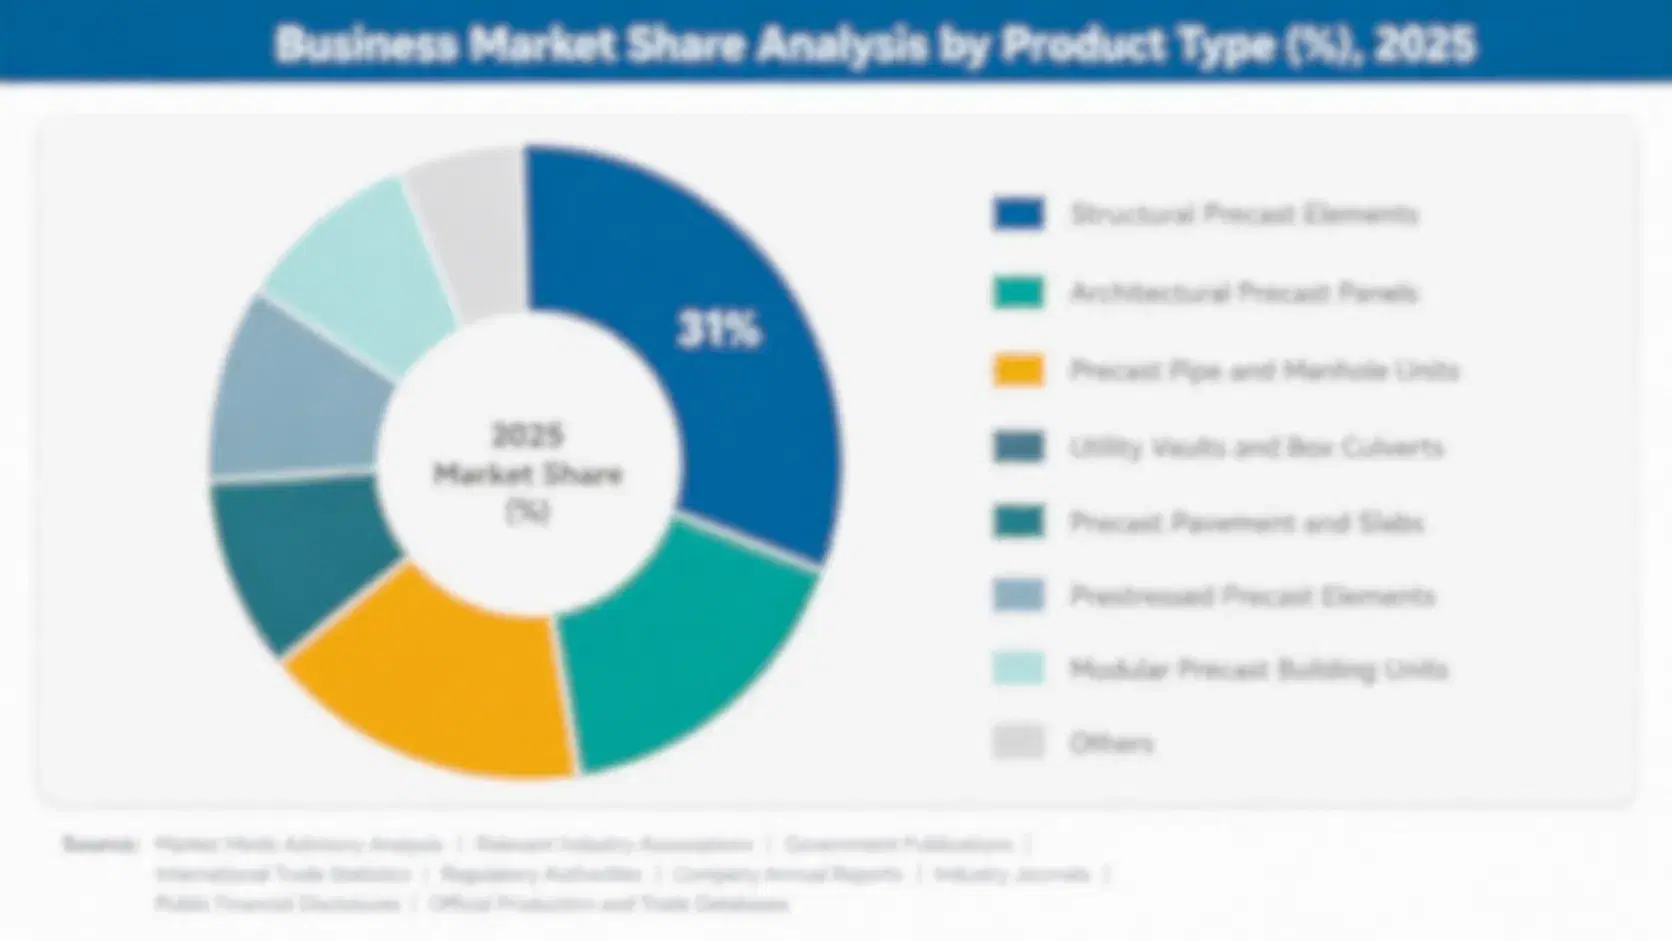
The market segments by filling technology rather than by end-use industry, since dosing mechanism and precision capability drive both equipment pricing and buyer evaluation criteria more directly than whether a given line fills beverages or personal care products. Five technology segments span the market today. Each segment carries distinct dosing precision buyers now weigh explicitly.
bottle-filling-machines-market-market-share-analysis-1791467137684

Volumetric Flow Meter Fillers

Volumetric flow meter fillers measure liquid dispensed by flow rate rather than relying on gravity or simple pressure differential, achieving tighter fill accuracy that reduces product giveaway across high-volume production runs, and they are growing fastest as manufacturers prioritize this giveaway reduction amid rising input costs. Beverage and personal care manufacturers running high-volume production are the primary buyers, typically justifying the premium price through measurable reduction in product giveaway that compounds into substantial savings across enormous annual production volumes. Growth here outpaces every other segment because the economic case strengthens with every additional cost increase affecting the underlying liquid product being filled. Converters investing early capture share before competitors respond with comparable precision equipment.
CAGR 8.8%

Net Weight (Gravimetric) Fillers

Net weight gravimetric fillers measure product by actual weight rather than volume, achieving the highest precision available and eliminating errors that temperature-driven volume fluctuations can introduce into purely volumetric measurement systems, and they hold the second-fastest growth rate among premium personal care and nutraceutical liquid manufacturers requiring the tightest possible dosing accuracy. Manufacturers of high-value liquid products where precision directly affects product cost or regulatory compliance are the primary buyers. Growth here reflects both genuine premiumization demand and conversion from older volumetric equipment as manufacturers pursue the accuracy gains gravimetric technology delivers reliably at scale. Equipment reliability at the highest precision tier remains the deciding factor for these accounts, since measurement errors compound across enormous production volume.
CAGR 7.6%
Full segment breakdown across 5 segments available in the complete report.

Where Bottle Filling Machines Demand Is Growing

North America carries the largest share given its extensive beverage bottling network and consumer goods manufacturing base, while South Asia and Pacific posts the fastest regional growth as manufacturing capacity expands across the region. East Asia follows closely, while Latin America and Eastern Europe trail on both measures.

North America

The United States beverage bottling network, among the largest and most sophisticated in the world, drives substantial demand for precision filling equipment as major bottlers pursue product giveaway reduction across enormous annual production volumes that make even small accuracy improvements financially significant. Personal care and household product manufacturers contribute meaningful additional demand as premiumization accelerates across direct-to-consumer and retail channels simultaneously, rewarding precision equipment capable of handling varied formulations. Canada contributes a smaller but steady volume base tied to its own beverage and consumer goods sector, while Mexico's growing manufacturing base increasingly serves North American brands through nearshored production requiring its own equipment investment. Equipment financing options have expanded as smaller manufacturers seek precision without the full upfront commitment.
Share: 28% | CAGR: 6.8% (2026 to 2036)

Western Europe

Germany and France anchor Western European demand both as leading machine manufacturing centers and as substantial beverage and personal care production markets in their own right, giving the region meaningful depth on both the supply and demand side of this market simultaneously. Sustainability regulation around packaging waste is pushing manufacturers toward precision filling that minimizes product waste alongside packaging waste, a pressure reinforcing the broader economic case for conversion already underway across the industry. The UK and Italy contribute meaningful additional demand tied to their own substantial beverage and personal care manufacturing bases. Equipment leasing options have expanded as smaller manufacturers seek precision without the full upfront commitment larger competitors absorb more easily.
Share: 20% | CAGR: 4.3% (2026 to 2036)
Regional intelligence for 5 additional markets available in the complete report: East Asia, South Asia and Pacific, Latin America, Middle East and Africa, Eastern Europe. Contact sales@marketmindsadvisory.com.
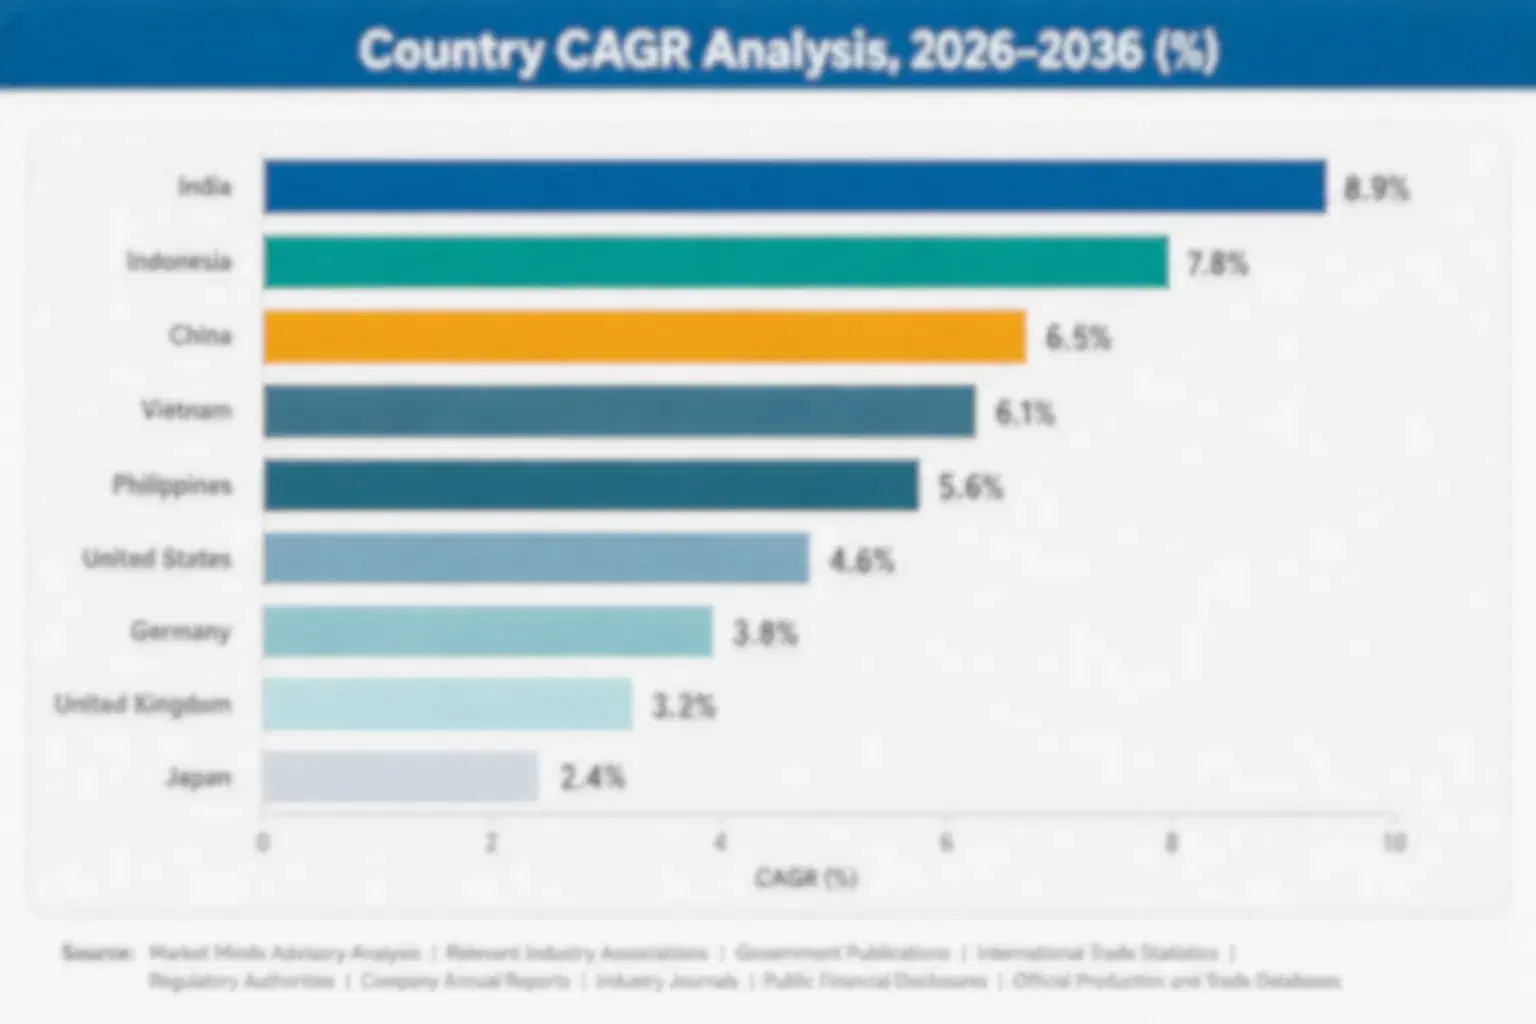
bottle-filling-machines-market-country-cagr-analysis-1791467137960

Capturing Share as Precision Becomes the Default

Basic gravity and pressure filling margin has compressed as precision alternatives become the default expectation across premiumizing categories, so the real commercial opportunity sits in precision conversion capture, financing programs for smaller manufacturers, and flexible multi-format platforms. Makers treating conversion sales and financing as core strategy capture disproportionate new volume early. First movers win.

Capturing Precision Filling Conversion Accounts Early

Equipment makers that win a manufacturer's precision filling conversion decision early typically lock in a multi-year equipment and service relationship worth meaningfully more than a comparable basic equipment contract, since the buyer rarely revisits technology choice again absent a major cost or reliability event. Krones AG and KHS GmbH have both built dedicated conversion sales teams specifically to identify manufacturers facing rising input costs, and early movers report winning conversion accounts at close rates roughly 30% higher than their broader new-account win rate. Makers moving early capture accounts faster than competitors relying on legacy equipment and generic marketing.
Market Impact: Wins conversion accounts at a 30% higher rate

Offering Financing Programs for Smaller Manufacturers

Equipment makers offering leasing and financing programs specifically for smaller manufacturers facing the same input cost pressure as larger competitors but lacking comparable capital budgets are capturing accounts that would otherwise delay precision conversion or continue absorbing avoidable giveaway losses. This financing approach converts smaller manufacturer accounts at meaningfully higher rates than requiring outright capital purchase, since the lease structure lets a smaller operation match equipment cost to its own revenue trajectory, expanding the addressable account base by roughly 20% beyond manufacturers able to pay full price upfront. This approach also reduces churn risk across the smaller-manufacturer segment broadly.
Market Impact: Converts smaller accounts roughly 35% faster than outright purchase

Developing Flexible Multi-Format and Multi-Viscosity Platforms

Equipment makers developing filling platforms that handle multiple bottle formats and liquid viscosities on a single flexible line are capturing manufacturers who want to serve varied product catalogs without purchasing several separate dedicated systems for each format and viscosity combination. This flexible platform approach commands a meaningful premium over single-format equipment, and manufacturers report this capability expanding their addressable product catalog by roughly 25% compared with equipment limited to a single format and viscosity profile. Makers offering this flexible approach report winning accounts that previously had to maintain several separate dedicated systems.
Market Impact: Expands the addressable product catalog by roughly 25%

Bundling Giveaway Audit Services With Equipment Sales

Equipment makers offering giveaway audit services alongside equipment sales, quantifying a manufacturer's current product loss and projected savings from precision conversion, are winning accounts that value this documented business case above a marginally lower upfront equipment price from a competitor offering no comparable analysis. This audit service layer commands a meaningful premium over equipment sold without it, and manufacturers report this capability cutting their own internal capital approval timeline by roughly 30% compared with manufacturers building the business case independently. Makers offering this audit service report winning accounts that specifically cite documented savings projections as the deciding factor.
Market Impact: Cuts capital approval timeline by roughly 30% overall

Bottle Filling Machines Margin Pool

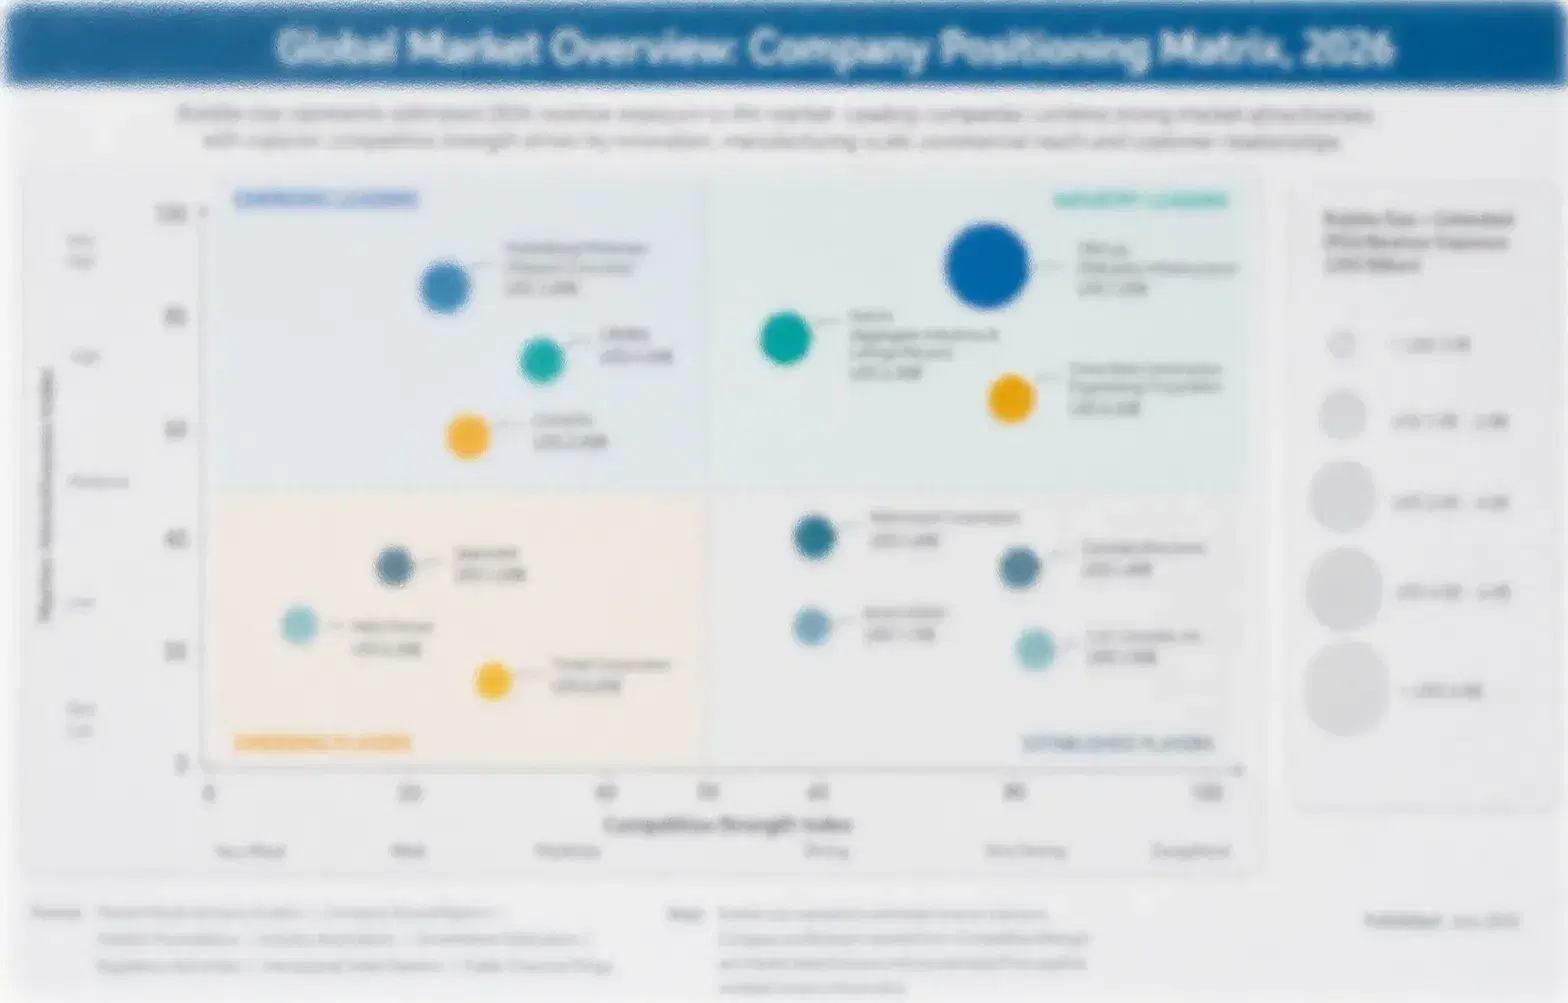
Market concentration sits at a modest CR5 of 45%, reflecting a fragmented builder base spanning established beverage filling specialists and newer precision technology entrants, with Krones AG and KHS GmbH holding the broadest combined high-speed line integration experience and product portfolios ahead of mid-tier challengers like Sidel and GEA Group. That gap reflects decades of accumulated line integration investment smaller specialists cannot replicate quickly.
Current competitive activity centers on three fronts: precision conversion sales programs racing to capture manufacturers facing rising input costs, flexible multi-format platform development responding to premiumization and SKU proliferation, and financing program expansion targeting smaller manufacturers unable to justify full upfront capital investment. Equipment makers increasingly compete on total cost of ownership rather than per-unit machine price alone. Equipment makers increasingly invest in dedicated precision engineering and finance teams rather than relying on scale alone.

Emerging pressure comes from Chinese equipment makers offering lower-cost filling systems without the precision dosing technology or line integration service network that incumbents rely on for premium margin, appealing to price-sensitive manufacturers across less input-cost-sensitive applications and emerging markets. Rankings could shift if a challenger develops comparable precision dosing at lower pricing before incumbents capture the conversion wave they are pursuing.
bottle-filling-machines-market-company-positioning-matrix-1791467138280

How Bottle Filling Machines Suppliers Compete

KRONES AG

Moat: Deepest Beverage Line Integration Expertise

Krones AG's decades of beverage bottling line integration experience give it a genuine credibility advantage with manufacturers evaluating complex precision filling conversion projects, a trust advantage newer entrants without comparable integration depth struggle to match quickly. built over many years of reliable high-speed line deployment experience that smaller competitors need significant time to replicate.
KRONES AG

Risk: Premium Pricing Limits Smaller Accounts

Krones AG's premium positioning and pricing structure make it less competitive among smaller manufacturers evaluating lower-cost alternatives, leaving this growing segment more open to competitors willing to compete more aggressively on price. This pricing gap could cost it meaningful growth opportunity as smaller manufacturers continue multiplying faster than the largest bottlers.
KHS GMBH

Moat: Broad Multi-Format Platform Range

KHS GmbH's modular filling platform lets it serve manufacturers across a wide range of bottle formats and viscosities, a flexibility that competitors offering only fixed, dedicated systems cannot easily match for manufacturers running varied product catalogs. a capability newer, more narrowly focused competitors have not yet developed to the same depth across varied production volumes.
KHS GMBH

Risk: Narrower Presence Outside Beverage

KHS GmbH holds a smaller presence in personal care and household filling applications than competitors focused primarily on those segments, leaving more of its revenue mix concentrated in beverage-specific applications specifically. International expansion into personal care and household applications remains a priority to reduce this concentration risk over time.

Players Tracked

Prominent Players

Krones AG
KHS GmbH
Sidel
GEA Group
Tetra Pak

Other Key Players

SACMI
Serac Group
Federal Mfg Co.
Pneumatic Scale Angelus
Fogg Filler Company
Accutek Packaging Equipment
Liquid Packaging Solutions
E-PAK Machinery
Filamatic
ProMach
Shibuya Corporation
Zhangjiagang King Machine
Tech-Long Packaging Machinery
Cozzoli Machine Company
Norden Machinery

Recent Developments

APRIL 2025

Krones AG Launches Next-Generation Volumetric Filling Platform

Krones AG launched a new volumetric flow meter filling platform specifically engineered to cut product giveaway further, targeting beverage manufacturers currently running basic pressure equipment facing rising input costs across their production lines. positioning Krones to capture bottlers currently running basic pressure equipment facing rising costs.
Signal: Signals precision filling becoming the default replacement technology for basic pressure conversion projects. across the broader beverage filling equipment industry.
SEPTEMBER 2024

KHS GmbH Expands Multi-Format Platform Capability

KHS GmbH expanded its modular filling platform to cover additional bottle formats and liquid viscosities, aiming to capture manufacturers running varied product catalogs that previously required multiple dedicated filling lines. and strengthening its position among manufacturers consolidating multiple dedicated lines onto fewer, more versatile machines.
Signal: Signals multi-format flexibility becoming a standard competitive requirement across the premium equipment segment. across the broader converter industry today.
JANUARY 2026

Sidel Signs Multi-Year Giveaway Audit Service Agreement

Sidel signed a multi-year agreement with a major beverage bottler to provide ongoing giveaway audit and optimization services across its filling equipment fleet, bundling data-driven analysis with the underlying equipment supply relationship directly. a structure reflecting growing customer preference for ongoing optimization support rather than a one-time equipment purchase alone.
Signal: Signals bundled audit services becoming the default structure for large beverage manufacturing accounts. across large beverage manufacturing accounts broadly.

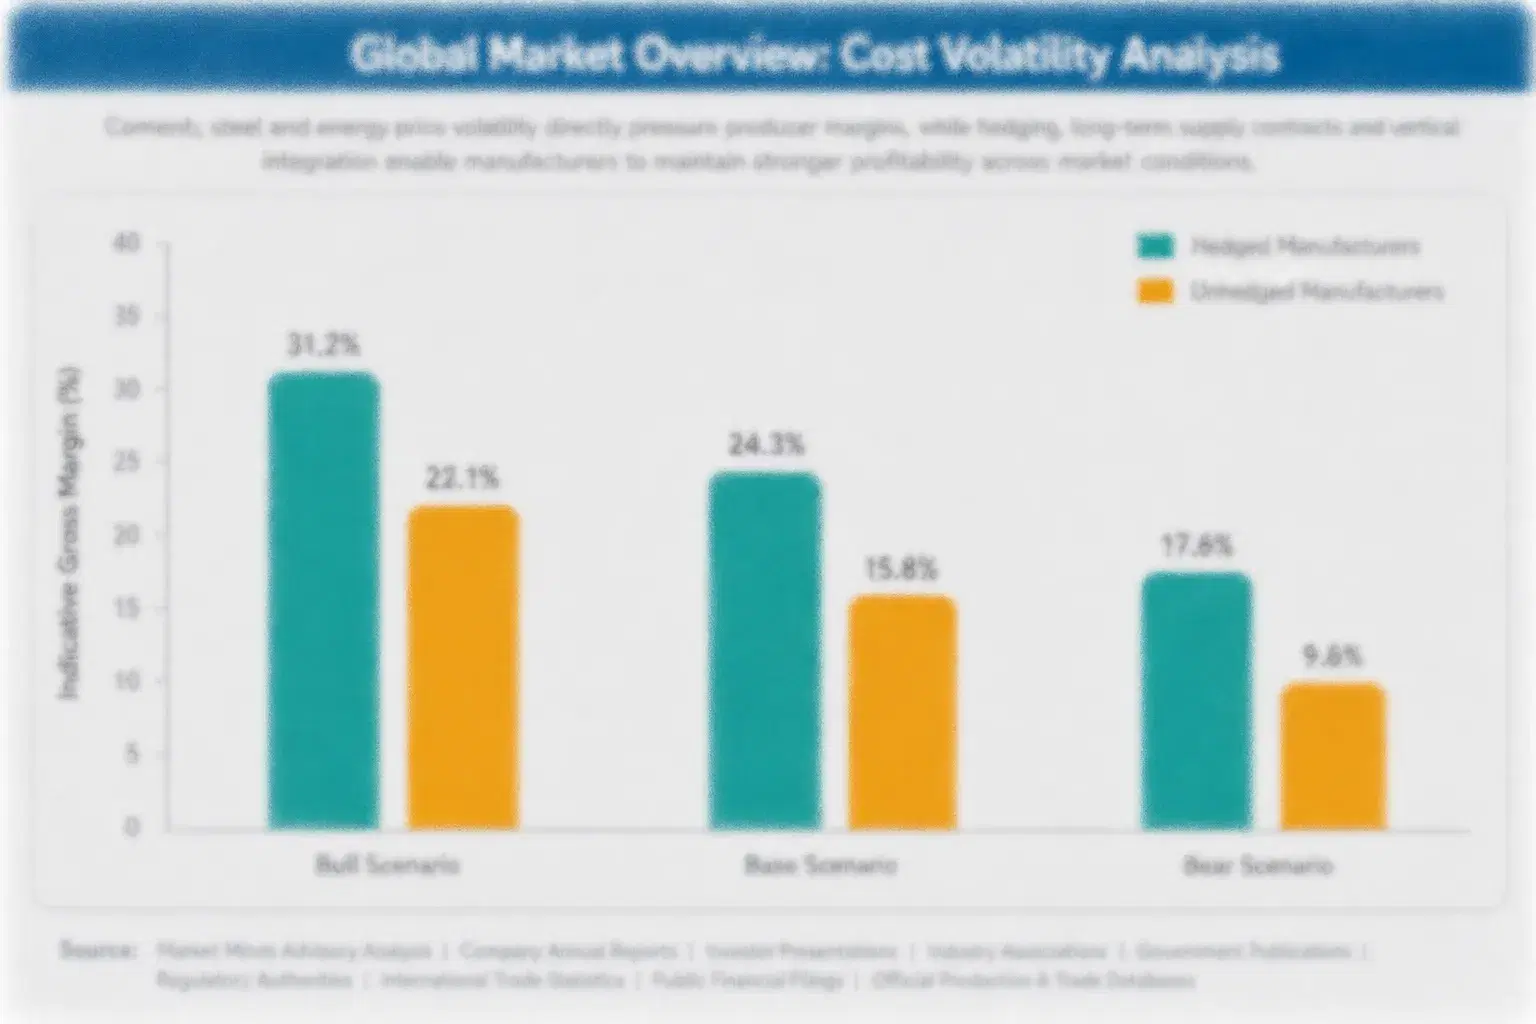
Precision Metering Components Drive Cost

Precision metering valves, flow sensors, and electronic control systems together account for roughly 48 to 56% of total equipment cost of goods sold, sourced from a concentrated group of specialized metering component manufacturers and electronics suppliers located primarily across Germany, Italy, and the United States. Precision gearing and servo motor components add further cost concentration among a smaller set of specialized global suppliers.
The 2021 and 2022 global semiconductor supply shortage pushed lead times and costs for electronic control and sensor components up significantly, delaying equipment deliveries industrywide and forcing several equipment makers to redesign control systems around more readily available component alternatives during the disruption period according to industry trade reporting at the time. Makers with diversified component sourcing relationships navigated this disruption with considerably less delay than those reliant on a single supplier.

Equipment makers concentrated in a single filling technology carry more exposure to that technology's specific component supply cycle than diversified manufacturers selling across volumetric, net weight, and pressure systems simultaneously, since a diversified manufacturer can shift sourcing emphasis toward whichever supplier currently offers the more favorable cost and availability position. This advantage widens as larger makers secure better terms through volume.
bottle-filling-machines-market-cost-volatility-analysis-1791467138602

Multi-Supplier Metering Component Sourcing

Larger equipment makers maintain relationships with multiple metering valve and sensor suppliers across different regions, insulating production schedules from any single supplier's disruption and letting them offer customers more reliable delivery timelines across equipment orders negotiated directly. a reliability advantage smaller makers without comparable supplier relationships typically cannot match during periods of sustained disruption.

Component Inventory Buffering for Critical Parts

Maintaining larger safety stock inventories of critical metering valves and electronic control components reduces exposure to sudden supply disruptions, though it requires committing working capital ahead of confirmed near-term order volume from customers. a buffer that becomes especially valuable during periods of sustained supply chain disruption affecting electronic components broadly. at an increasing number of large accounts.

Regional Assembly to Cut Freight and Tariff Exposure

Building final equipment assembly capacity closer to major beverage and personal care manufacturing clusters reduces exposure to import tariffs and freight cost volatility on finished machines, particularly valuable for makers serving Latin America and Asia. several large makers have already announced new regional assembly investments specifically to capture this cost and reliability advantage. closer to demand.

Portfolio Architecture for Margin Defence

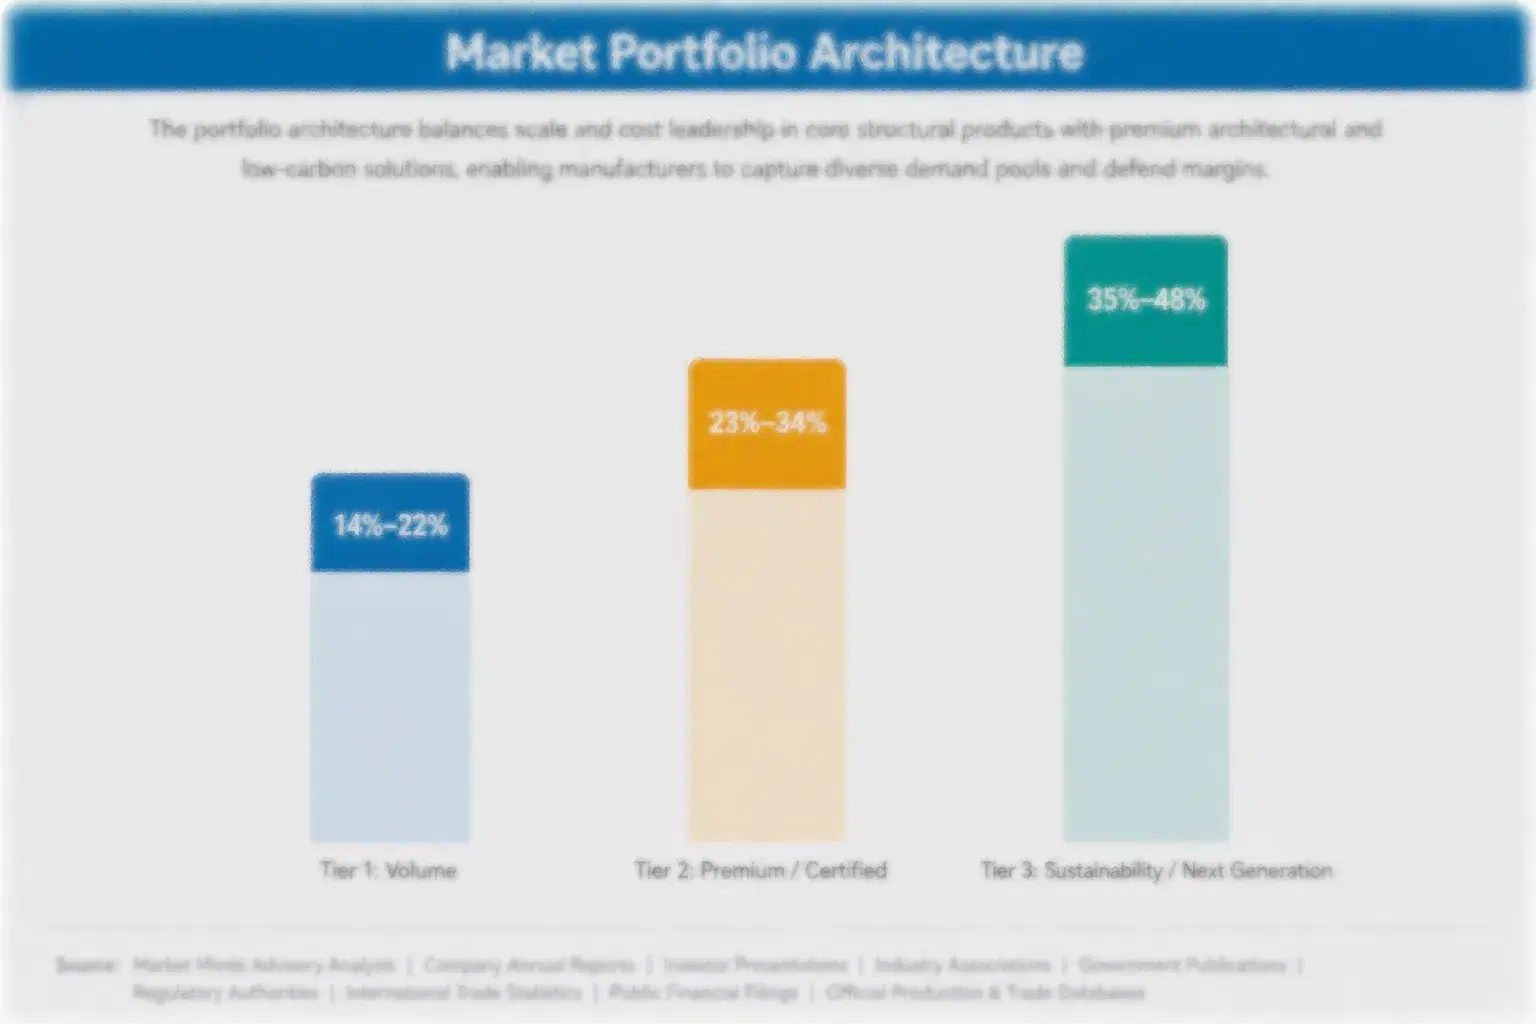
The market organizes into three tiers: a volume tier built on gravity and basic pressure equipment sold on price and basic reliability, a premium tier built on volumetric and net weight systems that command a precision-driven price premium, and a next-generation tier built on fully flexible multi-format platforms still expanding beyond the largest early-adopter accounts. Gross margin in the next-generation tier can run meaningfully above the volume tier's level.
Volume tier competition remains intensely price-driven, with equipment makers competing on basic reliability and upfront cost, leaving little room for margin expansion absent a shift in customer precision priorities. Premium tier demand is growing meaningfully faster as input cost pressure and premiumization both push specification toward precision equipment, creating real tension for makers deciding how quickly to shift production capacity away from reliable basic equipment revenue.

High-value margin pools concentrate specifically around volumetric and net weight systems sold under bundled giveaway audit and financing agreements to manufacturers facing active input cost pressure, a pool that rewards equipment makers with broad precision and service capability and penalizes basic-technology specialists regardless of how strong installed base volume still looks in isolation.

Volume / Commodity-Adjacent Tier

Gravity and basic pressure equipment sold largely on price and basic reliability to manufacturers not yet facing meaningful input cost or precision pressure. though even this tier increasingly faces pressure as input costs rise across more manufacturer segments over time.
Gross Margin: 14-20%

Premium / Certified Tier

Volumetric and net weight systems commanding a precision-driven price premium, serving manufacturers under active input cost or premiumization pressure. a tier capturing a growing share of total industry revenue as conversion accelerates across more manufacturing accounts each year.
Gross Margin: 25-32%

Sustainability / Regulatory / Next-Generation Tier

Fully flexible multi-format platforms still expanding beyond the largest early-adopter accounts, targeting the next wave of precision conversion. with volumes still modest today but expected to scale meaningfully as more manufacturers pursue full flexibility.
Gross Margin: 28-35%
bottle-filling-machines-market-portfolio-architecture-1791467138909

High-value Sub-segments and Strategic Watch-out

Precision Conversion With Giveaway Audits

Combines the fastest unit growth with the strongest account retention in the category, as input cost pressure accelerates precision conversion, a pool every major equipment maker is now actively pursuing through dedicated conversion sales teams. and winners tend to retain the relationship for years. Many makers chase this pool now.
Gross Margin: 27-33%

Flexible Multi-Format and Multi-Viscosity Platforms

Commands strong margin and growing volume together as manufacturers increasingly want to serve varied product catalogs on shared equipment, though engineering investment requirements keep limiting how many makers compete credibly here. making continuous engineering investment an ongoing cost of participation rather than a single launch makers complete once.
Gross Margin: 25-31%

Legacy Gravity and Basic Pressure Equipment

Represents meaningful unit volume today but carries the thinnest margin in the category, facing continuous downward price pressure and gradual share loss to precision equipment across every region tracked in this report. with little prospect of margin recovery absent a meaningful shift in underlying customer precision priorities.
Gross Margin: 12-17%

Single-Technology Builder Concentration

A genuine strategic watch-out: builders offering only basic filling equipment face mounting pressure as precision conversion accelerates industrywide, stranding those slow to diversify their own technology portfolio range. makers investing early in precision capability are best positioned to retain accounts before competitors close the gap.
Gross Margin: 14-19%

Precision Relationships Anchor Long Manufacturer Accounts

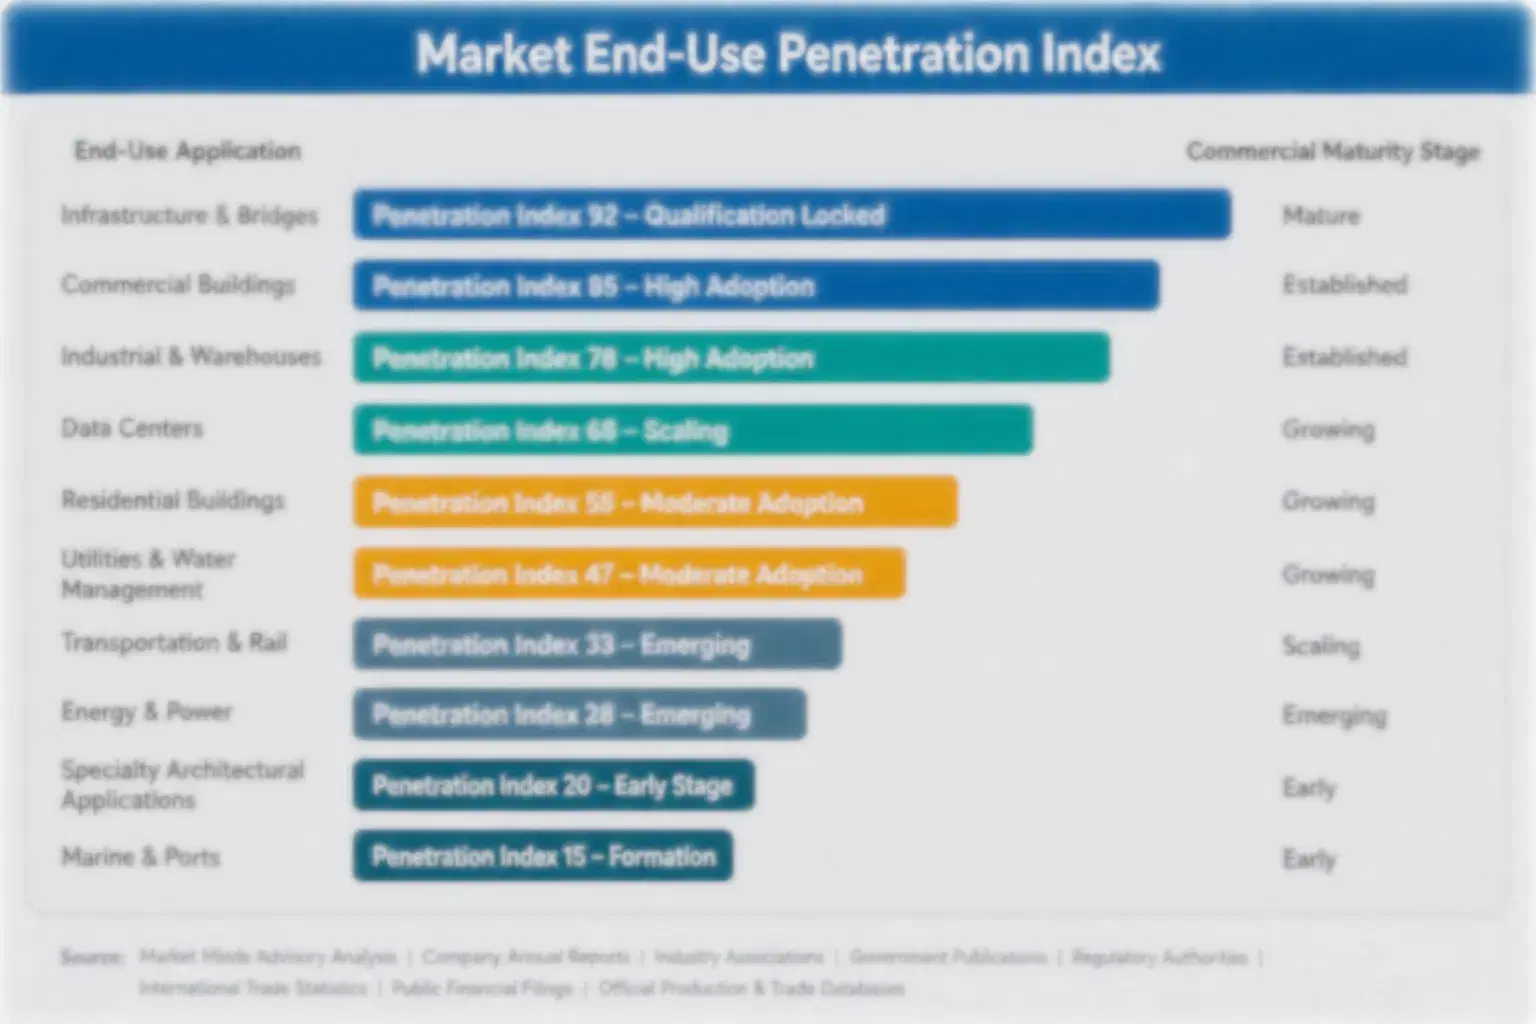
Once a manufacturer converts to precision volumetric or net weight filling equipment, the resulting supplier relationship behaves like an annuity for many years afterward, since switching equipment makers requires requalifying fill accuracy against internal quality standards, a costly process most manufacturers avoid absent a serious reliability failure prompting reconsideration. That annuity quality is why equipment makers invest heavily in winning the initial precision relationship.
Adoption depth varies by manufacturer type: large beverage and personal care companies facing acute input cost pressure adopt precision equipment comprehensively across their entire production network, mid-size manufacturers adopt selectively for their highest-volume or highest-cost product lines, and smaller manufacturers remain price-driven and slower to convert absent direct cost pressure of their own. Makers misjudging manufacturer type often over-invest in precision marketing smaller accounts never requested.

Buyer profiles are shifting as equipment purchasing decisions move from pure engineering authority toward finance and supply chain planning teams who weigh giveaway cost and total cost of ownership alongside raw equipment price, a change that rewards equipment makers able to speak credibly to both financial and production economics in the same sales conversation. rewarding makers who translate savings data into terms finance leaders readily understand.
bottle-filling-machines-market-end-use-penetration-index-1791467139240

Where MMA Sees the Opportunity

These are among the four positions where our research anticipates prominent divergence between winners and laggards over the coming forecast period. Each is grounded in the demand model, the regulatory perimeter, and the announced capacity pipeline.
01 / PRECISION CONVERSION CAPTURE

Back equipment makers capturing precision conversion early

Precision filling conversion is becoming the clearest growth opportunity in a market where rising input costs determine which equipment maker wins a manufacturer's long-term relationship. Makers with dedicated conversion sales teams are identifying and winning these accounts faster than rivals waiting for manufacturers to initiate the conversation themselves. We expect this advantage to compound further as input costs keep rising, with early movers building a durable lead competitors will find difficult to close, and the largest remaining accounts going to makers who invested earliest.
02 / FLEXIBLE PLATFORM DEVELOPMENT

Prioritize flexible platforms ahead of broader market catch-up

Flexible multi-format and multi-viscosity platforms are shifting from a niche product into an explicit purchasing requirement as manufacturers increasingly want to serve varied product catalogs without purchasing multiple dedicated systems. Equipment makers investing early in this flexibility are capturing accounts before competitors can match the technical achievement with comparable equipment. We expect this technical gap to persist for several more years, becoming the clear baseline expectation among large accounts and rewarding early movers with sustained pricing power across nearly every account they win.
03 / SMALLER MANUFACTURER FINANCING

Expand financing to capture price-sensitive manufacturers

Financing programs targeting smaller manufacturers facing the same input cost pressure as larger competitors but lacking comparable capital budgets represent a reliable and growing opportunity as this pressure continues spreading across the broader manufacturing base. Equipment makers offering flexible financing are converting these accounts faster than those requiring outright capital purchase. We expect this underserved segment to keep expanding meaningfully as cost pressure extends further down the manufacturer size spectrum over the next several years as more jurisdictions and categories feel the same cost pressure.
04 / BASIC EQUIPMENT CONCENTRATION RISK

Watch equipment makers overexposed to basic systems alone

Equipment makers concentrated in gravity and basic pressure filling equipment without precision capability face a steadily shrinking addressable base as input cost pressure and premiumization both accelerate conversion industrywide. A maker slow to diversify risks losing meaningful growth opportunity entirely as premium segments compound while basic equipment demand grows only modestly by comparison. We consider this concentration risk the single most important vulnerability facing mid-size specialists, and diversifying into precision capability now remains the clearest path to avoiding it over time.

Engagement Snapshot From the Field

A live engagement with an industry participant carrying material or product regulatory and market exposure ahead of a defining policy shift, showing how our research translates into a defensible multi-year portfolio strategy.
MARKET MINDS ADVISORY · CLIENT ENGAGEMENT SUMMARY
Bottle Filling Machines Producer Strategic Portfolio Review and Transition Roadmap 2026·Investment Scenario on Bottle Filling Machines Exposure Evaluation 2025-26
CLIENT PROFILE
The client operates a regional beverage bottling network across three facilities in the southeastern United States, filling a catalog of roughly 15 distinct beverage formulations across dedicated pressure filling lines (client-reported, unverified by MMA). The client had observed input costs rising meaningfully over the preceding two years without reassessing its filling equipment's contribution to product loss.
STRATEGIC CHALLENGE
Leadership needed to decide whether converting to precision volumetric filling across all three facilities would recover enough product giveaway to justify the capital investment, or whether continuing with existing pressure equipment while absorbing rising input costs remained the more prudent near-term path. Both leadership groups needed clarity before the next capital planning cycle began in earnest.
MMA APPROACH
MMA conducted a giveaway audit across the client's three facilities benchmarked against comparable bottlers already running volumetric equipment, modeled projected savings under current and projected input cost trajectories, and built a facility-by-facility conversion sequencing plan prioritizing the highest-cost product formulations first. MMA also interviewed the client's finance team to confirm actual input cost trajectories under current supplier contracts.
KEY FINDINGS
  1. The client's existing pressure equipment carried an average product giveaway rate of roughly 1.3%, meaningfully above the 0.4% rate typical of comparable volumetric equipment (client-reported, unverified by MMA).
  2. Annual giveaway cost at the client's highest-volume facility alone exceeded the projected annual financing cost of volumetric conversion across all three facilities combined.
  3. Vendor financing reduced the client's upfront capital requirement for full conversion by roughly 45%, improving the investment's near-term cash flow profile for leadership.
  4. Sequencing conversion by product cost rather than facility size captured the largest early savings well before the final facility converted. a sequencing approach operations leadership endorsed readily given minimal disruption risk.
CLIENT PROFILE
The client operates a regional beverage bottling network across three facilities in the southeastern United States, filling a catalog of roughly 15 distinct beverage formulations across dedicated pressure filling lines (client-reported, unverified by MMA). The client had observed input costs rising meaningfully over the preceding two years without reassessing its filling equipment's contribution to product loss.
STRATEGIC CHALLENGE
Leadership needed to decide whether converting to precision volumetric filling across all three facilities would recover enough product giveaway to justify the capital investment, or whether continuing with existing pressure equipment while absorbing rising input costs remained the more prudent near-term path. Both leadership groups needed clarity before the next capital planning cycle began in earnest.
MMA APPROACH
MMA conducted a giveaway audit across the client's three facilities benchmarked against comparable bottlers already running volumetric equipment, modeled projected savings under current and projected input cost trajectories, and built a facility-by-facility conversion sequencing plan prioritizing the highest-cost product formulations first. MMA also interviewed the client's finance team to confirm actual input cost trajectories under current supplier contracts.
KEY FINDINGS
  1. The client's existing pressure equipment carried an average product giveaway rate of roughly 1.3%, meaningfully above the 0.4% rate typical of comparable volumetric equipment (client-reported, unverified by MMA).
  2. Annual giveaway cost at the client's highest-volume facility alone exceeded the projected annual financing cost of volumetric conversion across all three facilities combined.
  3. Vendor financing reduced the client's upfront capital requirement for full conversion by roughly 45%, improving the investment's near-term cash flow profile for leadership.
  4. Sequencing conversion by product cost rather than facility size captured the largest early savings well before the final facility converted. a sequencing approach operations leadership endorsed readily given minimal disruption risk.
RECOMMENDED STRATEGY
Phase 1: Phase 1 (Months 1 to 4): Convert the facility filling the highest-cost product formulations to volumetric equipment using the vendor financing arrangement identified. Phase 2: Phase 2 (Months 5 to 10): Convert the remaining two facilities while renegotiating maintenance support into a single bundled multi-year agreement across all sites. Phase 3: Phase 3 (Months 11 to 13): Complete optimization and document giveaway reduction outcomes for corporate capital planning. specifically for leadership review.
OUTCOME
Within thirteen months the client completed conversion across all three facilities, reporting blended product giveaway down to roughly 0.5% network-wide and annual savings exceeding the full financing cost within the first year of operation (client-reported, unverified by MMA). Leadership credits the phased approach with avoiding any disruption to ongoing production commitments.

Frequently Asked Questions

Foundational context covering the market sizes, CAGR, scope, country, region and competition that inform every finding below. This section is provided to cover basics and most often pre-purchase conversations, answered from the MMA Primary Research Dataset.

What is the current size of the Bottle Filling Machines Market?

The bottle filling machines market reached an estimated $3.40 billion globally in 2025. This covers equipment that fills liquid and semi-liquid products into bottles across beverage, personal care, and household applications.

How large will the Bottle Filling Machines Market be by 2036?

MMA projects the market will reach approximately $6.33 billion by 2036, roughly 1.76 times its 2026 base of $3.60 billion as precision conversion continues accelerating.

What is the CAGR for the Bottle Filling Machines Market 2026 to 2036?

The market is projected to grow at a 5.8% compound annual growth rate between 2026 and 2036, with a bull case of 7.0% and a bear case of 4.6%.

Which segment is growing fastest?

Volumetric flow meter fillers are growing fastest at an 8.8% CAGR, roughly 1.52 times the overall market rate, as manufacturers prioritize product giveaway reduction. This growth reflects the category's expansion well beyond beverage applications into premium personal care.

Who are the major companies in the Bottle Filling Machines Market?

Krones AG, KHS GmbH, Sidel, GEA Group, and Tetra Pak lead the market, together holding an estimated 45% combined share of installed machine base. Sidel and GEA Group also hold meaningful presence across several key regional markets.

Which country is growing fastest?

The Philippines is growing fastest at an estimated 8.4% CAGR as beverage and personal care manufacturing capacity expands rapidly across the country. Vietnam and Thailand follow closely as their own manufacturing sectors continue expanding rapidly.

Bottle Filling Machines Market Segmentation

The full report scope spans multiple orthogonal segmentation dimensions, with cross-tabulated demand data provided for each dimension pair. Coverage extends further to regional breakdowns, trend trajectories, and the competitive detail needed to support segment-level decision-making.

By Filling Technology

  • Gravity Fillers
  • Pressure and Overflow Fillers
  • Piston Fillers
  • Volumetric Flow Meter Fillers
  • Net Weight (Gravimetric) Fillers

By End-Use Industry

  • Beverage Manufacturing
  • Personal Care and Cosmetics
  • Household Products
  • Pharmaceutical Liquids
  • Contract Manufacturing

By Commercial Dimension

  • Equipment Capital Purchase
  • Equipment Lease and Financing Model
  • Bundled Giveaway Audit Services
  • Direct Manufacturer Sales

By Region

  • North America
  • Western Europe
  • East Asia
  • South Asia and Pacific
  • Latin America
  • Middle East and Africa
  • Eastern Europe

Scope, Methodology, and Coverage

Every figure in this report is reproducible from documented input assumptions. The scope below maps the historical period, the forecast horizon, the segmentation dimensions, and the countries covered, alongside the underlying primary and qualitative methodology.
Historical Period
2020 to 2025
Forecast Period
2026 to 2036
Base Year
2025 (USD billions; MMA Primary Research Dataset, October 2026)
Market Definition
This report covers equipment that fills liquid and semi-liquid products into bottles across beverage, personal care, household, and pharmaceutical applications, including gravity, pressure and overflow, piston, volumetric, and net weight filling technologies. It excludes aerosol filling equipment for pressurized products, capsule filling machines used in solid-dose pharmaceutical manufacturing, cup filling equipment for dairy and food products, and the bottles themselves as physical containers.
Quantitative Units
USD billions (current prices); installed machine units; typical fill accuracy by percentage
Segmentation Dimensions
By Filling Technology; By End-Use Industry; By Commercial Dimension; By Region
Regions Covered
North America, Western Europe, East Asia, South Asia and Pacific, Latin America, Middle East and Africa, Eastern Europe
Countries Covered
USA, China, Germany, France, UK, Japan, South Korea, India, Australia, Canada, Brazil, Mexico, Indonesia, Vietnam, Thailand, Philippines, Malaysia, UAE, Saudi Arabia, South Africa, Nigeria, Turkey, Poland, Netherlands, Italy, Spain, Sweden, Switzerland, Argentina, Colombia, Singapore, and additional markets relevant to this sector
Key Companies Profiled
Krones AG, KHS GmbH, Sidel, GEA Group, Tetra Pak, SACMI, Serac Group, Federal Mfg Co., Pneumatic Scale Angelus, Fogg Filler Company, Accutek Packaging Equipment, Liquid Packaging Solutions, E-PAK Machinery, Filamatic, ProMach, Shibuya Corporation, Zhangjiagang King Machine, Tech-Long Packaging Machinery, Cozzoli Machine Company, Norden Machinery
Quantitative Methodology
Primary survey, n=3,800 respondents, Q4 2025, six countries; demand-side model with trade association cross-validation
Qualitative Methodology
47 expert interviews, Q4 2025; applied to validate demand model assumptions, identify emerging dynamics, and assess competitive positioning
Report Format
PDF and XLSX data workbook (Word format preview document)
Publisher
Market Minds Advisory
Report Code
MMA-2026-PAC-347
Published
October 2026
Contact
sales@marketmindsadvisory.com | www.marketmindsadvisory.com

Purchase the full Bottle Filling Machines Market Report (2026 to 2036).

The full report delivers a complete market model for the bottle filling machines market, including segment-level and regional forecasts through 2036 alongside the five-year historical base across beverage, personal care, household, and pharmaceutical applications. It profiles twenty equipment makers, benchmarking competitive positioning on precision technology breadth, flexibility capability, and installed machine base. The report quantifies the input cost-driven conversion opportunity by region and models bundled giveaway audit and financing contract economics against equipment-only sales. A dedicated input cost chapter tracks component sourcing exposure by maker profile. Buyers receive a downloadable data workbook alongside the narrative report.
Segment and regional forecasts through 2036
Twenty-maker competitive benchmarking on precision technology
Input cost-driven conversion opportunity sizing by region
Bundled giveaway audit and financing contract economics modeling
Component sourcing cost exposure and mitigation strategy chapter
Downloadable data workbook with full regional detail

Built For The People Who Decide

From boardroom strategy to bench-side execution, this report is read cover-to-cover by leaders shaping the next decade of their industry, turning demand scenarios, market dynamics and valuation benchmarks into decisions.
CXOs/ Presidents/ VPs/ Managers
M&A and Corporate Development
Strategy Teams and R&D Heads
Procurement and Product Directors
Regulatory and Compliance Leaders
Investor Relations and Equity Analysts