Market Minds Advisory
Border Security Market

Border Security Market: Border Security: Sensor Coverage, Alarm Volume And The Response Capacity Nobody Budgets For

Every border programme buys detection first and discovers second that an alarm nobody can respond to within an hour is indistinguishable from having no sensor there at all in the first place.

Lead Analyst

Published

September 2026

Make Smarter Decisions with Customized Research Insights

Request a free sample report and evaluate market opportunities, growth trends, and competitive dynamics relevant to your business needs.

2025 MARKET VALUE$52.0BMarket Size 2025
2036 FORECAST VALUE$100.8BBase Case , 2026 to 2036
CAGR 2026 TO 20366.2 %Bull 7.4% / Bear 5.0%
INCREMENTAL OPPORTUNITY$45.6BNet 10- year value creation
EXPANSION MULTIPLE1.82x2036 value over 2026 base
Strategic Levers
M&A Pipeline
Regional Outlook
Country Rankings
Competitive Intelligence
Segmental Deep-dive
Call-Us : 91 93563 13602

Executive Snapshot and Market Trajectory.

Border programmes buy detection because detection is procurable. Response capacity is people, vehicles, roads and time, and it appears in a different budget line that nobody procures against. The gap between the two is where these programmes actually fail. Nobody procures effectively against a hiring problem.
Autonomous surveillance towers and sensor fusion grow fastest at 9.3%, driven by the simple arithmetic that a tower costs a fraction of a mile of physical barrier and covers considerably more ground. What it also produces is alarm volume. Sensor fusion exists because operators drowning in single-sensor alerts stopped acting on any of them, which is a well documented failure mode. Operators who stop believing their alerts are worse off than operators with none.
Concentration is low at 34% and reflects a market split between civil works, sensor systems and biometric identity work that share almost nothing commercially. Integrators holding both detection and response coordination are rare. Procurement increasingly asks about time to resolution rather than about detection probability, which favours very different suppliers. Buyers are asking a question about outcomes that most of this supply base was never organised to answer.
Market Definition
Revenue from systems and services procured to monitor, control and secure national borders and ports of entry, covering physical barrier and infrastructure works, ground-based and autonomous surveillance systems, uncrewed aerial and maritime patrol systems, border identity and screening systems, command, control and sensor fusion software, and integration and sustainment services. Excludes customs revenue collection systems, immigration case management, defence operations conducted beyond a national border, and general policing equipment not procured for border function.
Base Year Value
$52.0B in 2025 (MMA Primary Research Dataset, August 2026)
Forecast Period
2026 to 2036, eleven discrete annual values
CAGR
6.2% base case. Bull 7.4%. Bear 5.0%.
Fastest Growth Segment
Autonomous Surveillance Towers and Sensor Fusion: 9.3% CAGR
Fastest Growth Country
India: 8.2% CAGR
Fastest Growth Region
South Asia and Pacific: 8.2% CAGR
Largest Region
North America: 28% of 2025 global value
Market Leaders
Leidos, Elbit Systems, Anduril Industries, Thales and IDEMIA lead on border security programme revenue across systems and services. Source: company annual reports and MMA Primary Research Dataset, July 2026.
Primary Survey
n=3,800 procurement and R&D decision-makers, Q4 2025, six countries
Methodology
Demand-side build-up, cross-validated against public data, 47 expert interviews

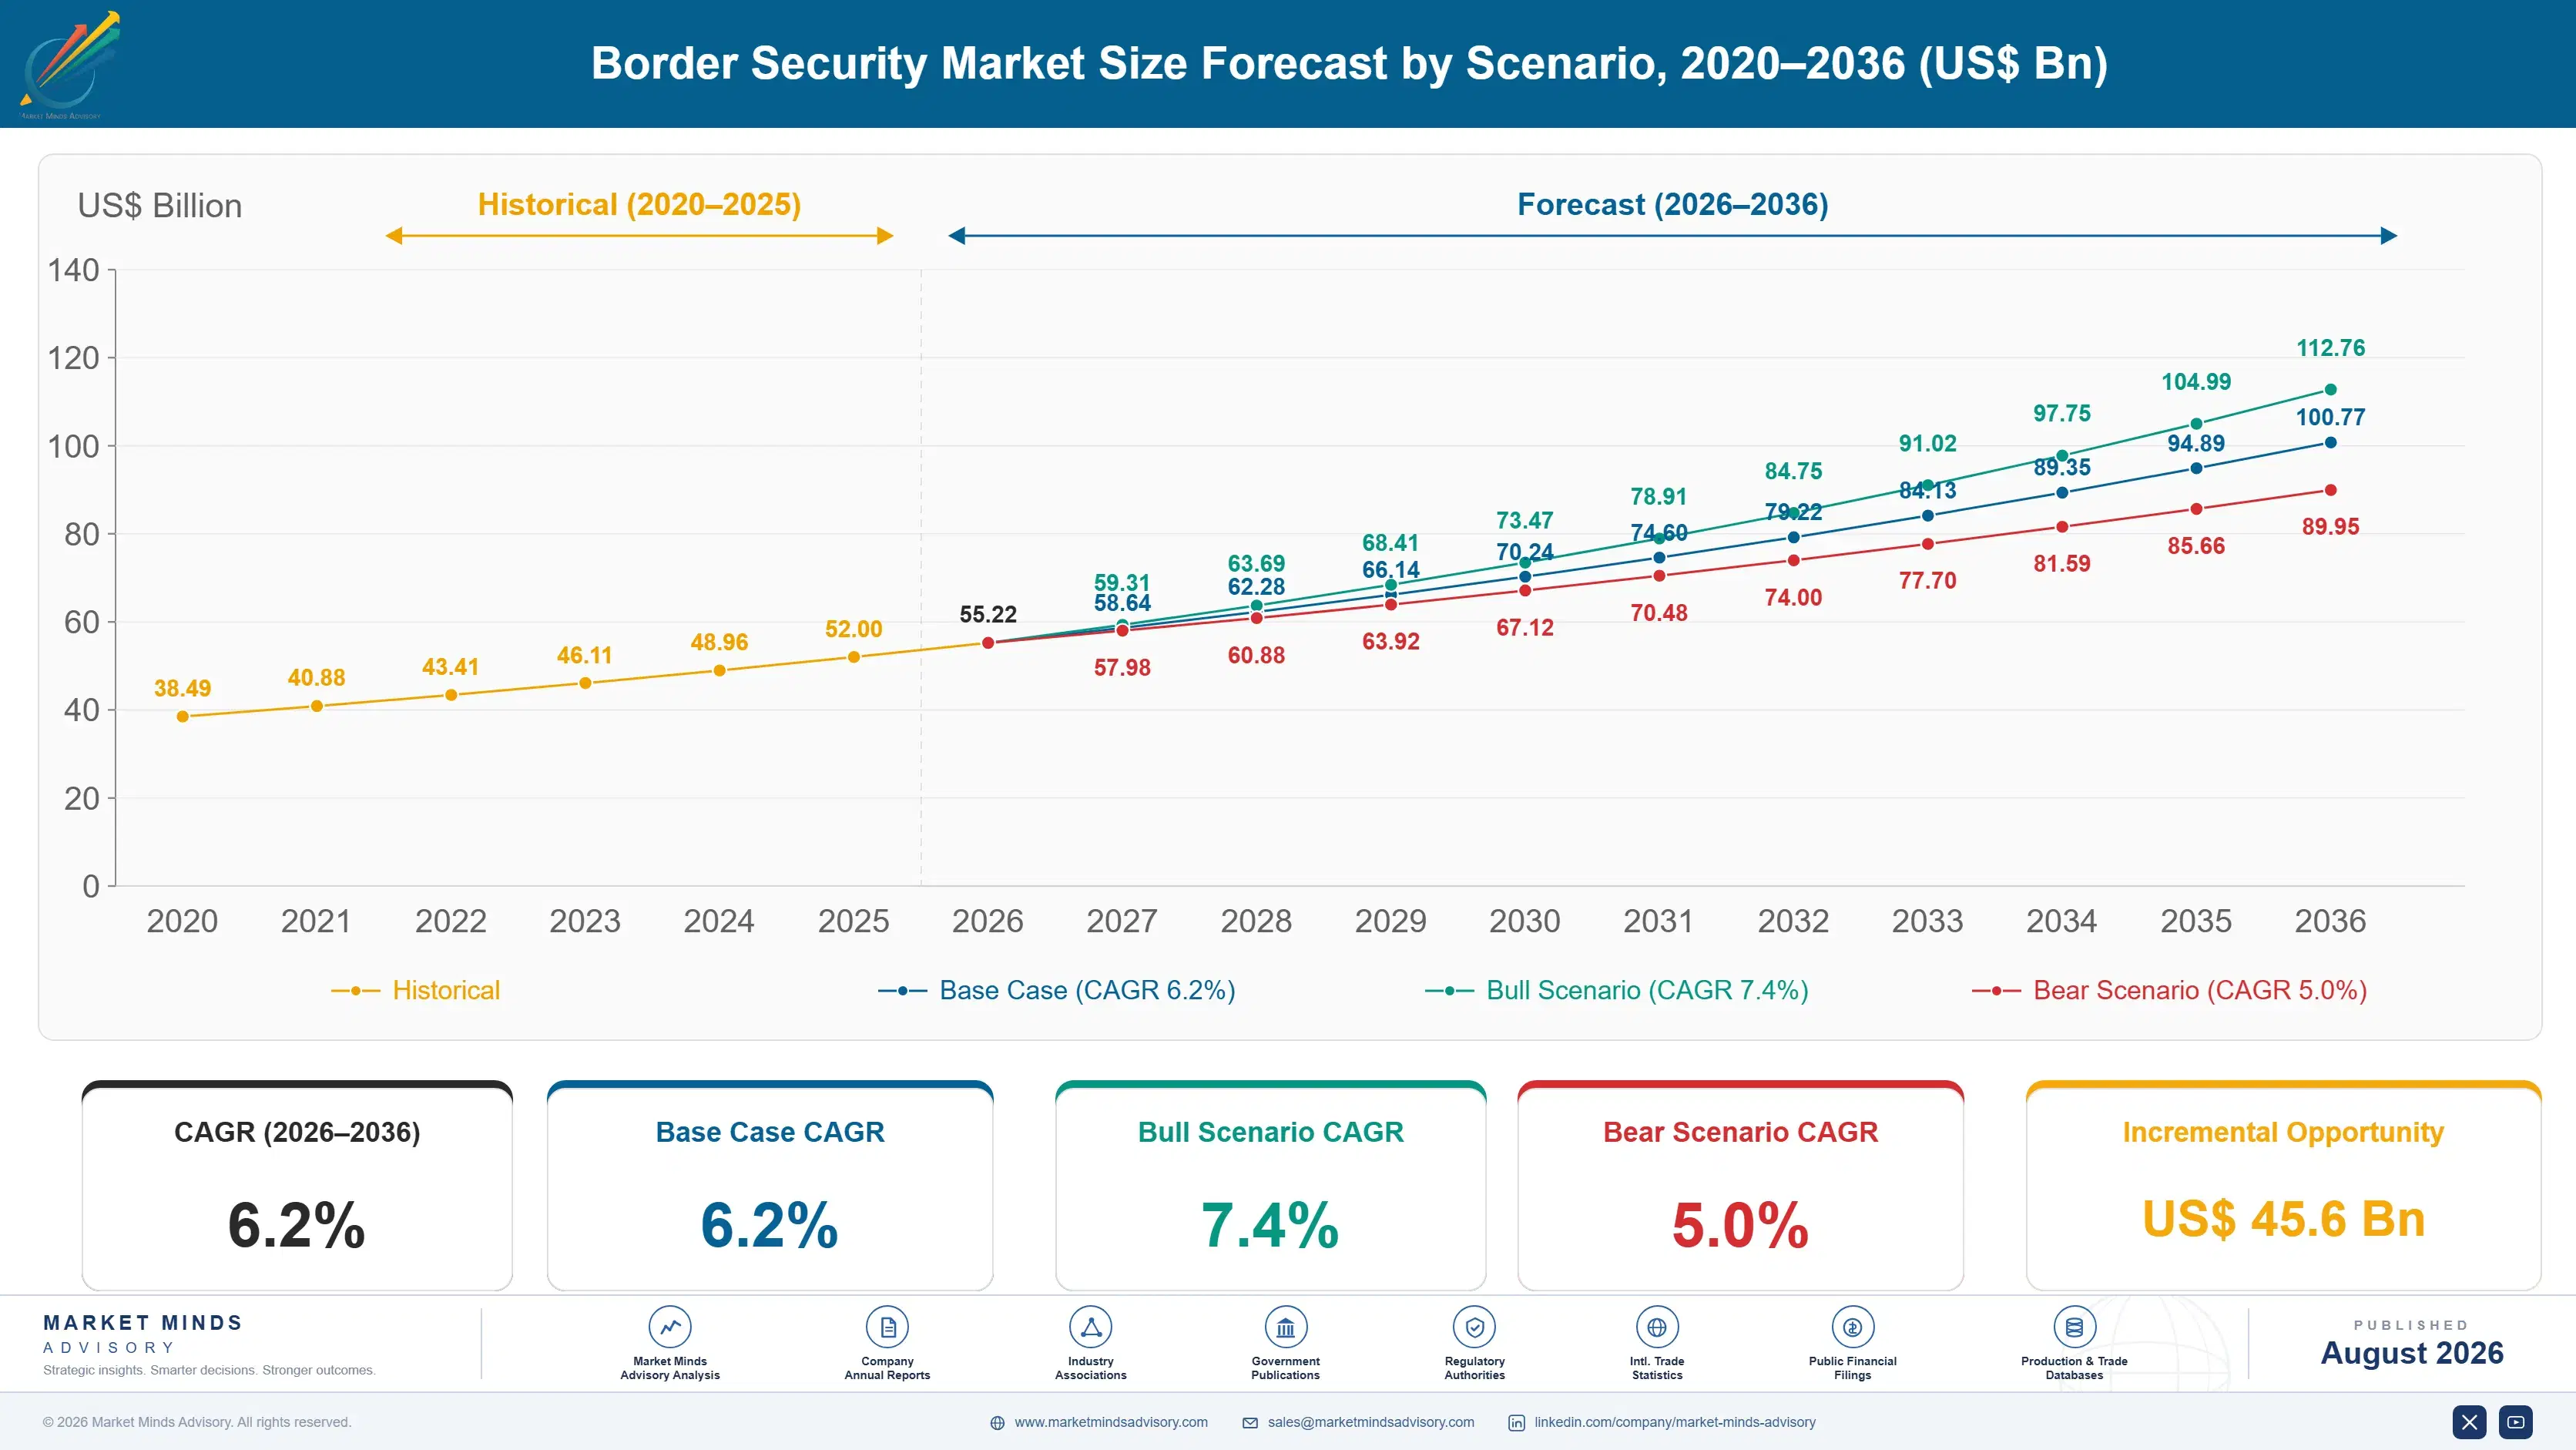
Border Security Market Forecast Scenarios

border-security-market-size-forecast-scenario-1788025425302
The 2020 to 2025 period moved spending away from concrete and toward sensors. Physical barrier construction slowed sharply in several major programmes while surveillance tower deployment accelerated, on cost arithmetic that favoured coverage per dollar overwhelmingly. Maritime and port screening investment continued steadily throughout. Revenue compounded near 5.1%, with the composition shifting far more than the total did across the whole period.
Three mechanisms carry the base case. Surveillance coverage continues expanding because a tower costs a fraction of a barrier mile and covers more ground. Sensor fusion procurement is growing because operators cannot act on the alarm volume that coverage produces. And port of entry screening throughput requirements are rising as trade volume grows against inspection capacity that has not expanded correspondingly. None of the three depends on any change of political direction at all.
The bull catalyst is a major programme procuring response coordination alongside detection, which would open a category integrators have wanted for years and nobody has yet funded properly. The bear risk is a high-profile failure at a heavily instrumented section, since evidence that detection without response changes nothing would slow sensor procurement everywhere. The evidence would be public.

Detection Without Response Is Nothing

The cost arithmetic explains most of what has happened to this market. A mile of physical barrier costs around USD 21 million and secures a mile. An autonomous surveillance tower costs a small fraction of that and detects across a radius near 7.5 miles. Any procurement officer comparing those numbers reaches the same conclusion, which is why tower deployment accelerated exactly as barrier construction slowed across several major programmes.
MARKET CONCENTRATION CR534%Share of programme revenue held by the leading integrators
COST PER BARRIER MILEUSD 21 millionTypical construction cost across recent physical infrastructure programmes
TOWER COVERAGE RADIUS7.5 milesTypical detection range from an autonomous surveillance installation
ALARM RESOLUTION TIME68 minutesAverage from detection to a response unit reaching location
FALSE ALARM RATE83%Share of single-sensor alerts requiring no operational response whatever
SUSTAINMENT COST SHARE46%Portion of programme lifetime cost from support rather than acquisition
Then comes the part that arrives afterwards. Coverage produces alarms, single-sensor false alarm rates run around 83%, and operators presented with hundreds of alerts they cannot triage stop acting on any of them. Sensor fusion is the response to that, correlating radar, camera and seismic inputs to produce something an operator will actually believe. It exists because detection alone made things worse rather than better in several documented cases.
The unfixed problem is response. Average time from detection to a unit reaching the location runs near 68 minutes, governed by roads, vehicles and staffing rather than by anything a sensor supplier controls. Sustainment at 46% of lifetime cost competes for the same budget. Programmes that instrumented heavily without funding response capacity produced expensive evidence of activity they could not act on.
"Every border programme I have reviewed bought more detection than it could respond to, because detection has a line item and response capacity is a hiring problem. The sensors work exactly as specified and the outcome does not change."
Director, Homeland Security Systems Practice · MMA Homeland Security and Defence Systems Practice · August 2026

Market Trends

Coverage Economics Moved Spending From Concrete To Sensors

A mile of physical barrier costs around USD 21 million and secures exactly one mile, while an autonomous tower costs a fraction of that and detects across a radius near 7.5 miles. That comparison settled the argument in most programmes without much debate, and barrier construction slowed as tower deployment accelerated. The shift favours sensor and integration suppliers over civil works contractors, and it has reshaped which firms hold significant border programme revenue. Civil works contractors who held large positions a decade ago now bid into programmes that barely mention concrete.
Market Impact: Costs USD 21 million per mile
Sensor Fusion Emerged From Alarm Volume Rather Than Ambition

Single-sensor false alarm rates near 83% mean that expanding coverage produces alert volumes operators cannot triage, and the documented consequence is that they stop responding to any of them. Fusion correlating radar, camera, seismic and acoustic inputs exists to produce alerts an operator will actually act on. It was not developed as a capability improvement but as a remedy for a problem that detection expansion created. Procurement documents now specify alert quality explicitly. The remedy became a market larger than the problem it was invented to solve, which happens more often than anyone admits.
Market Impact: Screens against 3% annual growth

Market Opportunities and Growth Drivers

Coverage Cost Advantage Drives Continued Surveillance Expansion

Autonomous surveillance towers detect across roughly 7.5 miles at a small fraction of the USD 21 million a barrier mile costs, and that arithmetic keeps producing procurement decisions in the same direction across almost every major programme. Terrain that barriers cannot cross economically is exactly where towers work best. The expansion continues regardless of political position on physical infrastructure, because the cost comparison holds under any policy. Suppliers positioned in towers and fusion capture it. Coverage per dollar is an argument that survives every change of administration and every review.
Market Impact: Leaves 68 minute response times

Port Screening Throughput Falls Behind Growing Trade Volume

Cargo and passenger volumes at ports of entry continue rising against inspection capacity that has not expanded correspondingly, which forces investment in screening technology that raises throughput rather than in additional inspection lanes nobody can staff. Non-intrusive inspection, biometric processing and risk targeting all follow from that constraint. The demand is driven by trade growth rather than by any security event, which makes it unusually steady and largely immune to political cycles. Trade volume is among the most reliable demand signals available anywhere in security procurement, precisely because nobody legislates it.
Market Impact: Absorbs 46% of lifetime cost

Market Restraints and Challenges

Response Capacity Is Not Procured Alongside Detection

Average time from alarm to a unit arriving runs near 68 minutes, governed by roads, vehicles and staffing that sit in operating budgets rather than in capital procurement. The root cause is that detection is a purchasable system and response capacity is a hiring and infrastructure problem nobody competes to supply. Commercially it caps the outcome any sensor programme can deliver. Mitigation runs through response time modelling at bid stage, coordinated deployment planning, and integrators offering response coordination software alongside detection. None of those mitigations hires anybody or builds a road.
Market Impact: Compares 7.5 miles against one

Sustainment Consumes Budget Programmes Rarely Plan For

Support, maintenance and technology refresh reach roughly 46% of programme lifetime cost, and procurement routinely funds acquisition generously while leaving sustainment to compete against operating priorities annually. The root cause is that capital and operating budgets are appropriated separately and on different cycles. Commercially it produces installed systems degrading through underfunded support. Mitigation runs through lifetime cost contracting, performance-based support agreements, and suppliers pricing refresh into the original award rather than hoping for it later. Every one of those routes requires a customer willing to commit money across a decade.
Market Impact: Addresses an 83% false rate
4 additional market trends, 3 additional growth drivers, and 2 additional restraints and challenges are covered in the full report. Contact sales@marketmindsadvisory.com to access the complete intelligence.

Segment CAGR and Growth Architecture

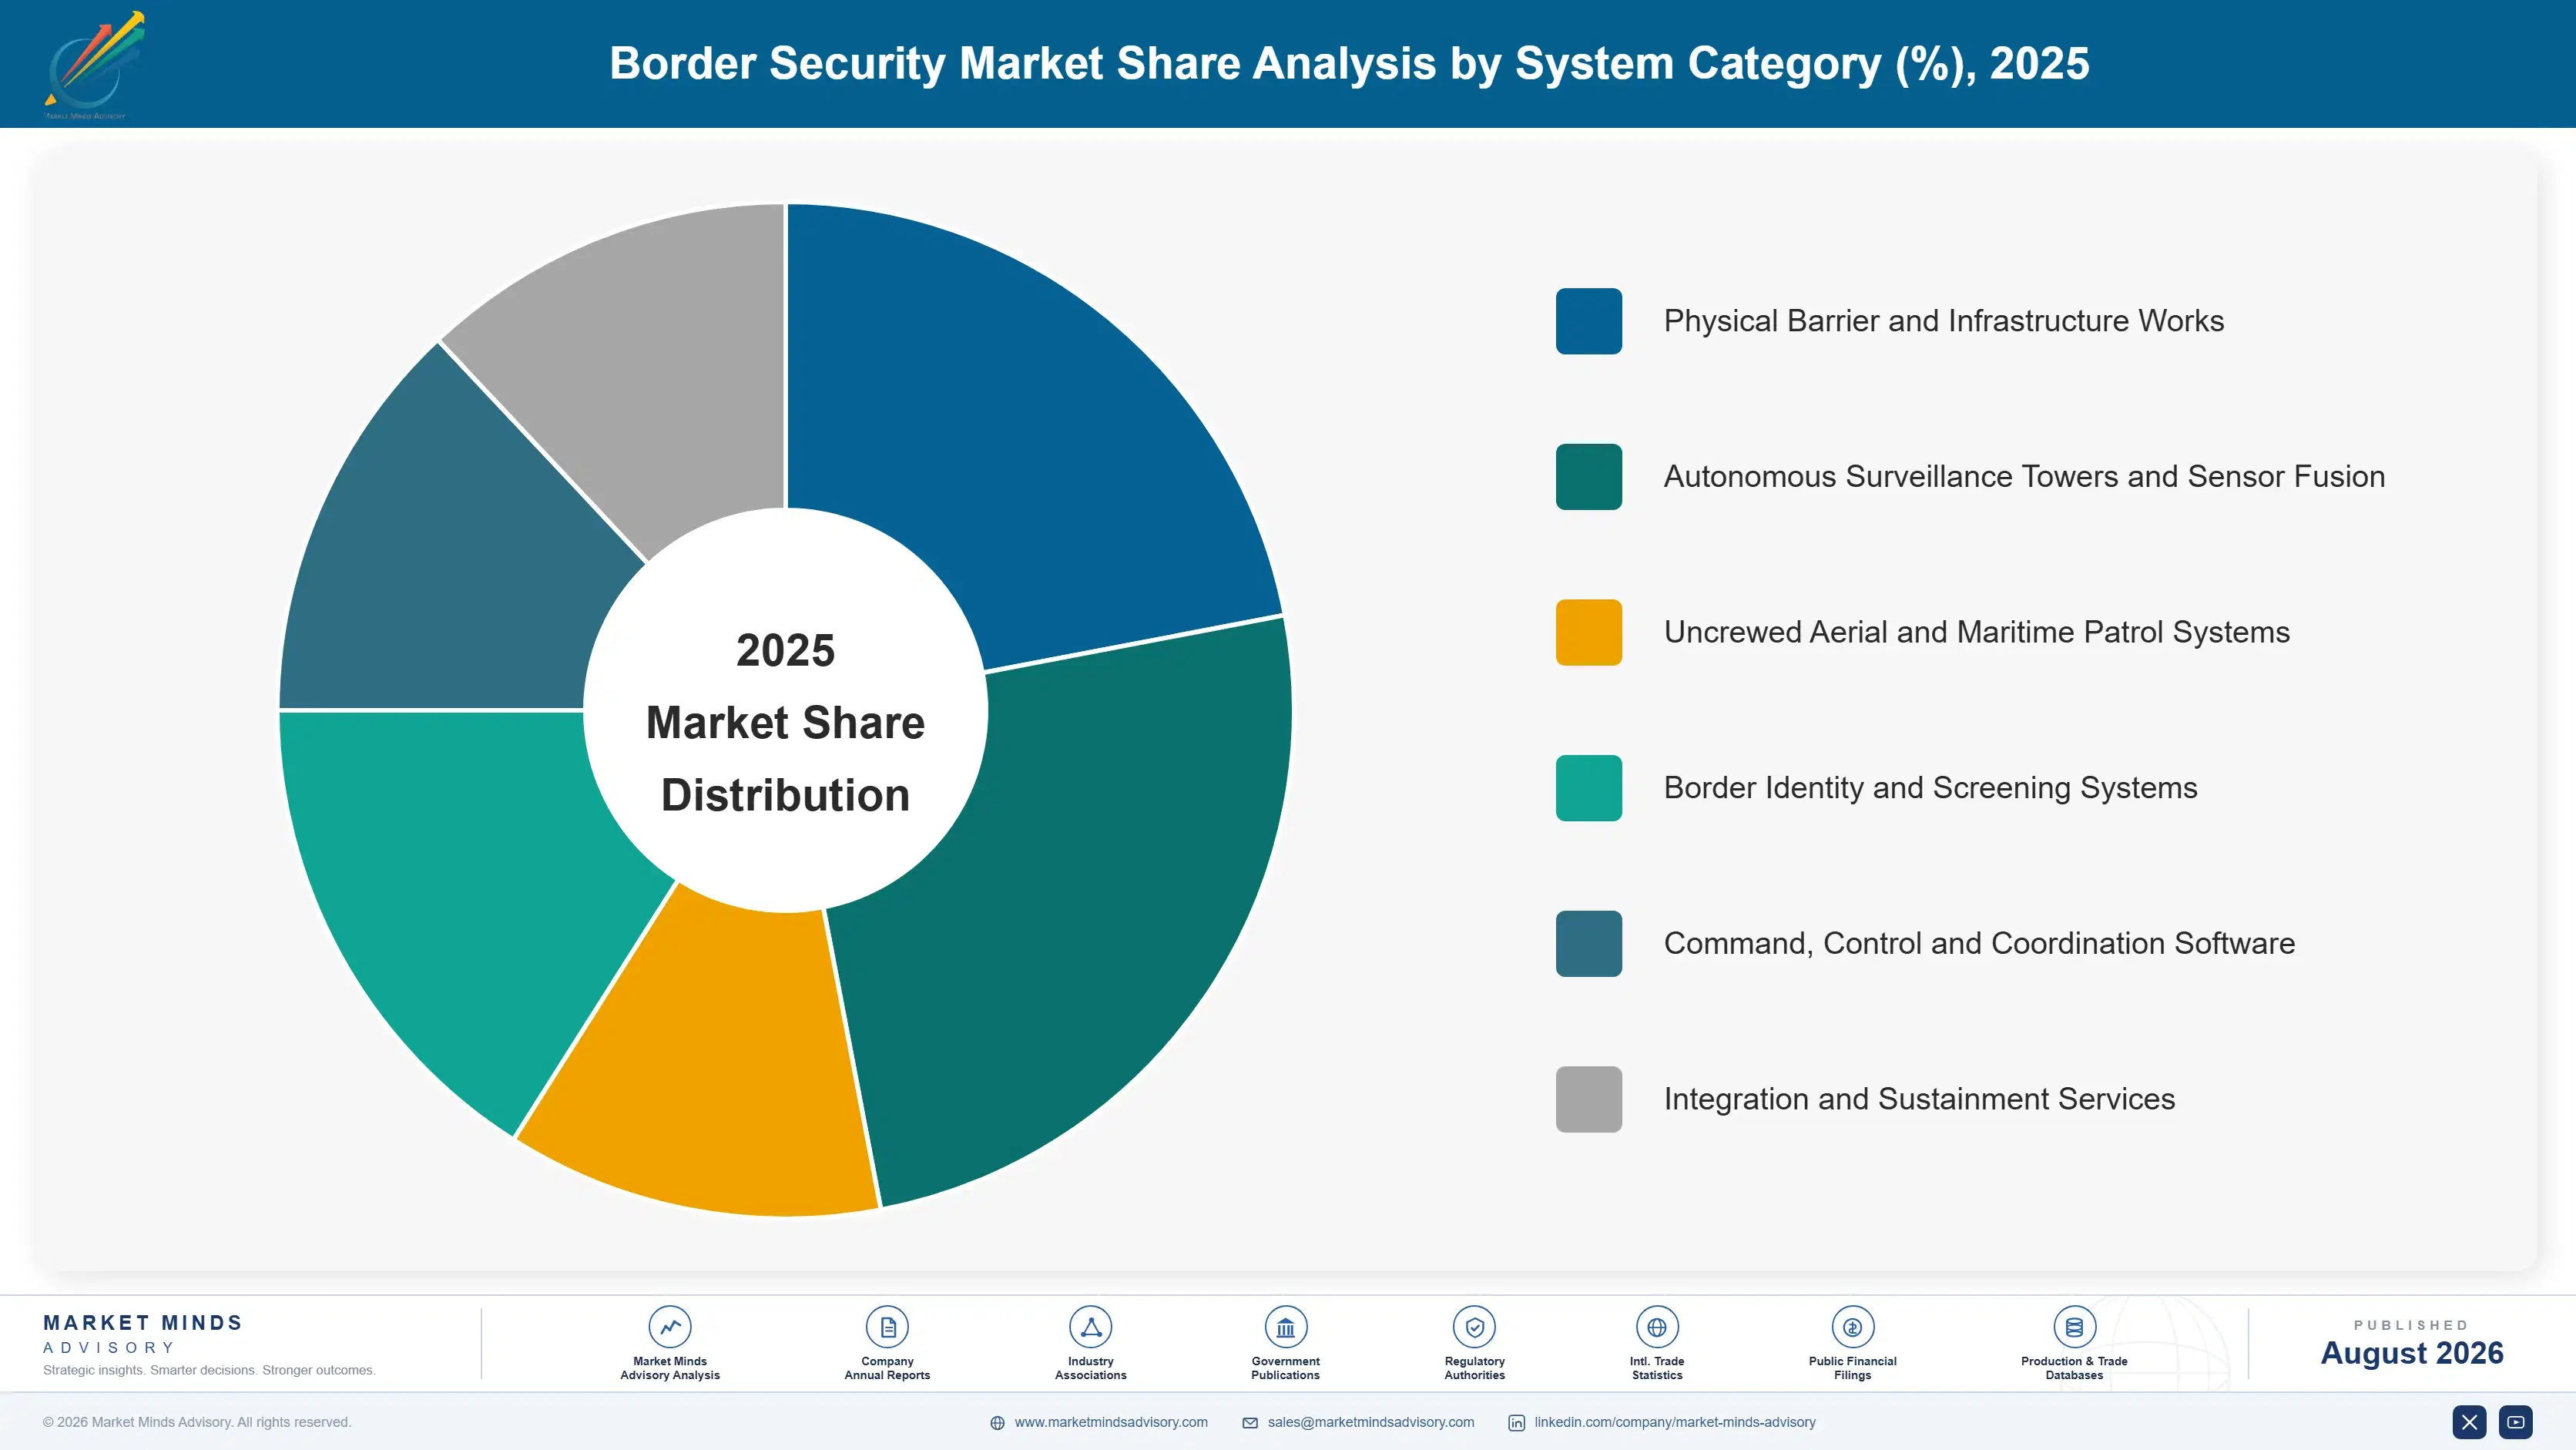
Segmentation follows system category, since physical works, surveillance systems, screening technology and coordination software are procured differently, by different authorities and against different criteria. Six categories describe the market completely, from barrier construction where cost per mile governs everything through to sensor fusion where alert quality has become the specification that actually matters to the buyer.
border-security-market-market-share-analysis-1788025425857

Autonomous Surveillance Towers and Sensor Fusion

The fastest category grows at 9.3%, half again the market rate of 6.2%, and cost arithmetic rather than any technical advance explains most of it. A tower detecting across roughly 7.5 miles costs a small fraction of the USD 21 million a single barrier mile requires, and terrain that barriers cannot cross economically is exactly where towers perform best. Fusion capability grew alongside for a less flattering reason: single-sensor false alarm rates near 83% produced alert volumes that operators stopped triaging entirely. Procurement now specifies alert quality rather than detection probability, which is a considerably harder requirement to satisfy convincingly. The remedy has now become larger than the original purchase itself.
CAGR 9.3%

Border Identity and Screening Systems

Identity and screening systems grow at 8.1% on a demand mechanism unrelated to anything happening between ports of entry. Cargo and passenger volumes rise steadily against inspection capacity that cannot expand at the same pace, which forces investment in throughput rather than in additional lanes nobody can staff. Non-intrusive cargo inspection, biometric processing at passenger entry and risk targeting analytics all follow from that single constraint. The demand is unusually steady because trade growth rather than security policy drives it, and it therefore survives changes of administration that reshape almost every other line in this market. Trade growth is the most politically indifferent demand signal in this entire market by some way.
CAGR 8.1%
Full segment breakdown across 6 segments available in the complete report.

Regional Architecture and Country Demand Map

Border security spending follows border length, crossing volume and fiscal capacity rather than any single risk assessment. North America and East Asia lead on programme scale, with South Asia and Pacific growing fastest and Eastern Europe expanding well beyond what its share suggests. The pattern is unusually stable.

East Asia

A 24% share rests on extensive land and maritime boundary programmes across several countries, with domestic suppliers taking most of the work and external participation limited accordingly. Chinese border and coastal surveillance deployment is very large and effectively closed to outside suppliers. Japanese and Korean maritime domain awareness programmes emphasise coastal radar, vessel tracking and port screening rather than land barriers. Southeast Asian maritime boundary disputes have driven patrol and surveillance procurement across several national coast guards simultaneously. The closed portion of this region is large enough that external suppliers should read the headline share with considerable caution, since very little of it is actually addressable to anybody outside the region itself.
Share: 24% | CAGR: 7.2% (2026 to 2036)

North America

The largest single-country programme anywhere sits in this region, and its composition has changed more than its size. Barrier construction slowed while autonomous tower deployment accelerated on cost arithmetic that no policy position altered. Port of entry screening investment continues on trade volume growth independent of land border debate. Response capacity remains the unresolved constraint, with alarm resolution times governed by roads, vehicles and staffing rather than by anything the sensor programmes procured. The composition change matters more than the total does, because it moved programme leadership from civil works contractors toward software and integration participants who were barely present in this market a decade ago, and the shift is not reversing.
Share: 28% | CAGR: 6.4% (2026 to 2036)
Regional intelligence for 5 additional markets available in the complete report: Western Europe, South Asia and Pacific, Latin America, Middle East and Africa, Eastern Europe. Contact sales@marketmindsadvisory.com.
border-security-market-country-cagr-analysis-1788025426373

Where Border Programme Margin Sits

Four levers work on alert quality, lifetime cost position and response coordination rather than on detection performance, which most suppliers can already demonstrate adequately. Fusion capability, sustainment contracting, response software and rapid deployment each address something a supplier can pursue immediately. None of the four requires a better sensor than anybody else already builds today.

Sell Alert Quality Rather Than Detection Probability

Single-sensor false alarm rates near 83% mean an operator stops responding to alerts long before coverage is complete, and procurement documents now specify alert quality because buyers learned that expensively. Suppliers still bidding detection probability are answering a question the customer stopped asking. Fusion capability reducing false alerts by 60 to 70 percent wins competitions that superior sensors lose. The distinction is commercial rather than technical, and several capable suppliers have not yet made it. The 83% figure is what changed procurement, and most bid documents still ignore it entirely.
Market Impact: Cuts operator false alerts by roughly 65% overall

Contract Lifetime Cost Not Acquisition Cost

Sustainment reaches roughly 46% of programme lifetime cost and is routinely left to compete against operating priorities year by year, which degrades installed systems and damages the supplier's reputation for something outside its control. Pricing refresh and support into the original award changes that entirely. Customers resist the higher headline figure and accept it when shown the alternative. Suppliers who win on acquisition price and then watch the system decay have gained very little from the victory. A 10 year support agreement is worth more than the acquisition it accompanies.
Market Impact: Secures the entire 46% of lifetime programme spend

Offer Response Coordination Alongside Detection Systems

Alarm resolution near 68 minutes is governed by roads, vehicles and staffing rather than by sensors, and no supplier currently sells the coordination layer that would compress it. Dispatch optimisation, unit tracking and resolution analytics are software problems adjacent to capability suppliers already hold. The category is unfunded rather than unwanted, and the first supplier to make the case credibly defines it. Buyers know the gap exists and have never been offered anything addressing it. Software of this kind costs perhaps 5 million dollars to build and nobody has built it.
Market Impact: Targets the 68 minute alarm resolution problem directly

Build Rapidly Deployable Systems For Contested Boundaries

Boundary situations change faster than procurement cycles, and buyers repeatedly need surveillance in place within weeks rather than the 24 months a conventional programme takes. Rapidly deployable towers, relocatable sensors and containerised command capability address that directly. Eastern European procurement has demonstrated the demand convincingly since 2022. Suppliers offering only fixed installation are absent from an increasing share of awards, and the capability transfers into disaster response and temporary event security work as well. A 6 week deployment answers a requirement that a 24 month programme cannot address at all.
Market Impact: Deploys capability within 6 weeks rather than years

Who Controls the Margin Pool

Concentration is low at around 34% across the five largest participants measured on border security programme revenue, and the fragmentation is definitional rather than competitive. Civil works construction, sensor systems, screening technology and identity software are separate industries that share a customer and almost nothing else. Very few participants hold meaningful positions across more than two of them. The customer is the only thing they share.
Competition runs on alert quality, integration capability and deployment speed. Alert quality decides surveillance awards now that buyers understand what false alarm volume does to operations. Integration capability decides who leads programmes rather than supplying into them. Deployment speed has become decisive on contested boundaries where situations change faster than any conventional procurement cycle can respond to. Detection range is now a threshold.

Pressure is arriving from software-defined entrants rather than from traditional defence firms. Participants building autonomy, fusion and command capability first and hardware second have taken surveillance positions from established suppliers at considerable speed. Meanwhile buyers are asking about time to resolution rather than detection probability. Rankings will shift toward suppliers combining fusion capability with response coordination, since essentially nobody currently offers both.
border-security-market-company-positioning-matrix-1788025426894

Competitive Moat and Risk Dimensions

ELBIT SYSTEMS

Moat: Operational deployment evidence across boundaries

Elbit Systems holds border surveillance positions built on systems operating under genuine boundary conditions rather than on demonstration, and that evidence is what buyers increasingly want when evaluating alert quality claims. Its fusion capability developed alongside deployment rather than afterward. Export reach across many customer nations spreads development cost in a way single-market suppliers cannot approach at all.
ELBIT SYSTEMS

Risk: Political sensitivity in some procurements

Border security procurement is politically visible in a way most defence contracting is not, and supplier nationality attracts scrutiny that has excluded capable participants from specific programmes. That exposure is unrelated to system performance and cannot be engineered away. Competitors sometimes benefit from it without needing to win on any technical basis.
ANDURIL INDUSTRIES

Moat: Software first surveillance architecture

Anduril built autonomy and fusion capability first and hardware around it, which produced alert quality that sensor-led competitors struggled to match once buyers began specifying it. Rapid deployment and relocatable installation suit boundary situations changing faster than procurement cycles. The commercial model of self-funded development and fixed-price delivery reaches decisions considerably faster than conventional programme structures allow.
ANDURIL INDUSTRIES

Risk: Concentration in few large programmes

Revenue concentrated in a small number of very large programmes carries exposure to political change, appropriations timing and single procurement decisions that no supplier controls. A programme paused or restructured removes substantial volume immediately. Diversifying internationally means competing where operational deployment evidence matters more than software architecture does.

Players Tracked

Prominent Players

Leidos
Elbit Systems
Anduril Industries
Thales
IDEMIA

Other Key Players

General Dynamics Mission Systems
L3Harris Technologies
Smiths Detection
Rapiscan Systems
Teledyne FLIR
Advanced Technology Systems Company
Saab
Indra Sistemas
Hensoldt
Bharat Electronics
NEC Corporation
Controp Precision Technologies
Senstar Technologies
Magal Security Systems
Vinci Construction

Recent Developments

MAY 2024

Border authority shifted programme funding from barriers toward surveillance

A national border authority reallocated programme funding from physical barrier construction toward autonomous surveillance tower deployment, citing coverage achieved per dollar across terrain where barrier construction is impractical. This was a budget reallocation decision by the customer rather than any acquisition, merger or commercial arrangement between suppliers.
Signal: Coverage per dollar rather than any policy position is what actually actually reallocated this programme spending.
NOVEMBER 2024

Procurement specified alert quality rather than detection probability

A border surveillance procurement specified false alarm rates and operator workload thresholds as evaluated requirements rather than detection probability alone, reflecting operational experience with alert volumes that overwhelmed staffing. This was a procurement specification decision rather than any commercial transaction between the participating suppliers in that competition.
Signal: Buyers specifying alert quality confirms that detection expansion created a problem it did not itself solve.
MARCH 2025

Eastern European states funded rapidly deployable boundary surveillance

Several eastern European states funded relocatable surveillance and counter-uncrewed systems for boundary deployment on timescales far shorter than conventional acquisition programmes, responding to conditions changing faster than procurement cycles accommodate. This was national procurement action rather than any corporate transaction between the suppliers involved in it.
Signal: Deployment speed has become a competitive requirement rather than a convenience for these particular buyers now.

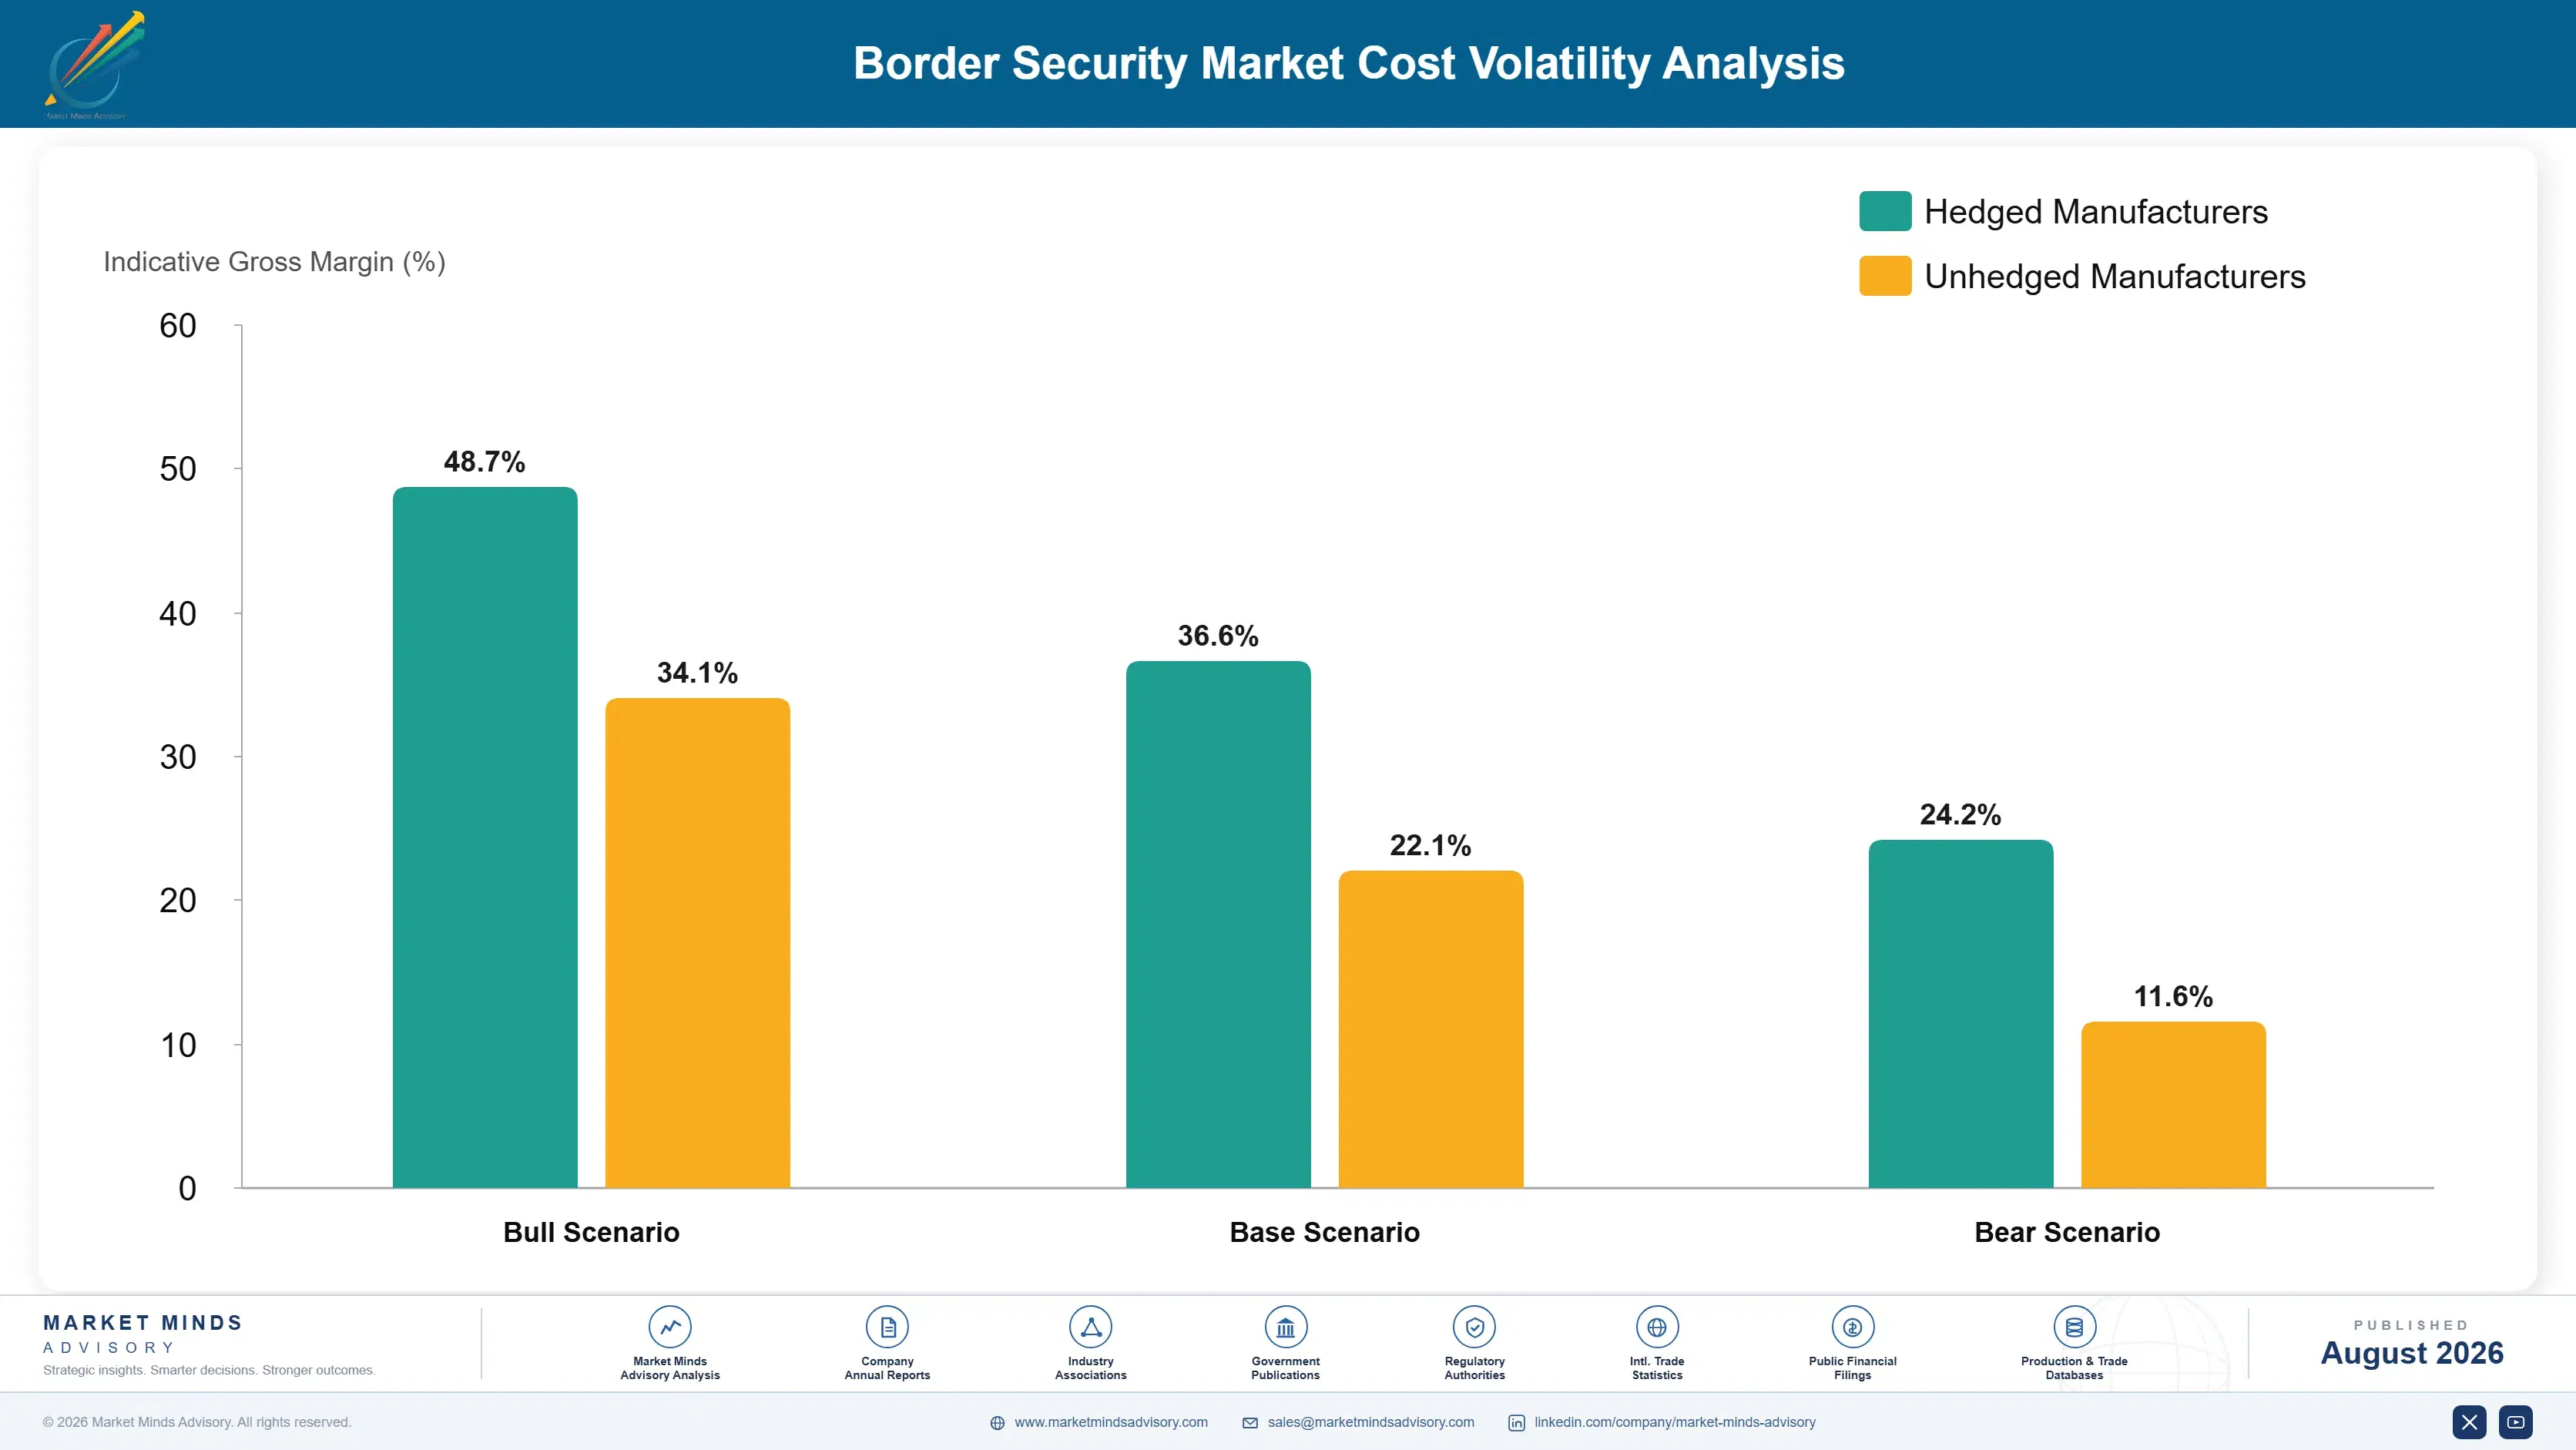
What Border Coverage Actually Costs

Cost divides four ways and hardware is smaller than most programmes assume. Sustainment, support and technology refresh absorb roughly 46% of lifetime cost, sensor and installation hardware near 24%, software, integration and command capability near 18%, and site works with power and communications the remaining 12%. Programmes budgeting acquisition generously and sustainment annually consistently discover the imbalance several years after the systems are installed.
Steel, concrete and construction labour pricing moved sharply across recent years and made barrier programmes considerably more expensive per mile than original appropriations assumed, which accelerated the shift toward surveillance on pure cost grounds. Vinci Construction and Leidos have both discussed input cost and programme conditions across recent reporting periods. Power and communications provision to remote installations remains a separate and frequently underestimated cost line in almost every programme.

Exposure varies by contract structure rather than by geography. Suppliers holding performance-based sustainment agreements recover cost across the whole lifetime rather than at acquisition. Those winning on acquisition price carry reputational exposure for systems degrading under support nobody funded. Civil works contractors carry direct commodity exposure under fixed-price awards, while sensor and software suppliers carry considerably less of it.
border-security-market-cost-volatility-analysis-1788025427090

Performance based sustainment contracted at original award

Sustainment reaches roughly 46% of lifetime cost and is routinely left to annual competition against operating priorities, which degrades installed systems and damages suppliers for something outside their control. Contracting performance-based support at the original award removes that exposure for both parties. Customers resist the higher headline figure and generally accept it once shown what the alternative actually costs them.

Power and communications costed properly at bid stage

Providing power and communications to remote installations is underestimated in almost every programme, and the cost falls on whoever bid without modelling it against the actual terrain. Site survey before pricing costs comparatively little and prevents a considerable loss later. Suppliers who assume grid and network availability at remote sites discover otherwise at their own expense repeatedly.

Commodity exposure passed through on civil works awards

Steel, concrete and construction labour pricing moves faster than multi-year barrier programmes can absorb under fixed-price terms, and contractors carry that exposure directly and completely. Indexed pricing terms are available and are frequently not negotiated at award. Contractors accepting fixed pricing across a multi-year construction programme are taking a commodity position rather than a construction one.

Portfolio Architecture for Margin Defence

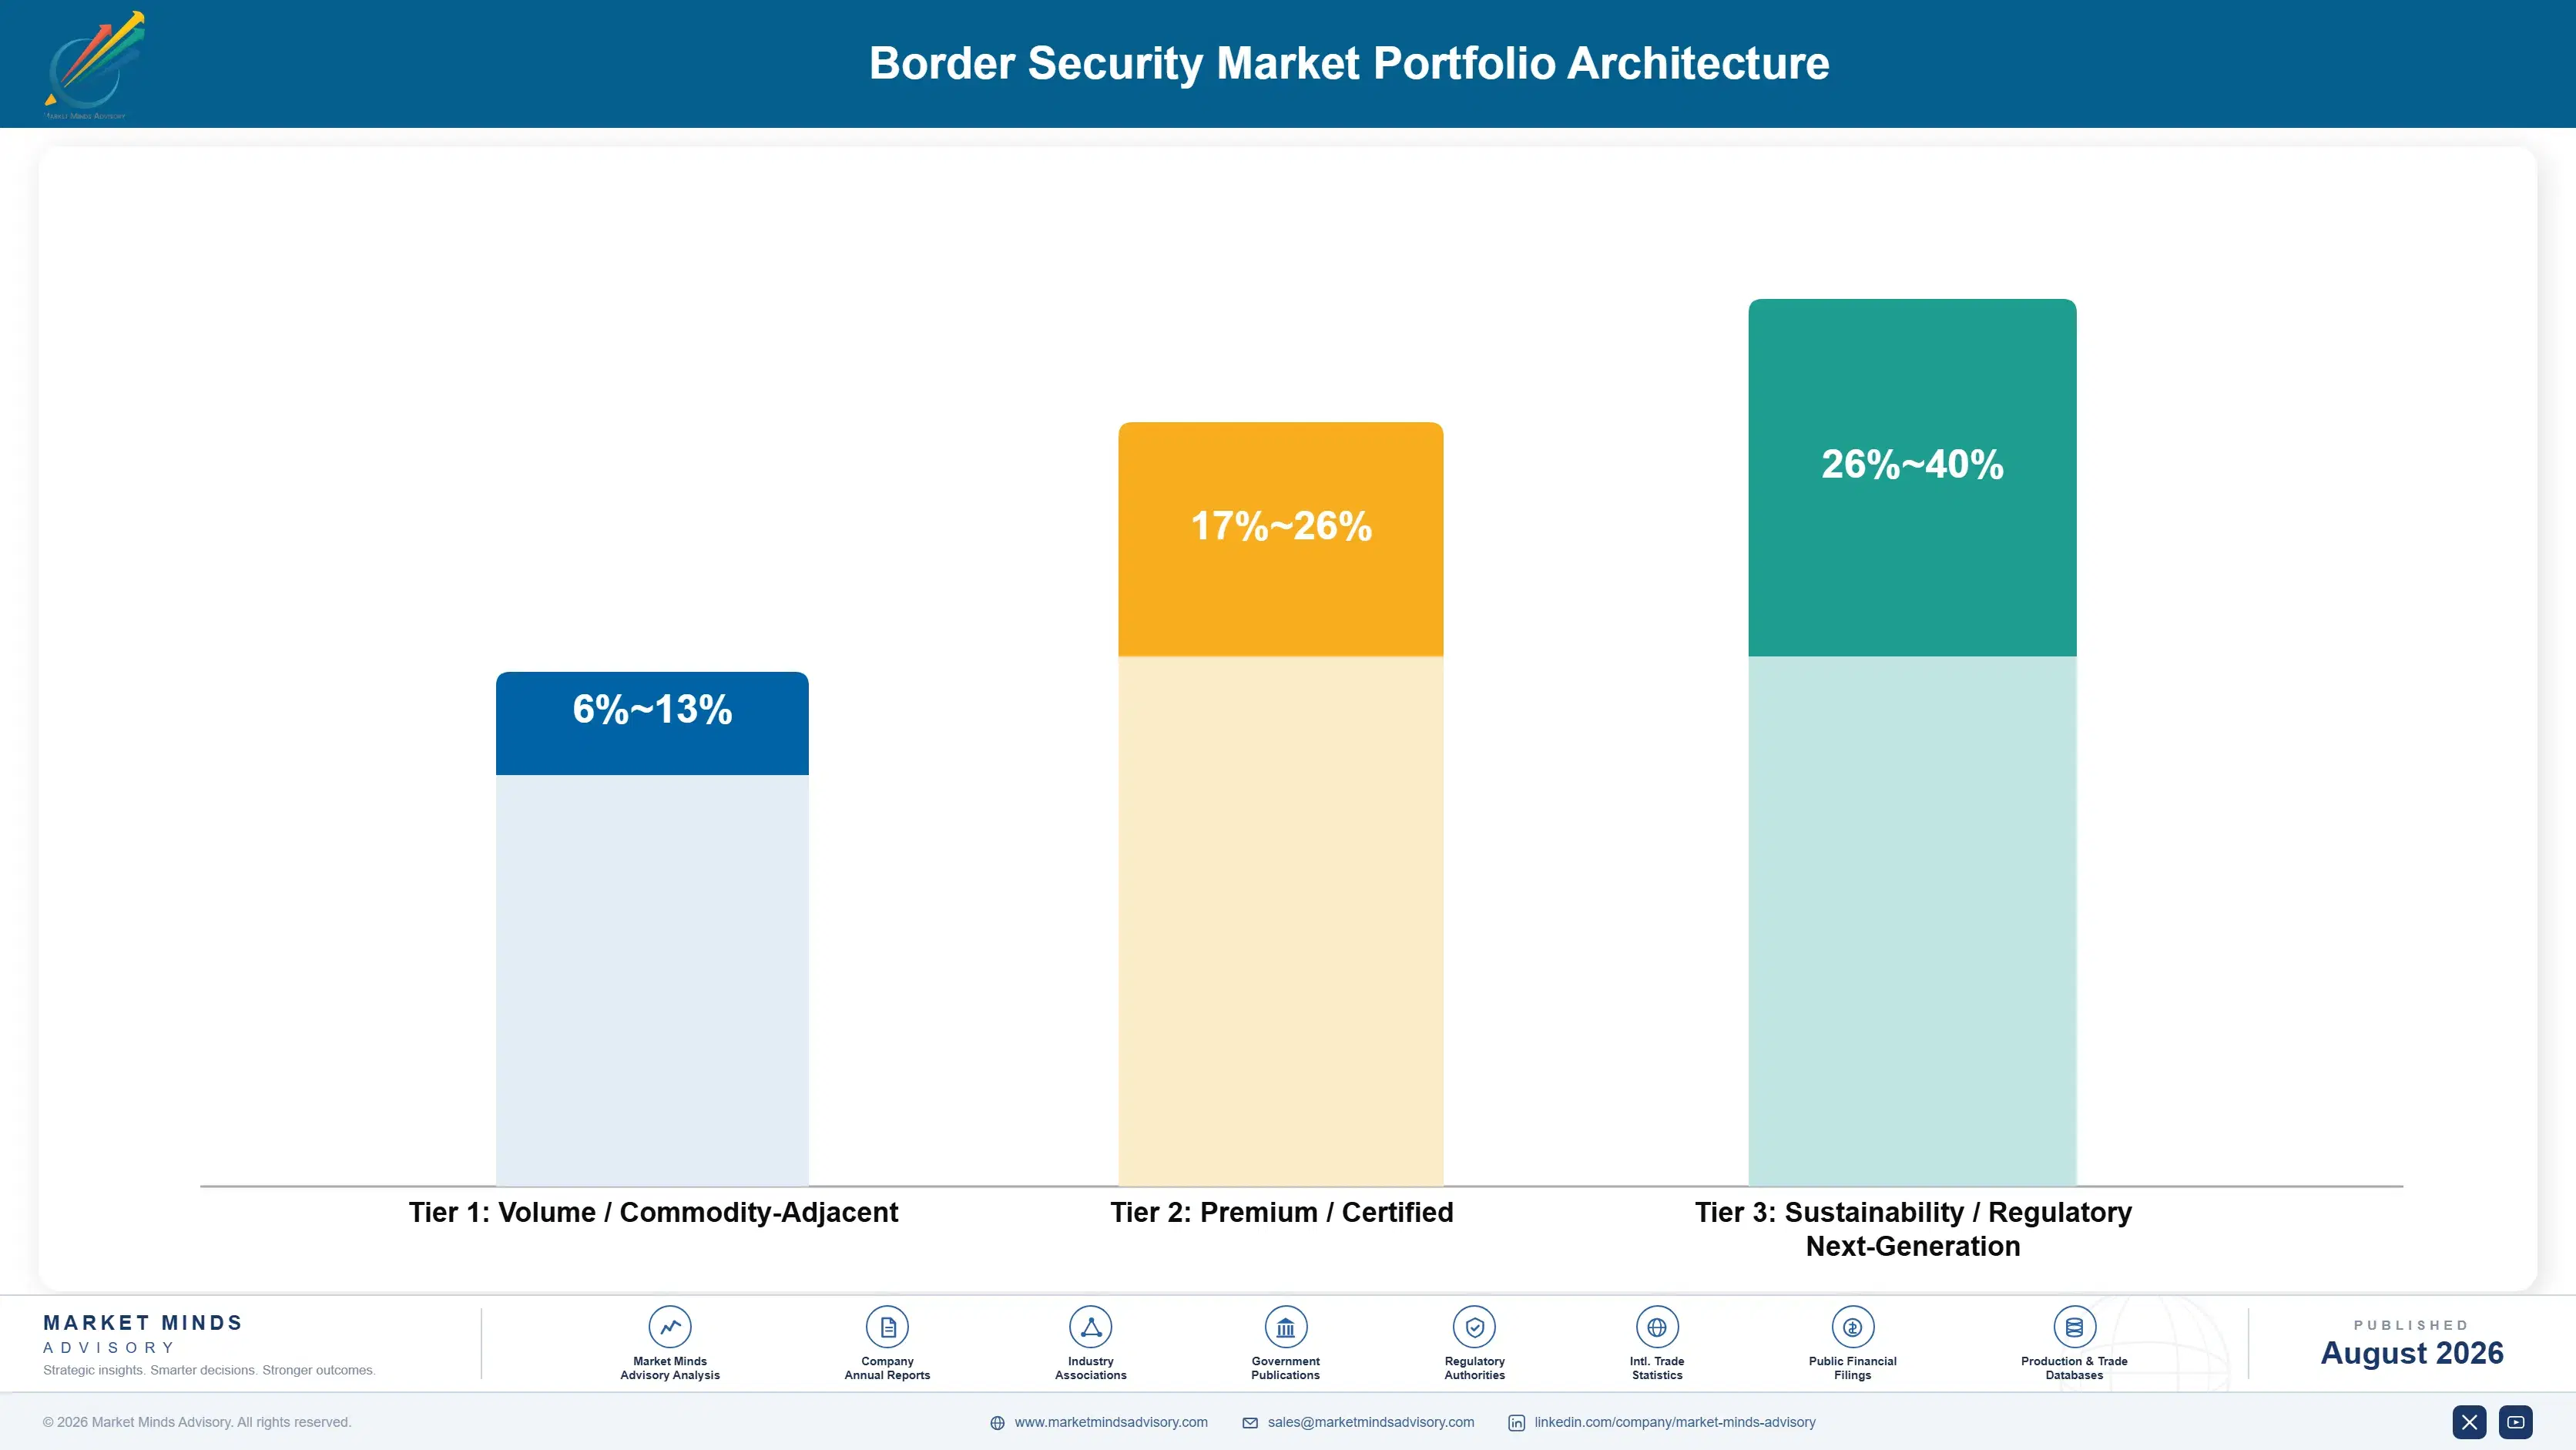
The portfolio separates by whether the work is construction or capability. Physical barrier and infrastructure works form the volume core: enormous contract values, competition on price and schedule, direct commodity exposure, and margins that reflect civil construction rather than anything about security. The revenue is very large and the position is not defensible by any technical means. The money is large and the position is not.
Margin concentrates in fusion, command software and identity systems, where alert quality, integration authority and accreditation create barriers that hardware capability alone never produces. Buyers now specify false alarm thresholds and operator workload rather than detection probability, which favours suppliers who built software capability first. That change reordered surveillance competition faster than most participants expected it to. Software capability came first for the winners.

The overlooked pool is response coordination. Alarm resolution near 68 minutes is the constraint every programme runs into and nobody sells against, because it sits in operating budgets rather than in capital procurement. Dispatch optimisation and resolution analytics are adjacent to capability suppliers already hold. The category is unfunded rather than unwanted, and defining it is available to whoever moves first. Nobody has moved yet.

Volume / Commodity-Adjacent

Physical barrier construction, site works, power and communications provision and installation services. Range spans seven points because commodity exposure and schedule performance decide outcomes entirely under fixed-price construction terms. Nothing survives handover.
Gross Margin: 6-13%

Premium / Certified

Surveillance hardware, patrol systems, non-intrusive inspection equipment and sensor supply into other participants' programmes. Range spans nine points because sustainment position varies enormously between suppliers who contracted it and those who did not.
Gross Margin: 17-26%

Sustainability / Regulatory / Next-Generation

Sensor fusion, command software, identity and screening systems and integration authority. Range spans fourteen points because software margins and systems integration economics are barely comparable businesses inside one tier. Very few hold integration authority.
Gross Margin: 26-40%
border-security-market-portfolio-architecture-1788025427584

High-value Sub-segments and Strategic Watch-out

Autonomous Surveillance Towers and Sensor Fusion

High value and high growth at 9.3%, driven by coverage arithmetic that no policy position has altered anywhere. The twelve point range separates suppliers holding fusion and alert quality capability from those supplying sensors into somebody else's architecture. Coverage arithmetic settled this argument years ago.
Gross Margin: 28-40%

Border Identity and Screening Systems

High value with moderate growth at 8.1%, driven by trade volume rather than by any security event or policy cycle. The eight point range reflects accreditation position, since identity systems carry approval burdens that screening hardware does not. Trade volume drives it and nothing else does.
Gross Margin: 26-34%

Physical Barrier and Infrastructure Works

The volume core, competed on price and schedule with direct commodity exposure under fixed-price terms across multi-year programmes. Enormous contract values, civil construction margins, and no technical position that survives the end of the programme itself. The commercial relationship ends exactly when the construction does.
Gross Margin: 6-13%

Response Capacity Gap

The strategic watch-out rather than a growth pool. Alarm resolution near 68 minutes caps what any detection programme achieves, sits in operating budgets nobody procures against, and is the reason instrumented sections underperform expectations. No supplier sells against it and every buyer runs into it.
Gross Margin: Variable

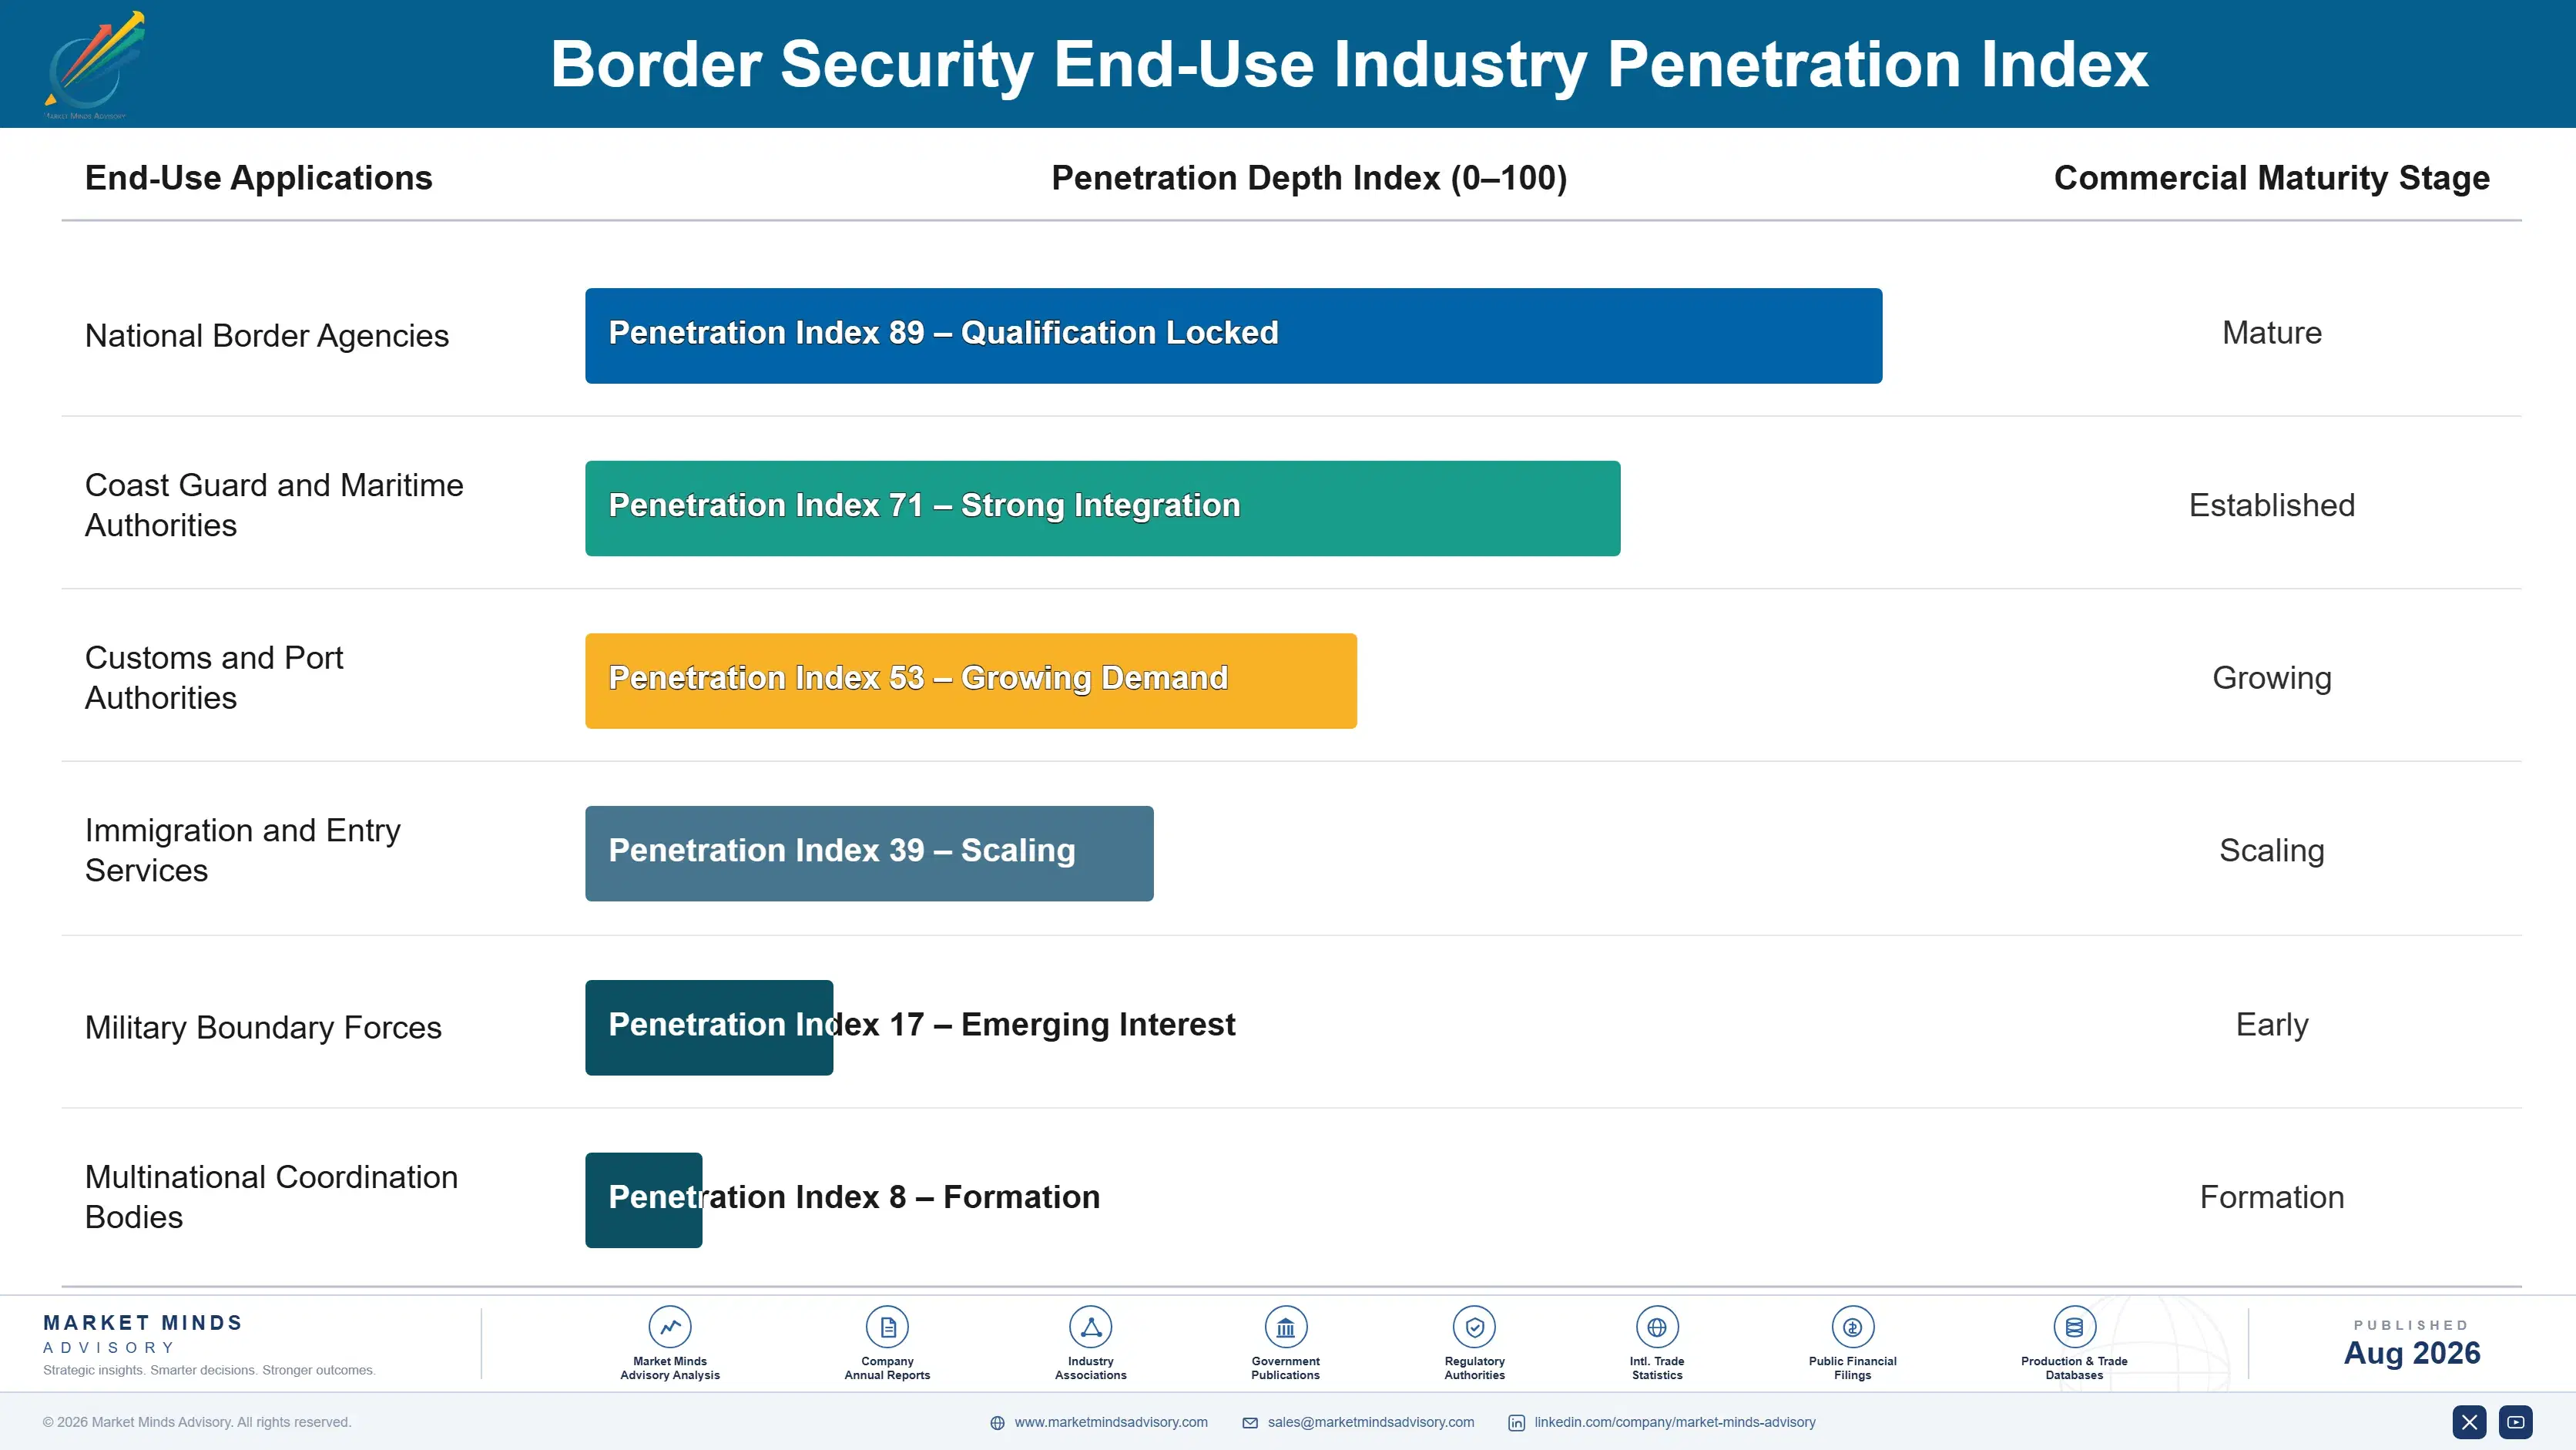
Why Programme Positions Endure

Border programmes produce annuity economics through sustainment rather than through repeat procurement. A supplier holding installed surveillance across a boundary section supports it for a decade or more, and sustainment at 46% of lifetime cost arrives steadily throughout on systems nobody will replace without cause. Displacing an incumbent means reinstalling infrastructure, retraining operators and accepting an unproven alert profile, which no border authority undertakes casually or quickly.
Stickiness varies by category. Fusion and command software positions are close to permanent, since operator familiarity and alert tuning accumulate against a specific boundary section over years. Identity and screening systems are stickier still because accreditation and records obligations sit behind them. Physical works have no stickiness whatever, ending completely when the construction finishes and taking the commercial relationship with them.

The buyer has shifted considerably. Early programmes were specified by capability staff asking what a system could detect. Current procurement involves operations leadership asking what an operator will actually act on, and finance staff asking what sustainment will cost across a decade. Suppliers whose commercial approach was built around detection performance find both questions considerably harder to answer convincingly.
border-security-market-end-use-penetration-index-1788025428069

Where Suppliers Should Commit Now

These are among the four positions where our research anticipates prominent divergence between winners and laggards over the coming forecast period. Each is grounded in the demand model, the regulatory perimeter, and the announced capacity pipeline.
01 / ALERT QUALITY POSITIONING

Detection probability is a question buyers stopped asking

Single-sensor false alarm rates near 83% mean operators abandon alert response long long before coverage across a boundary section is anywhere near complete, and procurement documents now specify alert quality because buyers learned that lesson at considerable expense to themselves. Suppliers still bidding on detection probability alone are answering a question their customers have already moved well past entirely. Fusion capability reducing false alerts by sixty to seventy percent routinely wins competitions that technically superior individual sensors consistently lose to them.
02 / LIFETIME COST CONTRACTING

Winning on acquisition price wins very little

Sustainment reaches roughly 46% of programme lifetime cost and is routinely left to compete against operating priorities year by year, which degrades installed systems and damages the supplier's reputation badly for something entirely outside of its own control. Pricing refresh and performance-based support into the original award removes almost all of that exposure for both of the parties involved. Customers do resist the higher headline figure and generally accept it once shown what the alternative arrangement actually costs them over time.
03 / RESPONSE COORDINATION CAPABILITY

Nobody sells against the sixty-eight minute problem

Alarm resolution near 68 minutes is governed by roads, vehicles and staffing levels rather than by sensors, and no supplier currently offers the coordination layer that would compress it in any meaningful way whatsoever. Dispatch optimisation, unit tracking and resolution analytics all sit immediately adjacent to capability that surveillance suppliers already hold in-house today. The category is currently unfunded rather than actually unwanted, and the first participant to make the commercial case credibly to a buyer gets to define it entirely.
04 / RAPID DEPLOYMENT CAPABILITY

Boundaries change faster than procurement cycles do

Buyers repeatedly need surveillance in place within a few weeks rather than the two full years a conventional acquisition programme normally consumes, and eastern European procurement has demonstrated that demand convincingly since 2022 across several different countries at once. Relocatable towers, containerised command capability and rapidly deployable sensors address that requirement directly and are absent from most supplier catalogues altogether at present. Participants offering only fixed installation are now missing from an increasing share of awards without quite understanding why that is.

Engagement Snapshot From the Field

A live engagement with an industry participant carrying material or product regulatory and market exposure ahead of a defining policy shift, showing how our research translates into a defensible multi-year portfolio strategy.
MARKET MINDS ADVISORY · CLIENT ENGAGEMENT SUMMARY
Border Security Producer Strategic Portfolio Review and Transition Roadmap 2026·Investment Scenario on Border Security Exposure Evaluation 2025-26
CLIENT PROFILE
A border surveillance supplier holding installed sensor positions across two national programmes, competing primarily on detection range and sensor performance with sustainment contracted separately by the customer. Programme revenue was stable while the company had lost three surveillance competitions in eighteen months to participants whose individual sensors it considered technically inferior to its own equipment.
STRATEGIC CHALLENGE
The board needed to establish why superior sensors were losing competitions, and whether investing in fusion and alert management capability justified diverting development from sensor performance improvement. It also had to decide whether to bid sustainment on the next programme, having historically avoided support contracting as low margin work distracting from systems supply.
MMA APPROACH
MMA reconstructed the three lost competitions from procurement records and customer interviews, isolating the evaluated criteria against those the client believed applied. It modelled fusion capability development against competitive position and analysed sustainment margins across comparable programmes. Expert interviews with border authorities, operations staff and competing suppliers established what buyers now evaluate and why.
KEY FINDINGS
  1. All three competitions evaluated false alarm rate and operator workload as scored criteria, and detection range was scored as a threshold requirement rather than as any differentiator.
  2. Operators on the client's installed systems were dismissing roughly four in five alerts without investigation, which the client had never measured or been told about.
  3. Sustainment on comparable programmes carried gross margins above systems supply, and the client had declined that work on an assumption it had never actually tested.
  4. Two winning competitors had built fusion capability first and sourced sensors externally, reversing the sequence the client had followed for over a decade.
CLIENT PROFILE
A border surveillance supplier holding installed sensor positions across two national programmes, competing primarily on detection range and sensor performance with sustainment contracted separately by the customer. Programme revenue was stable while the company had lost three surveillance competitions in eighteen months to participants whose individual sensors it considered technically inferior to its own equipment.
STRATEGIC CHALLENGE
The board needed to establish why superior sensors were losing competitions, and whether investing in fusion and alert management capability justified diverting development from sensor performance improvement. It also had to decide whether to bid sustainment on the next programme, having historically avoided support contracting as low margin work distracting from systems supply.
MMA APPROACH
MMA reconstructed the three lost competitions from procurement records and customer interviews, isolating the evaluated criteria against those the client believed applied. It modelled fusion capability development against competitive position and analysed sustainment margins across comparable programmes. Expert interviews with border authorities, operations staff and competing suppliers established what buyers now evaluate and why.
KEY FINDINGS
  1. All three competitions evaluated false alarm rate and operator workload as scored criteria, and detection range was scored as a threshold requirement rather than as any differentiator.
  2. Operators on the client's installed systems were dismissing roughly four in five alerts without investigation, which the client had never measured or been told about.
  3. Sustainment on comparable programmes carried gross margins above systems supply, and the client had declined that work on an assumption it had never actually tested.
  4. Two winning competitors had built fusion capability first and sourced sensors externally, reversing the sequence the client had followed for over a decade.
RECOMMENDED STRATEGY
Phase 1: Phase one: redirect development from sensor performance toward fusion and alert management, measuring operator dismissal rates on installed systems first. Phase 2: Phase two: bid sustainment alongside systems supply on the next programme, priced on performance rather than on annual support hours. Phase 3: Phase three: qualify externally sourced sensors so architecture rather than hardware becomes the basis on which the company chooses to compete.
OUTCOME
The client reported winning its next surveillance competition on fusion capability and alert quality (client-reported, unverified by MMA). Operator dismissal rates on the installed base fell substantially after tuning. Sustainment was contracted on one programme, and sensor sourcing opened to external suppliers for the first time.

Frequently Asked Questions

Foundational context covering the market sizes, CAGR, scope, country, region and competition that inform every finding below. This section is provided to cover basics and most often pre-purchase conversations, answered from the MMA Primary Research Dataset.

What is the current size of the Border Security Market?

The market is valued at USD 52.0 billion in 2025, measured as revenue from systems and services procured to monitor, control and secure national borders worldwide.

How large will the Border Security Market be by 2036?

MMA forecasts USD 100.78 billion by 2036, up from USD 55.22 billion in 2026. That represents incremental revenue of USD 45.56 billion and an expansion multiple of 1.82 times.

What is the CAGR for the Border Security Market 2026 to 2036?

The base case CAGR is 6.2%, with a bull case of 7.4% and a bear case of 5.0%. Surveillance coverage expansion supplies the largest part of that growth.

Which segment is growing fastest?

Autonomous surveillance towers and sensor fusion grow at 9.3%, half again the market rate of 6.2%, because coverage per dollar overwhelmingly favours towers over physical barrier construction.

Who are the major companies in the Border Security Market?

Leidos, Elbit Systems, Anduril Industries, Thales and IDEMIA lead on border programme revenue, holding around 34% between them across a market that remains genuinely fragmented.

Which country is growing fastest?

India grows fastest at 8.2%, driven by land boundary programmes covering extremely long frontiers where terrain makes physical infrastructure impractical and surveillance the only workable answer.

Report Segmentation Architecture

The full report scope spans multiple orthogonal segmentation dimensions, with cross-tabulated demand data provided for each dimension pair. Coverage extends further to regional breakdowns, trend trajectories, and the competitive detail needed to support segment-level decision-making.

By System Category

  • Physical Barrier and Infrastructure Works
  • Autonomous Surveillance Towers and Sensor Fusion
  • Uncrewed Aerial and Maritime Patrol Systems
  • Border Identity and Screening Systems
  • Command, Control and Coordination Software
  • Integration and Sustainment Services

By End-Use Industry

  • National Border Agencies
  • Coast Guard and Maritime Authorities
  • Customs and Port Authorities
  • Immigration and Entry Services
  • Military Boundary Forces
  • Multinational Coordination Bodies

By Commercial Dimension

  • Prime Programme Contracting
  • Subsystem Supply To Integrators
  • Performance Based Sustainment
  • Rapid Deployment Procurement
  • Foreign Assistance Funded Supply
  • Software Licensing and Support

By Region

  • North America
  • Western Europe
  • East Asia
  • South Asia and Pacific
  • Latin America
  • Middle East and Africa
  • Eastern Europe

Scope, Methodology, and Coverage

Every figure in this report is reproducible from documented input assumptions. The scope below maps the historical period, the forecast horizon, the segmentation dimensions, and the countries covered, alongside the underlying primary and qualitative methodology.
Historical Period
2020 to 2025
Forecast Period
2026 to 2036
Base Year
2025 (USD billions; MMA Primary Research Dataset, August 2026)
Market Definition
Revenue from systems and services procured to monitor, control and secure national borders and ports of entry, spanning physical barrier and infrastructure works, autonomous surveillance towers and sensor fusion, uncrewed aerial and maritime patrol systems, border identity and screening systems, command, control and coordination software, and integration and sustainment services. Prime programme contracting, subsystem supply, performance-based sustainment, rapid deployment procurement, foreign assistance funded supply and software licensing are all included. Customs revenue collection systems, immigration case management, defence operations conducted beyond a national border, and general policing equipment not procured for border function are excluded.
Quantitative Units
USD billions, border security programme revenue
Segmentation Dimensions
System category, procuring authority, commercial contracting model, region
Regions Covered
North America, Western Europe, East Asia, South Asia and Pacific, Latin America, Middle East and Africa, Eastern Europe
Countries Covered
United States, Mexico, United Kingdom, Germany, Spain, Poland, Finland, Israel, Saudi Arabia, China, Japan, India, Australia, Brazil
Key Companies Profiled
Leidos, Elbit Systems, Anduril Industries, Thales, IDEMIA, General Dynamics Mission Systems, Smiths Detection, Saab, Hensoldt, Bharat Electronics
Quantitative Methodology
Primary survey, n=3,800 respondents, Q4 2025, six countries; demand-side model with trade association cross-validation
Qualitative Methodology
47 expert interviews, Q4 2025; applied to validate demand model assumptions, identify emerging dynamics, and assess competitive positioning
Report Format
PDF and XLSX data workbook (Word format preview document)
Publisher
Market Minds Advisory
Report Code
MMA-2026-TEC-471
Published
August 2026
Contact
sales@marketmindsadvisory.com | www.marketmindsadvisory.com

Purchase the full Border Security Market Report (2026 to 2036).

The full report addresses the gap every border programme runs into and almost none of them budget for, which is response capacity against detection coverage. It quantifies coverage cost per dollar between barriers and towers, examines how alert quality replaced detection probability in procurement evaluation, and separates sustainment from acquisition across programme lifetime cost. Segment analysis covers all six system categories, with particular attention to surveillance and fusion where cost arithmetic rather than technology explains the growth. Competitive assessment ranks twenty participants on border security programme revenue.
Six system category segmentation with growth rates
Coverage cost per dollar compared across approaches
Twenty participant assessment on programme revenue
Alert quality requirements traced across recent procurements
Sustainment separated from acquisition in lifetime cost
Response capacity gap quantified against detection coverage

Built For The People Who Decide

From boardroom strategy to bench-side execution, this report is read cover-to-cover by leaders shaping the next decade of their industry, turning demand scenarios, market dynamics and valuation benchmarks into decisions.
CXOs/ Presidents/ VPs/ Managers
M&A and Corporate Development
Strategy Teams and R&D Heads
Procurement and Product Directors
Regulatory and Compliance Leaders
Investor Relations and Equity Analysts