Market Minds Advisory
Booster Relay Market

Booster Relay Market: Booster Relay Market: Four Hundred Dollars Deciding Forty Thousand

Nobody orders one of these until a valve strokes too slowly to hold a loop or pass a safety test. It is four hundred dollars deciding whether forty thousand dollars works.

Lead Analyst

Published

September 2026

Make Smarter Decisions with Customized Research Insights

Request a free sample report and evaluate market opportunities, growth trends, and competitive dynamics relevant to your business needs.

2025 MARKET VALUE$0.8BMarket Size 2025
2036 FORECAST VALUE$1.5BBase Case , 2026 to 2036
CAGR 2026 TO 20365.8 %Bull 7.0% / Bear 4.6%
INCREMENTAL OPPORTUNITY$0.6BNet 10- year value creation
EXPANSION MULTIPLE1.75x2036 value over 2026 base
Strategic Levers
M&A Pipeline
Regional Outlook
Country Rankings
Competitive Intelligence
Segmental Deep-dive
Call-Us : 91 93563 13602

Executive Snapshot and Market Trajectory.

A booster relay costs around USD 410 and sits on a control valve assembly worth a hundred times that, which is why 71% of them are specified by the valve builder rather than by the plant. The route to market here is a bill of materials.
Digitally monitored smart boosters grow at 8.7%, half again the market rate of 5.8%, because safety instrumented systems now require verifiable stroking times rather than merely fast ones, and a booster with position feedback turns a partial stroke test into a recorded result. East Asia holds 28% of demand on process plant construction volume, with the Middle East well above its usual band at 12% on continuing petrochemical and gas spending programmes alone.
Concentration is high at 52% of units shipped, because the valve makers who specify these devices largely make them as well and have little reason to design in a competitor's part. Methane regulation cuts both ways here: rules restricting natural-gas-driven pneumatics remove some devices entirely and force others to be replaced with instrument-air designs, and which effect dominates varies by application. Nobody in this sector has modelled that properly.
Market Definition
The booster relay market covers pneumatic devices that amplify the flow capacity of a control signal to actuate valves faster than a positioner alone can achieve, spanning volume boosters, pressure amplifying relays, quick exhaust and dump relays, reversing and ratio relays, high-flow boosters for large actuators, and digitally monitored smart boosters. Scope covers units shipped into control valve and actuator assemblies and into replacement on installed equipment. Excluded are valve positioners, current to pressure converters, solenoid valves, pneumatic actuators themselves, air preparation equipment, and electric actuator controls.
Base Year Value
$0.8B in 2025 (MMA Primary Research Dataset, September 2026)
Forecast Period
2026 to 2036, eleven discrete annual values
CAGR
5.8% base case. Bull 7.0%. Bear 4.6%.
Fastest Growth Segment
Digitally Monitored Smart Boosters: 8.7% CAGR
Fastest Growth Country
India: 7.8% CAGR
Fastest Growth Region
South Asia and Pacific: 7.8% CAGR
Largest Region
East Asia: 28% of 2025 global value
Market Leaders
Emerson, Flowserve, Baker Hughes, Rotork and SMC Corporation. Source: MMA Analysis, July 2026.
Primary Survey
n=3,800 procurement and R&D decision-makers, Q4 2025, six countries
Methodology
Demand-side build-up, cross-validated against public data, 47 expert interviews

Booster Relay Market Forecast Scenarios

booster-relay-market-size-forecast-scenario-1788234633571
Between 2020 and 2025 the sector compounded at 4.8% and process plant capital spending explained nearly all of it. The 2020 shutdown deferred turnarounds and projects together, and the recovery brought both back alongside deferred replacement on installed assemblies. Nothing about the product changed across the period. The order book simply followed somebody else's construction schedule with a short lag.
The 5.8% base case rests on three mechanisms. Safety instrumented system requirements now demand verifiable stroking times on emergency shutdown valves, which specifies a booster rather than merely permitting one. Petrochemical and gas construction across Asia and the Middle East continues at volume Western capital spending has not matched for years. And an enormous installed base replaces on a nine year cycle regardless of new construction. None of the three needs a Western capital cycle to recover.
The bull case at 7.0% turns on partial stroke testing becoming standard practice across process industries rather than concentrated in the highest safety integrity applications, which would specify diagnostic boosters far more widely. The bear case at 4.6% is electrification of actuation: every large valve converted from pneumatic to electric operation removes the booster along with the air supply feeding it.

Specified By Somebody Else

This device exists because a positioner cannot move enough air. A large actuator holds a volume a positioner would take too long to fill, so the valve strokes slowly, the loop oscillates or a safety function misses its response time. A booster between them supplies the flow, bringing full travel to around 1.8 seconds. Nobody specifies one until that problem has already appeared.
TOP FIVE CONCENTRATION52%Share of units shipped held by five largest suppliers
AVERAGE SELLING PRICEUSD 410Mean price per unit across all booster relay types
STROKING TIME ACHIEVED1.8 secondsTime to move a large actuator through full travel
ASSEMBLY COST SHARE1%Portion of a complete control valve assembly cost
VALVE MAKER SPECIFIED71%Portion selected by the valve builder rather than the plant
INSTALLED BASE REPLACEMENT9 yearsMedian service interval before a unit is replaced entirely
The commercial position follows from where the decision is made. Some 71% of units are selected by the valve builder assembling the complete package rather than by the plant that will operate it, and the booster is around 1% of that assembly's cost. A component at that price is not something an engineering contractor argues about. Being on the bill of materials is the entire commercial contest.
Safety requirements have changed what the device is for. Emergency shutdown valves under safety instrumented system standards must demonstrate stroking within a specified time, and partial stroke testing must produce a recorded, auditable result rather than an engineer's judgement. A booster with position and pressure feedback delivers it. That converts a tuning accessory into a certified element of a safety function, which is a better place to sell from.
"The plant engineers who live with these devices almost never choose them, and the valve builders who choose them almost never operate them. Anybody who works out how to reach both at once will take share from people who have held it for thirty years."
Director, Process Control Equipment Practice · MMA Construction and Industrial Equipment Practice · September 2026

Market Trends

Safety standards converted boosters into certified elements

Emergency shutdown valves operating within safety instrumented systems must demonstrate stroking within a defined time, and partial stroke testing has to produce an auditable record rather than an engineer's assessment on the day. A booster fitted with position and pressure feedback supplies exactly that evidence and becomes part of the certified safety function rather than an accessory bolted alongside it. Digitally monitored boosters grow at 8.7% against a market rate of 5.8% on that basis. Selling a safety element is a fundamentally different conversation from selling a pneumatic component. Very few suppliers have made that shift.
Market Impact: Grows at 7.2% on plant scale
Methane rules pull demand in two directions at once

Rules restricting natural-gas-driven pneumatic devices across oil and gas operations force operators to convert to instrument air supply, which retains the booster and changes only what feeds it, or to electric actuation, which removes the device and the air system together. Which path an operator takes depends on site power availability, valve size and how many devices are involved. The net effect on demand is genuinely ambiguous and it varies enormously by application. Nobody in this sector has modelled it properly, and several participants assume the outcome that suits them.
Market Impact: Replaces every 9 years

Market Opportunities and Growth Drivers

Large valve assemblies keep getting larger

Process plants built for scale use larger pipe, which requires larger valves, which requires larger actuators holding volumes a positioner alone cannot fill at acceptable speed. Every increase in plant capacity therefore increases the proportion of valve assemblies that need a booster to stroke properly. Asian and Middle Eastern petrochemical and gas facilities are built at scales that make this routine rather than exceptional. High-flow boosters for large actuators grow at 7.2% against a market rate of 5.8% purely on that arithmetic, which owes nothing to any product development. Scale alone specifies the device.
Market Impact: Removes 100% of the content

An enormous installed base replaces on a fixed cycle

Control valve assemblies operating across refineries, chemical plants, power stations and gas facilities worldwide carry boosters that reach the end of useful service at around nine years, through diaphragm wear, contamination and seat degradation that no maintenance practice prevents indefinitely. That replacement happens regardless of whether anybody builds a new plant, which gives this category a demand floor that capital-spending-driven equipment does not have. Turnaround schedules concentrate it into predictable windows that a supplier with the right distribution can serve very profitably indeed. It is the most reliable demand line in the whole category, and the least contested by anybody.
Market Impact: Blocks access to 71% of decisions

Market Restraints and Challenges

Electric actuation removes the device entirely

A valve converted from pneumatic to electric actuation needs no booster, no air supply and no positioner feeding either, so every conversion removes content permanently rather than reducing it. The root cause is substitution of the actuation method rather than any failure of the product, which means no design improvement defends against it. Commercial impact is a shrinking pneumatic base in exactly the applications where emissions rules are strictest. Participants are responding by concentrating on large valve sizes where electric actuation remains expensive, on safety applications, and on regions where site power is genuinely limited.
Market Impact: Verifies 1.8 second stroking times

The specifier is frequently also the competitor

Around 71% of units are selected by the valve builder assembling the package, and the largest valve builders manufacture boosters themselves, which means an independent supplier is asking a competitor to design in a rival part on a component worth 1% of the assembly. The root cause is vertical integration in valve manufacturing rather than any performance question. Commercial impact is that technical superiority frequently loses to ownership. Mitigation runs through end user specification influence, aftermarket replacement channels, distribution to maintenance organisations and supply to the valve builders who do not manufacture boosters.
Market Impact: Splits demand across 2 conversion paths
3 additional market trends, 4 additional growth drivers, and 2 additional restraints and challenges are covered in the full report. Contact sales@marketmindsadvisory.com to access the complete intelligence.

Segment CAGR and Growth Architecture

Segmentation follows device function, the dimension on which flow capacity, application and diagnostic content all move together. Volume boosters and pressure relays carry the installed base at commodity prices across every process industry. High-flow and digitally monitored units carry the growth, because plant scale and safety certification requirements are both rising together. Both trends run in the same direction.
booster-relay-market-market-share-analysis-1788234634113

Digitally Monitored Smart Boosters

Digitally monitored smart boosters grow at 8.7%, half again the market rate of 5.8%, and a safety standard rather than any customer preference created the segment. Emergency shutdown valves must demonstrate stroking within a defined time and partial stroke testing must produce an auditable record, which a booster carrying position and pressure sensing supplies directly while a conventional unit cannot. That moves the device inside the certified safety function instead of alongside it, and it changes who signs the purchase order from a maintenance supervisor to a functional safety engineer. Unit prices run several times a conventional booster on a manufacturing cost difference considerably smaller than that, which is what makes the segment worth pursuing.
CAGR 8.7%

High-Flow Boosters for Large Actuators

High-flow boosters for large actuators at 7.2% grow on plant arithmetic rather than on anything technical. Larger process facilities use larger pipe, larger valves and larger actuators holding air volumes that a positioner cannot fill at any acceptable speed, so the proportion of assemblies requiring a booster rises with every increase in plant capacity. Asian and Middle Eastern petrochemical, refining and gas construction is built at exactly those scales, which is where this demand concentrates. These units also sit in the valve sizes where electric actuation remains expensive and awkward, which makes the segment considerably better protected against substitution than the smaller devices are. Electric conversion arrives here last of all, which is worth more than any product advantage.
CAGR 7.2%
Full segment breakdown across 6 segments available in the complete report.

Regional Architecture and Country Demand Map

East Asia takes 28% on process plant construction volume, and Middle East and Africa sits well above its usual band at 12% on continuing petrochemical and gas capital spending. India grows fastest. Construction pipelines rather than installed bases decide every one of the growth lines here.

East Asia

Construction volume rather than any technical preference produces the largest regional position, and it has done so for two decades. Chinese, Korean and Japanese petrochemical, refining and gas receiving facilities are built at scales that make large actuators and therefore boosters routine on a high proportion of valve assemblies. Korean engineering contractors execute projects across the Middle East and Southeast Asia while specifying from here, which extends the region's influence well beyond its own construction. Chinese valve and instrument manufacturing supplies most of the domestic requirement at prices imported units cannot match. Growth at 6.6% tracks a construction pipeline that remains fuller than anywhere else in the world. Nothing in the West matches that pipeline.
Share: 28% | CAGR: 6.6% (2026 to 2036)

North America

Replacement rather than construction drives this region, and the installed base is the largest anywhere. Decades of refining, chemical and gas processing capacity carry boosters reaching end of service on roughly nine year cycles, concentrated into turnaround windows that reward suppliers with genuine distribution reach. New construction is dominated by gas processing and liquefaction on the Gulf Coast. Methane rules restricting natural-gas-driven pneumatic devices apply most directly here, pushing operators toward instrument air on some sites and electric actuation on others. The net effect on demand differs site by site and nobody has measured it convincingly at any scale. Replacement demand here is steadier than any construction forecast, and it does not depend on a capital cycle turning at all.
Share: 24% | CAGR: 5.4% (2026 to 2036)
Regional intelligence for 5 additional markets available in the complete report: Western Europe, South Asia and Pacific, Latin America, Middle East and Africa, Eastern Europe. Contact sales@marketmindsadvisory.com.
booster-relay-market-country-cagr-analysis-1788234634643

Four Moves Around The Specifier

None of these four is about a better booster, because the pneumatics have been well understood for fifty years and every serious supplier can hit the flow numbers. Each works on the actual problem, which is that the person choosing the device is frequently a competitor and never the operator. Three are access problems rather than engineering ones.

Reach the end user who writes the specification

Some 71% of units are chosen by the valve builder, and a substantial share of those builders manufacture boosters themselves, so competing there means asking a competitor to design in a rival part worth 1% of the assembly. The route around it is the operating company engineering standard, which specifies acceptable devices before any valve package is tendered. Getting onto that standard costs technical engagement with people who never place an order. Suppliers who did it find valve builders quoting their product without being persuaded at all. That is the cheapest route in.
Market Impact: Bypasses the 71% that currently holds specification control

Sell the safety function, not the flow rate

Emergency shutdown valves must demonstrate stroking within a defined time and partial stroke testing must produce an auditable record, which a booster with position and pressure feedback delivers and a conventional one cannot. That places the device inside a certified safety function and moves the purchase decision from a maintenance supervisor to a functional safety engineer with a completely different budget. Digitally monitored units grow at 8.7% against a market rate of 5.8% because of it. Very few suppliers have restructured their technical documentation around functional safety at all. The paperwork is the product now.
Market Impact: Reaches a segment now growing at 8.7% annually

Own the turnaround replacement window entirely

An installed base replacing on roughly 9 year cycles produces demand that arrives in concentrated turnaround windows planned years in advance and published to contractors. A supplier holding regional stock, cross-reference data against competitors' part numbers and a maintenance contractor relationship captures replacement business that never reaches a valve builder at all. It requires distribution and inventory rather than engineering. Most suppliers in this category are organised entirely around original equipment and treat the aftermarket as whatever happens to arrive. Cross-reference data and stock are the whole capability required, and neither is expensive to build. Nobody is doing it.
Market Impact: Serves a 9 year replacement cycle properly here

Follow the instrument air conversions deliberately

Methane rules restricting natural-gas-driven pneumatic devices force operators to convert to instrument air or to electric actuation, and 1 of those 2 paths retains every booster while changing only the supply feeding it. Those conversion programmes are planned, funded and site by site, which makes them identifiable well in advance for anybody tracking regulatory compliance filings. A supplier arriving with conversion-ready devices and retrofit guidance is selling into a scheduled programme rather than a maintenance decision. Almost nobody is watching those filings at all. The filings are public and free to read.
Market Impact: Targets 1 of the 2 available conversion paths

Who Controls the Margin Pool

CR5 stands at 52% of units shipped into control valve and actuator assemblies, which is the only comparable basis since booster revenue disappears inside far larger valve and automation reporting. Concentration is high because the largest valve builders manufacture boosters themselves and specify their own parts into their own assemblies, which forecloses much of the market before any competition happens. That is a difficult position to attack on merit.
Competition runs on specification access, distribution reach and functional safety credentials. Specification access decides whether a supplier is considered at all, since the valve builder usually chooses. Distribution decides who captures replacement demand in turnaround windows. Safety certification decides who can serve the growing shutdown valve application. Pneumatic performance differentiates almost nothing between established suppliers. Ownership beats performance more often than anybody admits.

Rankings will move on functional safety credentials and on whichever suppliers position for instrument air conversions rather than against them. Both are commercial and documentary positions rather than engineering ones. The pressure comes from a standard and a regulation rather than from any competitor's product, which is unfamiliar territory for organisations built around pneumatic engineering. Nobody here was hired to read regulatory filings or safety standards.
booster-relay-market-company-positioning-matrix-1788234635161

Competitive Moat and Risk Dimensions

EMERSON

Moat: Valve integration and installed base

Manufacturing control valves, positioners and boosters together means the group specifies its own components into its own assemblies without any competitive process taking place at all, across an installed base built over decades. That vertical position forecloses the decision rather than winning it. An independent supplier competes for whatever is left after integrated builders have specified themselves.
EMERSON

Risk: Electric actuation erodes the base

Conversion of large valves from pneumatic to electric actuation removes boosters, positioners and air systems together, and the group's strongest positions sit in exactly the process industries facing the most emissions pressure. Scale in pneumatics offers no protection against a change in actuation method. Building an equivalent position in electric actuation means competing against specialists who started far earlier.
SMC CORPORATION

Moat: Pneumatic manufacturing scale worldwide

Enormous manufacturing volume across the whole pneumatic component range gives the company a cost position on boosters that a specialist producing only these devices cannot approach, together with distribution reaching maintenance organisations everywhere. Scale in adjacent pneumatics subsidises competitiveness in this one. Very few competitors have that breadth behind a device this specialised.
SMC CORPORATION

Risk: Limited process safety positioning

Strength in general industrial pneumatics translates imperfectly into process safety applications, where functional safety certification, documentation and engineering credibility matter more than component cost or availability. The fastest growing segment sits entirely in that territory. Building safety credentials requires certification work and reference installations rather than any manufacturing advantage.

Players Tracked

Prominent Players

Emerson
Flowserve
Baker Hughes
Rotork
SMC Corporation

Other Key Players

Samson
IMI
Festo
Parker Hannifin
Bray International
Valmet
Bifold Group
ControlAir
Fairchild Industrial Products
Marsh Bellofram
Norgren
Azbil Corporation
Yokogawa Electric
Nihon Koso
Kinetrol

Recent Developments

FEBRUARY 2025

Operators expanded partial stroke testing beyond highest integrity loops

Several process operators extended partial stroke testing practice from their highest safety integrity emergency shutdown valves to a considerably wider population of shutdown applications. Demand for boosters carrying position and pressure feedback rose across those sites, since conventional units cannot produce the auditable record the practice requires.
Signal: A testing practice spreading beyond its original scope has specified a device nobody had previously needed.
JUNE 2025

Methane rules drove instrument air conversion programmes

Compliance programmes replacing natural-gas-driven pneumatic devices reached scheduled conversion across a substantial number of oil and gas facilities, with operators choosing instrument air supply at some sites and electric actuation at others. Booster demand was retained on the first path entirely and eliminated on the second.
Signal: The same regulation is creating and destroying demand at neighbouring sites, and nobody is actually counting.
OCTOBER 2025

Middle Eastern gas project specified boosters across large actuators

A large Middle Eastern gas processing project specified high-flow boosters across a substantial population of large actuator valve assemblies, reflecting the actuator volumes that facilities built at that scale require. Korean engineering contractors executing the work carried specification preferences developed on several earlier regional projects.
Signal: Plant scale rather than any product development decides how much of this equipment a project buys.

Aluminium, Elastomers And Machining

Machined aluminium and stainless bodies account for roughly 36% of unit cost, elastomeric diaphragms and seals around 19%, and assembly with testing a further 21%. Electronics for diagnostic variants add materially where fitted. The bodies are machined from bar or castings in modest volumes, which keeps machining cost high per unit and leaves little room for the process improvements that high volume components enjoy.
Aluminium and stainless pricing through 2021 and 2022 moved sharply on energy costs and trade measures unconnected to process instrumentation, and US Geological Survey mineral commodity reporting recorded the movement. Suppliers holding annual metal contracts and machining agreements protected their pricing through it. Those buying machined components on spot from job shops absorbed increases that arrived on top of extended lead times, and several missed delivery commitments into project schedules.

The disadvantage falls on production volume rather than on purchasing skill. A supplier making tens of thousands of units annually machines bodies on dedicated cells at costs a supplier making thousands cannot approach, on an identical design. Elastomer compounding shows the same pattern. That volume difference explains most of the cost variation visible across this category, and no purchasing improvement closes a gap created by scale.
booster-relay-market-cost-volatility-analysis-1788234635357

Contract metal and machining on annual terms

Machined bodies are 36% of unit cost and both aluminium and stainless reprice on energy and trade measures with no connection to process instrumentation demand. Annual agreements covering metal and machining capacity cost a premium against spot and remove the largest uncontrolled line. Suppliers buying machined parts on spot missed delivery commitments last cycle and lost project business.

Standardise bodies across the product range

Machining cost per unit falls sharply with batch size, and most suppliers carry more distinct body designs across their range than the applications genuinely require them to. Consolidating onto fewer common bodies with variant internals raises batch sizes without reducing what the range can do. It costs some engineering work once and returns on every unit machined thereafter.

Qualify a second elastomer compound supply

Diaphragms and seals are 19% of cost and their compound qualification is application specific, which leaves most suppliers with a single approved source per compound and no alternative when supply tightens. Qualifying a second source costs testing time rather than capital and must be done before it is needed. Suppliers discovering this during a shortage have no useful options.

Portfolio Architecture for Margin Defence

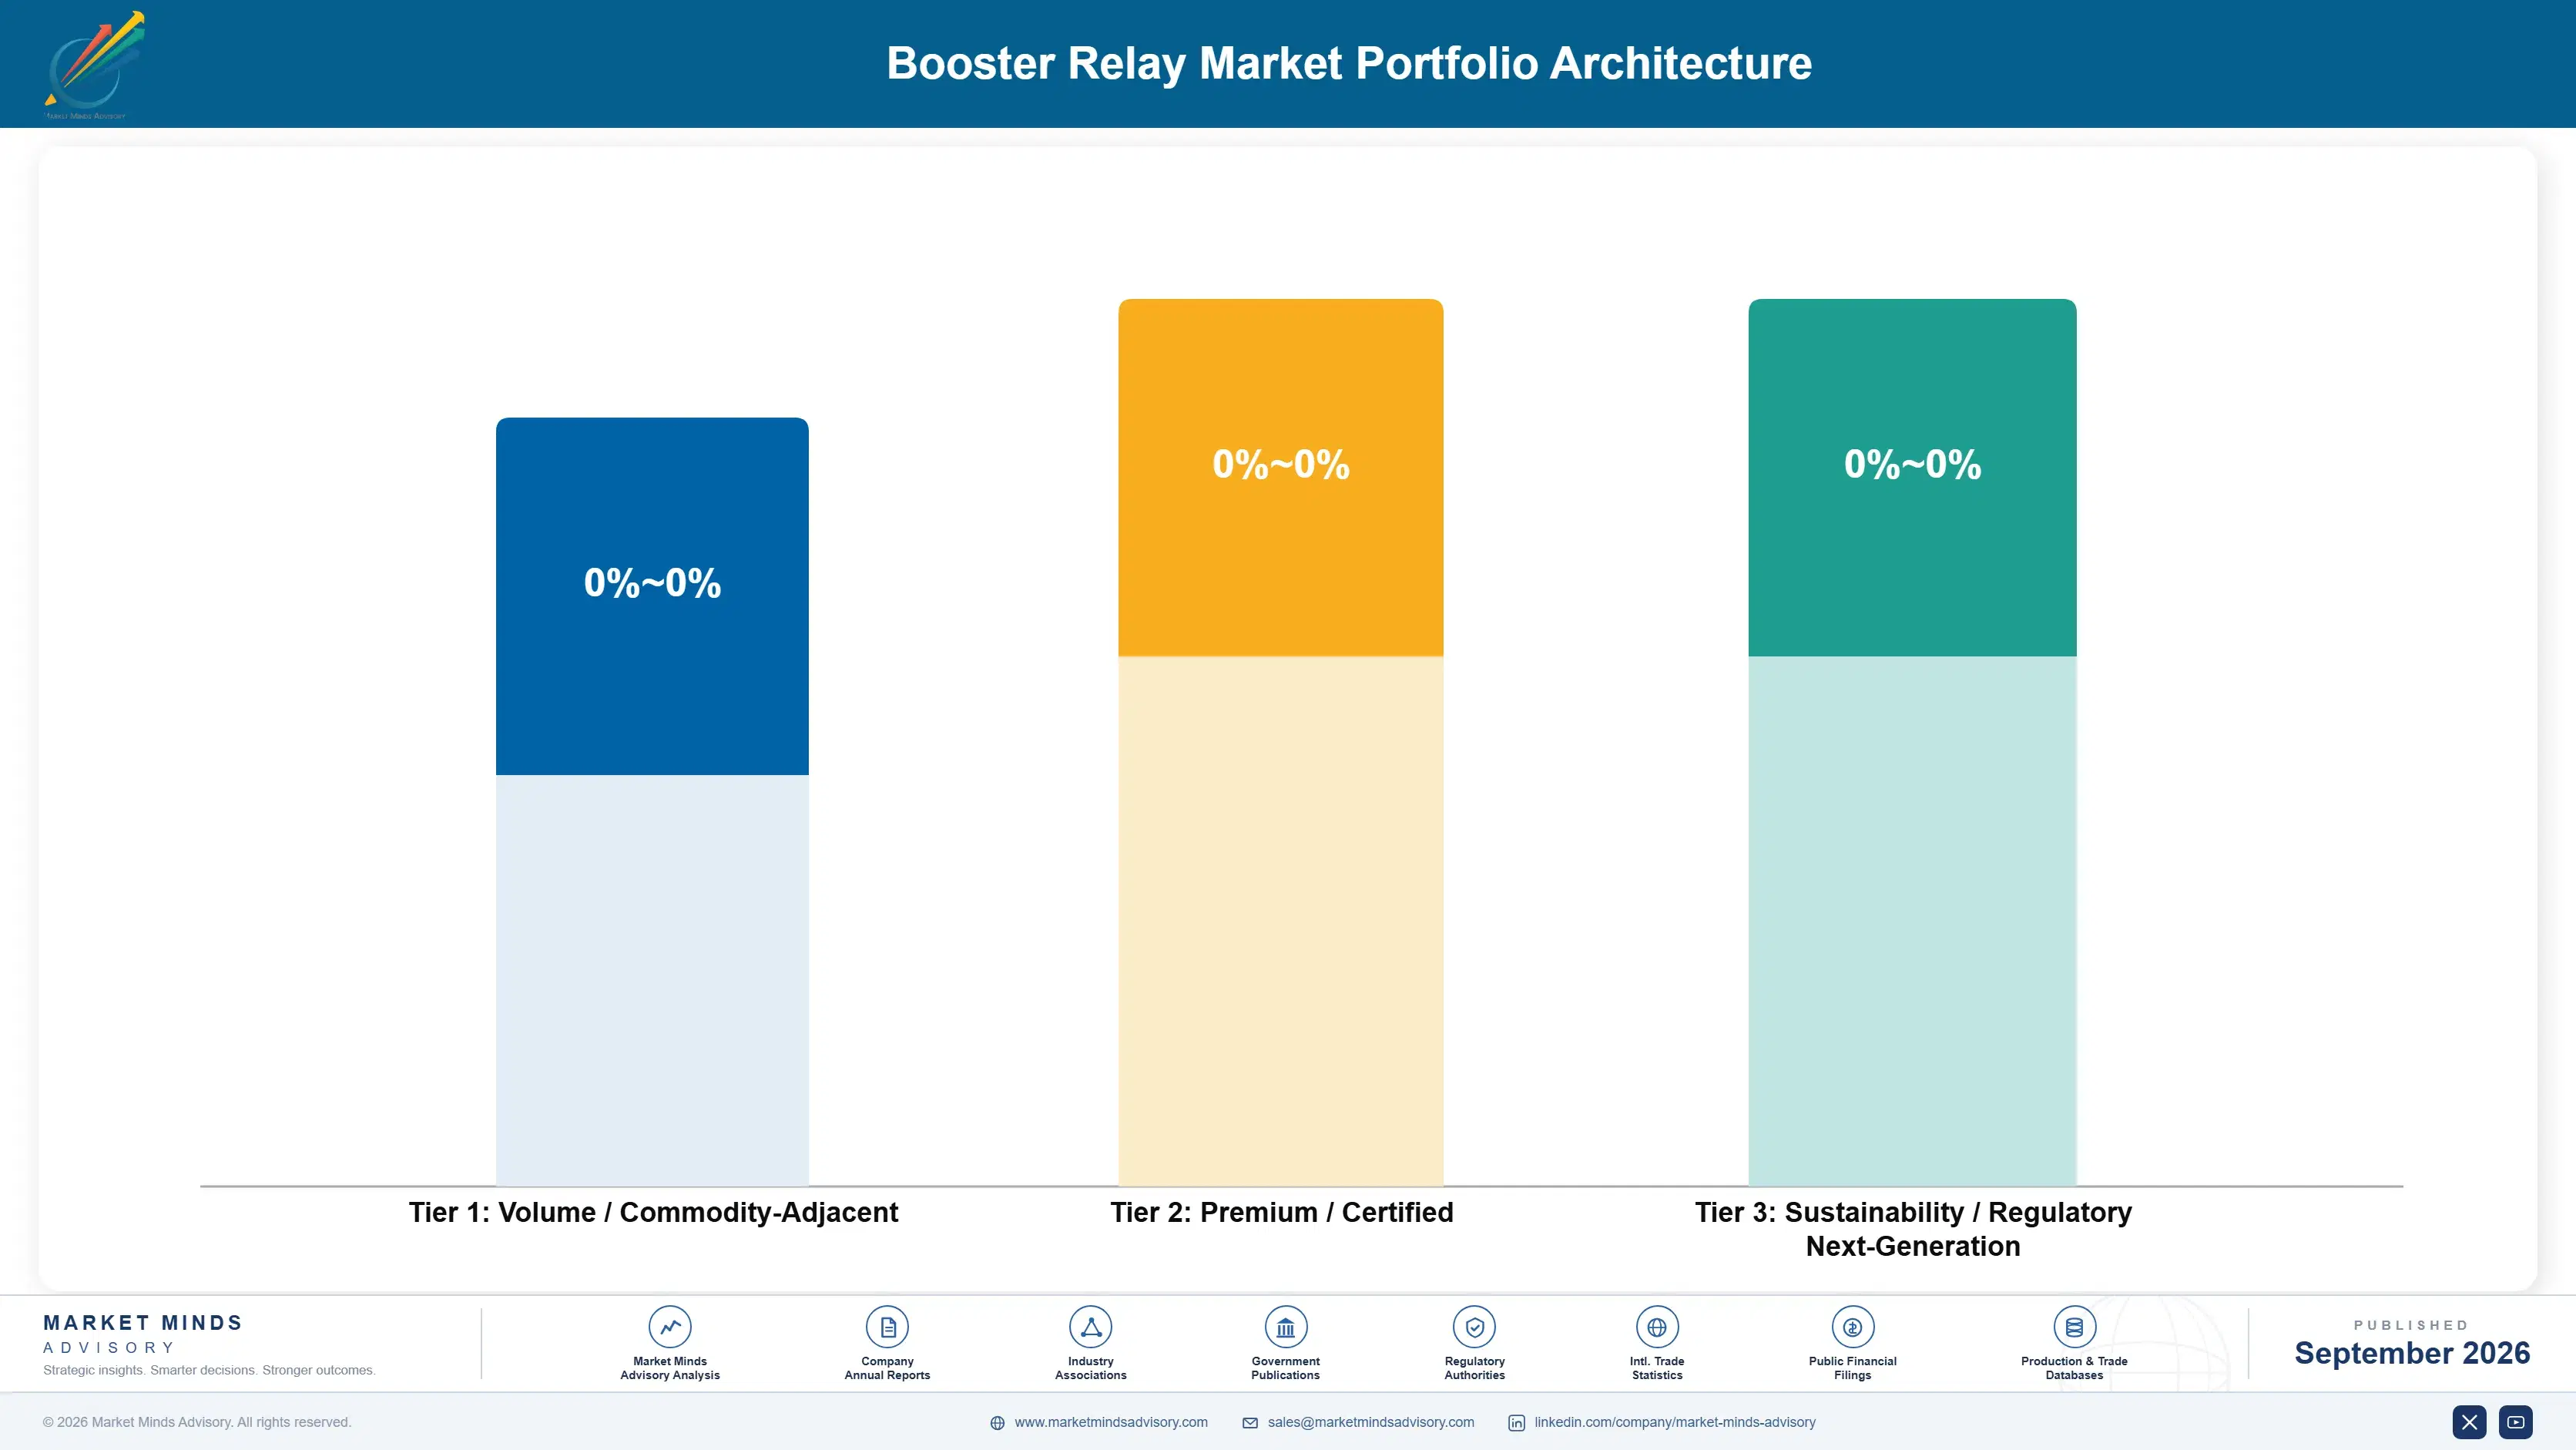
Margin here follows application rather than device complexity, which is not how the catalogues are arranged. A volume booster sold into a general process valve assembly competes against equivalent parts on price at 1% of the assembly cost. The same underlying pneumatics with position feedback, safety certification and documentation, sold into an emergency shutdown application, earns several times as much on a manufacturing cost difference far smaller than the price gap.
Volume and premium pull against each other through distribution rather than the factory. Standard boosters carry the volume that justifies stocking depth at distributors and keeps a supplier present in maintenance catalogues, and that presence is what gets the safety-rated products considered when a shutdown valve is specified. Abandoning the standard range saves margin and removes the shelf position that the premium range depends on.

High-value pools sit in safety-certified diagnostic units, in aftermarket replacement and in conversion retrofit kits nobody has packaged. The third is genuinely unclaimed: operators converting from natural-gas-driven to instrument air supply need guidance, fittings and compatible devices as a package, and they are working to compliance deadlines that make a complete answer worth considerably more than a component.

Volume / Commodity-Adjacent

Standard volume boosters and pressure relays supplied into general process valve assemblies against equivalent competing devices on price. Differentiation is minimal at this end of the range. The 8 point spread reflects production volume and machining batch size rather than design.
Gross Margin: 22 to 30%

Premium / Certified

High-flow boosters for large actuators and units supplied against demanding stroking specifications on critical service. Flow capacity and application engineering support the price. The 8 point spread reflects whether the supplier holds the valve builder relationship or sells through distribution.
Gross Margin: 36 to 44%

Sustainability / Regulatory / Next-Generation

Safety certified diagnostic boosters, instrument air conversion retrofit packages and functional safety documentation services. Margins are high because certification and documentation are both genuinely scarce. The 20 point spread separates certified hardware from retrofit packaging and engineering support work.
Gross Margin: 46 to 66%
booster-relay-market-portfolio-architecture-1788234635851

High-value Sub-segments and Strategic Watch-out

Digitally Monitored Smart Boosters

High value and high growth at 8.7%. Safety standards requiring auditable partial stroke records specify this device rather than merely permitting it, which changes who signs the order. The 8 point spread reflects whether the supplier holds functional safety certification for the complete assembly it ships.
Gross Margin: 50 to 58%

High-Flow Boosters for Large Actuators

High value with strong growth at 7.2%. Plant scale drives it directly, and these valve sizes are where electric actuation remains expensive enough to protect the pneumatic position. The 8 point spread reflects whether the unit is supplied to a valve builder or sold into replacement.
Gross Margin: 38 to 46%

Volume Boosters

The volume core. It earns modestly and it holds the distributor shelf position and catalogue presence that gets the certified products considered later. The 8 point spread reflects machining batch size, which decides these economics considerably more than any design difference between competing suppliers. Batch size decides.
Gross Margin: 20 to 28%

Reversing and Ratio Relays

The strategic watch-out. These functions are increasingly performed in the positioner or the control system rather than by a separate pneumatic device at all. The 22 point spread separates legacy replacement work on installed plant from the new specification that is steadily disappearing everywhere. The function is migrating.
Gross Margin: 14 to 36%

Turnarounds And Bills Of Materials

The annuity here is a replacement cycle rather than a customer relationship, and it is unusually predictable. An installed base reaching end of service at around nine years produces demand that arrives in turnaround windows planned years ahead and published to contractors, which means a supplier with stock and cross-reference data can forecast it precisely. Nothing about that demand depends on winning a new project or persuading anybody of anything.
Stickiness varies enormously by who chose the device. A booster specified onto a valve builder's bill of materials stays there across every assembly that builder ships until somebody changes the standard, which is rare. A booster fitted during a turnaround is replaced by whatever the contractor can obtain quickly next time. The first position is worth many times the second and is far harder to obtain.

Buyer profiles have shifted from maintenance supervisors toward functional safety engineers on the applications that are growing, and most suppliers have not restructured their documentation for it. A maintenance supervisor asked about flow capacity and a cross-reference part number. A safety engineer asks about certification, proof test intervals and failure mode data. The second requires paperwork most participants have never produced.
booster-relay-market-end-use-penetration-index-1788234636336

How To Get Specified Here

These are among the four positions where our research anticipates prominent divergence between winners and laggards over the coming forecast period. Each is grounded in the demand model, the regulatory perimeter, and the announced capacity pipeline.
01 / END USER STANDARD ACCESS

Get onto the standard before the package is tendered

Some 71% of units are chosen by the valve builder assembling the package, and a substantial share of those builders manufacture boosters themselves, which means competing there is asking a direct competitor to design in a rival part worth 1% of the assembly. The way around it is the operating company's own engineering standard, which lists acceptable devices before any valve package goes out to tender at all. Getting onto that standard costs technical engagement with people who will never place a single order.
02 / FUNCTIONAL SAFETY POSITIONING

Sell certification, not flow capacity

Emergency shutdown valves must now demonstrate stroking within a defined time, and partial stroke testing has to produce an auditable record rather than an engineer's judgement, which a booster carrying position and pressure feedback delivers and a conventional unit simply cannot. That places the device inside a certified safety function and moves the decision to an engineer with a different budget entirely. Digitally monitored units grow at 8.7% against a market rate of 5.8%, and very few suppliers have restructured their documentation for it.
03 / TURNAROUND CHANNEL OWNERSHIP

Be on the shelf when the plant shuts down

An installed base replacing on roughly 9 year cycles produces demand arriving in turnaround windows that are planned years ahead and published openly to contractors well before the work begins. A supplier holding regional stock, competitor cross-reference data and a maintenance contractor relationship captures replacement business that never reaches a valve builder at any point in the process. It requires distribution and inventory rather than any engineering at all, and most participants here remain organised entirely around original equipment supply instead.
04 / CONVERSION PROGRAMME TARGETING

Follow the air conversions, not the electrifications

Methane rules restricting natural-gas-driven pneumatic devices push operators toward either instrument air supply or electric actuation, and the first path retains every booster on site while changing only what feeds it. Those conversion programmes are planned, funded and executed site by site, which makes them identifiable well in advance to anybody actually reading regulatory compliance filings. A supplier arriving with conversion-ready devices and retrofit guidance sells into a funded and scheduled programme, and almost nobody in this sector is watching those filings.

Engagement Snapshot From the Field

A live engagement with an industry participant carrying material or product regulatory and market exposure ahead of a defining policy shift, showing how our research translates into a defensible multi-year portfolio strategy.
MARKET MINDS ADVISORY · CLIENT ENGAGEMENT SUMMARY
Booster Relay Producer Strategic Portfolio Review and Transition Roadmap 2026·Investment Scenario on Booster Relay Exposure Evaluation 2025-26
CLIENT PROFILE
An independent manufacturer of booster relays and pneumatic control accessories supplying valve builders and distributors across Europe and North America, with annual revenue in the tens of millions of euros and a product range widely regarded as technically equal to the integrated manufacturers (client-reported, unverified by MMA). Share had declined for four consecutive years. Management blamed integration.
STRATEGIC CHALLENGE
The client was losing original equipment business to integrated valve manufacturers who supplied their own boosters, and no amount of technical comparison changed that outcome because the specification decision was never contested. Management wanted to know whether any route into that business existed or whether the decline was simply permanent.
MMA APPROACH
MMA traced how boosters were specified across sixty recent process projects, identifying at what point the device was chosen and by whom. Forty-seven expert interviews with valve builders, operating company engineering standards teams, maintenance contractors and engineering contractors established where an independent supplier could actually influence a decision at all.
KEY FINDINGS
  1. Where an operating company engineering standard listed acceptable devices, valve builders followed it in 9 cases out of 10 regardless of their own manufacturing.
  2. The client appeared on 2 operating company standards out of the 23 examined, and had never approached the engineering standards teams at any of them.
  3. Turnaround replacement business was awarded on availability and cross-reference data rather than on specification, and the client held stock in only one region.
  4. None of the client's products carried functional safety certification, which excluded the company entirely from the fastest growing application anywhere in the category.
CLIENT PROFILE
An independent manufacturer of booster relays and pneumatic control accessories supplying valve builders and distributors across Europe and North America, with annual revenue in the tens of millions of euros and a product range widely regarded as technically equal to the integrated manufacturers (client-reported, unverified by MMA). Share had declined for four consecutive years. Management blamed integration.
STRATEGIC CHALLENGE
The client was losing original equipment business to integrated valve manufacturers who supplied their own boosters, and no amount of technical comparison changed that outcome because the specification decision was never contested. Management wanted to know whether any route into that business existed or whether the decline was simply permanent.
MMA APPROACH
MMA traced how boosters were specified across sixty recent process projects, identifying at what point the device was chosen and by whom. Forty-seven expert interviews with valve builders, operating company engineering standards teams, maintenance contractors and engineering contractors established where an independent supplier could actually influence a decision at all.
KEY FINDINGS
  1. Where an operating company engineering standard listed acceptable devices, valve builders followed it in 9 cases out of 10 regardless of their own manufacturing.
  2. The client appeared on 2 operating company standards out of the 23 examined, and had never approached the engineering standards teams at any of them.
  3. Turnaround replacement business was awarded on availability and cross-reference data rather than on specification, and the client held stock in only one region.
  4. None of the client's products carried functional safety certification, which excluded the company entirely from the fastest growing application anywhere in the category.
RECOMMENDED STRATEGY
Phase 1: Phase one: approach operating company engineering standards teams directly, since a listing there overrides the valve builder's own preference reliably. Phase 2: Phase two: establish regional stock and publish competitor cross-reference data, which between them are what actually win turnaround replacement work. Phase 3: Phase three: certify the diagnostic product range for functional safety use, which currently excludes the client from the growing application.
OUTCOME
Within six quarters the client appeared on seven operating company standards and turnaround revenue had roughly doubled from a small base (client-reported, unverified by MMA). Original equipment share continued declining as expected. Functional safety certification is in progress and not yet complete. Regional stock is now held in three territories rather than one.

Frequently Asked Questions

Foundational context covering the market sizes, CAGR, scope, country, region and competition that inform every finding below. This section is provided to cover basics and most often pre-purchase conversations, answered from the MMA Primary Research Dataset.

What is the current size of the Booster Relay Market?

The global booster relay market was valued at USD 0.8 billion in 2025, covering pneumatic devices that amplify control signal flow to actuate valves faster. The 2026 figure reaches USD 0.85 billion.

How large will the Booster Relay Market be by 2036?

MMA forecasts USD 1.49 billion by 2036, an increase of USD 0.64 billion over the 2026 base. That represents an expansion multiple of 1.75 times across the forecast period.

What is the CAGR for the Booster Relay Market 2026 to 2036?

The base case compound annual growth rate is 5.8%, with a bull case at 7.0% and a bear case at 4.6%. Historical growth between 2020 and 2025 ran at 4.8%.

Which segment is growing fastest?

Digitally monitored smart boosters grow at 8.7%, half again the market rate of 5.8%, because safety standards require auditable stroking records. High-flow boosters follow at 7.2%.

Who are the major companies in the Booster Relay Market?

Emerson, Flowserve, Baker Hughes, Rotork and SMC Corporation lead on units shipped into valve assemblies, with combined CR5 of 52%. Concentration is high because valve builders specify their own components.

Which country is growing fastest?

India grows fastest at 7.8%, on refining and petrochemical construction built at scales that make large actuators standard. South Asia and Pacific leads regionally at 7.8%.

Report Segmentation Architecture

The full report scope spans multiple orthogonal segmentation dimensions, with cross-tabulated demand data provided for each dimension pair. Coverage extends further to regional breakdowns, trend trajectories, and the competitive detail needed to support segment-level decision-making.

By Device Function

  • Volume Boosters
  • Pressure Amplifying Relays
  • Quick Exhaust and Dump Relays
  • Reversing and Ratio Relays
  • High-Flow Boosters for Large Actuators
  • Digitally Monitored Smart Boosters

By End-Use Industry

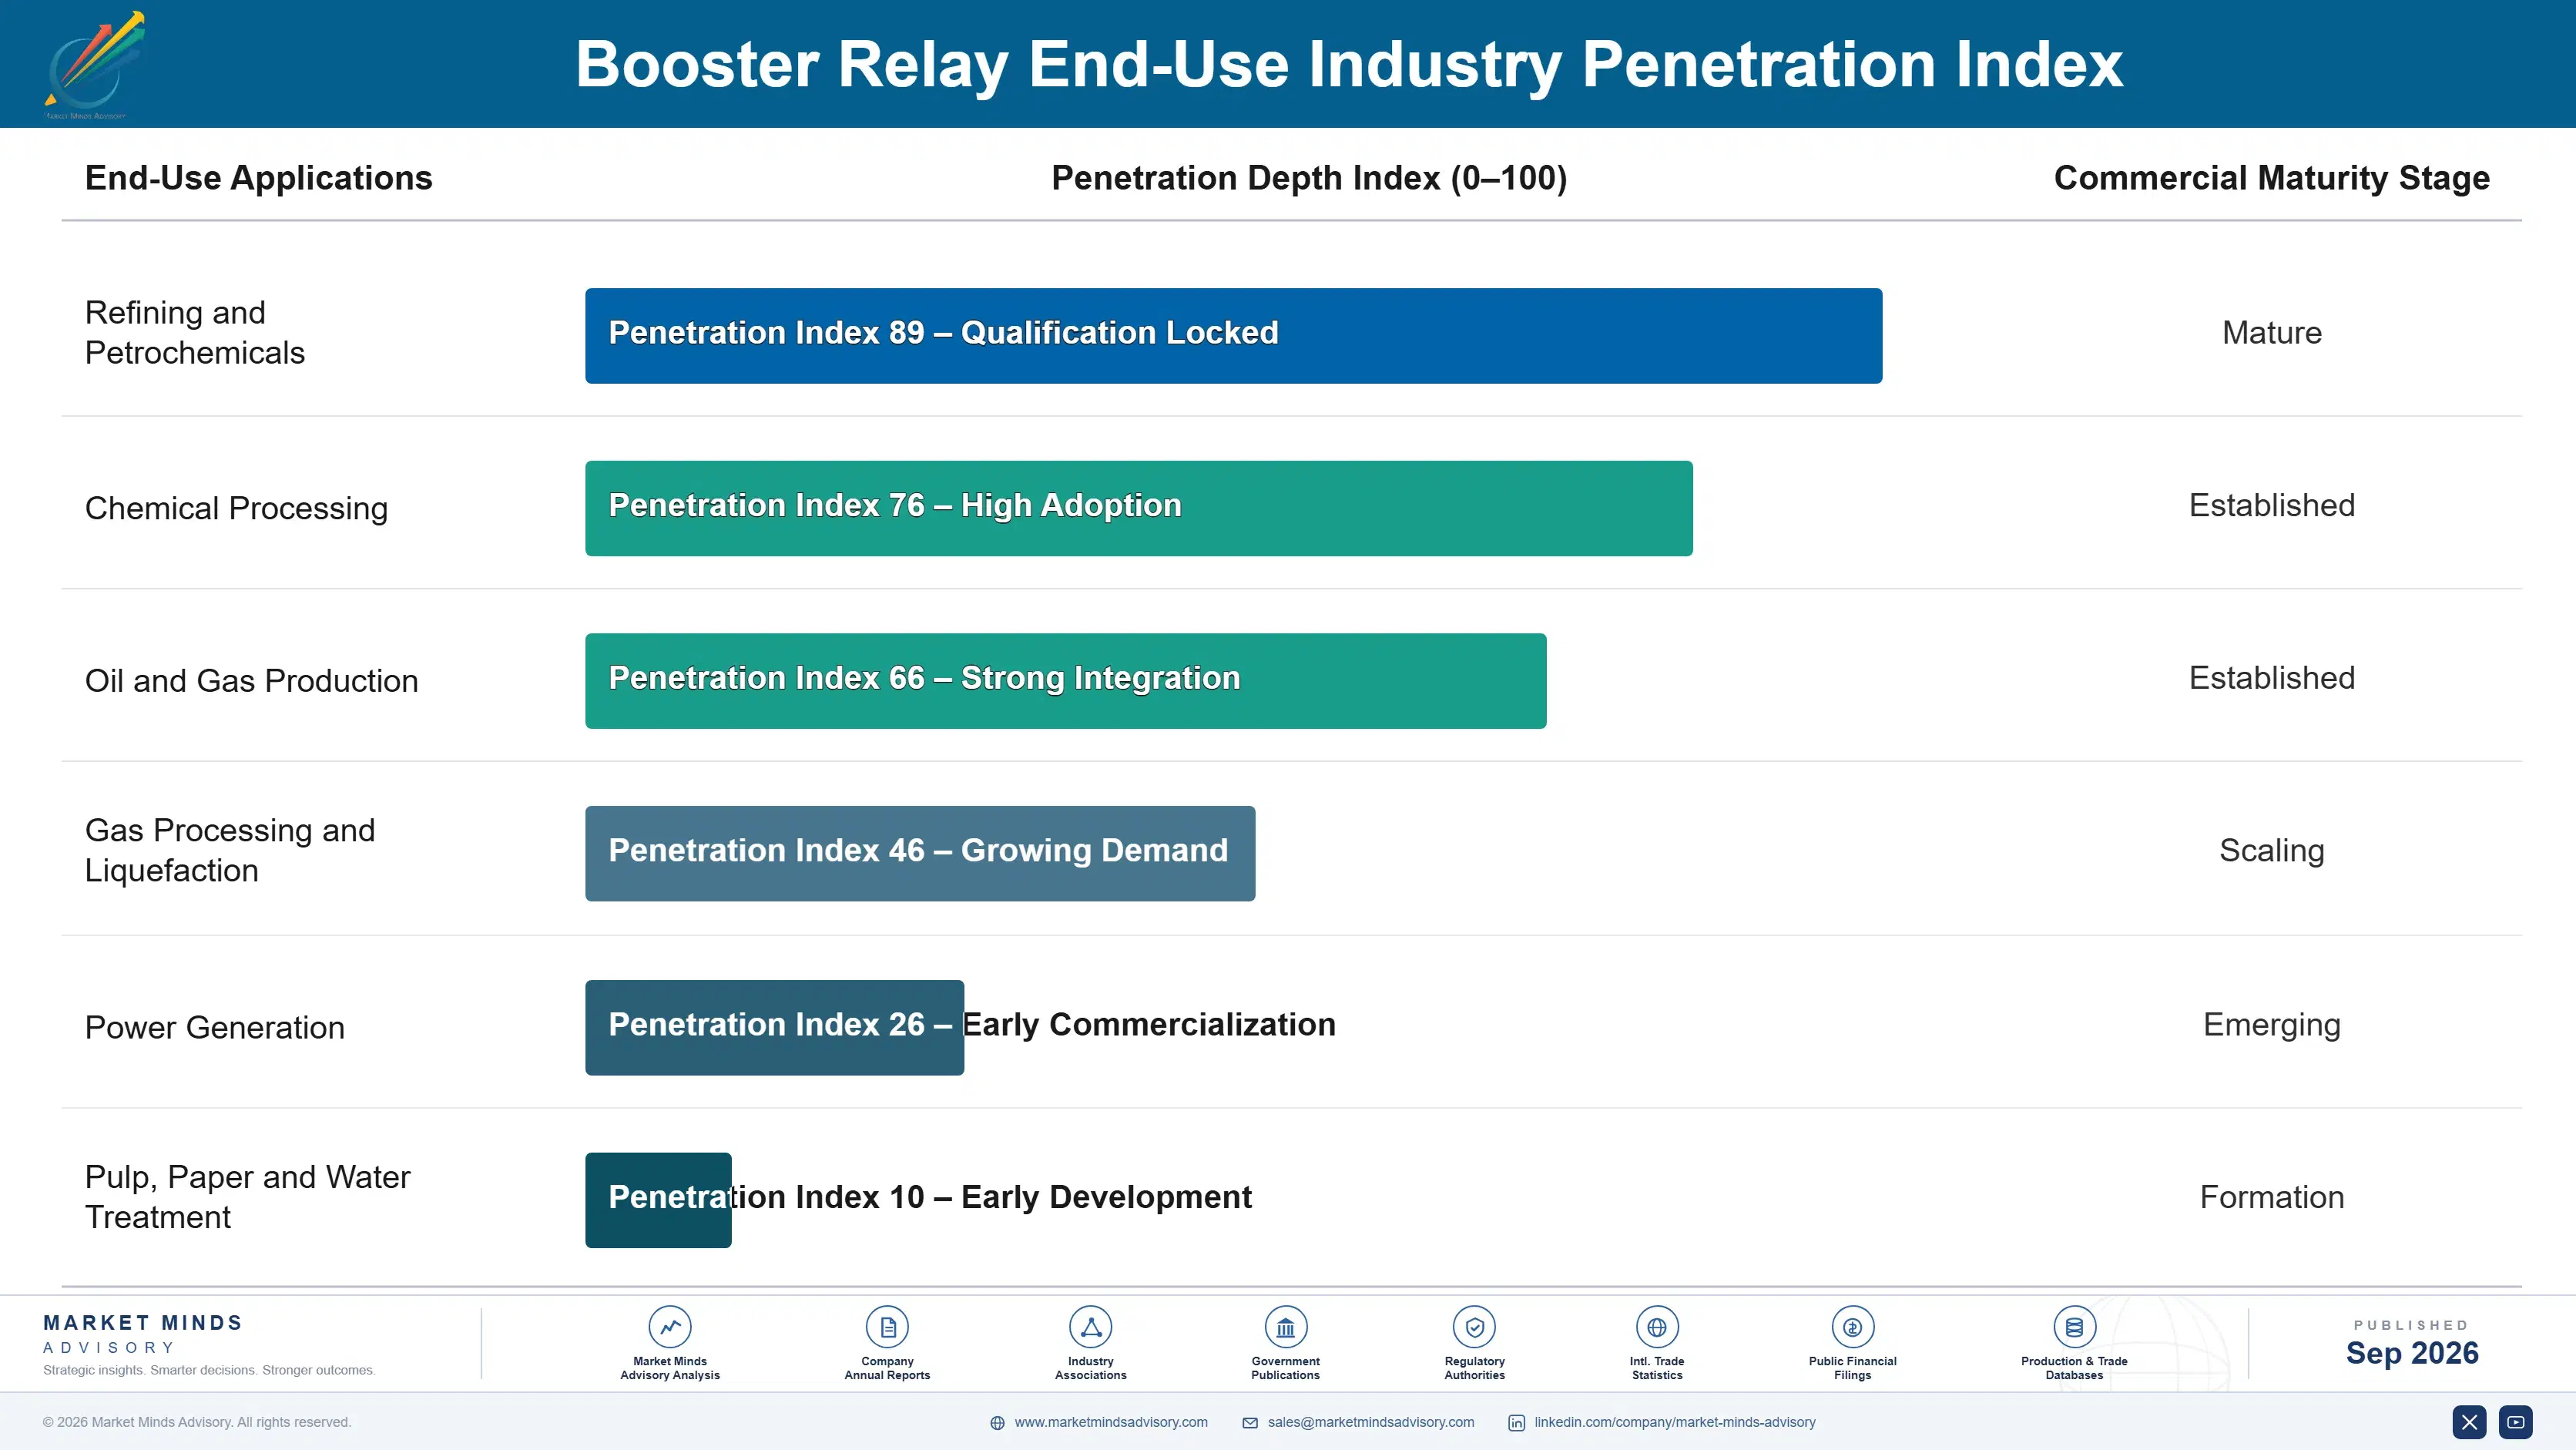
  • Refining and Petrochemicals
  • Chemical Processing
  • Oil and Gas Production
  • Gas Processing and Liquefaction
  • Power Generation
  • Pulp, Paper and Water Treatment

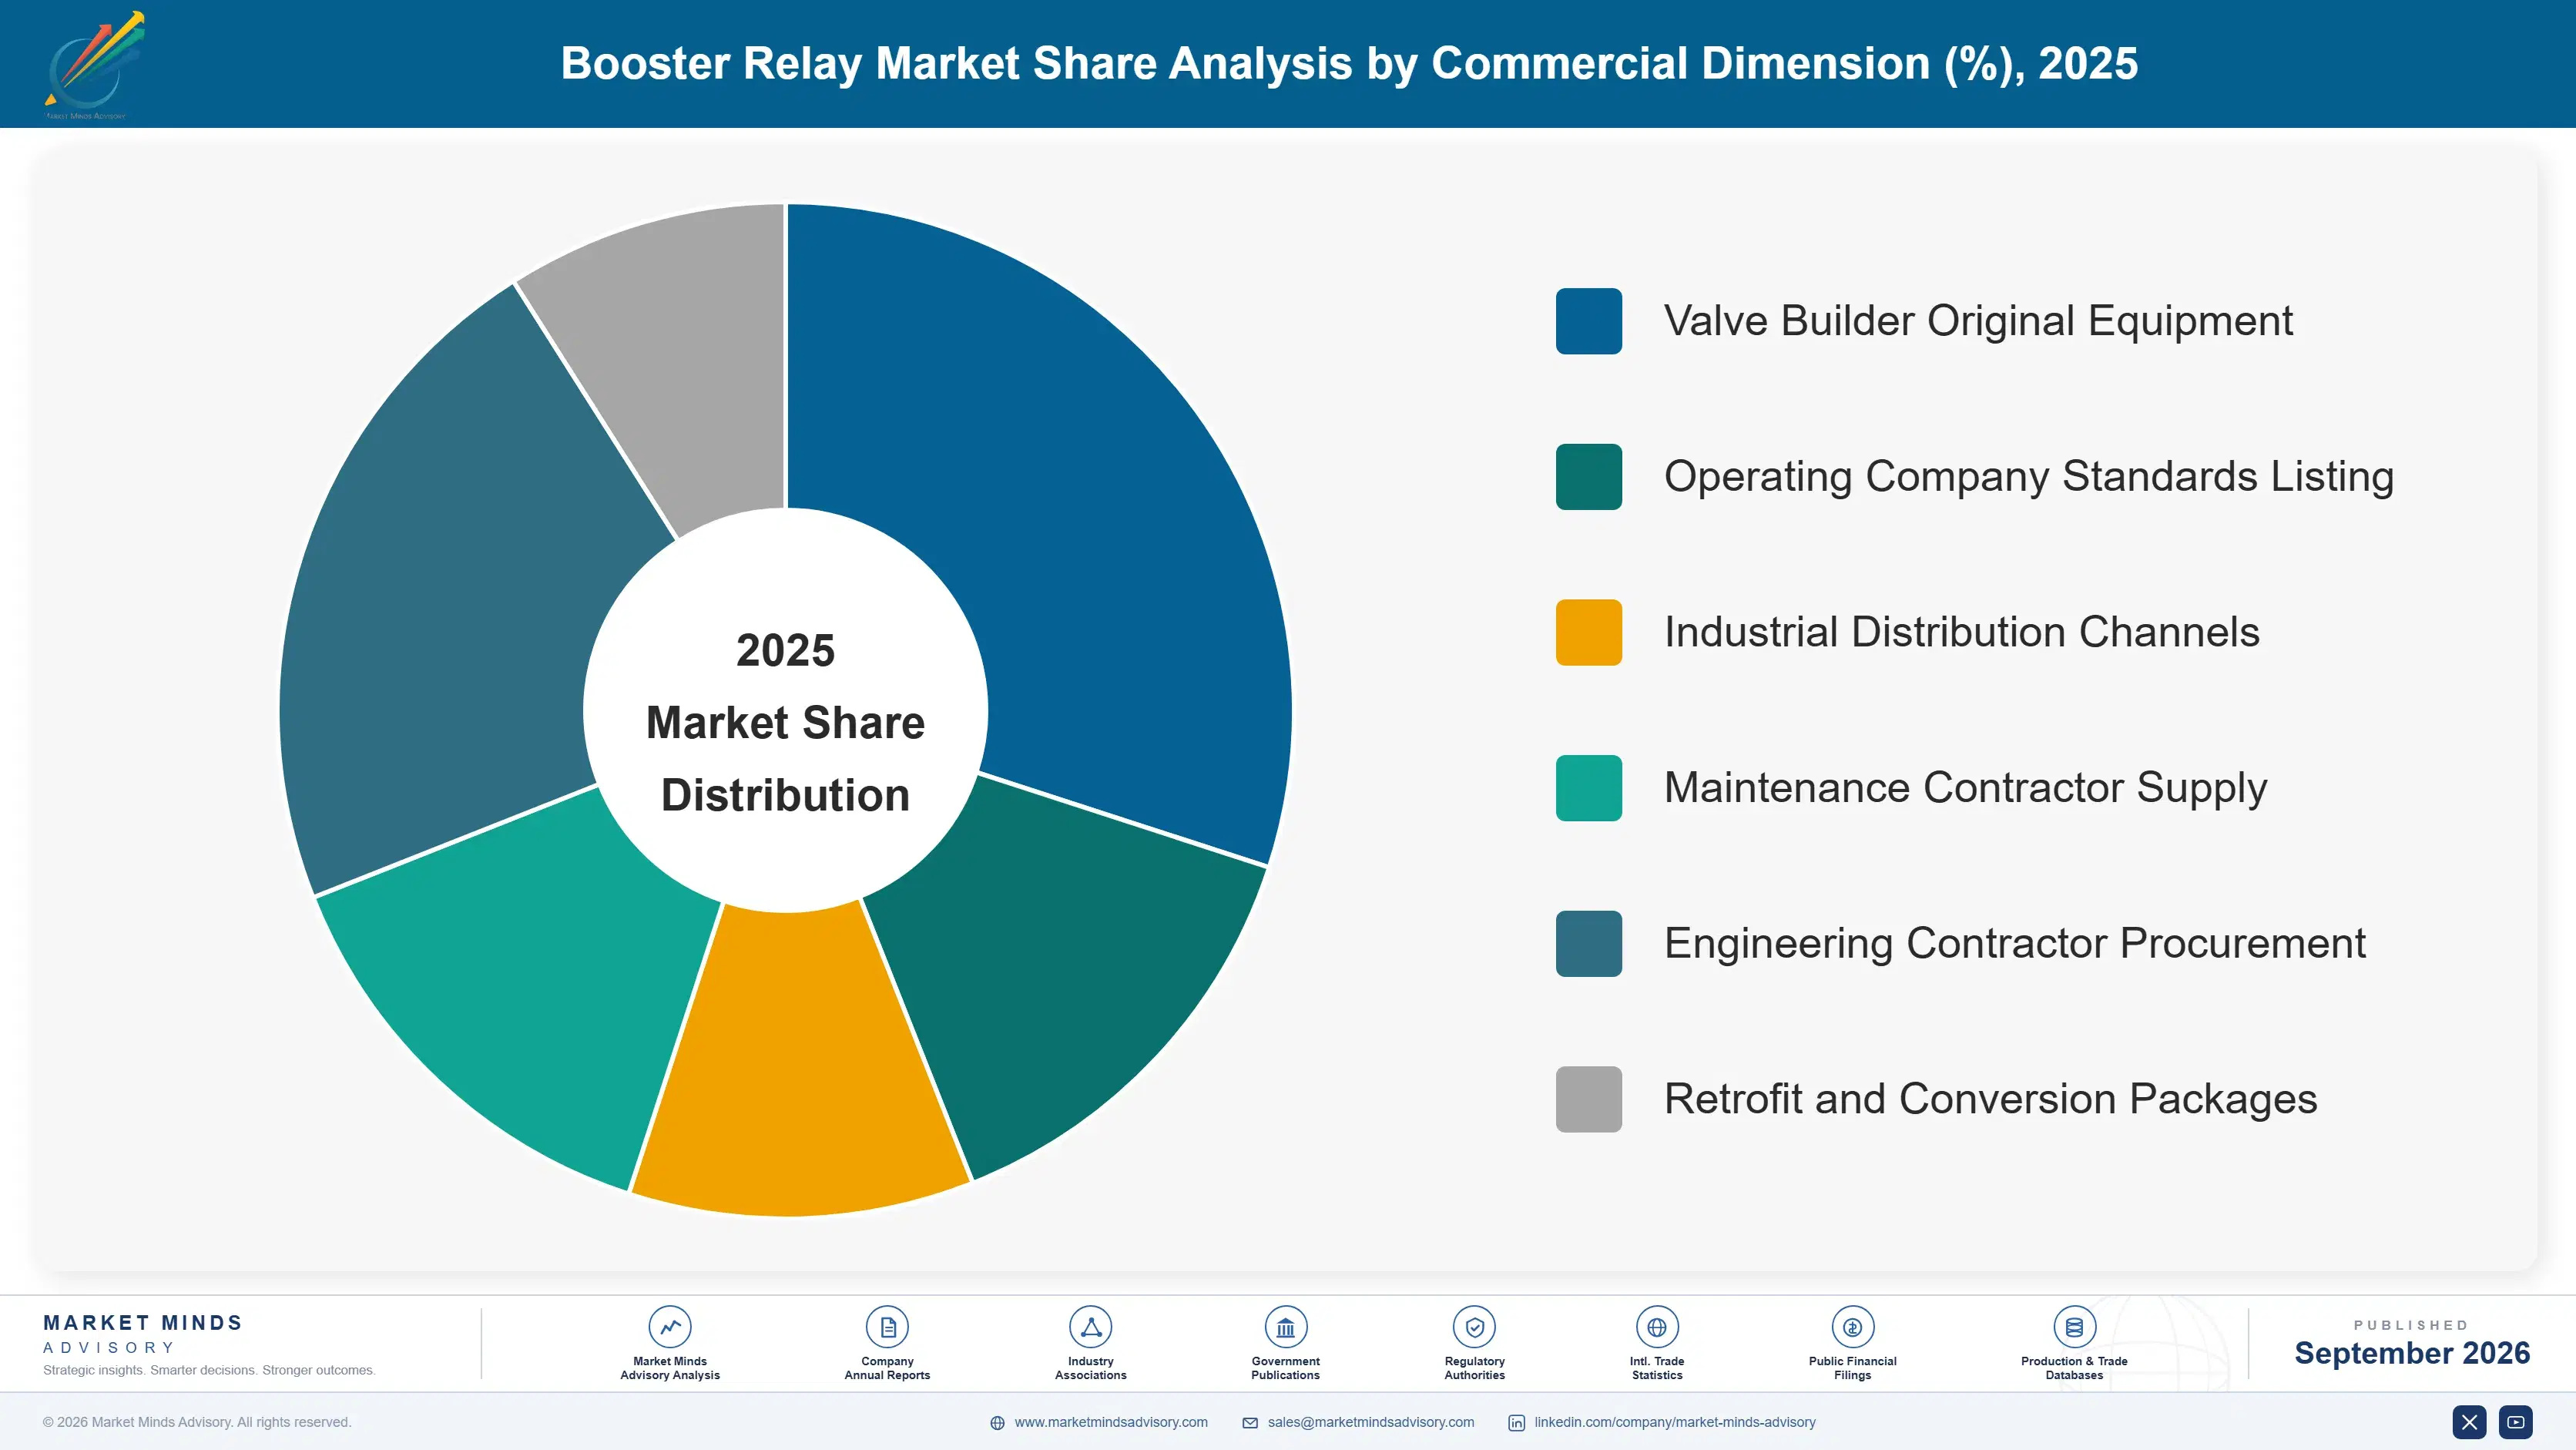
By Commercial Dimension

  • Valve Builder Original Equipment
  • Operating Company Standards Listing
  • Industrial Distribution Channels
  • Maintenance Contractor Supply
  • Engineering Contractor Procurement
  • Retrofit and Conversion Packages

By Region

  • North America
  • Western Europe
  • East Asia
  • South Asia and Pacific
  • Latin America
  • Middle East and Africa
  • Eastern Europe

Scope, Methodology, and Coverage

Every figure in this report is reproducible from documented input assumptions. The scope below maps the historical period, the forecast horizon, the segmentation dimensions, and the countries covered, alongside the underlying primary and qualitative methodology.
Historical Period
2020 to 2025
Forecast Period
2026 to 2036
Base Year
2025 (USD billions; MMA Primary Research Dataset, September 2026)
Market Definition
The booster relay market covers pneumatic devices that amplify the flow capacity of a control signal to actuate valves faster than a positioner alone can achieve, spanning volume boosters, pressure amplifying relays, quick exhaust and dump relays, reversing and ratio relays, high-flow boosters for large actuators, and digitally monitored smart boosters. Scope covers units shipped into control valve and actuator assemblies and into replacement on installed equipment. Excluded are valve positioners, current to pressure converters, solenoid valves, pneumatic actuators themselves, air preparation equipment, and electric actuator controls.
Quantitative Units
USD billion, 2025 base year, 2026 to 2036 forecast period
Segmentation Dimensions
Device function, end-use industry, commercial channel, region
Regions Covered
North America, Western Europe, East Asia, South Asia and Pacific, Latin America, Middle East and Africa, Eastern Europe
Countries Covered
United States, Canada, Germany, United Kingdom, France, Italy, Netherlands, Poland, China, Japan, South Korea, India, Australia, Brazil, Mexico, Saudi Arabia, United Arab Emirates, Qatar
Key Companies Profiled
20 companies across valve manufacturers, pneumatic specialists and instrument suppliers
Quantitative Methodology
Primary survey, n=3,800 respondents, Q4 2025, six countries; demand-side model with trade association cross-validation
Qualitative Methodology
47 expert interviews, Q4 2025; applied to validate demand model assumptions, identify emerging dynamics, and assess competitive positioning
Report Format
PDF and XLSX data workbook (Word format preview document)
Publisher
Market Minds Advisory
Report Code
MMA-2026-CON-531
Published
September 2026
Contact
sales@marketmindsadvisory.com | www.marketmindsadvisory.com

Purchase the full Booster Relay Market Report (2026 to 2036).

The full MMA report on the booster relay market runs to detailed device and regional models across the 2026 to 2036 forecast period, with unit cost benchmarks separated by machining volume and material specification. It profiles 20 companies on a consistent units shipped basis, covering valve manufacturers, pneumatic specialists and instrument suppliers. Specification routes are mapped across valve builder, engineering standard and turnaround replacement channels. Regional chapters cover the seven MMA regions with country-level detail on the eighteen markets surveyed. Primary research draws on a quantitative survey of 3,800 respondents across six countries and 47 expert interviews conducted in Q4 2025.
Unit cost benchmarks by machining volume and material specification
Specification routes mapped across builder, standard and replacement channels
Functional safety certification status compared across supplier product ranges
Twenty company profiles on consistent units shipped basis
Instrument air conversion programmes tracked against pneumatic device demand
Seven regional chapters with eighteen country detail tables

Built For The People Who Decide

From boardroom strategy to bench-side execution, this report is read cover-to-cover by leaders shaping the next decade of their industry, turning demand scenarios, market dynamics and valuation benchmarks into decisions.
CXOs/ Presidents/ VPs/ Managers
M&A and Corporate Development
Strategy Teams and R&D Heads
Procurement and Product Directors
Regulatory and Compliance Leaders
Investor Relations and Equity Analysts