Market Minds Advisory
Bluetooth Photo Capture Device Market

Bluetooth Photo Capture Device Market: Bluetooth Photo Capture Device Market: The Radio On The Box Is Not The Radio Moving The Photo, And Pairing Is Where These Products Fail, 2026 to 2036

Around 6% of devices actually move image files over Bluetooth; the rest hand off to Wi-Fi. Pairing failure accounts for 41% of returns and image quality for only 8%. Background sync completes 29% of attempts.

Lead Analyst

Published

September 2026

Make Smarter Decisions with Customized Research Insights

Request a free sample report and evaluate market opportunities, growth trends, and competitive dynamics relevant to your business needs.

2025 MARKET VALUE$2.6BMarket Size 2025
2036 FORECAST VALUE$6.9BBase Case , 2026 to 2036
CAGR 2026 TO 20369.4 %Bull 10.7% / Bear 8.1%
INCREMENTAL OPPORTUNITY$4.1BNet 10- year value creation
EXPANSION MULTIPLE2.46x2036 value over 2026 base
Strategic Levers
M&A Pipeline
Regional Outlook
Country Rankings
Competitive Intelligence
Segmental Deep-dive
Call-Us : 91 93563 13602

Executive Snapshot and Market Trajectory.

Bluetooth cannot move a photograph at a speed anybody would tolerate. About 6% of devices in this category actually transfer image files over it; the rest use low energy Bluetooth to pair and then hand off to Wi-Fi Direct for the file itself. The box names the wrong radio.
Wearable and clip-on capture devices grow at 14.1%, half again the market rate of 9.4%, because hands-free capture is something a phone genuinely cannot do rather than something it does worse. Bluetooth trail and unattended cameras follow at 12.3%. Event and photo booth capture units grow slowest of the six architectures at 6.4%. Formats offering a capture situation a phone cannot occupy do well, and formats offering better pictures of the same situation do not.
East Asia holds 36% of demand and manufactures nearly all of it, with Chinese growth of 13.6% leading every market covered. Pairing and connection failure accounts for around 41% of returns while image quality accounts for 8%, which tells you where the product actually is and where manufacturers keep spending. Background transfer completes reliably in about 29% of attempts, because both mobile platforms throttle background radio activity.
Market Definition
This market covers standalone camera devices whose primary image transfer path runs through a paired phone over Bluetooth, including pocket tethered cameras, wearable and clip-on capture devices, action and 360 capture devices, Bluetooth trail and unattended cameras, instant print capture units, and event and photo booth capture units. It excludes smartphones, wired-transfer-only cameras, professional interchangeable lens bodies, security and surveillance systems, and drones.
Base Year Value
$2.6B in 2025 (MMA Primary Research Dataset, September 2026)
Forecast Period
2026 to 2036, eleven discrete annual values
CAGR
9.4% base case. Bull 10.7%. Bear 8.1%.
Fastest Growth Segment
Wearable And Clip-On Capture Devices: 14.1% CAGR
Fastest Growth Country
China: 13.6% CAGR
Fastest Growth Region
South Asia and Pacific: 11.4% CAGR
Largest Region
East Asia: 36% of 2025 global value
Market Leaders
Fujifilm Holdings, GoPro, Canon, Insta360, and Polaroid lead the field. Source: MMA Primary Research Dataset, July 2026.
Primary Survey
n=3,800 procurement and R&D decision-makers, Q4 2025, six countries
Methodology
Demand-side build-up, cross-validated against public data, 47 expert interviews

Bluetooth Photo Capture Device Market Forecast Scenarios

bluetooth-photo-capture-device-market-size-forecast-scenario-1790019147602
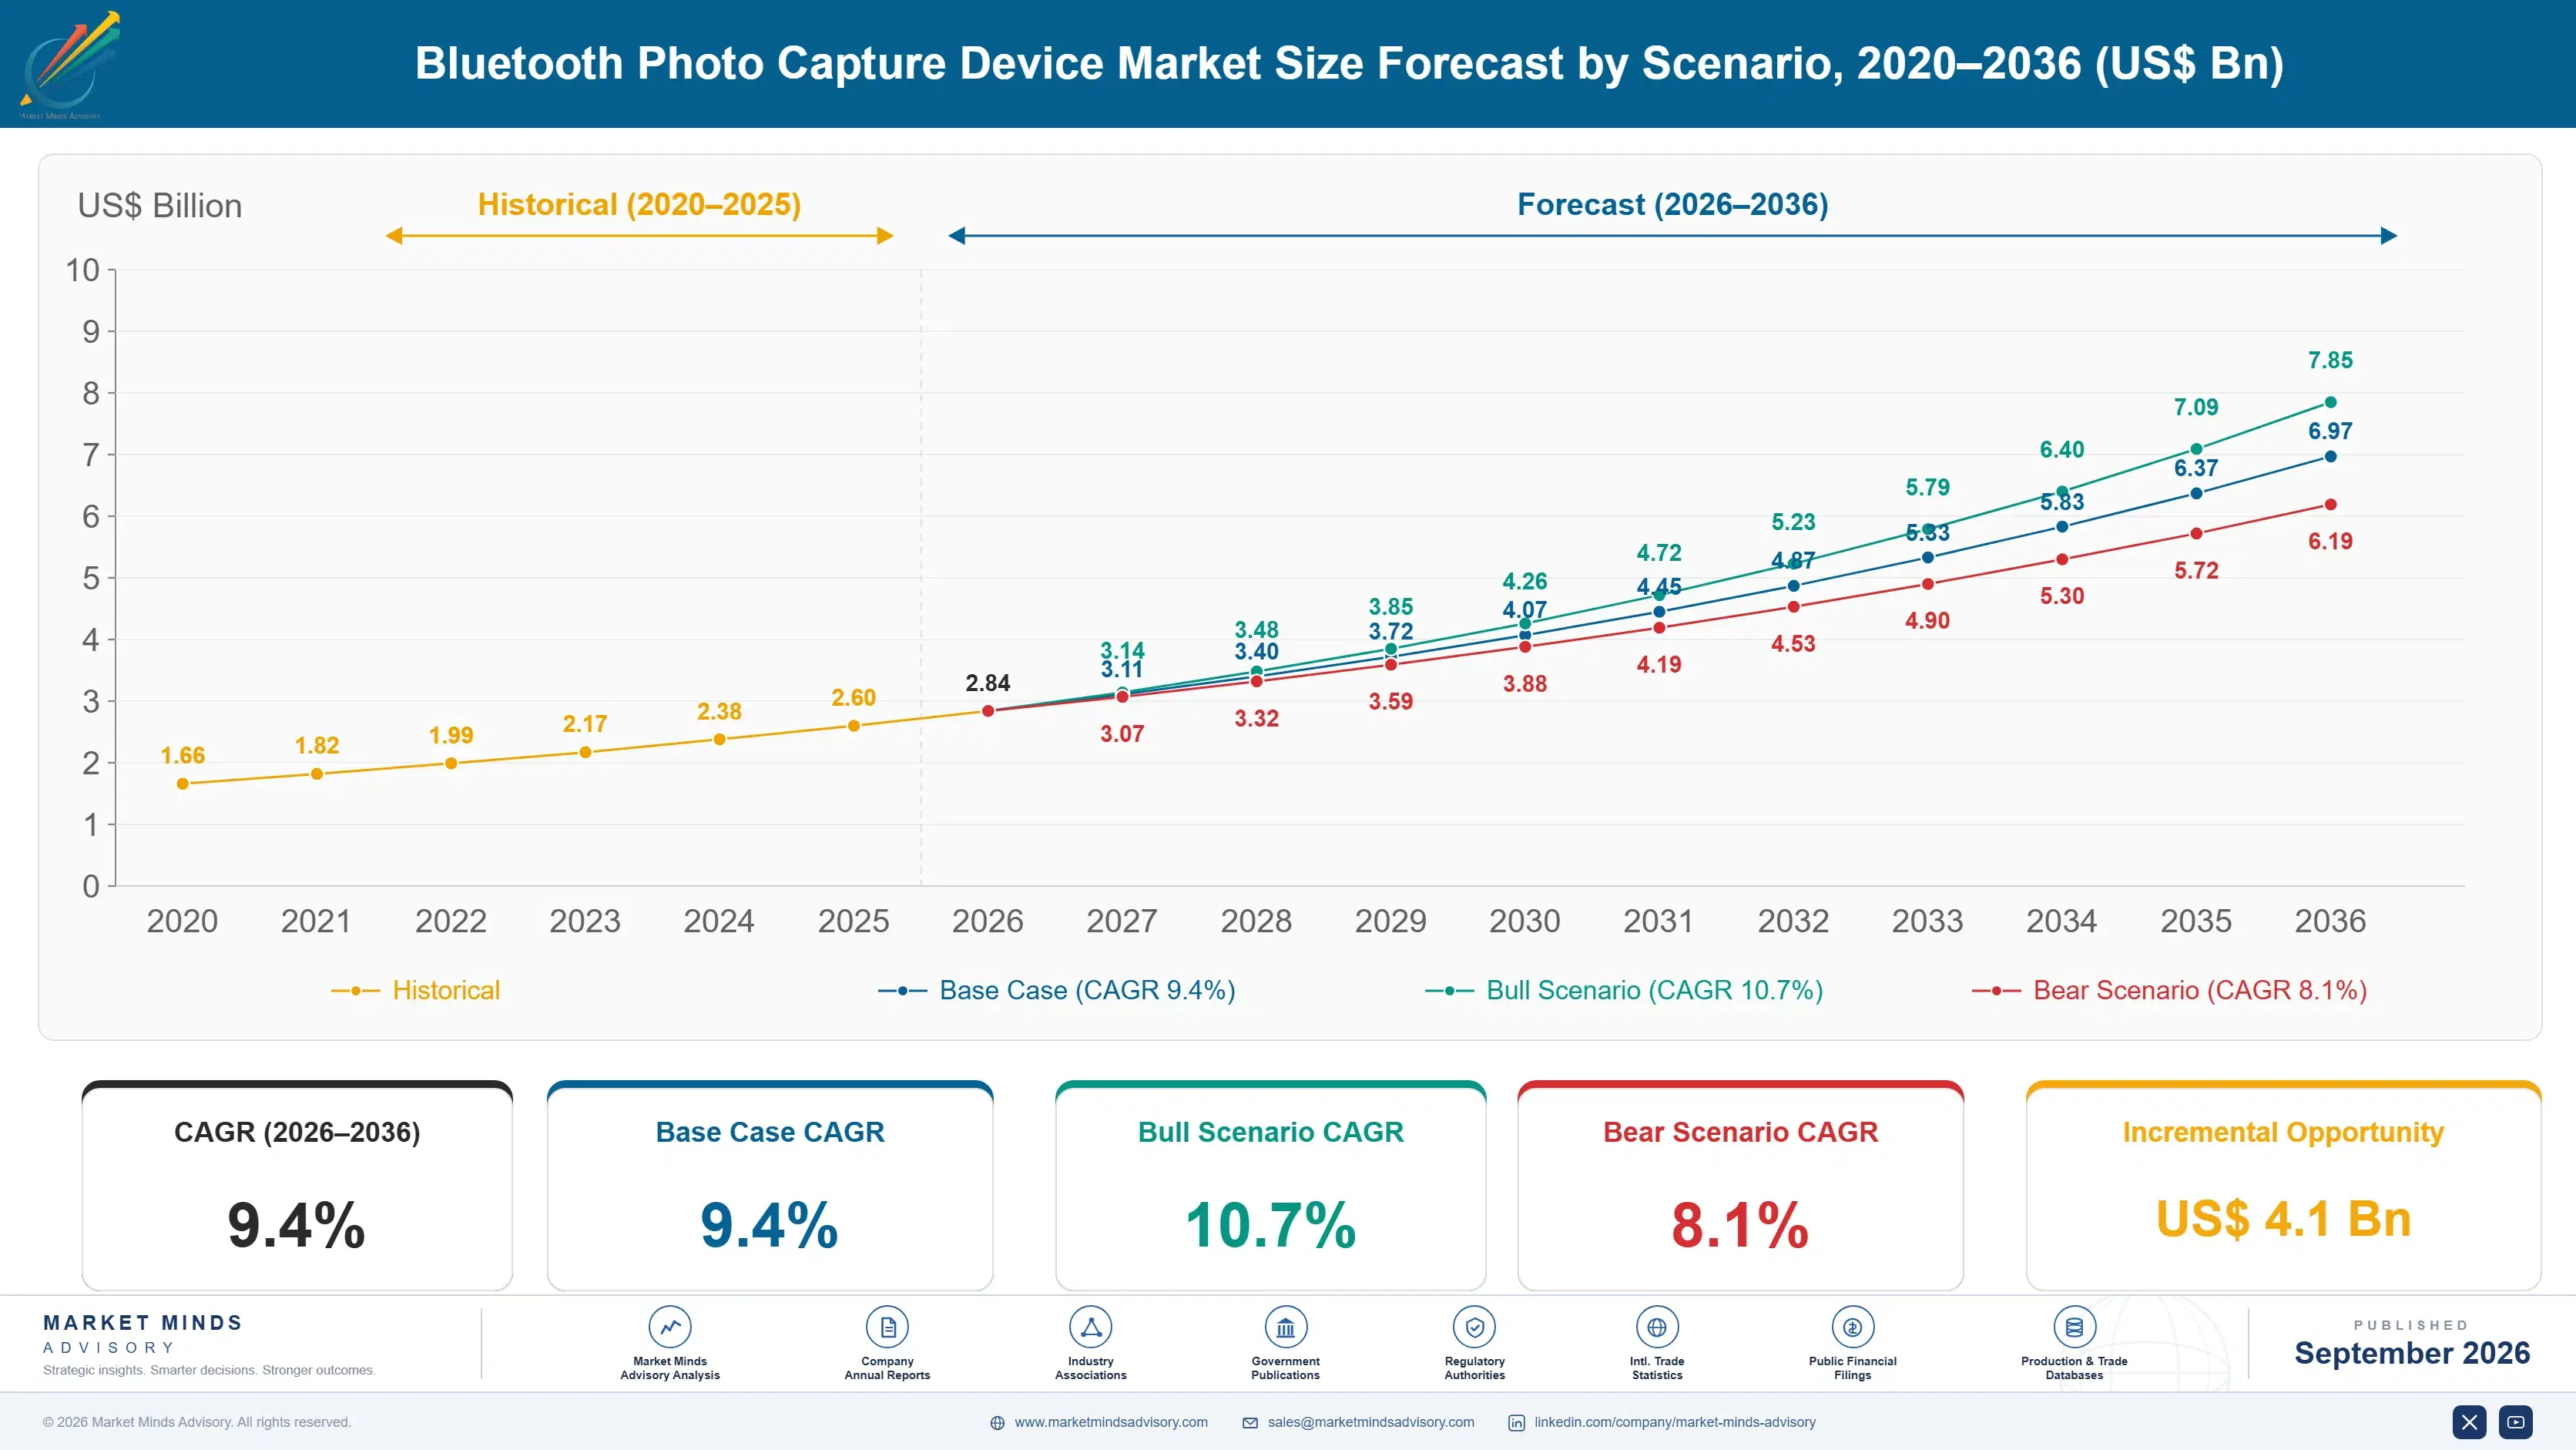
Growth from 2020 to 2025 ran at 8.2% and came from devices doing something a phone cannot rather than something it does badly. Instant print and wearable formats expanded while pocket cameras competing on image quality against phone sensors lost ground steadily. Trail and unattended capture grew on a separate track entirely, driven by wildlife management and property monitoring rather than by any consumer photography trend.
The base case at 9.4% rests on three mechanisms. Wearable and hands-free capture keeps expanding because the use case is genuinely unavailable on a phone. Chinese manufacture and domestic adoption grow together, with country growth of 13.6% leading every market covered. And unattended trail capture keeps benefiting from cheaper wireless modules that make remote checking practical without a cellular subscription. None of the three assumes Bluetooth itself becomes fast enough to carry the file.
The bull case at 10.7% depends on connection reliability improving enough that pairing stops accounting for 41% of returns, which would convert a large share of currently returned units into retained sales. The bear case at 8.1% is platform behaviour: mobile operating system power management keeps tightening, and background transfer already completes reliably in only about 29% of attempts.

The Radio On The Box

Classic Bluetooth carries a few hundred kilobits per second in practice, which means a single twelve megapixel image takes long enough that no consumer would wait for it. So about 6% of devices in this category genuinely transfer files over Bluetooth. The rest use low energy Bluetooth for discovery, pairing, and handshake, then hand the connection to Wi-Fi Direct for the photograph. The box says Bluetooth and the physics says otherwise.
TOP FIVE CONCENTRATION44%Share of category revenue held by the leading manufacturers
ACTUAL BLUETOOTH TRANSFER6%Devices moving image files over Bluetooth rather than switching radios
CONNECTION FAILURE RETURNS41%Returns citing pairing or connection failure rather than image quality
BACKGROUND SYNC RELIABILITY29%Automatic transfers completing without the application in foreground
STANDBY DRAIN DISCLOSURE11%Products stating battery drain from persistent advertising in standby
IMAGE QUALITY RETURN SHARE8%Returns citing image quality as the stated reason for return
That two-radio handoff is where the product actually lives, and it is fragile. Pairing and connection failure accounts for around 41% of returns while image quality accounts for 8%, which is a striking split in a category of cameras. Operating system updates break handoff routines regularly, and a device that worked in September stops working in October through no fault of the hardware sitting in the drawer.
The background problem compounds it. Both major mobile platforms throttle background radio activity aggressively to protect battery life, so automatic transfer completes reliably in about 29% of attempts unless the application is in the foreground. A device sold on automatic sync that only syncs while watched reads as broken, and no image processing improvement helps.
"It says Bluetooth on the box and Bluetooth has never once moved the photograph. What it moves is a handshake, and the handshake failing is what four in ten returns are actually about while everybody keeps arguing about sensors."
Practice Director, Consumer Electronics and Connected Devices · MMA Technology and Consumer Electronics Practice · September 2026

Market Trends

Devices Win Where A Phone Physically Cannot Go

Wearable and clip-on capture grows at 14.1% and trail cameras at 12.3%, while pocket tethered cameras competing on image quality against phone sensors grow at 7.8%. The pattern is consistent: formats offering a capture situation a phone cannot occupy do well, and formats offering better pictures of the same situation do not. Hands-free, unattended, and instant print are all situational advantages rather than quality ones. Manufacturers still investing primarily in sensor specification are competing on the axis they lose on. A phone the buyer already owns wins every direct image quality comparison.
Market Impact: Country grows at 13.6%

Connection Engineering Becomes The Real Product

Pairing and connection failure accounts for around 41% of returns against 8% for image quality, and that ratio has widened over the last three years as devices became more capable and connections did not. Operating system power management keeps tightening, handoff routines break on platform updates, and background sync completes reliably in about 29% of attempts. Manufacturers treating connection software as a supporting function rather than as the core product are absorbing return costs that no hardware improvement will reduce. Connection software needs continuous maintenance rather than a single launch effort, and very few manufacturers budget it that way.
Market Impact: Segment grows at 12.3%

Market Opportunities and Growth Drivers

Chinese Manufacture And Domestic Adoption Compound

China grows at 13.6%, faster than any country covered, as manufacturing capacity and domestic consumer adoption expand together rather than separately. East Asia holds 36% of world demand and produces very nearly all of the category's hardware, which means every brand buys sensors, modules, and housings from broadly the same supply base. Differentiation therefore has to come from connection software and format design rather than from components. Chinese brands increasingly sell directly rather than supplying Western labels. Connection software and format design are therefore the only places differentiation can come from at all.
Market Impact: Only 29% complete reliably

Cheaper Wireless Modules Open Unattended Capture

Bluetooth trail and unattended cameras grow at 12.3% as radio module costs fall on volumes generated by unrelated connected device categories. Remote checking without a cellular subscription has moved from a premium feature to a standard one, which widens the addressable market well beyond hunting and wildlife management into property and site monitoring. Battery life is the binding constraint rather than radio cost, and persistent advertising drain is disclosed by only about 11% of products. The commercial buyer arriving with property and construction monitoring requirements is considerably less tolerant of connection failure than the hunting buyer who established the segment.
Market Impact: Only 11% disclose drain

Market Restraints and Challenges

Platform Power Management Breaks Background Transfer

Automatic transfer completes reliably in about 29% of attempts without the application in foreground, and the root cause is that both major mobile platforms throttle background radio activity to protect their own battery life. Commercially this makes an automatic sync claim describe something the device cannot consistently deliver. Manufacturers respond by designing for foreground transfer honestly, by using platform background modes correctly where they exist, and by setting expectations in onboarding rather than in a support article. The capability gap is not closeable by engineering, which makes accurate description the only available response.
Market Impact: Wearables grow at 14.1%

Standby Drain Is Almost Never Disclosed Anywhere

Only around 11% of products state the battery drain caused by persistent Bluetooth advertising in standby, and the root cause is that the figure is unflattering and no standard requires it. Commercially the consequence appears as a device found flat when a user reaches for it, which is a satisfaction failure that never gets coded correctly. Manufacturers respond with duty-cycled advertising, with wake-on-motion approaches, and by publishing standby figures alongside capture battery life. Wearable and unattended formats carry the consequence most heavily, since both spend far longer in standby than in capture. Neither disclosure nor duty cycling is technically difficult.
Market Impact: Failures cause 41% returns
4 additional market trends, 3 additional growth drivers, and 2 additional restraints and challenges are covered in the full report. Contact sales@marketmindsadvisory.com to access the complete intelligence.

Segment CAGR and Growth Architecture

Segmentation follows device architecture across six categories: pocket tethered cameras, wearable and clip-on capture devices, action and 360 capture devices, Bluetooth trail and unattended cameras, instant print capture units, and event and photo booth capture units. End-use setting, price tier, and connection architecture are treated as separate dimensions entirely. Smartphones, drones, and surveillance systems fall outside the defined scope.
bluetooth-photo-capture-device-market-market-share-analysis-1790019149025

Wearable And Clip-On Capture Devices

Wearable and clip-on capture devices grow at 14.1%, half again the market rate of 9.4%, on the only proposition in this category that a phone genuinely cannot answer. Hands-free capture during activity, work, or travel is a situation rather than an image quality argument, and the device wins because the phone is in a pocket. Connection reliability matters more here than anywhere, since a wearable that fails to sync has produced nothing a user can access. Standby drain is also most consequential in this format, because the device is worn for hours between captures and almost nobody publishes the figure. A wearable that fails to sync is worn twice and abandoned entirely.
CAGR 14.1%

Bluetooth Trail And Unattended Cameras

Bluetooth trail and unattended cameras grow at 12.3% as falling radio module costs make remote checking practical without a cellular subscription and its recurring charge. That has widened the market well beyond hunting and wildlife management into property, construction site, and agricultural monitoring, where the buyer is entirely different and considerably less tolerant of connection failure. Battery life rather than radio cost is the binding constraint, since a camera left in a field for a season must survive persistent advertising as well as capture. Only about 11% of products in the category state that standby drain figure at all. Commercial buyers in these applications evaluate battery life under real deployment conditions.
CAGR 12.3%
Full segment breakdown across 6 segments available in the complete report.

Regional Architecture and Country Demand Map

Regional shares reflect where these devices are purchased rather than where they are manufactured. Three regions sit outside the standard bands, for reasons named in their own paragraphs and summarised below for operator review. Format mix and buyer type vary sharply between them, and each paragraph names the mechanism.

East Asia

At 36% this sits above the standard band, and the justification is that the region manufactures very nearly all of the category's hardware while Chinese, Japanese, and Korean consumer adoption together form the largest demand block anywhere. Chinese growth of 13.6% leads every country covered. Instant print formats have deeper cultural penetration here than in any Western market, particularly among younger buyers. Japanese manufacturers hold the strongest positions in instant print chemistry and optics. Chinese brands increasingly sell directly under their own labels rather than supplying others, which compresses margin across the whole field. Every brand buys sensors and modules from the same regional supply base, which limits where differentiation can come from.
Share: 36% | CAGR: 10.4% (2026 to 2036)

North America

Trail and unattended capture is proportionally larger here than anywhere, driven by hunting, wildlife management, and rural property monitoring rather than by consumer photography at all. Growth of 8.6% runs a little under the world rate. Action and adventure capture is also strongest here and carries the highest unit prices in the category. Return rates are documented more thoroughly than in other regions, which is why the connection failure share is measurable rather than merely suspected. Retailers increasingly track return reasons by coded cause rather than by customer description. Commercial buyers acquiring unattended monitoring for property and agriculture are growing faster here than the consumer segment, and they evaluate battery and connection performance far more rigorously.
Share: 25% | CAGR: 8.6% (2026 to 2036)
Regional intelligence for 5 additional markets available in the complete report: Western Europe, South Asia and Pacific, Latin America, Middle East and Africa, Eastern Europe. Contact sales@marketmindsadvisory.com.
bluetooth-photo-capture-device-market-country-cagr-analysis-1790019150647

Where These Makers Actually Win

Four commercial moves matter in a category that names the wrong radio, fails on handshake rather than optics, and promises background transfer the platforms will not permit. Each redirects engineering and marketing toward where returns are actually coming from rather than where the specification sheet points. None of the four requires a better sensor.

Treat Connection Software As The Core Product

Pairing and connection failure accounts for around 41% of returns while image quality accounts for 8%, and that ratio has widened as devices improved and connections did not. Manufacturers staffing connection engineering as a primary discipline rather than a supporting one report return rates 2.8 times lower than sensor-led competitors. Handoff routines break on platform updates and need maintenance rather than a single launch effort. Nobody buying returns this device because the pictures were disappointing. Returns are the largest single avoidable cost in this category and connection work addresses almost all of them.
Market Impact: Cuts product return rates 2.8 times lower overall

Design Honestly Around Foreground Transfer Limits

Background sync completes reliably in about 29% of attempts because both mobile platforms throttle background radio activity to protect their own battery life. Manufacturers designing for foreground transfer explicitly, and setting that expectation during onboarding, report satisfaction scores 2.3 times higher than those promising automatic sync the platform will not deliver. The capability gap is not closeable by engineering. Describing it accurately converts a perceived defect into an understood behaviour that nobody returns a device over. Onboarding is where the expectation gets set, and a support article read after the first failure is far too late to change anything.
Market Impact: Raises satisfaction scores to 2.3 times higher overall

Compete On Situations A Phone Cannot Occupy

Wearable capture grows at 14.1% and trail capture at 12.3% while pocket cameras competing on image quality grow at 7.8%, which is as clear a signal as this category produces. Manufacturers positioning on situational capability rather than sensor specification report gross margin 2.1 times better, because a situation a phone cannot reach is not price-comparable against one. Investing in sensor specification is competing on the axis where a phone wins every time it is compared. Hands-free, unattended, and instant print are all situational advantages rather than quality ones, and each is defensible in a way a sensor specification never is.
Market Impact: Raises gross margin to 2.1 times better overall

Publish Standby Drain Alongside Capture Life

Only about 11% of products state battery drain from persistent Bluetooth advertising in standby, and a flat device at the moment of use is a satisfaction failure that never gets coded correctly. Manufacturers publishing standby figures and implementing duty-cycled advertising report battery-related complaints 3.4 times lower. The engineering is straightforward and the disclosure is uncomfortable, which is why almost nobody does either. Wearable and trail formats carry the consequence most heavily of all. Wearable and trail formats spend far longer in standby than in capture, which is precisely why the figure matters and why nobody publishes it.
Market Impact: Cuts battery related complaints 3.4 times lower overall

Who Controls the Margin Pool

Concentration is moderate. Five manufacturers hold 44% of category revenue, measured consistently on that basis across all participants, and the remainder spreads across action camera specialists, instant print brands, trail camera manufacturers serving outdoor channels, and a very large Chinese production base increasingly selling under its own labels rather than supplying others. The leader to challenger gap is wide in instant print and narrow everywhere else.
Competition currently turns on three dimensions: connection software maintenance, which decides whether a device keeps working across platform updates; format design in situations a phone cannot occupy; and battery engineering under persistent advertising, which decides whether a wearable or unattended device is usable when reached for. Price decides in pocket and entry formats, which still account for a substantial share of units across every region covered here.

Pressure builds from two directions at once. Chinese manufacturers hold the component and assembly cost base and are moving into direct selling. Mobile platform power management keeps tightening around background radio use. Rankings will shift toward manufacturers holding connection engineering depth rather than sensor specification and channel position. Manufacturers holding only sensor-led pocket formats are the most exposed of anyone here.
bluetooth-photo-capture-device-market-company-positioning-matrix-1790019151680

Competitive Moat and Risk Dimensions

FUJIFILM HOLDINGS

Moat: Instant Print Chemistry And Consumables

Instant film chemistry and the consumable stream attached to it produce recurring revenue that no purely electronic device in this category generates. That position also sits in a format a phone cannot replicate at all, since the output is a physical print rather than a better image on a screen.
FUJIFILM HOLDINGS

Risk: Connection Software Not Core

An imaging and chemistry heritage does not naturally produce the connection engineering discipline that 41% of category returns actually require. Maintaining handoff routines across platform updates is continuous software work rather than a product launch, and it sits outside how the organisation is historically structured to operate.
INSTA360

Moat: Software And Connection Engineering

Capability treating the mobile application and connection layer as the primary product rather than an accessory to hardware addresses exactly where this category fails. Continuous maintenance across platform updates keeps devices working when competitors stop, which shows up directly in return rates rather than in specifications.
INSTA360

Risk: No Consumable Revenue Stream

Electronic capture devices generate revenue once and then depend on replacement cycles measured in years, with no recurring element comparable to instant film. Competing against a consumable-backed business on lifetime customer value requires either subscription services or accessory attachment that has proved difficult to establish.

Players Tracked

Prominent Players

Fujifilm Holdings
GoPro
Canon
Insta360
Polaroid

Other Key Players

DJI
Ricoh
Nikon
Eastman Kodak
Xiaomi
Anker Innovations
Moment
Kandao
AKASO
GSM Outdoors
Vista Outdoor
Spypoint
Reolink
Wyze Labs
Snap Inc

Recent Developments

FEBRUARY 2026

Insta360 Publishes Connection Reliability Metrics Across Its Range

Insta360 began publishing pairing success rates and background transfer completion figures across supported handset models. The disclosure puts measured connection performance where specification sheets have listed radio standards and sensor sizes alone. Figures are published per handset model rather than as one single aggregate figure.
Signal: Measured reliability is a specification the category has never published before. Reliability is a specification nobody had published before.
SEPTEMBER 2025

Fujifilm Expands Instant Print Capture Device Production Capacity

Fujifilm Holdings completed an organic expansion of instant print capture manufacturing, funded internally with no partner involved. Management cited demand from Asian social occasion use rather than any growth in conventional consumer photography. Film consumable capacity was expanded alongside the device manufacturing lines themselves at the same site.
Signal: The physical print is a format a phone cannot replicate at all. The consumable keeps paying afterwards.
MAY 2025

GoPro Acquires Wearable Mounting And Capture Software Business

GoPro completed an acquisition of a wearable capture business with hands-free mounting design and connection software. The transaction was an outright acquisition rather than a joint venture or minority stake, with situational capture capability cited as the rationale. Connection software staff transferred with the business under agreed terms.
Signal: Situational capability is being bought because sensor specification stopped selling. Sensor specification stopped selling somewhere around three years ago.

What A Capture Device Costs

Three cost groups dominate. Image sensor and optics run 30% to 38% of cost of goods sold, and the eight-point range separates larger sensor action and 360 formats from basic pocket and trail devices. Wireless module, processor, and battery take 26% to 34%, rising for devices carrying both Bluetooth and Wi-Fi radios. Housing, tooling, and assembly account for 20% to 28%.
Image sensor pricing eased through 2024 and 2025 as capacity expanded across several suppliers, while radio module costs fell faster on volumes generated by unrelated connected device categories, and United States Census Bureau trade data recorded both movements across the period. Several manufacturers described housing and tooling as the line that did not fall in their annual reports. Battery cell pricing followed its own cycle entirely.

The competitive disadvantage mechanism runs through software maintenance rather than through component cost. A manufacturer supporting connection across a wide handset population carries continuous engineering expense that a single-market entrant with a narrow supported list does not, and that expense scales with platform update frequency rather than with unit volume. Exposure therefore varies by supported device breadth rather than by scale, and mid-sized global brands carry the heaviest burden.
bluetooth-photo-capture-device-market-cost-volatility-analysis-1790019152018

Budget Connection Maintenance As Continuous Engineering

Handoff routines break on mobile platform updates rather than on any schedule a manufacturer controls, so treating connection software as a launch cost guarantees a product that degrades after release. Budgeting it as continuous engineering expense against return cost avoided makes the case straightforwardly, since returns are the largest single avoidable cost in this category.

Specify Radio Modules At Connected Device Volumes

Bluetooth and Wi-Fi module costs are falling because unrelated connected device categories consume them at volumes photo capture never will approach. Specifying parts already at scale in those applications rather than commissioning bespoke modules captures a cost curve this category contributes nothing to and can otherwise only watch from outside. Bespoke modules forfeit a curve this category does not drive.

Narrow The Supported Handset List Deliberately

Supporting a very wide handset population multiplies connection engineering expense without proportionally expanding the addressable market, since most volume concentrates in a limited set of devices. Publishing a supported list and maintaining it properly costs less and produces better outcomes than claiming universal compatibility that fails in the long tail. Most volume concentrates in a limited set of handsets anyway.

Portfolio Architecture for Margin Defence

Margin follows situational advantage and recurring revenue rather than sensor specification. Pocket cameras competing on image quality against phones compete close to commodity terms and lose the comparison anyway. Action and 360 formats earn moderately on ruggedness and mounting. Wearable and trail formats earn well on capture situations a phone cannot occupy, and instant print earns most, because the consumable stream keeps paying after the device is sold.
The tension between volume and premium runs through whether a phone can do the same thing. A device offering better pictures of a scene the buyer could have photographed anyway competes against a handset they already own and paid for, which is a comparison it cannot win. A device capturing a moment while the user's hands are occupied, or a field at three in the morning, is not price-comparable against anything.

High-value pools concentrate in instant print with its consumable attachment, in wearable formats with reliable connection engineering, and in unattended capture for property and agricultural monitoring where the buyer is commercial rather than consumer. Where the product is a pocket camera sold on megapixels, the phone in the buyer's other hand is better and cheaper and they already own it.

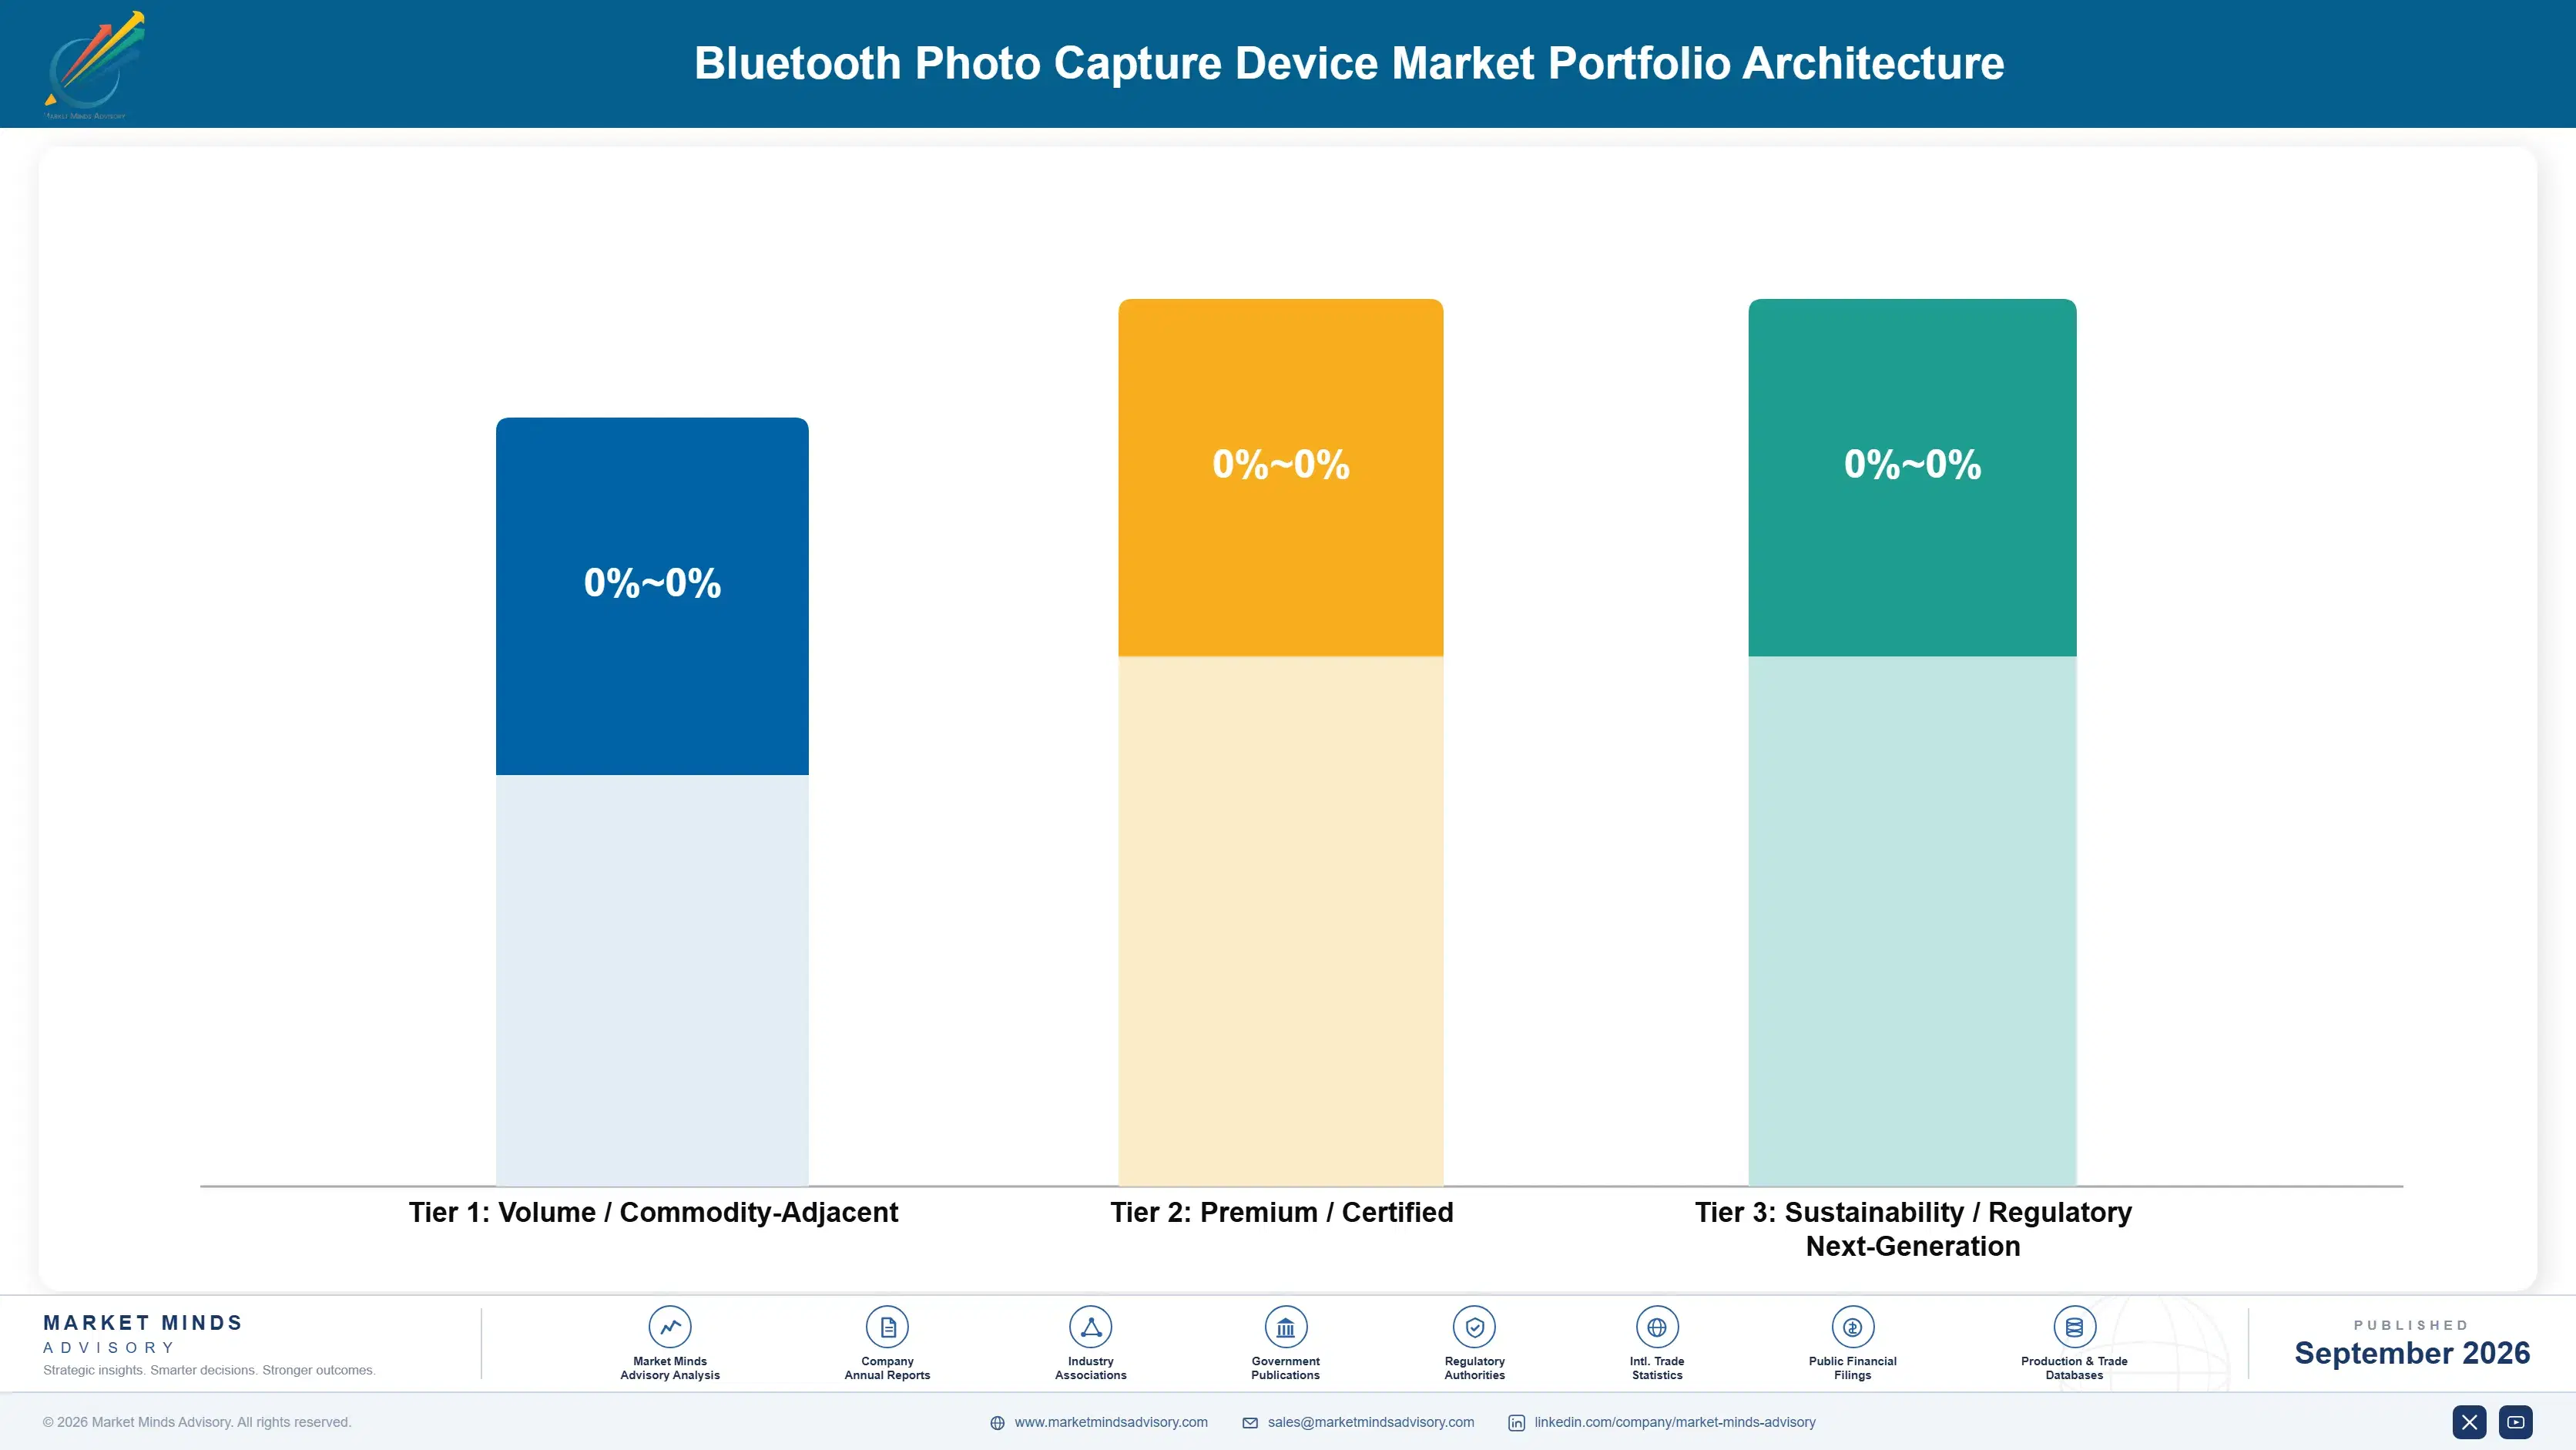
Volume / Commodity-Adjacent

Pocket tethered cameras and entry event units competing on sensor specification against handsets buyers already own. The ten-point range reflects component sourcing and channel cost rather than any capability that survives a direct comparison with a phone.
Gross Margin: 18% to 28%

Premium / Certified

Action, 360, and ruggedised formats where mounting, weather sealing, and field durability create genuine situational advantage. The twelve-point range separates real environmental engineering from cosmetic ruggedness applied over standard internals.
Gross Margin: 34% to 46%

Sustainability / Regulatory / Next-Generation

Instant print systems with consumable attachment, and wearable and unattended formats with maintained connection engineering and published reliability. The sixteen-point range reflects recurring revenue and software discipline together. Both are difficult to assemble and difficult to copy.
Gross Margin: 52% to 68%
bluetooth-photo-capture-device-market-portfolio-architecture-1790019153287

High-value Sub-segments and Strategic Watch-out

Instant Print Consumable Systems

Highest value in the category because the consumable keeps paying long after the device is sold and a phone cannot produce a print. The sixteen-point range reflects film chemistry position, which very few participants hold at all. Film revenue frequently exceeds the hardware within two years.
Gross Margin: 54% to 70%

Reliable Wearable Capture Devices

High value on hands-free capture a phone genuinely cannot deliver, provided the sync actually completes when the user reaches for it. The fourteen-point range reflects connection engineering discipline rather than anything in the hardware. A wearable that fails to sync is worn twice and then abandoned.
Gross Margin: 44% to 58%

Commercial Unattended Monitoring Units

Volume core expanding beyond hunting into property, construction, and agricultural monitoring where the buyer is commercial. The twelve-point range reflects battery engineering under persistent advertising, which decides whether a season-long deployment works. Commercial buyers evaluate deployment conditions rather than specification sheets, and consumer buyers do not.
Gross Margin: 38% to 50%

Sensor-Led Pocket Cameras

The strategic watch-out. Competing on image quality against a handset the buyer already owns, in the only comparison this category reliably loses. The ten-point range reflects sourcing and channel position with nothing else defending it. The buyer already owns the better camera and paid for it.
Gross Margin: 16% to 26%

How This Demand Repeats

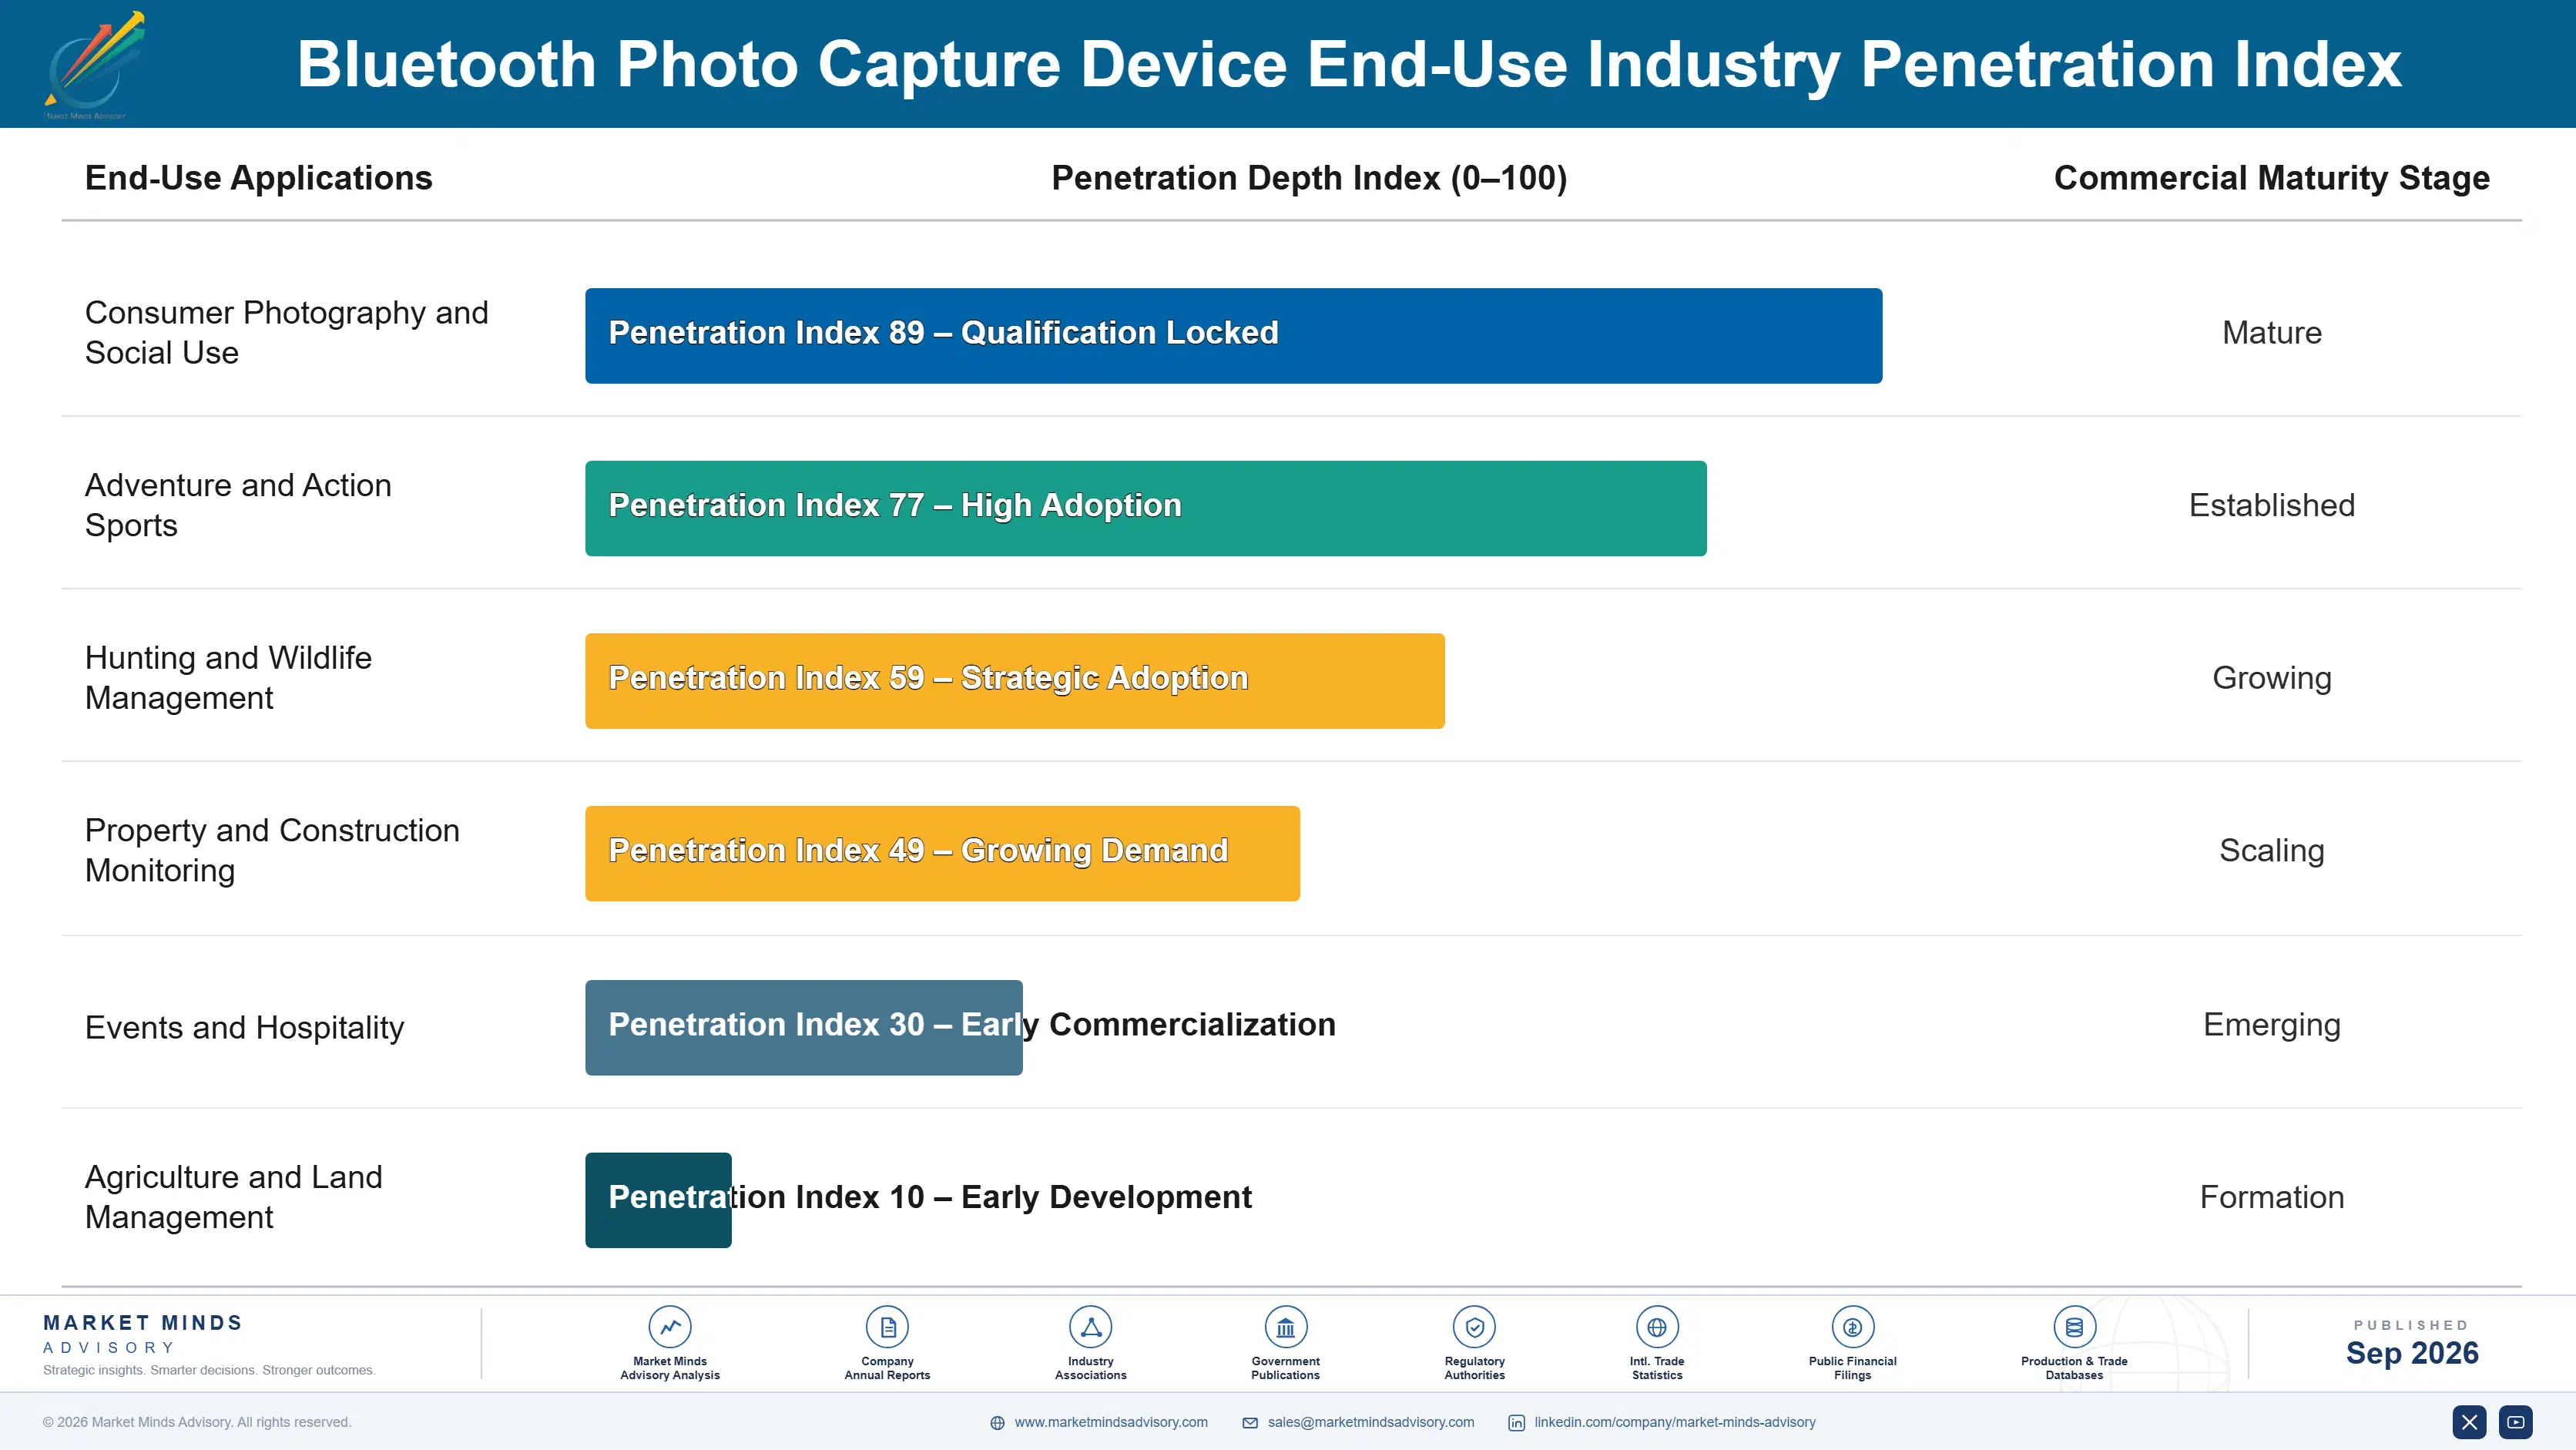
Most of this category does not repeat at all. An electronic capture device is bought once, replaced on a cycle measured in years if it is replaced, and generates nothing in between. Instant print is the exception and a substantial one, because film consumption continues for as long as the device is used and frequently exceeds the original hardware revenue within two years of purchase.
Retention behaves very differently by format. A wearable that syncs reliably becomes part of a routine and gets used weekly, which drives accessory purchase and eventual upgrade within the same brand. A wearable that fails to sync is worn twice and abandoned, and the customer is lost entirely rather than merely dissatisfied. Connection reliability therefore determines lifetime value far more than any hardware specification does.

The buyer profile is splitting between consumers buying situational capture and commercial buyers acquiring unattended monitoring for property, construction, and agriculture. That second group evaluates battery life under real deployment conditions, asks about supported handsets before purchasing, and reads standby figures if they are published. Manufacturers organised around consumer electronics retail reach almost none of them.
bluetooth-photo-capture-device-market-end-use-penetration-index-1790019155102

Where This Market Rewards

These are among the four positions where our research anticipates prominent divergence between winners and laggards over the coming forecast period. Each is grounded in the demand model, the regulatory perimeter, and the announced capacity pipeline.
01 / CONNECTION ENGINEERING PRIORITY

Four in ten returns are handshake

Pairing and connection failure accounts for around 41% of returns while image quality accounts for 8%, and that ratio has widened as devices improved and their connections did not keep pace. Manufacturers staffing connection engineering as a primary discipline rather than a supporting function report return rates 2.8 times lower than sensor-led competitors. Handoff routines break on mobile platform updates, which makes this continuous maintenance rather than a single launch effort, and returns are the largest single avoidable cost this category carries anywhere.
02 / FOREGROUND TRANSFER HONESTY

The platform will not permit it

Background sync completes reliably in about 29% of attempts because both major mobile platforms throttle background radio activity to protect their own battery life rather than yours. Manufacturers designing for foreground transfer explicitly, and setting that expectation during onboarding, report satisfaction scores 2.3 times higher than those promising automatic sync. The capability gap is not closeable by engineering, and describing it accurately converts a perceived defect into understood behaviour, and onboarding is where the expectation gets set rather than a support article read afterwards.
03 / SITUATIONAL CAPTURE POSITIONING

Never compete with the phone

Wearable capture grows at 14.1% and trail capture at 12.3% while pocket cameras competing on image quality against handsets grow at only 7.8%, which is as clear a signal as this category produces. Manufacturers positioning on situational capability rather than sensor specification report gross margin 2.1 times better than the field. A situation a phone cannot reach is not price-comparable against a phone the buyer already owns, and investing in sensor specification means competing on the one axis a phone always wins.
04 / STANDBY DRAIN DISCLOSURE

Flat when you reach for it

Only about 11% of products state the battery drain caused by persistent Bluetooth advertising in standby, and a device found flat at the moment of use is a satisfaction failure that never gets coded correctly anywhere. Manufacturers publishing standby figures and implementing duty-cycled advertising report battery-related complaints 3.4 times lower. The engineering is straightforward and the disclosure is uncomfortable, which is precisely why almost nobody does either, and wearable and trail formats spend far longer in standby than in capture.

Engagement Snapshot From the Field

A live engagement with an industry participant carrying material or product regulatory and market exposure ahead of a defining policy shift, showing how our research translates into a defensible multi-year portfolio strategy.
MARKET MINDS ADVISORY · CLIENT ENGAGEMENT SUMMARY
Bluetooth Photo Capture Device Producer Strategic Portfolio Review and Transition Roadmap 2026·Investment Scenario on Bluetooth Photo Capture Device Exposure Evaluation 2025-26
CLIENT PROFILE
A consumer electronics brand with capture device revenue near USD 96 million (client-reported, unverified by MMA) across North America, Western Europe, and East Asia. Return rates on its wearable range had risen for two consecutive years, and the product roadmap allocated most of the next cycle's budget to sensor and optics improvement. Connection engineering carried no dedicated budget line.
STRATEGIC CHALLENGE
Returns were coded by customer description rather than by measured cause, and the engineering team had read scattered complaints about image quality as the dominant signal. Nobody had reproduced the reported connection failures across the handset population the device claimed to support. No handset population testing had ever been run against a platform update.
MMA APPROACH
MMA recoded two years of returns by measured cause, reproduced pairing and handoff across a representative handset population, measured background transfer completion rates and standby drain on returned units, and modelled roadmap outcomes under sensor investment against connection engineering investment. Returned units were tested rather than relying on the return notes, so measured cause could be compared against what customers had written.
KEY FINDINGS
  1. Recoding returns by measured cause found connection and pairing failure behind a large majority, while image quality accounted for a small single-digit share of the total.
  2. Handoff failed reproducibly on several widely used handset models following an operating system update the brand had not tested against at any point.
  3. Background transfer completed in under a third of attempts across every handset tested, against an automatic sync claim printed on the packaging.
  4. Standby drain on the wearable exceeded the figure implied by published battery life by enough that a worn device frequently reached use flat.
CLIENT PROFILE
A consumer electronics brand with capture device revenue near USD 96 million (client-reported, unverified by MMA) across North America, Western Europe, and East Asia. Return rates on its wearable range had risen for two consecutive years, and the product roadmap allocated most of the next cycle's budget to sensor and optics improvement. Connection engineering carried no dedicated budget line.
STRATEGIC CHALLENGE
Returns were coded by customer description rather than by measured cause, and the engineering team had read scattered complaints about image quality as the dominant signal. Nobody had reproduced the reported connection failures across the handset population the device claimed to support. No handset population testing had ever been run against a platform update.
MMA APPROACH
MMA recoded two years of returns by measured cause, reproduced pairing and handoff across a representative handset population, measured background transfer completion rates and standby drain on returned units, and modelled roadmap outcomes under sensor investment against connection engineering investment. Returned units were tested rather than relying on the return notes, so measured cause could be compared against what customers had written.
KEY FINDINGS
  1. Recoding returns by measured cause found connection and pairing failure behind a large majority, while image quality accounted for a small single-digit share of the total.
  2. Handoff failed reproducibly on several widely used handset models following an operating system update the brand had not tested against at any point.
  3. Background transfer completed in under a third of attempts across every handset tested, against an automatic sync claim printed on the packaging.
  4. Standby drain on the wearable exceeded the figure implied by published battery life by enough that a worn device frequently reached use flat.
RECOMMENDED STRATEGY
Phase 1: Phase one: redirect the roadmap budget from sensor improvement into connection engineering, and establish continuous testing against platform updates. Fund it as continuous engineering rather than launch work. Phase 2: Phase two: withdraw the automatic sync claim, design onboarding around foreground transfer, and publish a maintained supported handset list. Maintain that list after every platform release. Phase 3: Phase three: implement duty-cycled advertising and publish standby drain alongside capture battery life on every product. Measure it under worn conditions rather than at rest.
OUTCOME
Return rates on the wearable range fell by roughly half within three quarters of the connection work shipping (client-reported, unverified by MMA). No sensor change was made. Measured cause coding is now standard across the brand's entire device portfolio. The next roadmap cycle allocated no budget to sensor improvement at all.

Frequently Asked Questions

Foundational context covering the market sizes, CAGR, scope, country, region and competition that inform every finding below. This section is provided to cover basics and most often pre-purchase conversations, answered from the MMA Primary Research Dataset.

What is the current size of the Bluetooth Photo Capture Device Market?

The market was worth USD 2.6 billion in 2025 and stands at USD 2.8 billion in 2026. Value covers standalone capture devices transferring through a paired phone at manufacturer selling price.

How large will the Bluetooth Photo Capture Device Market be by 2036?

MMA forecasts USD 6.9 billion by 2036, an increase of USD 4.1 billion across the forecast period. That represents 2.46 times the 2026 base of USD 2.8 billion.

What is the CAGR for the Bluetooth Photo Capture Device Market 2026 to 2036?

The base case compound annual growth rate is 9.4%, with a bull case at 10.7% and a bear case at 8.1%. Historical growth from 2020 to 2025 ran at 8.2%.

Which segment is growing fastest?

Wearable and clip-on capture devices grow at 14.1%, half again the market rate of 9.4%. Hands-free capture is something a phone genuinely cannot do at all.

Who are the major companies in the Bluetooth Photo Capture Device Market?

Fujifilm Holdings, GoPro, Canon, Insta360 and Polaroid lead the field. Together they hold 44% of category revenue, with Chinese manufacturers increasingly selling under their own labels.

Which country is growing fastest?

China grows at 13.6%, as manufacturing capacity and domestic consumer adoption expand together. The region produces very nearly all of the category's hardware, and domestic adoption is growing alongside that base.

Report Segmentation Architecture

The full report scope spans multiple orthogonal segmentation dimensions, with cross-tabulated demand data provided for each dimension pair. Coverage extends further to regional breakdowns, trend trajectories, and the competitive detail needed to support segment-level decision-making.

By Device Architecture

  • Pocket Tethered Cameras
  • Wearable and Clip-On Capture Devices
  • Action and 360 Capture Devices
  • Bluetooth Trail and Unattended Cameras
  • Instant Print Capture Units
  • Event and Photo Booth Capture Units

By End-Use Industry

  • Consumer Photography and Social Use
  • Adventure and Action Sports
  • Hunting and Wildlife Management
  • Property and Construction Monitoring
  • Events and Hospitality
  • Agriculture and Land Management

By Commercial Dimension

  • Consumer Electronics Retail
  • Direct to Consumer Online
  • Outdoor and Sporting Goods Channels
  • Social Commerce and Marketplace Channels
  • Commercial and Trade Distribution
  • Travel Retail and Gift Channels

By Region

  • East Asia
  • North America
  • Western Europe
  • South Asia and Pacific
  • Latin America
  • Middle East and Africa
  • Eastern Europe

Scope, Methodology, and Coverage

Every figure in this report is reproducible from documented input assumptions. The scope below maps the historical period, the forecast horizon, the segmentation dimensions, and the countries covered, alongside the underlying primary and qualitative methodology.
Historical Period
2020 to 2025
Forecast Period
2026 to 2036
Base Year
2025 (USD billions; MMA Primary Research Dataset, September 2026)
Market Definition
This market covers standalone camera devices whose primary image transfer path runs through a paired phone over Bluetooth, across pocket tethered cameras, wearable and clip-on capture devices, action and 360 capture devices, Bluetooth trail and unattended cameras, instant print capture units, and event and photo booth capture units. It excludes smartphones, wired-transfer-only cameras, professional interchangeable lens bodies, security and surveillance systems, and drones.
Quantitative Units
USD billions, revenue at manufacturer selling price
Segmentation Dimensions
Device architecture, end-use setting, commercial dimension, region
Regions Covered
East Asia, North America, Western Europe, South Asia and Pacific, Latin America, Middle East and Africa, Eastern Europe
Countries Covered
China, Japan, South Korea, Taiwan, United States, Canada, Mexico, Germany, France, United Kingdom, Italy, Spain, Netherlands, Sweden, Poland, Czechia, India, Indonesia, Thailand, Vietnam, Philippines, Australia, Brazil, Argentina, Colombia, Chile, Saudi Arabia, United Arab Emirates, Turkey, South Africa
Key Companies Profiled
Fujifilm Holdings, GoPro, Canon, Insta360, Polaroid, DJI, Ricoh, Nikon, Eastman Kodak, Xiaomi, Anker Innovations, Moment, Kandao, AKASO, GSM Outdoors, Vista Outdoor, Spypoint, Reolink, Wyze Labs, Snap Inc
Quantitative Methodology
Primary survey, n=3,800 respondents, Q4 2025, six countries; demand-side model with trade association cross-validation
Qualitative Methodology
47 expert interviews, Q4 2025; applied to validate demand model assumptions, identify emerging dynamics, and assess competitive positioning
Report Format
PDF and XLSX data workbook (Word format preview document)
Publisher
Market Minds Advisory
Report Code
MMA-2026-TEC-641
Published
September 2026
Contact
sales@marketmindsadvisory.com | www.marketmindsadvisory.com

Purchase the full Bluetooth Photo Capture Device Market Report (2026 to 2036).

The full report sizes the Bluetooth photo capture device market across six architectures, seven regions, and thirty countries, with forecasts to 2036 under base, bull, and bear cases. It separates devices that genuinely transfer over Bluetooth from those handing off to Wi-Fi, recodes returns by measured cause rather than customer description, and measures background transfer completion against platform power management. Competitive analysis covers twenty participants evaluated consistently on category revenue, with detailed treatment of connection engineering discipline and consumable attachment. Cost structure by supported handset breadth is analysed throughout. Primary research includes 3,800 survey responses and 47 expert interviews.
Six device architectures sized and forecast separately
Twenty participants evaluated on category revenue consistently
Actual transfer radio separated from marketed radio
Returns recoded by measured cause rather than customer description
Background transfer completion measured across handset populations
Standby drain disclosure practice assessed across the field

Built For The People Who Decide

From boardroom strategy to bench-side execution, this report is read cover-to-cover by leaders shaping the next decade of their industry, turning demand scenarios, market dynamics and valuation benchmarks into decisions.
CXOs/ Presidents/ VPs/ Managers
M&A and Corporate Development
Strategy Teams and R&D Heads
Procurement and Product Directors
Regulatory and Compliance Leaders
Investor Relations and Equity Analysts