
Market Minds Advisory
Blood Temperature Indicator Market

Blood Temperature Indicator Market Revenue Forecast 2026-2036

Blood banks and transfusion services are replacing single-use chemical freeze indicators with RFID-enabled temperature tags as regulators tighten cold-chain documentation requirements, turning a decades-old visual-check device into a connected data point blood centers must report.

Lead Analyst

Bilal Shaikh

Published

November 2026

Make Smarter Decisions with Customized Research Insights

Request a free sample report and evaluate market opportunities, growth trends, and competitive dynamics relevant to your business needs.

2025 MARKET VALUE$0.5BMarket Size 2025
2036 FORECAST VALUE$1.1BBase Case , 2026 to 2036
CAGR 2026 TO 20366.8 %Bull 8.0% / Bear 5.5%
INCREMENTAL OPPORTUNITY$0.5BNet 10- year value creation
EXPANSION MULTIPLE1.93x2036 value over 2026 base
Strategic Levers
M&A Pipeline
Regional Outlook
Country Rankings
Competitive Intelligence
Segmental Deep-dive
Call-Us : 91 93563 13602

Blood Temperature Indicator Market Snapshot

Blood banks are moving away from simple visual freeze indicators toward connected temperature tags that feed directly into electronic blood-management systems, as regulators and accreditation bodies push transfusion services toward continuous, auditable temperature records rather than the single pass-fail check a chemical indicator still provides to staff today.
Commercial pressure comes from three directions: blood collection volumes rising steadily across aging populations needing more transfusions, accreditation bodies tightening documentation requirements for every unit's cold-chain history, and hospital blood banks replacing paper-based spot checks with electronic systems that need machine-readable temperature data rather than a human-read color change. RFID-enabled temperature tags are the fastest-growing of six tracked product types, concentrated in blood centers already running electronic inventory-management systems at scale.
Competitively, diversified medical-device manufacturers with broad hospital-supply relationships compete against specialist cold-chain monitoring firms built entirely around temperature verification. Regulatory tailwinds are building on two fronts: tightening blood-safety documentation rules in the United States and European Union, and accreditation bodies increasingly requiring electronic rather than paper temperature records, which favors RFID and electronic logger formats over the simple chemical indicators that dominated this category for decades.
Market Definition
The blood temperature indicator market covers single-use chemical freeze indicators, reusable electronic temperature loggers, RFID-enabled temperature tags, and time-temperature integrator labels used to monitor blood and blood component temperature during collection, storage, and transport. It excludes general-purpose industrial temperature sensors and cold-chain monitoring devices used outside blood banking and transfusion services. For a connected opportunity, MMA values the time temperature indicator labels market at USD 0.8 billion in 2025.
Base Year Value
$0.5B in 2025 (MMA Primary Research Dataset, October 2026)
Forecast Period
2026 to 2036, eleven discrete annual values
CAGR
6.8% base case. Bull 8.0%. Bear 5.5%.
Fastest Growth Segment
RFID-Enabled Temperature Tags for Blood Units: 9.8% CAGR
Fastest Growth Country
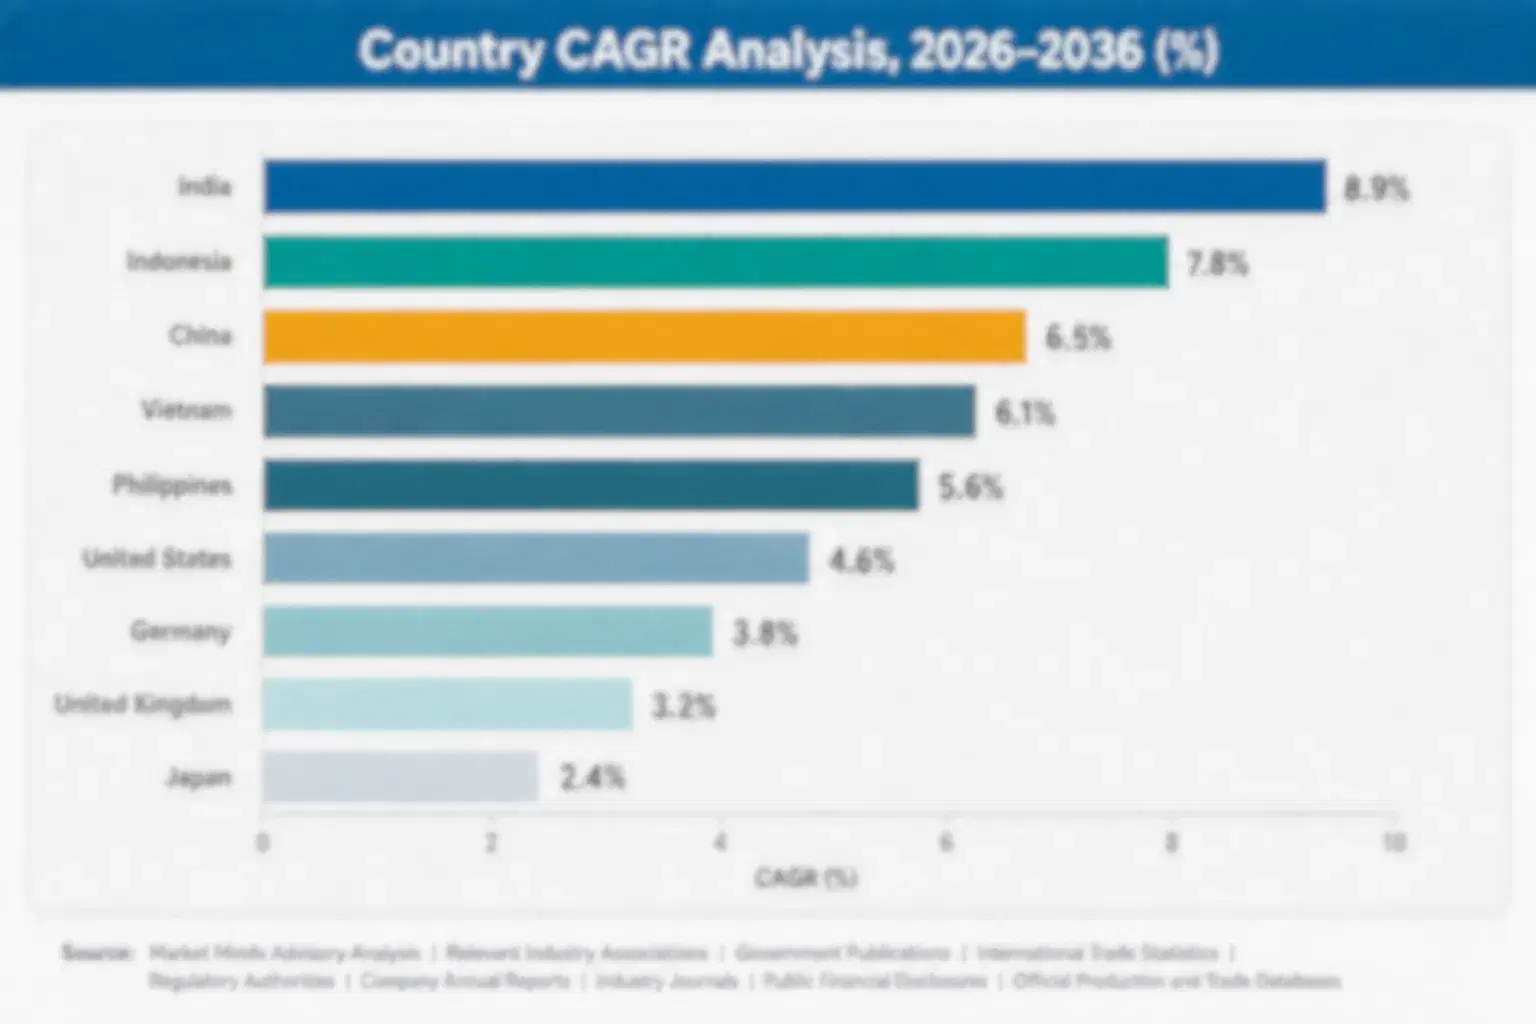
India: 9.3% CAGR
Fastest Growth Region
South Asia and Pacific: 8.8% CAGR
Largest Region
North America: 30% of 2025 global value
Market Leaders
3M Company, Temptime Corporation, Haemonetics Corporation, Terumo BCT Inc., Fresenius Kabi AG. Source: MMA Analysis based on company annual reports.
Primary Survey
n=3,800 procurement and R&D decision-makers, Q4 2025, six countries
Methodology
Demand-side build-up, cross-validated against public data, 47 expert interviews

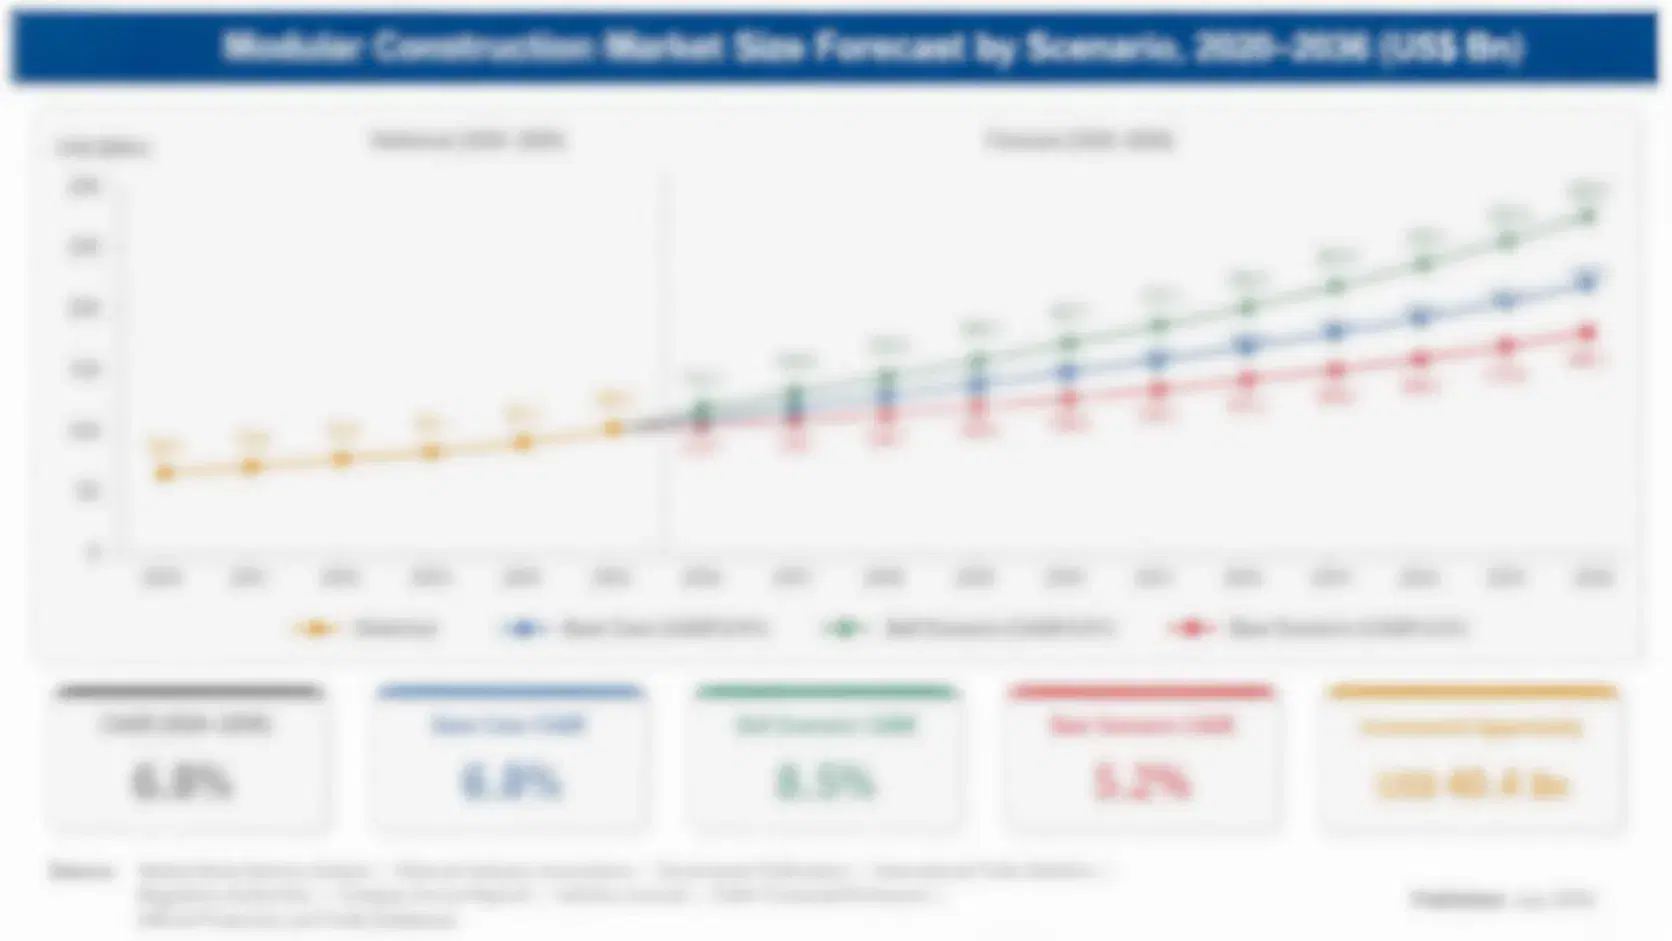
Blood Temperature Indicator Market Forecast to 2036

blood-temperature-indicator-market-share-analysis-size-forecast-scenario-1791557179906
Between 2020 and 2025, blood temperature indicator demand grew steadily alongside rising transfusion volumes, with chemical freeze indicators remaining the dominant format for most of the period as electronic and RFID alternatives stayed confined to larger, better-funded blood centers testing new systems well ahead of any broader rollout decision across the wider market even as a handful of leading centers pushed ahead.
The base case assumes three mechanisms hold through 2036: transfusion volumes keep rising with aging populations, accreditation bodies keep tightening electronic documentation requirements that favor RFID and logger formats, and blood centers keep consolidating inventory-management systems that need machine-readable temperature data rather than a visually read color change. Together these push RFID-enabled tags from a premium niche into a standard specification across most mid-size and large blood centers within the forecast window.
The bull case assumes accreditation bodies formally mandate electronic temperature records across all blood centers within five years, pulling RFID adoption sharply higher industry-wide. The bear case assumes budget-constrained blood centers in smaller markets continue relying on low-cost chemical indicators well past the forecast window, limiting RFID adoption to the largest, best-funded transfusion services, a split that could persist for years without a clear catalyst.

Why Cold-Chain Documentation Is Going Electronic

Blood temperature indicators sit at the intersection of two slow-moving but steady forces: rising transfusion volumes driven by aging populations, and accreditation and regulatory bodies pushing blood banks toward continuous, electronically auditable cold-chain records rather than the single pass-fail check a chemical indicator provides. Manufacturers that once sold simple color-change strips are now qualifying RFID-tag and software-integration capability, a step requiring electronics-testing relationships legacy indicator makers never needed. Readers tracking this shift may also follow the Japan time temperature indicator label market, which MMA sizes at USD 0.6 billion in 2025, growing at 8.7% a year.
TOP PRODUCING COUNTRY SHARE27%United States anchors the largest share of qualified production
MARKET CONCENTRATION (CR5)44%Top five manufacturers hold under half of volume
AVERAGE SELLING PRICE$1.85 per unitElectronic tags price well above basic chemical formats
CAPACITY UTILIZATION71%Specialist converters run below broader medical device utilization
FEEDSTOCK SHARE OF COGS34%Chemical reagents and electronic components dominate unit cost
TRADE INTENSITY48% cross-borderFinished indicators often cross borders before final distribution
Commercially, this remains a specialist medical-device category rather than a broad commodity one. A handful of diversified manufacturers and cold-chain specialists dominate qualified volume, while software providers increasingly capture a growing share of total programme value as blood centers demand data integration alongside physical tags. Average selling prices for electronic and RFID formats run several multiples above chemical indicators, and regulatory qualification speed, not unit price, increasingly determines which suppliers win blood-center contracts.
Over the next decade, expect electronic and RFID formats to displace chemical indicators gradually across mid-size and large blood centers, while smaller, budget-constrained centers in lower-income markets continue relying on low-cost chemical indicators well past the forecast window. Regulatory convergence between US and EU blood-safety documentation rules will likely standardize electronic record requirements faster than manufacturers currently expect.
"A chemical strip tells you whether a unit froze; a connected tag tells you exactly when, for how long, and who was supposed to catch it. Accreditors have made clear which answer they now expect on file."
Director, Medical Device and Cold-Chain Diagnostics Practice · MMA Medical Devices & Diagnostics Practice · October 2026

Blood Temperature Indicator Technology Trends

Electronic Blood Management Systems Pull In RFID Tags

Hospital and regional blood banks are replacing paper-based inventory logs with electronic blood-management software that tracks each unit from collection through transfusion, and these systems increasingly require machine-readable temperature data rather than a visually inspected chemical indicator a technician must manually record. RFID-enabled temperature tags integrate directly with these systems, letting staff scan a unit and automatically pull its full cold-chain history rather than searching a paper log. Blood centers running electronic management software adopt RFID tags faster than paper-based centers, since the software investment creates an incentive to pair it with a machine-readable indicator.
Market Impact: Lifts transfusion volume by roughly 15%
Accreditation Bodies Tighten Documentation Rules Fast

Blood-banking accreditation bodies in the United States and equivalent authorities across the European Union have tightened cold-chain documentation requirements over the past several years, moving from periodic spot checks toward continuous temperature records for every stored unit. This shift is pushing blood centers toward electronic loggers and RFID tags that generate a continuous record automatically, rather than chemical indicators that only confirm a single threshold was or was not crossed. Centers facing accreditation renewal are increasingly required to demonstrate continuous monitoring capability, creating a compliance-driven upgrade cycle that chemical-indicator-only centers now have to budget for directly. On MMA's numbers, the temperature loggers market stands at USD 1.1 billion in 2025 and is on track for USD 2.54 billion by 2036.
Market Impact: Cuts tag cost by roughly 25%

Where the Blood Temperature Indicator Opportunity Lies

Aging Populations Lift Transfusion Volumes Steadily

Transfusion volumes are rising steadily across most major healthcare systems as aging populations require more surgical procedures, cancer treatments, and chronic-condition management that depend on blood and blood-component availability. National blood collection agencies in several major markets have reported multi-year increases in both collection and transfusion volume, directly lifting demand for every unit of indicator or tag applied per collected blood bag regardless of format. This demographic driver is durable rather than cyclical, meaning indicator volume tracks population aging more closely than short-term healthcare spending cycles, giving manufacturers a predictable demand baseline.
Market Impact: Delays upgrades by roughly 4 years

Falling Electronics Costs Broaden RFID Adoption

RFID chip and tag costs have fallen meaningfully over the past several years as broader RFID manufacturing scale, driven by retail and logistics adoption elsewhere, pulled component costs down across all RFID-dependent categories including blood-banking tags. This is bringing RFID-enabled indicators within reach of mid-size blood centers that could not previously justify the cost premium over chemical indicators, broadening the addressable market beyond the largest, best-funded regional blood centers that drove early adoption. Manufacturers who can hit lower per-tag pricing at volume are positioned to capture this broader, more price-sensitive demand as smaller centers begin budgeting for upgrades.
Market Impact: Adds cost across 3 regulatory regimes

Blood Temperature Indicator Growth Barriers

Budget Constraints Slow Upgrades at Smaller Centers

Smaller and rural blood centers, along with transfusion services in lower-income markets, continue relying on low-cost chemical indicators because budget constraints make the multiple-fold cost premium of electronic and RFID formats difficult to justify against other capital priorities. The root cause is funding structure: many smaller centers depend on hospital capital budgets that prioritize direct patient-care equipment over cold-chain upgrades, leaving indicator technology near the bottom of competing requests. This creates a two-speed market where large centers upgrade quickly while smaller ones lag. Manufacturers are mitigating this with tiered pricing and lease-based programmes that spread cost over a multi-year contract.
Market Impact: Adds tags across 150+ centers

Regulatory Harmonization Across Regions Remains Incomplete

Blood-safety documentation requirements differ meaningfully between the United States, European Union, and other major markets, forcing manufacturers selling internationally to qualify multiple indicator formats and data standards rather than one global specification. The underlying cause is that blood-safety regulation historically developed independently within each major health system, without anticipating the electronic cold-chain convergence now underway across categories. This adds qualification cost and timeline for multinational manufacturers relative to single-market specialists who only need to satisfy one regulatory regime. Industry groups are pushing toward harmonized standards, though manufacturers are not waiting and are qualifying region-specific formats instead for now.
Market Impact: Requires records for 100% of units
3 additional market trends, 2 additional growth drivers, and 4 additional restraints and challenges are covered in the full report. Contact sales@marketmindsadvisory.com to access the complete intelligence.

Blood Temperature Indicator Segment CAGR Comparison

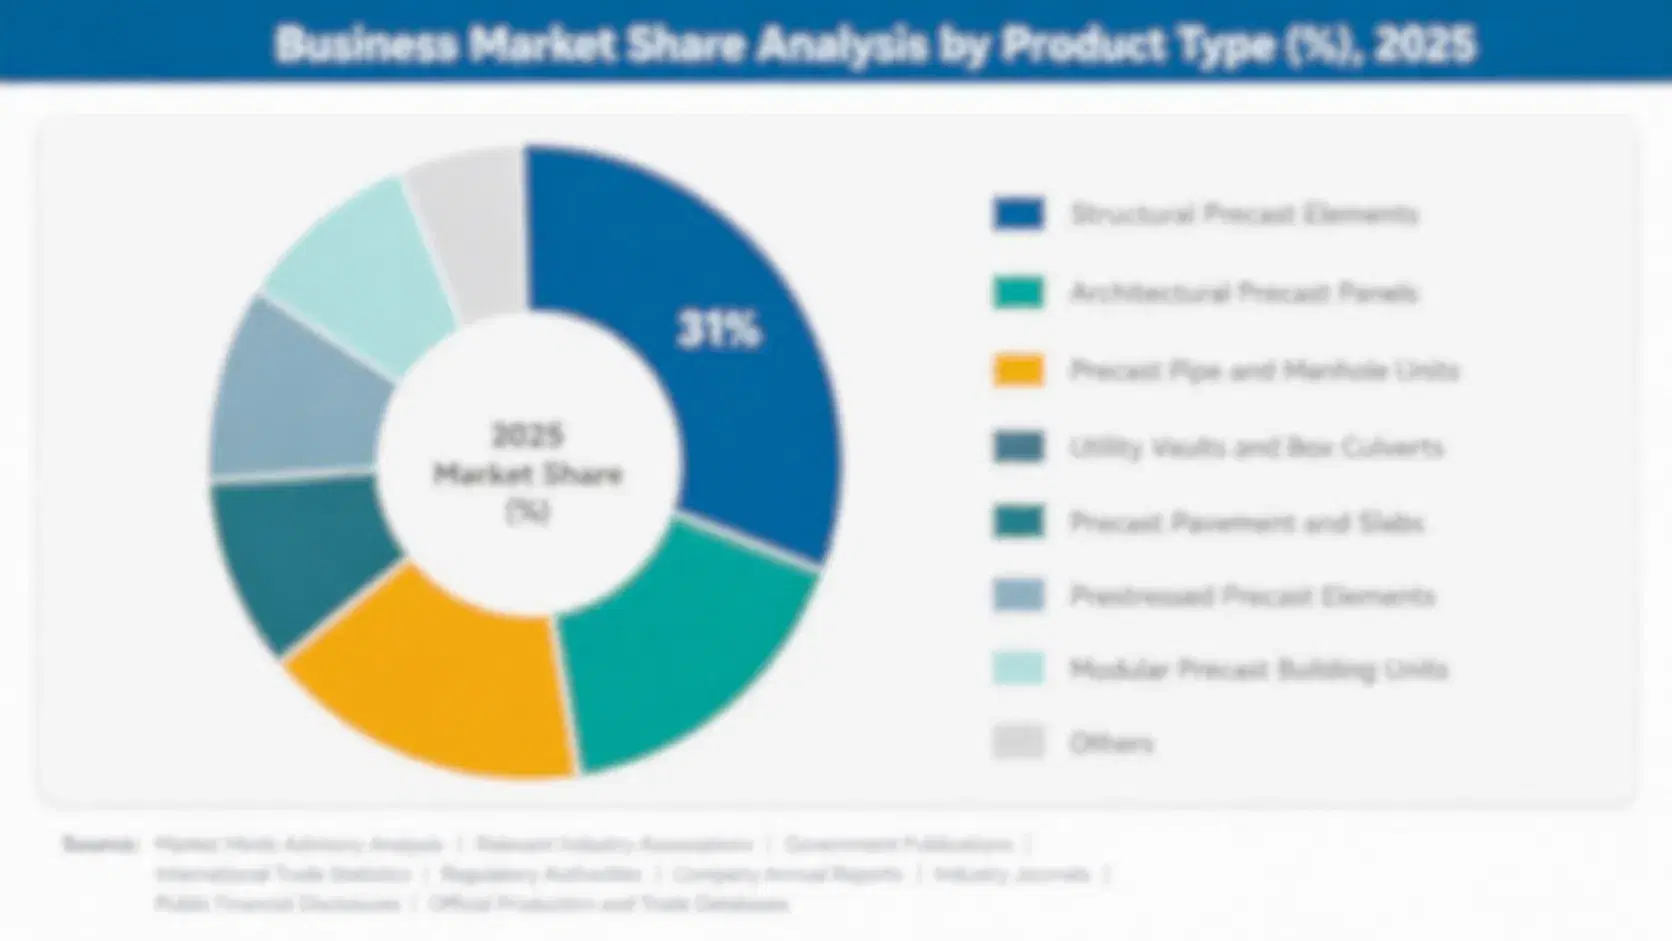
MMA segments the blood temperature indicator market by product and technology type rather than by blood component, since the same indicator, tag, or logger technology applies across whole blood, plasma, and platelet storage once a center selects a monitoring format. Six types are tracked; RFID tags and software platforms grow fastest as documentation requirements scale.
blood-temperature-indicator-market-share-analysis-market-share-analysis-1791557180285

RFID-Enabled Temperature Tags for Blood Units

RFID-enabled temperature tags combine a passive or battery-assisted RFID chip with temperature-sensing capability, letting staff scan a blood unit to pull its complete cold-chain history directly into an electronic blood-management system rather than reading a chemical color change manually. Demand concentrates among blood centers that have already deployed electronic inventory-management software, where the tag becomes the natural machine-readable counterpart to a system already in place. Growth runs well ahead of every other tracked product type because accreditation bodies are simultaneously tightening documentation requirements and electronics costs are falling, a rare combination pulling adoption from two directions at once across the forecast period. Manufacturers who integrate tag data directly into existing software are winning the largest multi-year contracts.
CAGR 9.8%

Cold Chain Monitoring Software and Data Platforms

Cold chain monitoring software and data platforms aggregate temperature readings from tags and loggers across a blood center's full inventory, generating the continuous, auditable records accreditation bodies increasingly require rather than a collection of individual paper logs. Demand concentrates among larger regional blood centers and hospital networks managing inventory across multiple storage sites, where a centralized platform replaces what would otherwise be fragmented site-by-site paper or spreadsheet tracking. Growth trails RFID tags only slightly as centers increasingly view software as the compliance deliverable. Providers who can demonstrate smooth, well-documented integration with existing hospital information systems are winning the largest multi-year platform contracts from centers consolidating their monitoring vendor base at this stage of hardware deployment across the broader market.
CAGR 8.9%
Full segment breakdown across 6 segments available in the complete report.

Blood Temperature Indicator Regional Outlook

Demand concentrates where transfusion volumes and blood-banking infrastructure investment are largest. North America and East Asia lead on qualified volume tied to large transfusion networks, while South Asia and Pacific is expanding fastest as blood-collection infrastructure modernizes and electronic documentation requirements spread beyond their original pilot markets.

North America

The United States drives the overwhelming majority of North American demand, reflecting both the largest transfusion volume of any single national market and the earliest accreditation-driven push toward electronic cold-chain documentation anywhere in the world. Major blood-collection organizations operating nationally have already deployed electronic blood-management systems at most large collection and distribution centers, creating the installed software base RFID tags increasingly plug into directly. Accreditation renewal cycles are a recurring upgrade trigger, as centers facing renewal must increasingly demonstrate continuous monitoring capability rather than periodic spot checks. Canada's contribution is smaller but follows largely similar accreditation and procurement patterns, given close integration between the two countries' blood-supply systems and shared manufacturer relationships.
Share: 30% | CAGR: 7.0% (2026 to 2036)

Western Europe

Regulatory harmonization under European Union blood-safety directives, more than pure transfusion-volume growth, defines Western Europe's position in this market. Germany and France host the largest concentration of regional blood-collection infrastructure, managing documentation requirements that increasingly mirror the continuous-monitoring expectations accreditors apply elsewhere. The United Kingdom's National Health Service blood service has moved independently on electronic cold-chain tracking, somewhat ahead of the broader EU regulatory timeline in several respects. Growth here trails East Asia and North America because transfusion-volume growth is slower in an already mature, well-established blood-banking system, though the region's regulatory output still influences documentation standards other markets eventually adopt as they modernize their own systems as they build out their own continuous-monitoring capability over the coming decade.
Share: 23% | CAGR: 5.2% (2026 to 2036)
Regional intelligence for 5 additional markets available in the complete report: East Asia, South Asia and Pacific, Latin America, Middle East and Africa, Eastern Europe. Contact sales@marketmindsadvisory.com.
blood-temperature-indicator-market-share-analysis-country-cagr-analysis-1791557180574

Where Indicator Makers Can Capture Margin

Manufacturers compete on regulatory qualification speed and software-integration capability more than on unit price, which opens several routes to margin above the category average. The clearest paths run through electronic blood-management software partnerships, lease-based tag programmes, accreditation-compliance bundling, and multi-region regulatory qualification, each commanding a premium blood centers will pay to simplify compliance to vendors who already hold the relationship.

Partner Directly With Blood Management Software Vendors

Manufacturers that build direct integration partnerships with electronic blood-management software vendors can price RFID tags as part of a bundled data solution rather than a standalone physical indicator, capturing margin on both the tag and the integration service itself. Early entrants into these partnerships have priced the combined offering at roughly 2 to 3 times standalone tag pricing, reflecting the value blood centers place on dependable, uninterrupted data flow into systems they already use daily. This positions manufacturers as integration partners rather than commodity indicator vendors in the eyes of blood-center procurement teams.
Market Impact: Prices bundled offering at 2 to 3x standard

Offer Lease-Based Tag Programmes for Smaller Centers

Manufacturers are offering lease-based or subscription pricing for RFID tag programmes, spreading the electronics cost premium over a multi-year service contract rather than requiring a large upfront purchase smaller blood centers struggle to justify against competing capital priorities. This approach has opened roughly 20% more addressable centers than upfront-purchase pricing alone would reach, since it removes the single largest barrier smaller centers cite when evaluating an upgrade from chemical indicators. Manufacturers who moved first on lease-based pricing are capturing smaller-center volume competitors pursuing only upfront sales cannot reach Several large regional networks have already adopted this pricing structure.
Market Impact: Opens roughly 20% more addressable centers right now

Bundle Accreditation Compliance Reporting With Supply

Manufacturers are bundling accreditation-ready compliance reporting, formatted specifically for renewal audits, as a service layered on top of core tag and indicator supply, saving blood-center quality teams the work of assembling documentation manually from raw temperature data. This has created a recurring revenue line priced separately from unit cost, with early programmes charging centers a service fee representing roughly 10 to 15% of total annual tag spend. Centers value this because it turns a compliance burden into a vendor-managed deliverable, and manufacturers value the resulting revenue stickiness Centers increasingly expect this as a standard part of any new supply contract.
Market Impact: Charges 10 to 15% of annual tag spend

Build Multi Region Qualification Capability Early

Manufacturers selling into both the United States and European Union currently need to qualify against different documentation standards, and manufacturers who can qualify both specifications on shared tooling save multinational blood-center networks a meaningful share of what would otherwise be duplicated qualification cost. This capability currently commands a premium of roughly 15% over single-region specialists, since multinational networks avoid managing two separate vendor relationships for functionally the same product. Manufacturers who move first on harmonized qualification are winning multinational contracts smaller regional specialists cannot bid on This advantage is expected to persist for several more years.
Market Impact: Commands roughly a 15% premium right now today

Blood Temperature Indicator Margin Pool

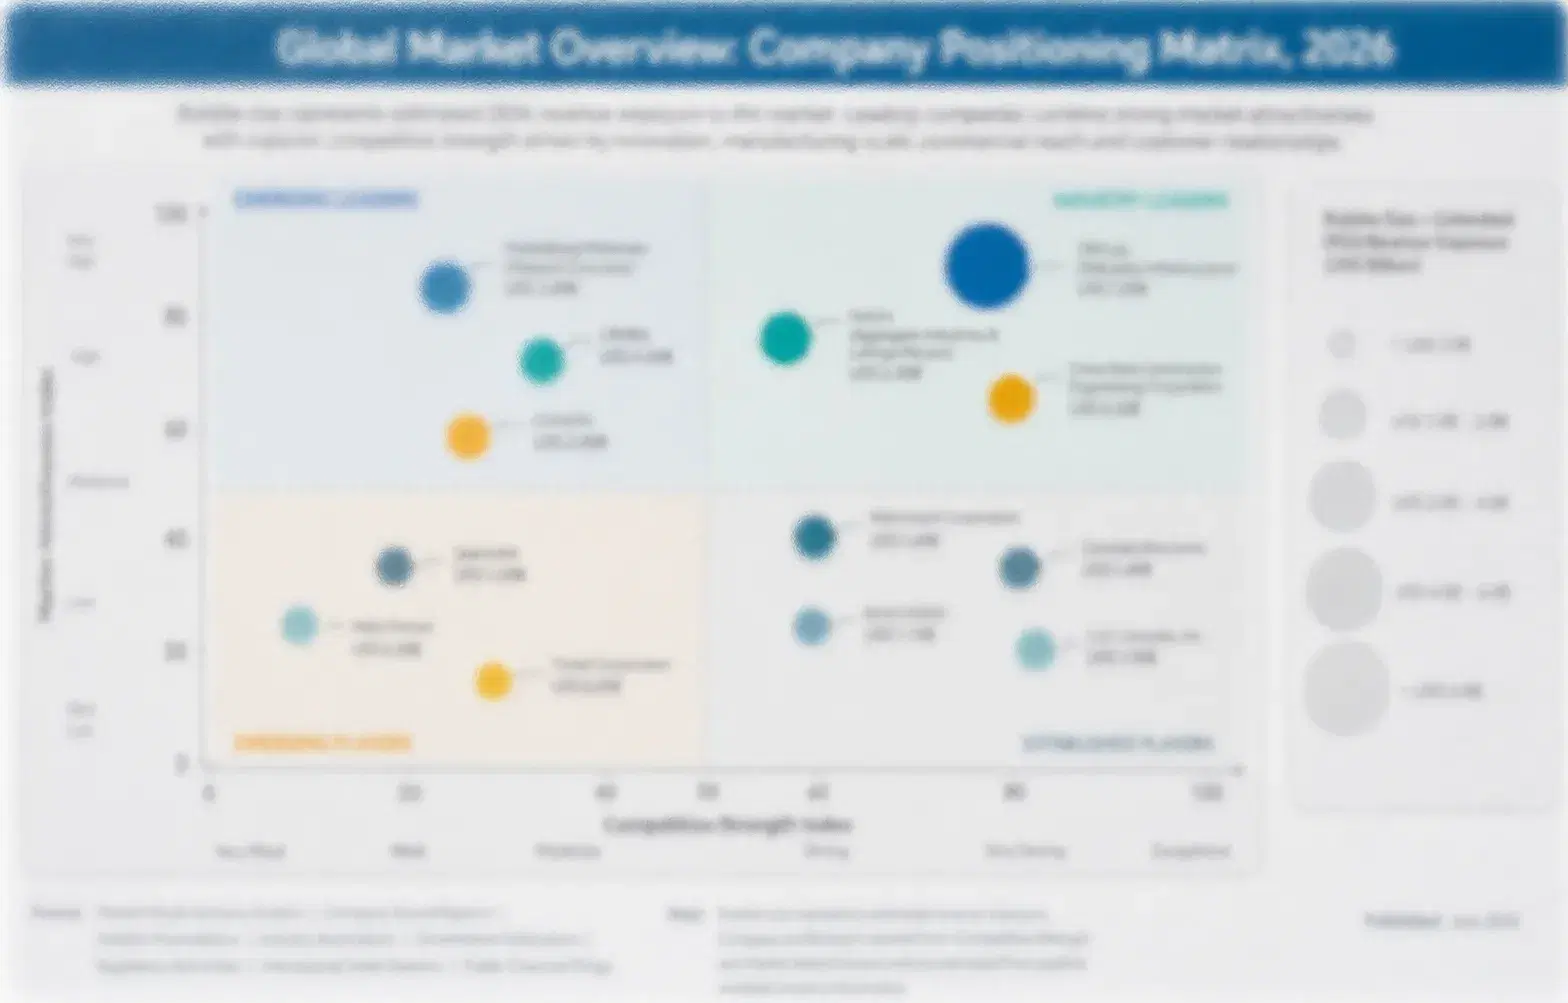
The competitive set is moderately concentrated around a mix of diversified medical-device manufacturers and cold-chain specialists. CR5 sits at 44%, with 3M and Temptime Corporation holding the leading qualified positions, while a long tail of regional cold-chain monitoring firms compete for remaining volume. The gap between the leaders and the next tier is widening as software-integration capability becomes as important as core indicator manufacturing.
Current competitive activity centers on three fronts: blood-management software integration partnerships that convert manufacturers into data partners, lease-based tag programmes that broaden the addressable base of smaller centers, and accreditation-compliance reporting bundled directly with core supply. Several mid-size manufacturers have also begun offering multi-region regulatory qualification as a standalone capability, treating harmonized compliance as a competitive differentiator rather than a back-office cost.

Emerging pressure comes from cold-chain software specialists expanding into physical tag supply, competing against indicator manufacturers adding software and compliance-service capability from the other direction. Expect consolidation over the next several years as these approaches converge, with manufacturers acquiring software capability or software specialists acquiring tag-manufacturing capacity, rather than either side building the other's core competency from scratch on a timeline neither can afford given how quickly accreditation requirements are tightening.
blood-temperature-indicator-market-share-analysis-company-positioning-matrix-1791557180898

Blood Temperature Indicator Competition and Risks

3M COMPANY

Moat: Diversified Distribution Scale

3M's broad existing hospital and blood-bank supply relationships, built across its wider medical-products portfolio, give it default-vendor access to blood-center procurement teams that specialist indicator makers must earn account by account. This distribution reach lets it bundle indicators into existing medical-supply contracts rather than competing for standalone bids.
3M COMPANY

Risk: Low Differentiation Versus Rivals

3M's blood temperature indicator line carries less specialized differentiation than focused cold-chain specialists, leaving it more exposed to price competition on chemical indicators even as it works to build out RFID and software-integration capability to match specialist competitors already active in that space, a gap it is actively working to close through partnerships.
TEMPTIME CORPORATION

Moat: Patented Freeze Indicator Chemistry

Temptime holds a deep patent portfolio covering chemical freeze-indicator formulations built over decades of blood-bank and vaccine cold-chain qualification, and its backing by Zebra Technologies gives it a natural path into RFID integration that pure chemical-indicator competitors lack. This combination lets it bridge legacy and electronic formats more credibly than either a pure chemical specialist or a pure RFID entrant.
TEMPTIME CORPORATION

Risk: Narrow Product Line Exposure

A substantial share of Temptime's revenue concentrates in temperature-indicator products specifically, leaving it more exposed than diversified competitors like 3M if blood centers consolidate purchasing toward broader medical-supply bundles rather than specialist single-category vendors over the coming years, a risk its recent RFID product launch is explicitly designed to offset.

Players Tracked

Prominent Players

3M Company
Temptime Corporation
Haemonetics Corporation
Terumo BCT Inc.
Fresenius Kabi AG

Other Key Players

Macopharma SAS
Grifols S.A.
Berlinger & Co. AG
Controlant
Sensitech Inc.
Cold Chain Technologies LLC
Testo SE & Co. KGaA
Dickson
LogTag Recorders Ltd
DeltaTrak Inc.
Vaisala Oyj
Rotronic AG
Emerson Electric Co.
Elpro-Buchs AG
Monnit Corporation

Recent Developments

MARCH 2025

Temptime Launches RFID-Integrated Freeze Indicator Line

Temptime Corporation introduced a new product line combining its patented chemical freeze-indicator chemistry with an integrated RFID chip, letting blood centers scan a unit for both visual confirmation and electronic record-keeping simultaneously. The launch followed two years of qualification work with several large regional blood-collection networks.
Signal: Signals that hybrid chemical-and-electronic formats, not pure RFID replacement, may bridge the transition for many centers.
SEPTEMBER 2024

3M Expands Blood-Bank Supply Bundle With Cold-Chain Software Partner

3M Company formalized a partnership with a cold-chain software provider to offer bundled temperature-monitoring and data-integration services alongside its existing blood-bank indicator supply contracts. The move followed requests from large hospital network customers seeking to consolidate vendor relationships across their full facility portfolio across every covered region.
Signal: Signals that diversified manufacturers are racing to match specialist software-integration capability directly and quickly across the industry overall.
JUNE 2025

Indian Health Authority Mandates Electronic Cold-Chain Records

India's national health authority announced a phased mandate requiring electronic, continuous temperature records for blood units at major collection centers, moving away from chemical-indicator-only documentation over a multi-year implementation timeline. Several manufacturers are competing for qualification across the newly mandated centers, with full implementation expected over the following three years.
Signal: Signals that accreditation-style mandates are spreading beyond the United States and European Union into emerging markets.

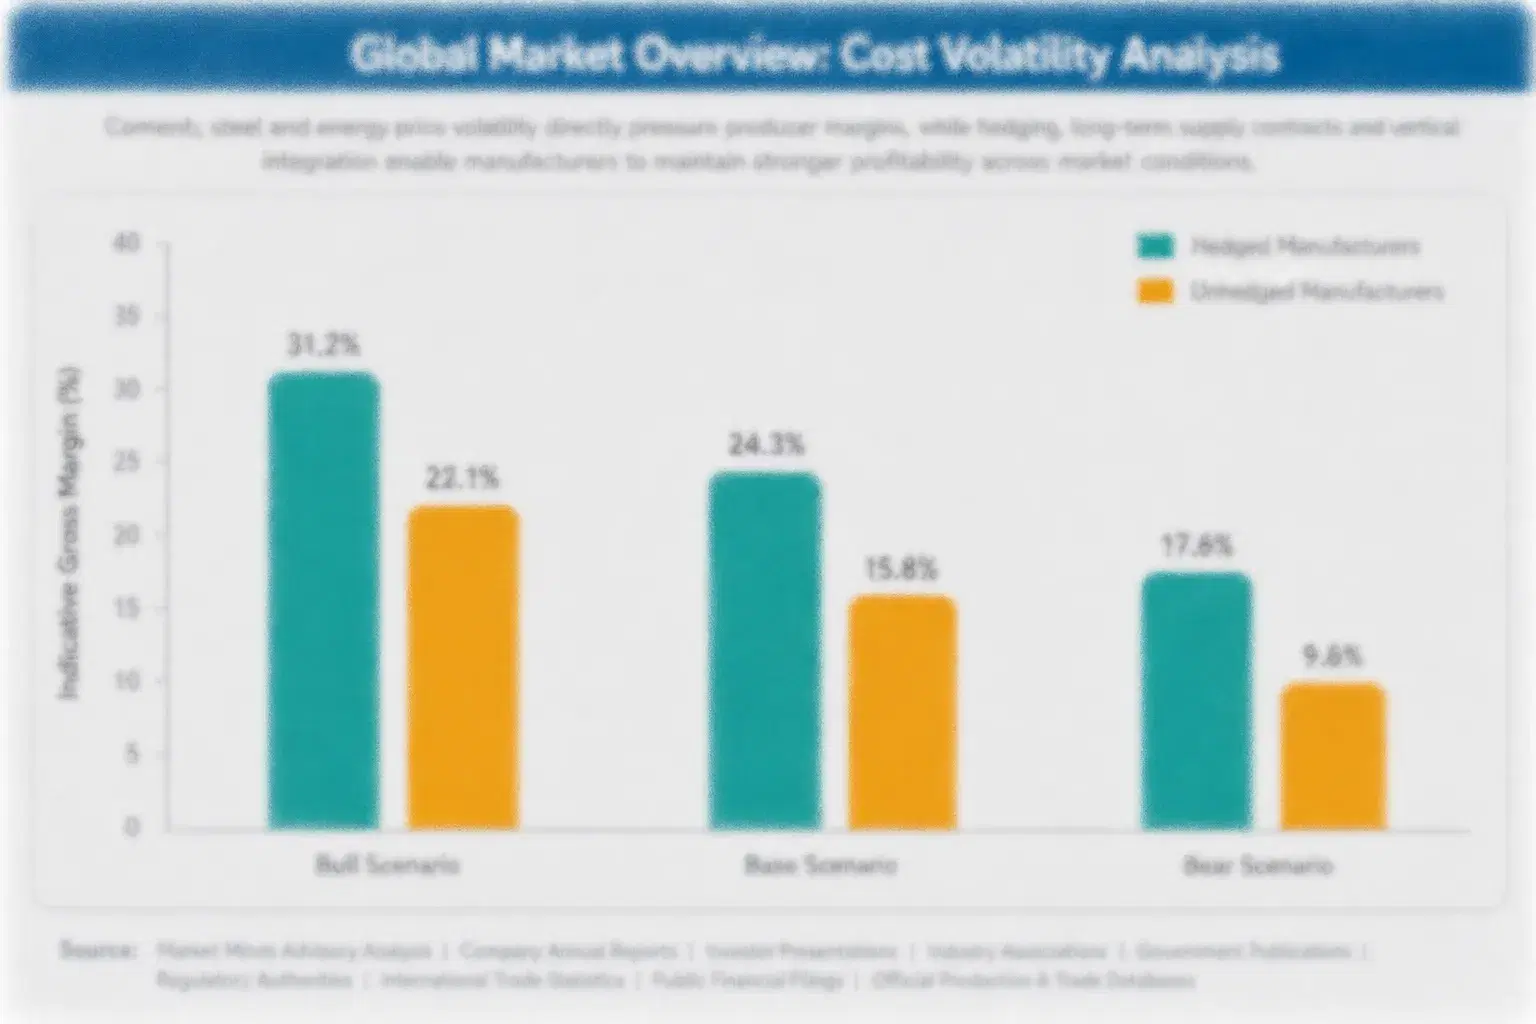
Reagent and Electronics Costs Drive Margin

Chemical reagents and electronic components together account for roughly 34% of converted indicator cost, with chemical reagents sourced predominantly from specialty chemical suppliers and RFID chips and electronic components sourced from the same semiconductor supply chains serving broader retail and logistics RFID demand. Packaging and sterile-barrier materials remain a secondary input, largely similar across formats.
RFID chip costs fell meaningfully over the past several years as broader retail and logistics RFID manufacturing scale pulled component costs down across all RFID-dependent categories, a trend reflected in semiconductor-industry cost data tracked by national statistical offices in major chip-producing economies. Manufacturers who locked in volume-based component pricing early captured outsized margin benefit as unit costs fell faster than contracted pricing adjusted downward, a gap that is now narrowing as more manufacturers renegotiate their supply agreements.

Smaller specialist manufacturers without direct relationships to major chip and reagent suppliers face a meaningful cost disadvantage, since they typically source through distributors at a markup larger diversified manufacturers avoid through direct volume agreements. This gap is most pronounced for manufacturers serving budget-constrained smaller blood centers, where thinner procurement budgets leave less room to absorb a distributor markup than well-funded large regional centers can tolerate comfortably.
blood-temperature-indicator-market-share-analysis-cost-volatility-analysis-1791557181238

Lock in Volume-Based Component Pricing Agreements Early

Larger manufacturers increasingly negotiate multi-year volume-based pricing directly with chip and reagent suppliers rather than relying on distributor purchasing, capturing the benefit of continued cost deflation as it occurs rather than renegotiating annually through an intermediary layer across their production base. Several manufacturers have already renegotiated agreements on these terms across most of their supplier base already.

Qualify a Second Chip Supplier in a Different Region

Several manufacturers are qualifying a second RFID chip source outside their primary sourcing region, specifically to avoid single-region exposure to any future trade or supply disruption affecting semiconductor components broadly across their global production footprint and customer base. This has already shortened recovery time after one regional shock following one recent regional disruption affecting competitors broadly.

Standardize Reagent Formulations Across Product Lines

Manufacturers are standardizing chemical reagent formulations across multiple indicator product lines where regulatory approval allows, reducing the number of distinct formulations they must qualify and stock, which lowers both inventory carrying cost and the regulatory testing burden tied to maintaining several parallel specifications while easing the overall regulatory testing burden considerably while easing the overall regulatory testing burden considerably further.

Portfolio Architecture for Margin Defence

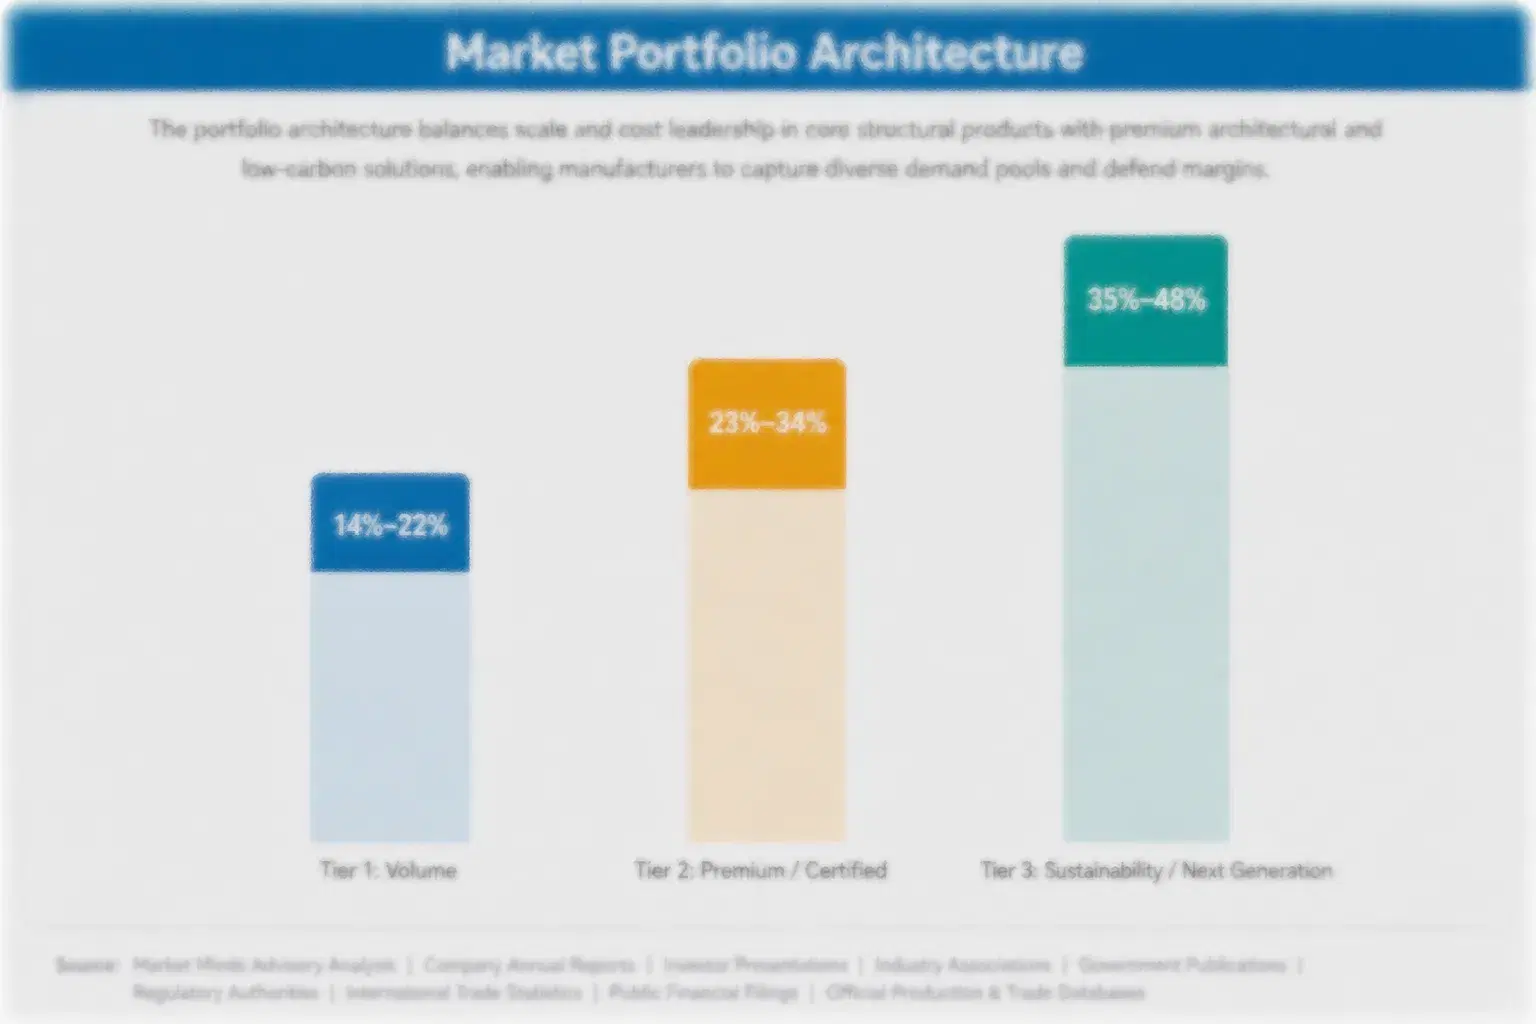
Blood temperature indicators split into three commercial tiers with sharply different margin profiles. Volume commodity-adjacent indicators, standard single-use chemical freeze indicators, carry gross margins typical of mature medical-consumable products. Premium certified packaging, covering RFID-enabled tags and software-integrated formats, commands gross margins several multiples above that. Sustainability and next-generation formats, including combined sensor-and-software platforms, sit at the top of the margin range as blood centers pay for integration rather than separate components.
The tension running through this architecture is capacity allocation. Manufacturers that invested early in RFID and software-integration capability can redirect volume toward premium accounts paying several multiples the standard margin, while generalist manufacturers remain confined to the lower-margin chemical-indicator tier competing primarily on price. Several mid-size manufacturers are deliberately shrinking their standard chemical-indicator book to free capacity for premium electronic work as accreditation-driven demand scales faster than chemical-indicator volume.

High-value margin pools concentrate in RFID-enabled tagging and in combined sensor-and-software platforms for larger blood-center networks, both growing faster than the category average. Manufacturers positioned in both pools simultaneously, rather than just one, are capturing the largest share of new premium qualification wins as blood centers consolidate toward fewer, more capable monitoring partners overall.

Volume / Commodity-Adjacent Tier

Standard single-use chemical freeze indicators sold primarily on price with minimal differentiation, serving budget-constrained and smaller blood centers where buyers compete mainly on unit cost and supply reliability across most purchasing cycles.
Gross Margin: 22-26%

Premium / Certified Tier

RFID-enabled tags and electronic loggers integrated with blood-management software, serving mid-size and large blood centers where regulatory qualification and data-integration capability, not price, determine the winning vendor across most renewal cycles.
Gross Margin: 40-46%

Sustainability / Regulatory / Next-Generation Tier

Combined sensor-and-software platforms delivering continuous, accreditation-ready documentation as a managed service, commanding the highest margins as blood centers prefer one accountable partner over separately sourced components across their full network.
Gross Margin: 46-52%
blood-temperature-indicator-market-share-analysis-portfolio-architecture-1791557181701

High-value Sub-segments and Strategic Watch-out

RFID-Enabled Tagging for Large Blood Networks

RFID-enabled temperature tags integrated with electronic blood-management software are both the highest-margin and fastest-growing segment tracked, as accreditation requirements tighten and electronics costs fall simultaneously, pulling adoption from two directions at once across large blood-center networks across most large networks currently evaluating upgrades across most large networks currently.
Gross Margin: 42-48%

Accreditation-Ready Software Reporting Platforms

Software platforms generating accreditation-ready compliance documentation carry strong margin from the service layered on top, but unit-volume growth is moderate relative to RFID tags because software adoption depends on centers first deploying compatible hardware at this early stage of hardware deployment broadly at this early stage of broader hardware deployment.
Gross Margin: 38-44%

Standard Chemical Freeze Indicators

The largest unit-volume segment by far, serving budget-constrained and smaller blood centers on thin, price-competitive margins, remains the revenue base most manufacturers depend on even as they reinvest proceeds into higher-margin electronic categories as budget-constrained centers continue relying on it as budget-constrained centers continue relying on it each year.
Gross Margin: 22-26%

Manufacturers Without Software Integration Capability

Manufacturers still offering only standalone chemical or electronic indicators without software-integration capability face a slow-motion competitive squeeze as blood centers increasingly favor vendors who can deliver data directly into existing management systems on integration capability built by rivals already on integration capability rivals already built earlier.
Gross Margin: 26-32%

Why Procurement Relationships Outlast Budget Cycles

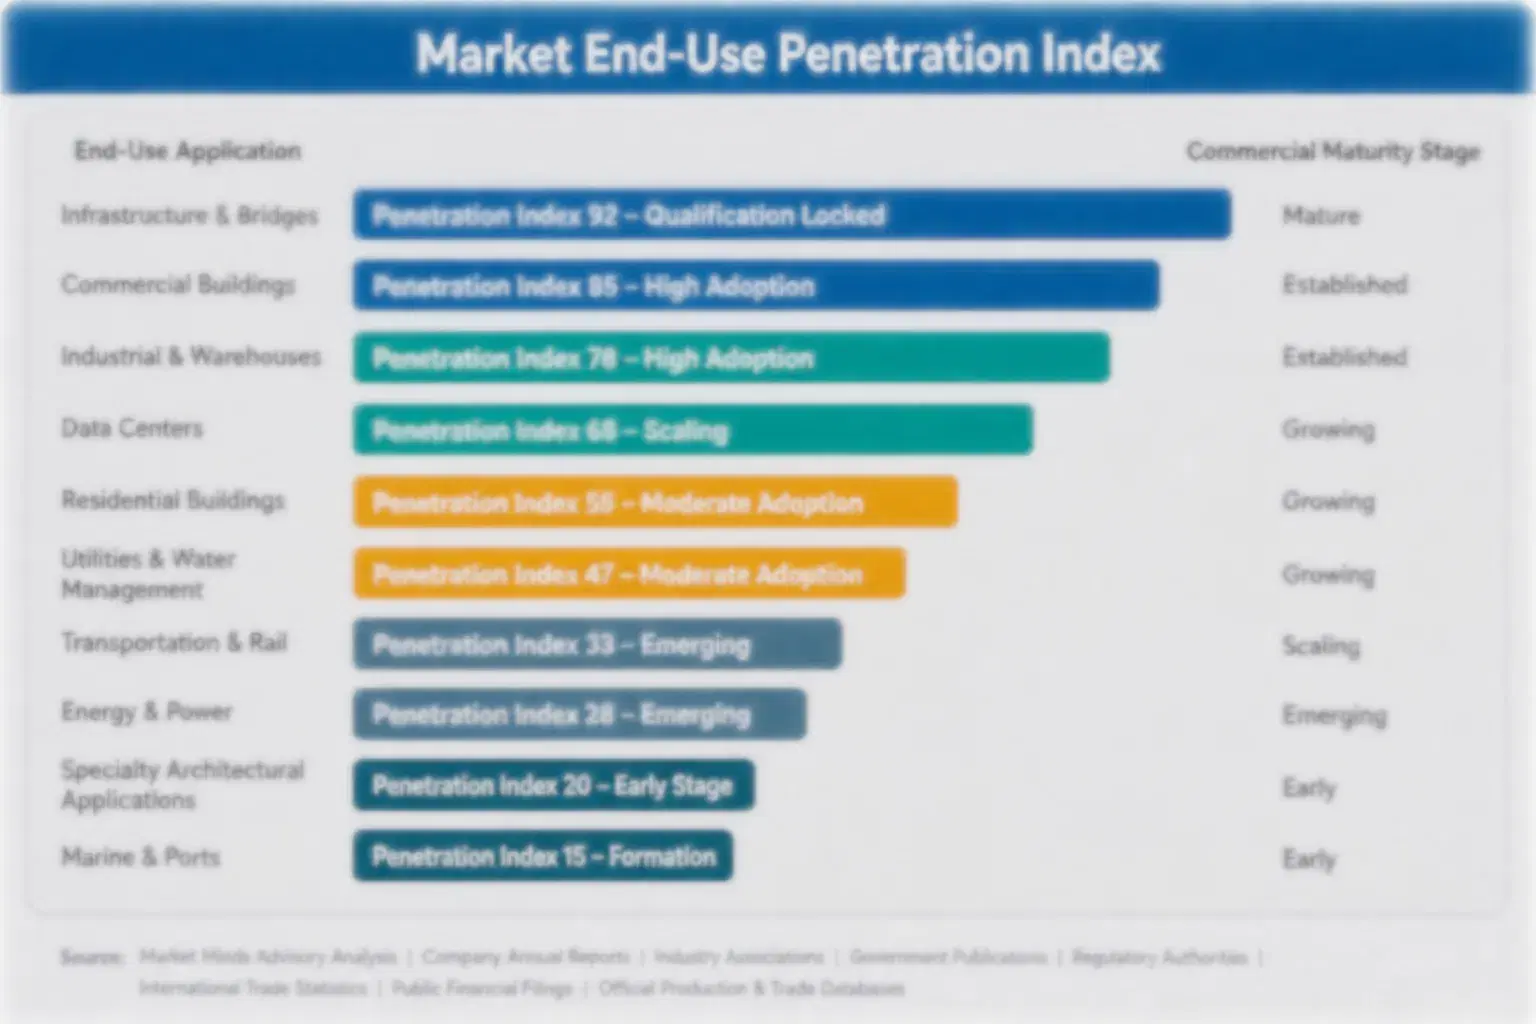
Once a manufacturer wins qualification with a blood center's procurement and quality teams, the relationship behaves like an annuity rather than a one-time sale. Re-qualifying a new supplier carries accreditation and supply-continuity risk blood centers rarely accept once a vendor relationship is established, so the incumbent manufacturer captures recurring indicator volume across many budget cycles without needing to rebid the business.
Depth of adoption varies sharply by center size. Large regional blood centers and hospital networks lock in the deepest manufacturer relationships because software-integration requalification is expensive and slow, while smaller centers see more frequent price-driven resourcing on commodity chemical indicators where switching cost is minimal. Mid-size centers sit in between, with growing interest in electronic formats but budget constraints that slow full conversion.

Buyer profiles are shifting as procurement decisions move earlier into capital-planning cycles. A decade ago, indicator purchasing was a routine supply-chain line item; today, cold-chain technology decisions increasingly involve quality and compliance teams planning years ahead of accreditation renewal, giving manufacturers with software-integration capability a seat earlier than pure indicator vendors traditionally occupied in these conversations across most major blood-center procurement organizations now active in the market.
blood-temperature-indicator-market-share-analysis-end-use-penetration-index-1791557182187

Where to Place Bets Now

These are among the four positions where our research anticipates prominent divergence between winners and laggards over the coming forecast period. Each is grounded in the demand model, the regulatory perimeter, and the announced capacity pipeline.
01 / SOFTWARE INTEGRATION PRIORITY

Build blood-management software partnerships before rivals lock them in

Electronic documentation requirements are tightening across major accreditation regimes, and manufacturers without a software-integration partnership are already losing larger accounts to competitors who can deliver data directly into existing systems. The pricing premium for bundled tag-and-software offerings is wide enough that early movers have priced combined programmes at two to three times standalone tag pricing. Waiting until integration becomes standard practice risks ceding these relationships permanently to manufacturers who built them first, a trust advantage that is proving difficult for later entrants to close quickly.
02 / LEASE PRICING EXPANSION

Expand lease-based pricing to reach budget-constrained centers

Smaller and rural blood centers cite upfront cost as the single largest barrier to adopting electronic and RFID formats over established chemical indicators. Manufacturers who have already built lease-based pricing programmes are reaching roughly 20% more addressable centers than upfront-purchase pricing alone would capture. Manufacturers who wait risk losing this broader base to competitors who already offer a lower-friction path to adoption for cost-sensitive buyers, a gap that should widen further as more centers evaluate upgrades over the next several budget cycles.
03 / COMPLIANCE SERVICE BUNDLING

Bundle accreditation-ready reporting with core supply contracts

Blood-center quality teams increasingly want accreditation-ready documentation delivered automatically rather than assembled manually from raw temperature readings ahead of renewal audits. Manufacturers who bundle this reporting capability directly into supply contracts are capturing a recurring service fee most competitors still leave on the table entirely. This advantage should widen as more centers face renewal cycles requiring continuous monitoring evidence, a dynamic favoring manufacturers who built reporting capability well before most competitors treated it as necessary across the broader accreditation landscape each renewal cycle going forward.
04 / CROSS REGION QUALIFICATION PUSH

Qualify both US and EU documentation standards on shared tooling

Multinational blood-center networks increasingly prefer manufacturers who can serve both US and EU accounts from one qualified product line rather than managing two separate vendor relationships for functionally the same product. Manufacturers who complete this dual qualification now are commanding a meaningful pricing premium over single-region specialists facing exactly this limitation today. Waiting for regulatory harmonization before investing risks missing multinational contracts awarded well ahead of any formal standard, a window that narrows further once regulatory harmonization efforts eventually succeed.

Engagement Snapshot From the Field

A live engagement with an industry participant carrying material or product regulatory and market exposure ahead of a defining policy shift, showing how our research translates into a defensible multi-year portfolio strategy.
MARKET MINDS ADVISORY · CLIENT ENGAGEMENT SUMMARY
Blood Temperature Indicator Producer Strategic Portfolio Review and Transition Roadmap 2026·Investment Scenario on Blood Temperature Indicator Exposure Evaluation 2025-26
CLIENT PROFILE
The client is a regional blood-center network operating multiple collection and distribution sites across several states, with annual operating revenue of approximately $310 million (client-reported, unverified by MMA). The network had relied on chemical freeze indicators across most sites and faced an upcoming accreditation renewal cycle requiring demonstrated continuous temperature monitoring capability across its full inventory within an eighteen-month compliance window.
STRATEGIC CHALLENGE
The client needed to upgrade cold-chain documentation across multiple sites simultaneously without disrupting ongoing collection and distribution operations, while working within a capital budget that could not fund a full RFID conversion across every site within the available compliance timeline before the renewal deadline arrived, a sequencing problem common to multi-site cold-chain upgrades of this scale.
MMA APPROACH
MMA conducted a site-by-site assessment prioritizing RFID conversion at the highest-volume distribution centers first, benchmarking vendor software-integration capability and lease-pricing options against the client's existing blood-management system and capital constraints across its full site network, producing a phased conversion plan the client's board could approve within its existing budget cycle.
KEY FINDINGS
  1. Only three of the five vendors assessed offered software integration compatible with the client's existing blood-management platform without costly custom development work.
  2. Lease-based pricing reduced the client's required upfront capital investment by roughly 60% relative to an outright purchase across all sites simultaneously across the full network.
  3. Prioritizing the three highest-volume sites first covered the majority of total unit volume while deferring smaller-site conversion to a later budget cycle.
  4. The client's original cost estimate understated software-integration licensing fees by roughly 22%, a gap the assessment surfaced before vendor contracts were signed.
CLIENT PROFILE
The client is a regional blood-center network operating multiple collection and distribution sites across several states, with annual operating revenue of approximately $310 million (client-reported, unverified by MMA). The network had relied on chemical freeze indicators across most sites and faced an upcoming accreditation renewal cycle requiring demonstrated continuous temperature monitoring capability across its full inventory within an eighteen-month compliance window.
STRATEGIC CHALLENGE
The client needed to upgrade cold-chain documentation across multiple sites simultaneously without disrupting ongoing collection and distribution operations, while working within a capital budget that could not fund a full RFID conversion across every site within the available compliance timeline before the renewal deadline arrived, a sequencing problem common to multi-site cold-chain upgrades of this scale.
MMA APPROACH
MMA conducted a site-by-site assessment prioritizing RFID conversion at the highest-volume distribution centers first, benchmarking vendor software-integration capability and lease-pricing options against the client's existing blood-management system and capital constraints across its full site network, producing a phased conversion plan the client's board could approve within its existing budget cycle.
KEY FINDINGS
  1. Only three of the five vendors assessed offered software integration compatible with the client's existing blood-management platform without costly custom development work.
  2. Lease-based pricing reduced the client's required upfront capital investment by roughly 60% relative to an outright purchase across all sites simultaneously across the full network.
  3. Prioritizing the three highest-volume sites first covered the majority of total unit volume while deferring smaller-site conversion to a later budget cycle.
  4. The client's original cost estimate understated software-integration licensing fees by roughly 22%, a gap the assessment surfaced before vendor contracts were signed.
RECOMMENDED STRATEGY
Phase 1: Phase 1 (Months 1 to 4): Convert the three highest-volume distribution sites to RFID tagging under lease-based pricing ahead of the renewal deadline. Phase 2: Phase 2 (Months 5 to 12): Validate software integration and documentation output against accreditation requirements across the converted sites at each converted site. Phase 3: Phase 3 (Month 13 onward): Extend conversion to remaining smaller sites in the following budget cycle based on validated results.
OUTCOME
The client passed its accreditation renewal with continuous monitoring documentation covering its highest-volume sites, satisfying the compliance requirement within the available window. Software-integration licensing cost came in within 5% of the revised budget MMA's assessment produced, and the client reported no documentation gaps flagged during the renewal audit (client-reported, unverified by MMA).

Frequently Asked Questions

Foundational context covering the market sizes, CAGR, scope, country, region and competition that inform every finding below. This section is provided to cover basics and most often pre-purchase conversations, answered from the MMA Primary Research Dataset.

What is the current size of the Blood Temperature Indicator Market?

The global blood temperature indicator market was valued at approximately $0.54 billion in 2025. This reflects chemical indicators, electronic loggers, RFID tags, and software platforms sold to blood banks and transfusion services worldwide.

How large will the Blood Temperature Indicator Market be by 2036?

MMA projects the market will reach approximately $1.11 billion by 2036. Growth is driven by rising transfusion volumes and tightening accreditation documentation requirements, roughly double its 2025 starting base.

What is the CAGR for the Blood Temperature Indicator Market 2026 to 2036?

The market is projected to grow at a compound annual growth rate of 6.8% between 2026 and 2036. Bull and bear scenarios range from roughly 5.5% to 8.0%.

Which segment is growing fastest?

RFID-enabled temperature tags are the fastest-growing segment, expanding at approximately 9.8% annually, well above the category average. This reflects electronic blood-management systems pulling machine-readable tags into mainstream use.

Who are the major companies in the Blood Temperature Indicator Market?

Leading companies include 3M, Temptime Corporation, Haemonetics, Terumo BCT, and Fresenius Kabi. These five manufacturers hold the leading qualified positions in the category, spanning both chemical and electronic product lines.

Which country is growing fastest?

India is the fastest-growing major country, expanding at approximately 9.3% annually as blood-collection infrastructure modernizes rapidly. National electronic-documentation mandates are accelerating this transition, backed by a national electronic-documentation mandate.

Blood Temperature Indicator Market Segmentation

The full report scope spans multiple orthogonal segmentation dimensions, with cross-tabulated demand data provided for each dimension pair. Coverage extends further to regional breakdowns, trend trajectories, and the competitive detail needed to support segment-level decision-making.

By Product and Technology Type

  • Single-Use Chemical Freeze Indicators
  • Reusable Electronic Temperature Loggers
  • RFID-Enabled Temperature Tags for Blood Units
  • Time-Temperature Integrator Labels
  • Cold Chain Monitoring Software and Data Platforms
  • Calibration and Validation Services

By End-Use Facility

  • Hospital Blood Banks
  • Regional Blood Collection Centers
  • National Blood Transfusion Services
  • Independent Diagnostic and Plasma Centers

By Commercial Dimension

  • Direct Manufacturer Supply
  • Lease and Subscription-Based Supply
  • Distributor and Group Purchasing Supply

By Region

  • North America
  • Western Europe
  • East Asia
  • South Asia and Pacific
  • Latin America
  • Middle East and Africa
  • Eastern Europe

Scope, Methodology, and Coverage

Every figure in this report is reproducible from documented input assumptions. The scope below maps the historical period, the forecast horizon, the segmentation dimensions, and the countries covered, alongside the underlying primary and qualitative methodology.
Historical Period
2020 to 2025
Forecast Period
2026 to 2036
Base Year
2025 (USD billions; MMA Primary Research Dataset, October 2026)
Market Definition
The blood temperature indicator market covers single-use chemical freeze indicators, reusable electronic temperature loggers, RFID-enabled temperature tags, and time-temperature integrator labels used to monitor blood and blood component temperature during collection, storage, and transport. It excludes general-purpose industrial temperature sensors and cold-chain monitoring devices used outside blood banking and transfusion services.
Quantitative Units
USD billions (current prices); unit volumes in million indicators where cited
Segmentation Dimensions
By Product and Technology Type; By End-Use Facility; By Commercial Dimension; By Region
Regions Covered
North America, Western Europe, East Asia, South Asia and Pacific, Latin America, Middle East and Africa, Eastern Europe
Countries Covered
USA, China, Germany, France, UK, Japan, South Korea, India, Australia, Canada, Brazil, Mexico, Indonesia, Vietnam, Thailand, Malaysia, UAE, Saudi Arabia, South Africa, Nigeria, Turkey, Poland, Netherlands, Italy, Spain, Sweden, Switzerland, Argentina, Colombia, Singapore, and additional markets relevant to this sector
Key Companies Profiled
3M Company, Temptime Corporation, Haemonetics Corporation, Terumo BCT Inc., Fresenius Kabi AG, Macopharma SAS, Grifols S.A., Berlinger & Co. AG, Controlant, Sensitech Inc., Cold Chain Technologies LLC, Testo SE & Co. KGaA, Dickson, LogTag Recorders Ltd, DeltaTrak Inc., Vaisala Oyj, Rotronic AG, Emerson Electric Co., Elpro-Buchs AG, Monnit Corporation
Quantitative Methodology
Primary survey, n=3,800 respondents, Q4 2025, six countries; demand-side model with trade association cross-validation
Qualitative Methodology
47 expert interviews, Q4 2025; applied to validate demand model assumptions, identify emerging dynamics, and assess competitive positioning
Report Format
PDF and XLSX data workbook (Word format preview document)
Publisher
Market Minds Advisory
Report Code
MMA-2026-MED-104
Published
October 2026
Contact
sales@marketmindsadvisory.com | www.marketmindsadvisory.com

Purchase the full Blood Temperature Indicator Market Report (2026 to 2036).

The full report delivers a complete market model spanning 2020 to 2036, with segment-level and regional revenue breakdowns across all seven tracked geographies. It includes detailed profiles of twenty companies, competitive benchmarking on a revenue basis, and an independent assessment of moat durability and risk exposure for the two leading manufacturers. Buyers receive the complete regional dataset beyond the two regions shown in this summary, along with extended commentary on reagent and electronics cost exposure and mitigation strategies. A dedicated appendix covers accreditation timelines, software-integration case examples, and lease-pricing benchmarking across the competitive set. Custom segment cuts and company-specific data extensions are available on request.
Twenty-company competitive benchmarking on a consistent basis
Full seven-region revenue and CAGR dataset
Segment-level margin and growth analysis across six product types
Reagent and electronics cost exposure and mitigation appendix
Accreditation timeline and integration benchmarking data
Custom segment and company-specific data extensions available

Built For The People Who Decide

From boardroom strategy to bench-side execution, this report is read cover-to-cover by leaders shaping the next decade of their industry, turning demand scenarios, market dynamics and valuation benchmarks into decisions.
CXOs/ Presidents/ VPs/ Managers
M&A and Corporate Development
Strategy Teams and R&D Heads
Procurement and Product Directors
Regulatory and Compliance Leaders
Investor Relations and Equity Analysts