Market Minds Advisory
Blood Sugar Breakfast Cereals Market

Blood Sugar Breakfast Cereals Market: Blood Sugar Breakfast Cereals Market. Glycemic Claims, Fiber and Protein Reformulation, and Retailer Sugar Targets Reshape the Cereal Aisle.

Blood sugar breakfast cereals are shifting from niche diabetic aisles into mainstream shelves as glycemic claims, fiber and protein reformulation, and sweetener regulation collide with retailer sugar targets and consumer distrust of health labels.

Lead Analyst

Published

September 2026

Make Smarter Decisions with Customized Research Insights

Request a free sample report and evaluate market opportunities, growth trends, and competitive dynamics relevant to your business needs.

2025 MARKET VALUE$6.4BMarket Size 2025
2036 FORECAST VALUE$13.8BBase Case , 2026 to 2036
CAGR 2026 TO 20367.2 %Bull 8.5% / Bear 5.9%
INCREMENTAL OPPORTUNITY$6.9BNet 10- year value creation
EXPANSION MULTIPLE2.00x2036 value over 2026 base
Strategic Levers
M&A Pipeline
Regional Outlook
Country Rankings
Competitive Intelligence
Segmental Deep-dive
Call-Us : 91 93563 13602

Executive Snapshot and Market Trajectory.

Breakfast is where most adults meet their first sugar spike of the day, and cereal makers know it. Buyers now read labels for glycemic response, not just sugar grams, and the brands that can prove a flatter curve are taking shelf space from legacy sweetened lines. That shift is accelerating.
High-protein low-glycemic cereals grow fastest, driven by diabetic and prediabetic households, weight-management shoppers, and clinicians who recommend named products. North America holds the largest share because diabetes prevalence, retailer health programs, and high cereal consumption sit together there, and East Asia and South Asia and Pacific gain as urban breakfast habits shift. India leads country growth. Pharmacies and online stores add reach. Clinic referrals help too.
Competition mixes global cereal majors, specialist glycemic brands, and private label lines from grocers. Advantage comes from clinical evidence, fiber and protein sourcing, and shelf placement rather than price alone. Regulation shapes claims, since sugar taxes, front-of-pack labels, and health-claim rules force reformulation and punish loose wording. Buyers reward products that taste normal and still deliver a measurable result. Private label follows quickly, copying winning recipes within months and compressing price gaps.
Market Definition
Blood sugar breakfast cereals are ready-to-eat and hot cereals formulated or certified for lower glycemic response, including low-glycemic index, high-fiber, high-protein, sugar-free, and diabetic-friendly lines sold through retail, pharmacy, and online channels. The scope excludes conventional sweetened cereals, cereal bars, granola snacks, infant cereals, and medical nutrition products sold under clinical supervision.
Base Year Value
$6.4B in 2025 (MMA Primary Research Dataset, September 2026)
Forecast Period
2026 to 2036, eleven discrete annual values
CAGR
7.2% base case. Bull 8.5%. Bear 5.9%.
Fastest Growth Segment
High-Protein Low-Glycemic Cereals: 11.3% CAGR
Fastest Growth Country
India: 10.4% CAGR
Fastest Growth Region
South Asia and Pacific: 9.2% CAGR
Largest Region
North America: 36% of 2025 global value
Market Leaders
Kellogg's, General Mills, Nestle, Post Holdings, Bob's Red Mill. Source: MMA Analysis, company annual reports.
Primary Survey
n=3,800 procurement and R&D decision-makers, Q4 2025, six countries
Methodology
Demand-side build-up, cross-validated against public data, 47 expert interviews

Blood Sugar Breakfast Cereals Market Forecast Scenarios

blood-sugar-breakfast-cereals-market-size-forecast-scenario-1789769968180
From 2020 to 2025, blood sugar breakfast cereals grew as diabetes awareness rose, continuous glucose monitors reached mainstream shoppers, and retailers created low-sugar sections. Growth averaged 6.2% a year, with protein and fiber-forward lines outpacing plain low-sugar variants, though ingredient inflation in 2022 and 2023 squeezed margins and pushed several brands to raise shelf prices sharply.
The base case assumes 7.2% annual growth through 2036, built on three named mechanisms: rising diabetes and prediabetes diagnosis rates that widen the buyer pool each year, wider retailer and payer programs that promote low-glycemic products through loyalty offers and dietitian referrals, and better ingredient technology, including resistant starch, oat beta-glucan, and plant protein, that improves taste while holding glycemic response down. Reformulation cycles keep launches frequent. Each mechanism supports the others.
The bull case, at 8.5%, needs approved glycemic claims in more markets and wider glucose monitor adoption. The bear case, at 5.9%, reflects claim crackdowns, ingredient cost spikes, and consumers returning to conventional cereals. Either path leaves the demand base intact, though mix and pricing would shift. Investors should weight the base case most heavily given current evidence.

Clinical Proof and Taste Parity Decide Cereal Shelf Space

Blood sugar breakfast cereals are built to slow glucose release after a meal. Makers combine whole grains, oat beta-glucan, resistant starch, added fiber, and plant or dairy protein, then cut or replace sugar with allulose, stevia, or monk fruit. The result must still crunch, pour, and taste like breakfast. Getting that texture at a low glycemic index is the hard engineering problem. Texture matters.
MARKET CONCENTRATION38% CR5Leading five brands hold a large combined share
AVERAGE SHELF PRICE$6.80 per boxGlycemic lines sell at a clear premium to standard cereal
PROTEIN CONTENT SHARE22%Share of new launches making a high protein claim
FIBER SHARE OF FORMULA18%Typical fiber load by weight in leading glycemic recipes
GRAIN COST SHARE34%Grains and fibers are the largest single cost line
REFORMULATION CYCLE30 monthsTypical time between major recipe changes for leading brands
Buyers come from several groups. Diabetic and prediabetic households buy for medical reasons, weight-management shoppers want protein and satiety, parents look for lower sugar options, and older adults follow clinician advice. Retailers stock these lines in cereal aisles, dedicated wellness sections, pharmacies, and online stores, and many run glycemic index testing at accredited laboratories to support shelf claims.
Structure sits between global cereal majors, specialist brands, and private label. Kellogg's, General Mills, Nestle, and Post Holdings hold scale and distribution, Bob's Red Mill and small brands lead on ingredient credibility, and grocers copy winning lines at lower prices. Sugar tax rules, front-of-pack labels, and claim scrutiny shape investment, and reformulation for lower glycemic response is now a standard part of portfolio planning.
"Low-glycemic cereal wins on repeat purchase, not first trial. Shoppers forgive a slightly odd texture once, but only a product that tastes ordinary and reads well on a glucose monitor earns the second box."
Practice Lead, Functional Foods and Packaged Food Practice · MMA Functional Foods and Breakfast Cereals Practice · September 2026

Market Trends

Continuous Glucose Monitor Adoption Turns Glycemic Response Into Purchase Criterion

Consumer continuous glucose monitors and wellness apps now let shoppers see how a specific cereal changes their blood sugar, and that personal data is replacing generic sugar counts as the buying test. Sales of over-the-counter monitors passed several million units a year in the United States after regulatory clearance in 2024, according to FDA clearance records, and brands respond with tested products and app partnerships. Cereals that show a flat curve gain social proof quickly, while high-sugar lines that spike glucose are shared as warnings, so makers invest in independent testing at accredited laboratories.
Market Impact: 530 million adults live with diabetes
Plant Protein and Resistant Starch Improve Taste Without Glycemic Penalty

Ingredient advances allow makers to reach 10 to 15 grams of protein and 6 to 10 grams of fiber per serving without the chalky texture of earlier products. Pea, fava, and soy protein extrudates, resistant starch from high-amylose wheat and maize, and oat beta-glucan concentrates lower glycemic index below 55 while keeping crunch. Suppliers such as Roquette, Ingredion, and Cargill sell tailored blends and application support, and extruder upgrades cut reformulation time. Adoption is strongest among premium brands, though private label lines are following as ingredient prices ease and consumers accept the new taste profile.
Market Impact: 50 countries apply sugar levies

Market Opportunities and Growth Drivers

Rising Diabetes and Prediabetes Prevalence Widens the Addressable Buyer Base

The International Diabetes Federation estimates more than 530 million adults live with diabetes worldwide, with hundreds of millions more in prediabetes, and breakfast is the meal where dietitians most often recommend a change. Households managing the condition buy low-glycemic foods weekly, not occasionally, which makes cereal an annuity-style purchase once a product is accepted. National programs in the United States, India, and China now promote diet-based prevention, and health insurers in several markets reward low-sugar purchases through loyalty schemes. Brands that pair clinical claims with retail availability capture this demand consistently.
Market Impact: repeat rates trail cereal by 20-30%

Sugar Taxes and Retailer Sugar Reduction Targets Force Cereal Reformulation

More than 50 countries now apply sugar-sweetened product levies or front-of-pack warnings, and the United Kingdom, Mexico, and Chile have pushed cereal recipes below prescribed sugar limits, according to World Health Organization policy tracking. Retailers set their own targets, such as 20% sugar cuts across private label ranges, and shelf placement rules favor compliant products. Makers that reformulate early gain access to promotional space and school and hospital tenders, while those who delay face warning labels and loss of listings. Lower sugar recipes also open room for glycemic claims, which supports premium pricing across the range.
Market Impact: testing costs $8,000-15,000 per product

Market Restraints and Challenges

Taste and Texture Compromises Hold Back Mainstream Repeat Purchase

High-protein and high-fiber cereals often taste grainy or dry, and sugar replacers such as allulose and stevia leave aftertastes that shoppers notice. The root cause is that sugar provides bulk, browning, and crunch that fiber and protein cannot fully replace in extruded pieces. Trial rates are good but repeat rates fall 20% to 30% below conventional cereals, according to MMA primary research. Makers are exploring sugar-alcohol blends, enzyme treatments, and flavor masking, though each adds cost of 5% to 10% per unit, and testing panels take months before a recipe reaches shelves.
Market Impact: monitor users approach 10 million

Claim Scrutiny and Regulatory Divergence Raise Compliance Cost Across Markets

Glycemic claims are regulated differently in each market, and authorities in the European Union, the United Kingdom, and Australia restrict health claims that lack approved evidence, according to European Commission and national regulator guidance. The root cause is that glycemic response varies by person and testing method, so a single number can mislead. Brands face relabeling costs, litigation risk, and retailer delisting after complaints. Mitigation includes independent glycemic index testing, standardized test panels, and neutral wording such as lower sugar, though testing costs $8,000 to $15,000 per product and delays launches.
Market Impact: protein reaching 10-15 grams per serving
3 additional market trends, 4 additional growth drivers, and 2 additional restraints and challenges are covered in the full report. Contact sales@marketmindsadvisory.com to access the complete intelligence.

Segment CAGR and Growth Architecture

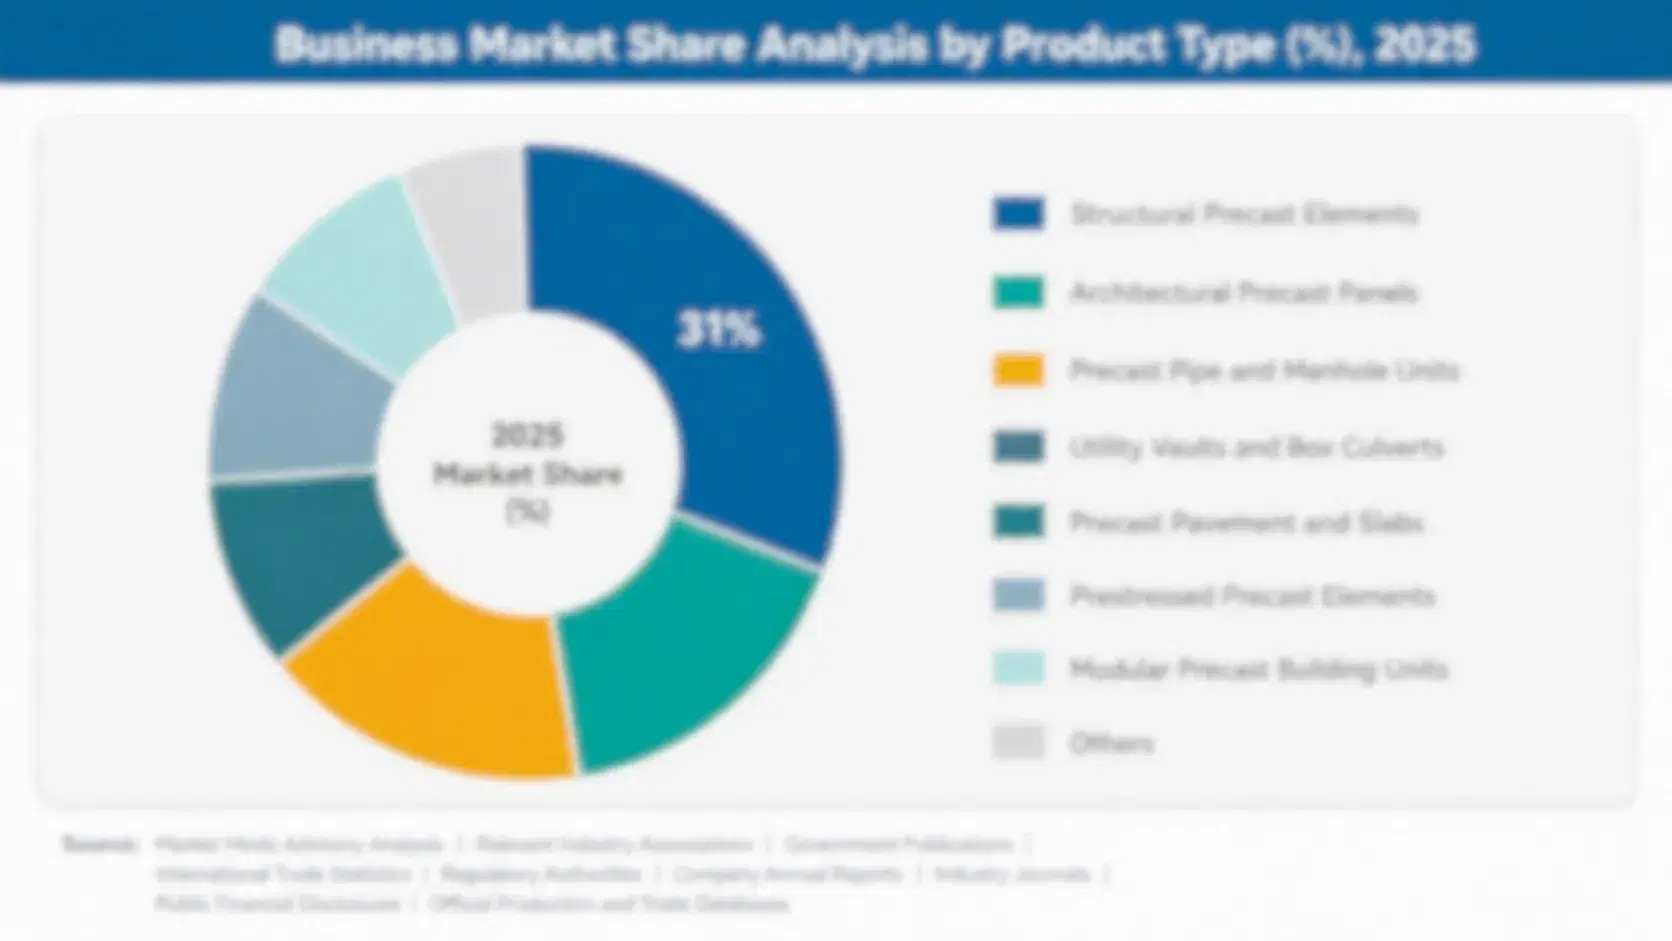
Blood sugar breakfast cereals are segmented by formulation logic, because glycemic mechanism, ingredient cost, claim strategy, and buyer group differ more sharply between protein-led, fiber-led, sugar-free, and whole-grain lines than they do by pack format. High-protein low-glycemic cereals attract the most investment as makers convert clinical evidence into premium shelf space and retailer programs.
blood-sugar-breakfast-cereals-market-market-share-analysis-1789769968507

High-Protein Low-Glycemic Cereals

High-protein low-glycemic cereals are the fastest-growing segment, built from pea, soy, whey, or fava protein extrudates blended with resistant starch and fiber to reach 10 to 20 grams of protein per serving at a glycemic index below 55. Weight-management shoppers and diabetic households buy them because they combine satiety with a flatter glucose curve. Costs run higher because protein isolates and extrusion trials are expensive, so early adoption came from premium brands. Makers with proven texture, clinical testing, and stable supply of protein isolates win listings, and retailers give them eye-level space. Pilot production runs typically last two quarters before retailers commit to full national distribution and long-term shelf agreements. Trials continue.
CAGR 11.3%

High-Fiber Whole-Grain Cereals

High-fiber whole-grain cereals are the second-fastest segment, made from oats, barley, bran, and psyllium blends that deliver beta-glucan and insoluble fiber to slow glucose absorption. Older adults, clinicians, and digestive-health buyers choose them, and authorized claims for oat beta-glucan and cholesterol give makers a strong marketing base in the United States and Europe. Formats include flakes, muesli, and hot oat lines. Ingredient costs are modest, so competition from private label is intense, and premium brands defend share through organic sourcing, cleaner labels, and independent glycemic testing. Oat sourcing matters because beta-glucan content varies by variety and milling, so brands with contracted growers deliver consistent claims, and retailers reward that consistency with longer listings.
CAGR 8.6%
Full segment breakdown across 6 segments available in the complete report.

Regional Architecture and Country Demand Map

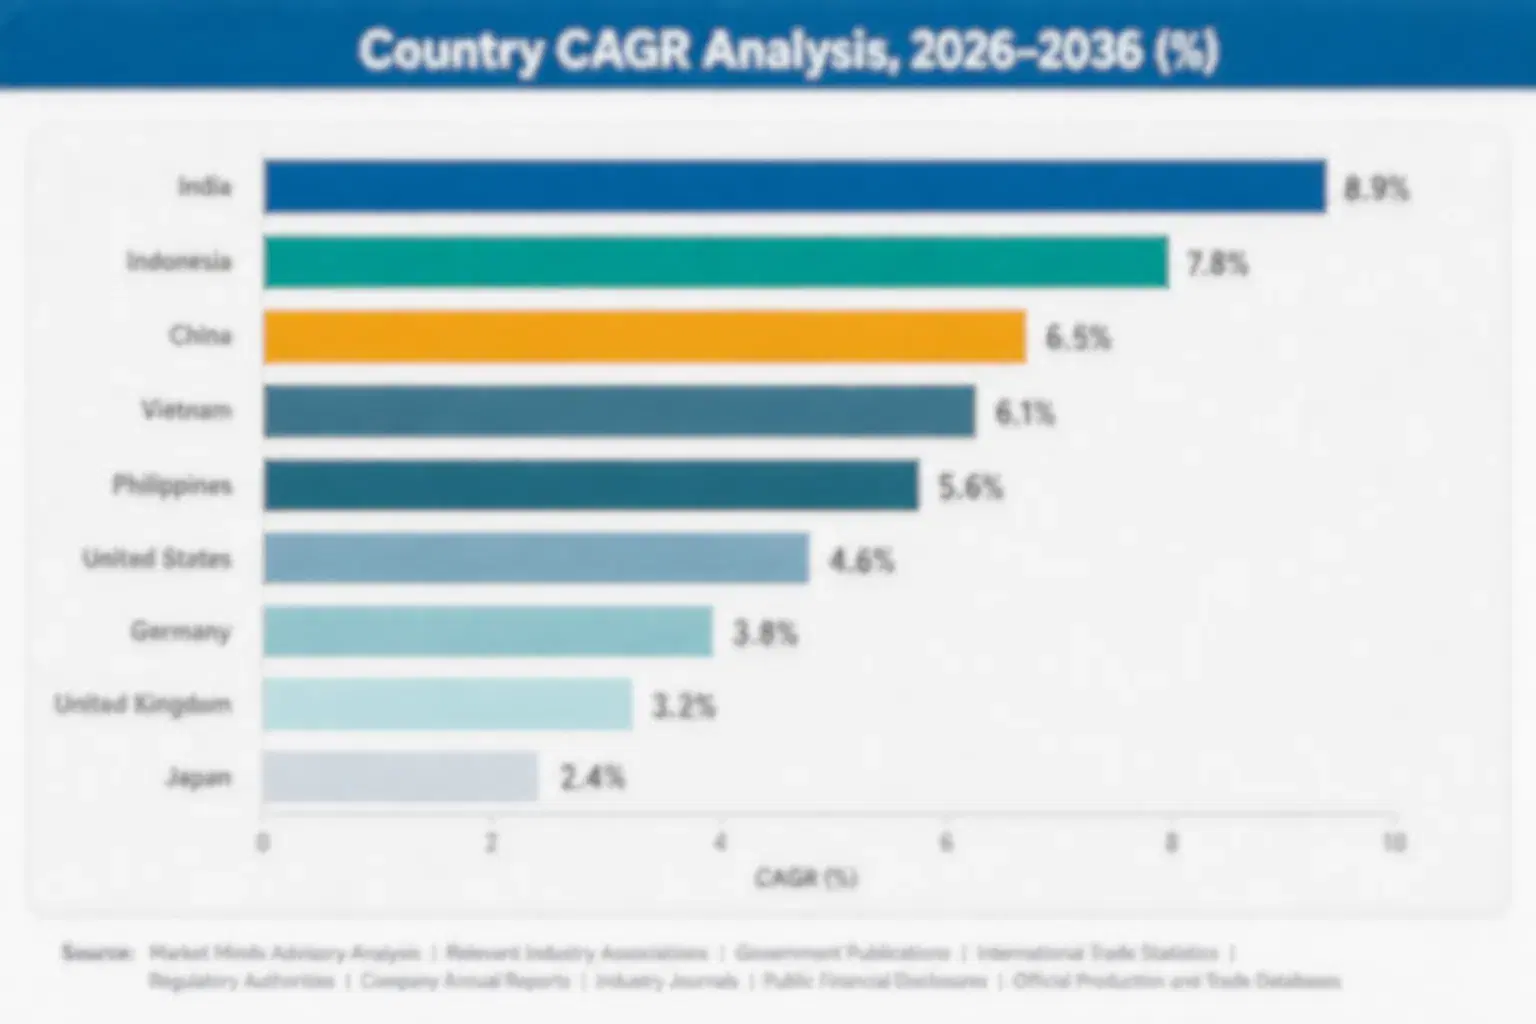
Blood sugar cereal value follows diabetes prevalence, retail health programs, and cereal habits. North America leads through the United States and Canada, Western Europe follows through Britain and Germany, and India is the fastest-growing country as urban breakfast routines shift and diabetes awareness spreads each year.

North America

North America holds 36% share, above its usual band, because the United States combines the highest per-capita cereal spending with more than 38 million people living with diabetes, wide continuous glucose monitor use, and retailers such as Walmart, Kroger, and Costco running dedicated low-sugar and diabetic-friendly sections. Kellogg's, General Mills, and Post lead through reformulated lines, while Canadian dietitian programs and Mexican imports add volume. Claim scrutiny from the FDA and taste compromises restrain returns, though monitor adoption and pharmacy distribution keep growth close to the global rate. Online subscriptions also lift repeat orders. Hospital systems and employer wellness programs also buy tested cereals for diabetes prevention participants across the United States.
Share: 36% | CAGR: 7.0% (2026 to 2036)

Western Europe

Western Europe holds 22% share, with the United Kingdom, Germany, France, and the Nordic markets driving demand through sugar levies, front-of-pack labels, and retailer reduction targets that push cereal makers toward lower sugar and higher fiber. Nestle and Kellogg's lead in supermarkets, while German and Dutch specialty brands stress oats and beta-glucan. European Commission rules limit glycemic claims, so brands use lower sugar wording, which keeps growth below the global rate. Private label from Tesco, Aldi, and Lidl adds price pressure, though health-conscious shoppers in Scandinavia support premium lines. Pharmacy channels in Germany also carry diabetic ranges. Irish, Spanish, and Italian retailers also copy British reduction targets across their own private label cereal ranges.
Share: 22% | CAGR: 5.6% (2026 to 2036)
Regional intelligence for 5 additional markets available in the complete report: East Asia, South Asia and Pacific, Latin America, Middle East and Africa, Eastern Europe. Contact sales@marketmindsadvisory.com.
blood-sugar-breakfast-cereals-market-country-cagr-analysis-1789769968773

Four Margin Routes for Glycemic Cereal Brands

Margin in blood sugar cereals comes from moving beyond low-sugar recipes toward proven glycemic response, high protein content, and application-specific lines that shoppers and clinicians trust. Brands that invest in testing, secure protein and fiber supply, and tie products to monitor data or clinical programs earn more per box than makers competing on sugar reduction alone.

Funding Independent Glycemic Testing to Support Premium Shelf Pricing

Accredited glycemic index testing costs $8,000 to $15,000 per product but lets brands print a verified number, which supports shelf prices 15% to 25% above unverified low-sugar cereals. Retailers give tested products better placement, and dietitians recommend them more readily, so volumes rise by 10% to 15% in the first year after certification. Brands that publish results and share them with monitor apps build trust with diabetic households. Testing also protects against claim disputes, and repeat certification each time the recipe changes keeps the data current and defensible. Reviews stay annual.
Market Impact: tested products earn 15% to 25% price premiums

Building Protein-Led Lines With Secure Plant Protein Supply Contracts

Protein-led cereals sell at gross margins of 40% to 50%, against 28% to 35% for standard low-sugar lines, so brands that secure pea and fava protein through annual contracts capture the difference. Contracts with suppliers such as Roquette and Cargill cost 5% to 8% above spot in normal years but protect against 20% price spikes. Extruder upgrades cost $2 million to $5 million and pay back within three years when volumes reach 15,000 tonnes. Suppliers also share texture data, which cuts reformulation trials, and buyers value consistent supply across quarters.
Market Impact: protein lines earn 40% to 50% gross margins

Partnering With Monitor Apps and Clinics for Direct Recommendation Channels

Partnerships with glucose monitor makers, wellness apps, and diabetes clinics give brands a direct recommendation channel that lowers customer acquisition cost by 25% to 40% compared with paid search. Apps can show a shopper's own glucose response to a named cereal, and clinics recommend tested products in dietary plans. Brands typically pay 3% to 6% of sales in referral fees, but repeat rates rise by 15 points as households stick with recommended products. Contracts run one to two years, and data sharing agreements protect privacy while giving makers real-world response evidence.
Market Impact: partnerships cut customer acquisition costs by 25% to 40%

Expanding Subscription and Pharmacy Channels for Repeat Household Purchase

Diabetic and prediabetic households buy weekly, so subscription and pharmacy channels raise repeat rates and lower shelf risk, with subscription sales running 20% to 30% above grocery baskets in retention. Direct sales earn gross margins 8 to 12 points higher than wholesale supermarket sales, though fulfillment and marketing add 10% to 15% of revenue. Pharmacy chains give credibility with clinicians and older buyers, and contracts run annually with listing fees. Brands that combine both channels reach households that grocery aisles miss, and they gather purchase data that improves recipe and pack decisions.
Market Impact: direct channels add 8 to 12 margin points

Who Controls the Margin Pool

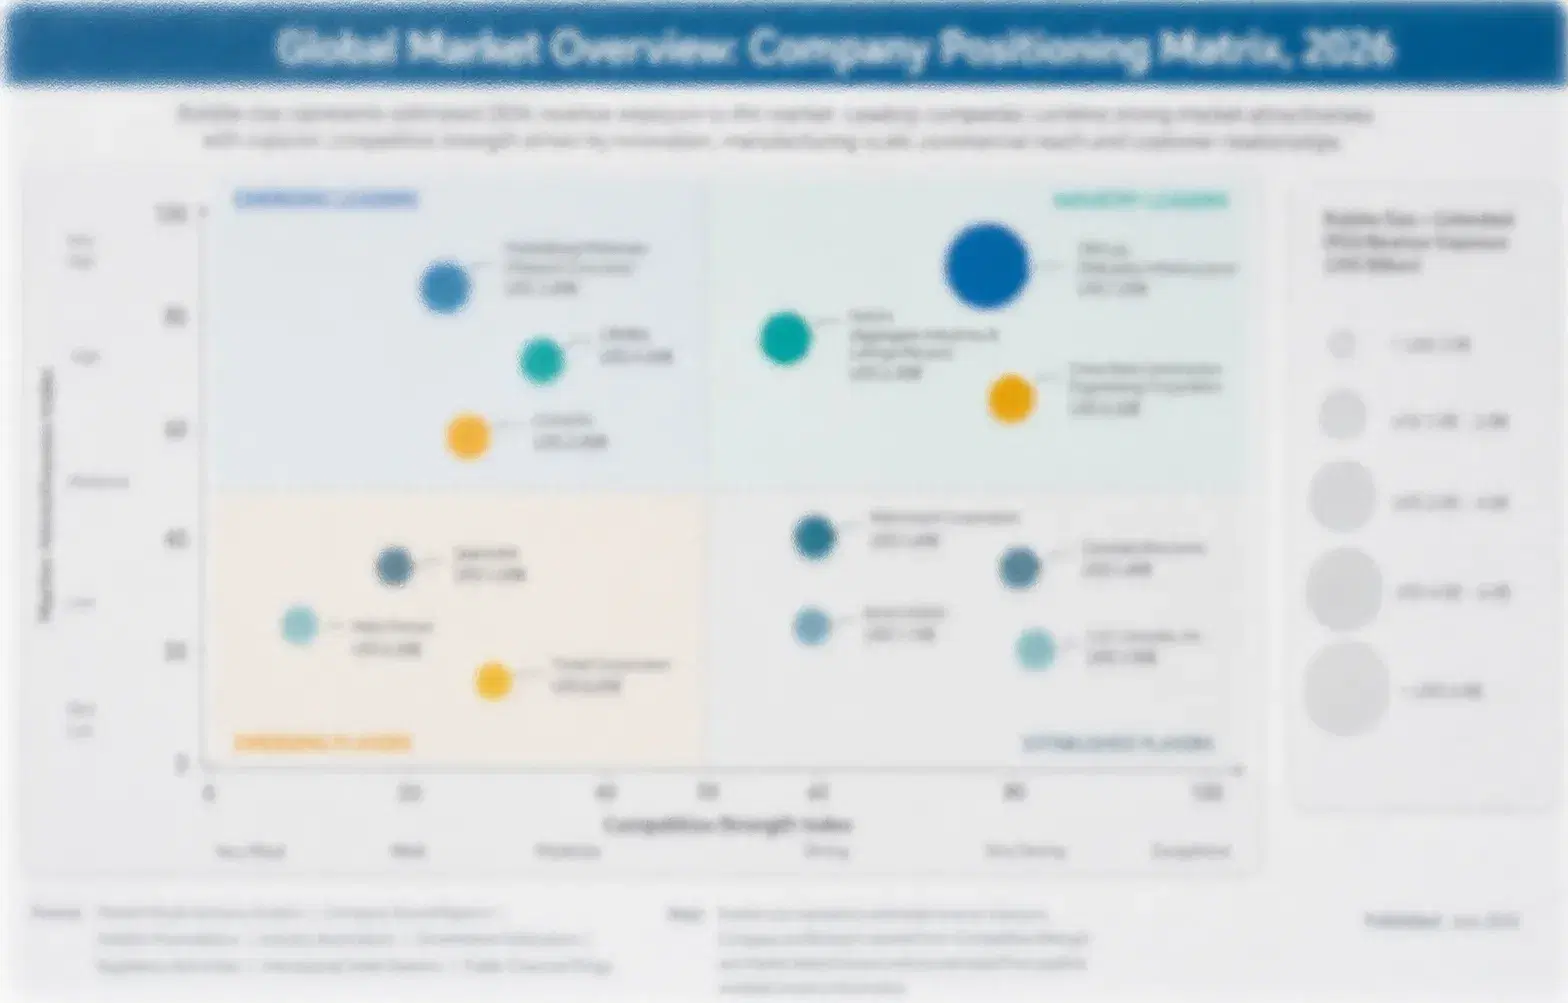
The blood sugar cereal industry is moderately concentrated, with the top five brands holding about 38% of global revenue, the basis used throughout this section. Kellogg's, General Mills, Nestle, Post Holdings, and Bob's Red Mill lead through distribution reach, reformulation capability, and brand trust, while many specialist brands and private label lines compete for the remaining shelf space in grocery and pharmacy channels.
Competition centers on three dimensions: clinical and glycemic evidence measured by independent testing and published trials, ingredient technology that delivers protein and fiber at acceptable taste, and channel access across supermarkets, pharmacies, subscriptions, and monitor app partnerships. Leaders sign retailer programs and invest in testing, while challengers compete on clean labels and niche claims. Private label copies successful recipes within months. Price gaps remain narrow.

Emerging pressure comes from private label lines matching recipes at 20% lower prices, from dairy and snack companies launching protein cereals, and from monitor makers building branded food programs. Rankings shift where brands secure verified claims, win retailer health programs, or lose share to cheaper copies. Acquisitions of specialist brands and ingredient partnerships will reorder positions faster than organic growth, particularly as buyers look for products that show real glucose results.
blood-sugar-breakfast-cereals-market-company-positioning-matrix-1789769969054

Competitive Moat and Risk Dimensions

KELLOGG'S

Moat: Global Distribution and Reformulation Scale

Kellogg's operates the largest cereal distribution network, with plants and retail relationships in more than 180 countries, and it can test and roll out reformulated recipes across large volumes quickly. Its brand recognition and R&D spending let it launch lower sugar and higher protein lines through existing supermarket contracts.
KELLOGG'S

Risk: Legacy Sugary Brand Baggage

Kellogg's carries a portfolio of sweetened cereals that shoppers associate with sugar, so glycemic claims on new lines face skepticism. Specialist brands with cleaner positioning and clinical evidence can win health-conscious buyers, and private label copies of successful recipes pressure margins on its mid-priced lines across major retail accounts.
GENERAL MILLS

Moat: Oat and Fiber Brand Trust

General Mills owns leading oat and whole-grain cereal brands and has long-standing authorized claims for oat beta-glucan and heart health, which give it credibility with clinicians and older buyers. Its research centers, supplier contracts, and retailer partnerships let it launch lower sugar and higher fiber recipes at scale.
GENERAL MILLS

Risk: Slower Growth in Cereal

General Mills faces flat volumes in mainstream cereal and depends on reformulation to hold share, so heavy investment in glycemic lines must compete with other categories for capital. Protein-focused challengers and private label products can undercut prices, and any claim dispute could damage trust in its health-oriented brands.

Players Tracked

Prominent Players

Kellogg's
General Mills
Nestle
Post Holdings
Bob's Red Mill

Other Key Players

Quaker Oats
Weetabix
Bagrry's
Saffola
Calbee
Seven Sundays
Magic Spoon
Catalina Crunch
Nature's Path
Kashi
Barilla
Uncle Sam
Familia
Holland and Barrett
Dr. Schar

Recent Developments

FEBRUARY 2026

Post Holdings Expands High-Protein Low-Sugar Cereal Capacity in Missouri

Post Holdings completed an organic expansion of its extrusion capacity in Missouri for high-protein, low-sugar cereals, adding lines that handle pea and whey protein blends. The project is internal capital spending. It raises output for premium lines, reduces co-manufacturing dependence, and supports listings with major grocers.
Signal: Shows cereal majors investing in dedicated protein extrusion capacity to serve premium glycemic and weight-management demand.
NOVEMBER 2025

General Mills Signs Data Partnership With Continuous Glucose Monitor Maker

General Mills signed a data partnership with a continuous glucose monitor maker, allowing app users to see glucose responses to named cereals and receive product suggestions. The deal is a commercial partnership. It gives the company real-world evidence, supports claims, and opens a direct channel to diabetic and prediabetic households.
Signal: Confirms cereal makers are tying products to monitor data to prove glycemic performance and win loyal households.
MAY 2025

Nestle Reformulates Cereal Range Below Lower Sugar Thresholds in Europe

Nestle reformulated its European breakfast cereal range to meet lower sugar thresholds set by retailers and national programs, cutting added sugar and raising whole-grain and fiber content. The change is an organic reformulation. It protects shelf access under sugar labeling rules and lays groundwork for future low-glycemic line extensions.
Signal: Shows sugar rules pushing mainstream cereal ranges toward lower sugar and higher fiber recipes across Europe.

What Drives Cereal Formulation Costs

Grains, fibers, and proteins account for roughly 34% of cost of goods, with oats, wheat, and corn sourced from North America, Europe, and Australia, and pea and fava protein from Canada, France, and China. Packaging, energy, labor, sweeteners, and freight add most of the rest, so grain price, protein isolate cost, and extrusion efficiency together drive margin. Glycemic lines cost more per kilogram than conventional cereal.
Oat and wheat prices spiked in 2022 after supply disruptions in Ukraine and drought in Canada, according to USDA grain price reports and the Kellogg Company Annual Report 2023, while pea protein prices rose 25% on freight and energy costs. Brands with fixed-price contracts absorbed losses, others added surcharges, and some paused launches. Margins narrowed as retailers resisted price increases and shortened promotional windows for the following quarters.

Exposure varies by player type and geography. Global majors with contracts, hedging, and multiple plants absorb shocks better than small specialist brands buying spot ingredients or using co-packers. North American brands face grain and freight risk, European brands face energy and sugar levy costs, and premium protein lines pass costs through more easily than price-sensitive private label cereals.
blood-sugar-breakfast-cereals-market-cost-volatility-analysis-1789769969365

Contracting Grains and Proteins Across Several Origins

Makers sign annual and multi-year supply agreements with oat, wheat, and pea protein suppliers in North America, Europe, and Australia, mixing fixed and index-linked prices. Spreading origins reduces exposure to a single harvest failure, and quality clauses secure fiber and protein specifications. Forward buying lets brands plan promotions and avoid emergency purchases during price spikes in the market.

Reformulating With Lower-Cost Fibers and Blended Proteins

R&D teams test blends of lower-cost fibers, such as chicory root and resistant dextrin, and mixed plant proteins to hold glycemic response while cutting ingredient cost by 5% to 10%. Blended proteins also improve texture and reduce dependence on one isolate. The approach needs pilot runs and sensory panels, but it lowers cost variability and improves supply security.

Sharing Ingredient Cost Through Retailer Pricing Formulas

Large retailers and brands agree to formulas linking shelf price to published grain and protein indices plus a fixed margin, so cost swings are shared rather than absorbed by makers. Quarterly resets keep buyers informed and reduce disputes. Premium protein lines use annual pricing, since customers value stable supply and predictable shelf prices over the year.

Portfolio Architecture for Margin Defence

Margins run from thin returns on low-sugar cereals sold on promotion to strong profits on protein-led and clinically tested lines sold with monitor data and pharmacy support, with gross margin roughly doubling between the volume tier and the top tier. Testing, texture technology, and channel partnerships add pricing power over the same base of grains, and buyers pay more when a claim is backed by a measured glucose result.
Volume and premium pull in different directions. Low-sugar cereals sell in large volumes to price-conscious supermarkets at thin margins and face constant private label pressure. Protein-led and tested lines sell in smaller volumes at much higher margins but need protein sourcing, extrusion capacity, and evidence, so brands must choose how much capital to commit to premium positioning and how quickly to move.

High-value pools concentrate in protein-led low-glycemic cereals, high-fiber lines supported by authorized claims, and subscription and pharmacy channels serving diabetic households. These segments benefit from repeat purchase, clinician endorsement, and limited competition from private label. Brands that combine testing, ingredient supply, and channel partnerships hold advantages that are difficult to replicate quickly, given the time needed to build evidence and trust with clinicians and shoppers.

Volume / Commodity-Adjacent Tier

Standard low-sugar and whole-grain cereals sold through supermarkets and private label, with thin margins, grain price exposure, and constant promotional pressure, where shoppers switch on price and brand differences are small.
Gross Margin: 26%-34%

Premium / Certified Tier

Cereals with independently tested glycemic index, authorized fiber claims, and clean labels, sold under retailer programs and to pharmacy chains that require documented evidence, consistent supply, and reliable delivery across the year.
Gross Margin: 36%-45%

Sustainability / Regulatory / Next-Generation Tier

High-protein low-glycemic cereals, monitor-linked programs, and personalized subscriptions with application support and data sharing, positioned for diabetic households and weight-management shoppers across major markets, supported by clinical trials and retailer programs.
Gross Margin: 42%-54%
blood-sugar-breakfast-cereals-market-portfolio-architecture-1789769969673

High-value Sub-segments and Strategic Watch-out

High-Protein Low-Glycemic Cereals

High-protein low-glycemic cereals combine the fastest growth with strong pricing, as weight-management shoppers and diabetic households pay premiums for satiety and a flatter glucose curve. Extrusion capacity and protein supply limit competition, and brands with clinical data win retailer programs and long-term listings. Repeat purchase follows.
Gross Margin: 42%-54%

High-Fiber Whole-Grain Cereals

High-fiber whole-grain cereals offer high value with moderate growth, since older adults, clinicians, and digestive-health buyers pay steady premiums for authorized beta-glucan claims and trusted brands. Ingredient costs are modest, so private label competes hard, though organic sourcing and independent testing help brands defend price.
Gross Margin: 34%-44%

Low-Sugar Conventional Cereals

Low-sugar conventional cereals form the volume core, sold to families and general shoppers who want less sugar without changing habits. Margins are moderate and exposed to grain swings, but scale supports steady returns, and makers with large plants and retailer contracts hold cost and distribution advantages.
Gross Margin: 24%-34%

Sugar-Free Sweetener-Based Cereals

Sugar-free sweetener-based cereals are a strategic watch-out, dependent on allulose, stevia, and monk fruit that draw regulatory attention and aftertaste complaints. Changing sweetener rules could restrict recipes and repeat rates, so brands should track approvals, consumer sentiment, and margin exposure carefully as formulas evolve. Monitor closely.
Gross Margin: 22%-38%

Why Households Keep Buying One Box

Demand for blood sugar cereals behaves like an annuity once a household finds a product that tastes acceptable and shows a stable glucose result. Diabetic and prediabetic shoppers buy weekly and rarely experiment, because a bad reading costs more than a few dollars saved. Brands that win one household often keep it for years, and subscription and pharmacy programs lock in monthly volumes with modest price changes rather than open promotions.
Stickiness varies by vertical. Diabetic households and clinician-guided buyers are the deepest, since medical advice and personal data reinforce brand choice. Weight-management shoppers are next, driven by satiety and protein claims, while general low-sugar buyers are shallower and switch when promotions or new launches appear. Institutional buyers such as hospitals and care homes sign annual tenders and rarely change suppliers mid-contract.

Buyer profiles are shifting. Older buyers relied on doctors, pharmacists, and printed diet sheets, while younger prediabetic and wellness shoppers use monitors, apps, and social media to test products themselves. They compare glucose curves, share results, and switch quickly if a product disappoints, so brands that publish data, work with app makers, and answer questions openly keep loyalty across age groups.
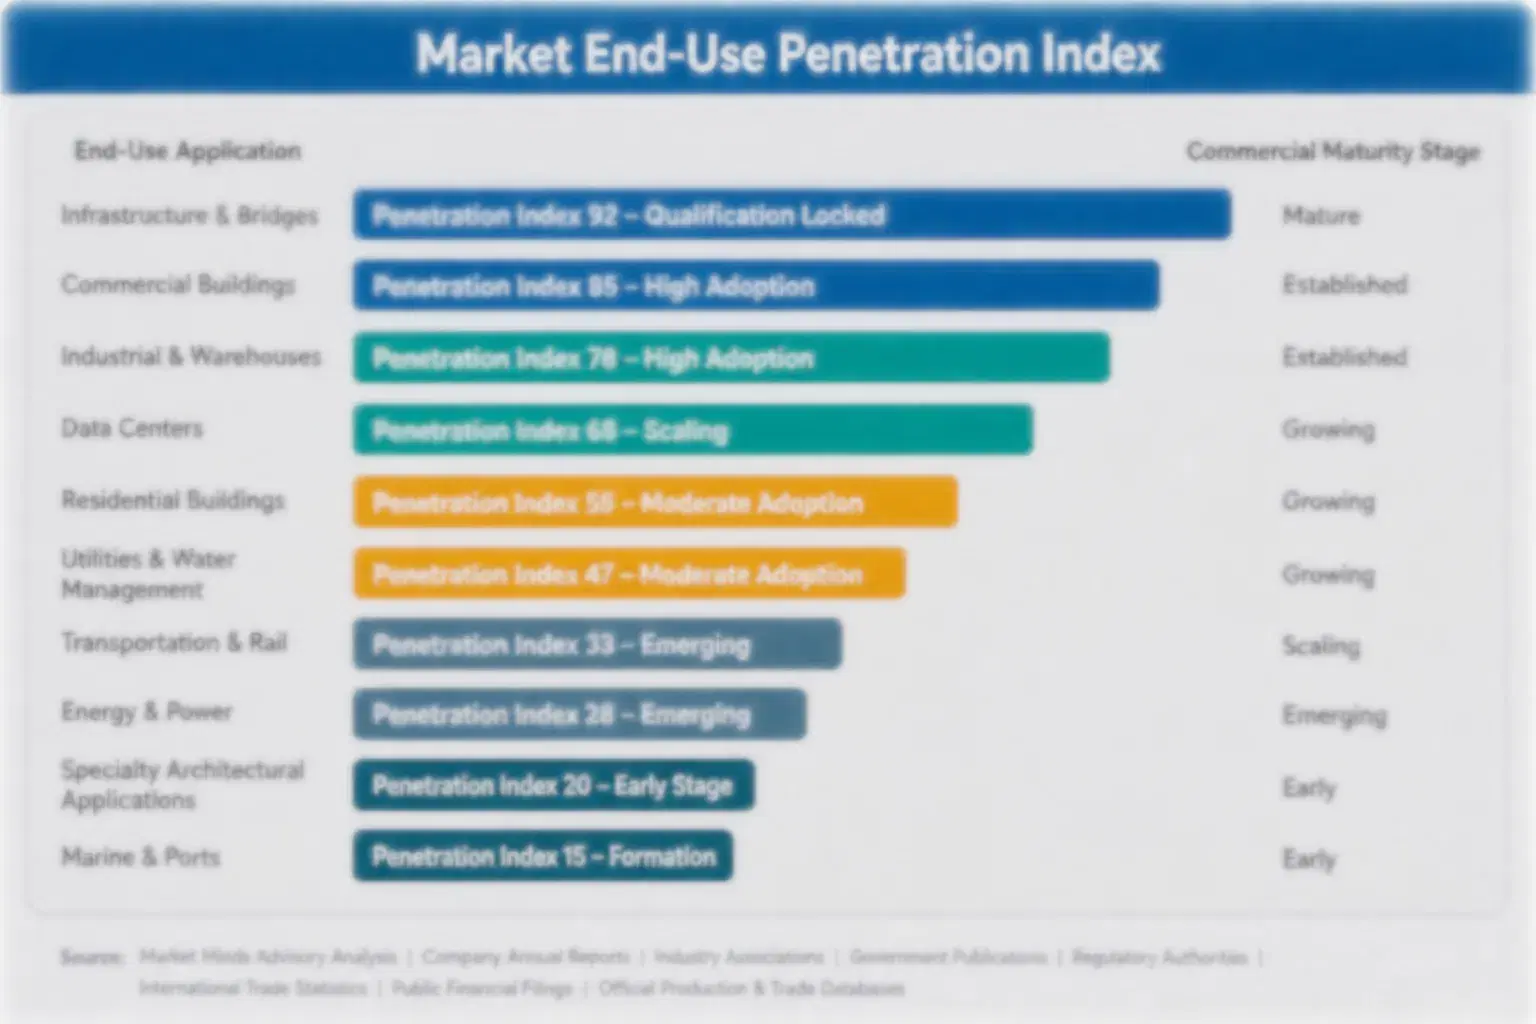
blood-sugar-breakfast-cereals-market-end-use-penetration-index-1789769970011

MMA Verdict on Glycemic Cereal Strategy

These are among the four positions where our research anticipates prominent divergence between winners and laggards over the coming forecast period. Each is grounded in the demand model, the regulatory perimeter, and the announced capacity pipeline.
01 / GLYCEMIC EVIDENCE STRATEGY

Fund Independent Glycemic Testing Before Retailers Demand It

Testing costs $8,000 to $15,000 per product and supports shelf prices 15% to 25% above unverified low-sugar cereals. Claim scrutiny is rising in Europe and Australia, so verified numbers protect listings. MMA recommends testing every lead product within 18 months and publishing results through retailer and app partners, because brands with independent evidence win health programs and clinician recommendations, while untested competitors face delisting and price pressure, and early publication builds trust that later entrants struggle to match, which compounds over time.
02 / PROTEIN PORTFOLIO INVESTMENT

Build Protein-Led Lines Before Private Label Catches Up

High-protein low-glycemic cereals grow at 11.3% a year, about 1.57 times the market rate, and earn gross margins of 40% to 50%. Extruder upgrades cost $2 million to $5 million. MMA advises securing annual pea and fava protein contracts and launching two protein-led lines within 24 months, because shoppers who adopt a protein cereal rarely switch, and early brands gain shelf space, data, and reference customers that late entrants cannot easily replicate, while data from those launches also improves negotiations with protein suppliers.
03 / MONITOR PARTNERSHIP CHANNEL STRATEGY

Partner With Glucose Monitor Apps and Clinics for Direct Recommendation

Monitor and clinic partnerships cut acquisition costs by 25% to 40% and lift repeat rates by 15 points, at referral fees of 3% to 6% of sales. Shoppers trust their own data. MMA recommends signing two monitor or app partnerships and one clinic program over the next two years, since brands that link named products to measured glucose responses gain loyal households, real-world evidence, and stronger negotiating positions with retailers, while data sharing agreements protect privacy and keep partnerships durable.
04 / TASTE PARITY REFORMULATION DISCIPLINE

Close the Taste Gap Before Scaling Distribution Across Retailers

Repeat rates trail conventional cereal by 20% to 30% because of texture and aftertaste, and reformulation adds 5% to 10% to unit cost. Trial without repeat wastes marketing spend. MMA advises funding sensory panels and blended sweetener and protein trials before expanding into new retailers, because a product that tastes ordinary earns second and third purchases, and every point of repeat rate gained is worth more than an equal point of distribution, while shelf space follows sales velocity, and buyers notice quickly.

Engagement Snapshot From the Field

A live engagement with an industry participant carrying material or product regulatory and market exposure ahead of a defining policy shift, showing how our research translates into a defensible multi-year portfolio strategy.
MARKET MINDS ADVISORY · CLIENT ENGAGEMENT SUMMARY
Blood Sugar Breakfast Cereals Producer Strategic Portfolio Review and Transition Roadmap 2026·Investment Scenario on Blood Sugar Breakfast Cereals Exposure Evaluation 2025-26
CLIENT PROFILE
The client is a mid-sized North American cereal manufacturer with three plants and roughly $380 million in annual revenue (client-reported, unverified by MMA), selling mostly conventional and lower sugar cereals through grocery chains. Gross margin sat near 27% (client-reported, unverified by MMA), and private label lines had taken share from its core brands for three consecutive years.
STRATEGIC CHALLENGE
Growth in core lines had stalled, two retail buyers asked for glycemic-tested products the client did not have, and larger competitors were launching protein cereals with monitor partnerships. Leadership needed a plan that justified testing and protein investment, protected shelf space, and lifted margin without overspending on extrusion capacity. The board wanted a decision within nine months, before the next retailer review cycle began.
MMA APPROACH
MMA benchmarked nine brands on evidence, pricing, and channel mix, interviewed retailers, dietitians, and diabetic households about purchase drivers, and modeled the economics of testing, a protein line, monitor partnerships, and subscription sales under bull, base, and bear scenarios. Analysts also reviewed the client's plant capacity, retailer contracts, and recipe library.
KEY FINDINGS
  1. Independent glycemic testing on four core products would cost about $50,000 and support premium pricing of 15% to 20%, according to retailer interviews.
  2. A protein-led line using existing extruders with modest upgrades of about $3 million (client-reported, unverified by MMA) could reach 12% of revenue within three years.
  3. A monitor app partnership would give the client direct reach to 400,000 households and cut acquisition costs by roughly one third, based on partner discussions.
  4. Subscription and pharmacy channels would add 8% of revenue at margins 10 points above grocery, though fulfillment needed new capability in the first two years.
CLIENT PROFILE
The client is a mid-sized North American cereal manufacturer with three plants and roughly $380 million in annual revenue (client-reported, unverified by MMA), selling mostly conventional and lower sugar cereals through grocery chains. Gross margin sat near 27% (client-reported, unverified by MMA), and private label lines had taken share from its core brands for three consecutive years.
STRATEGIC CHALLENGE
Growth in core lines had stalled, two retail buyers asked for glycemic-tested products the client did not have, and larger competitors were launching protein cereals with monitor partnerships. Leadership needed a plan that justified testing and protein investment, protected shelf space, and lifted margin without overspending on extrusion capacity. The board wanted a decision within nine months, before the next retailer review cycle began.
MMA APPROACH
MMA benchmarked nine brands on evidence, pricing, and channel mix, interviewed retailers, dietitians, and diabetic households about purchase drivers, and modeled the economics of testing, a protein line, monitor partnerships, and subscription sales under bull, base, and bear scenarios. Analysts also reviewed the client's plant capacity, retailer contracts, and recipe library.
KEY FINDINGS
  1. Independent glycemic testing on four core products would cost about $50,000 and support premium pricing of 15% to 20%, according to retailer interviews.
  2. A protein-led line using existing extruders with modest upgrades of about $3 million (client-reported, unverified by MMA) could reach 12% of revenue within three years.
  3. A monitor app partnership would give the client direct reach to 400,000 households and cut acquisition costs by roughly one third, based on partner discussions.
  4. Subscription and pharmacy channels would add 8% of revenue at margins 10 points above grocery, though fulfillment needed new capability in the first two years.
RECOMMENDED STRATEGY
Phase 1: Phase 1 (Months 1-6): Test four core products for glycemic index, publish results, and reformulate two recipes to lower sugar and higher fiber. Phase 2: Phase 2 (Months 7-18): Upgrade one extruder, launch a protein-led line, and sign a monitor app partnership with retailer co-promotion in two chains. Phase 3: Phase 3 (Months 19-30): Add subscription and pharmacy channels, scale the protein line, and review pricing formulas quarterly with each retailer.
OUTCOME
Within 30 months, protein-led and tested lines reached about 20% of revenue, and gross margin rose from 27% to about 34% (client-reported, unverified by MMA). Two retailers added the products to health programs, monitor partnership sales met plan, and the board approved a second extruder line for the following year.

Frequently Asked Questions

Foundational context covering the market sizes, CAGR, scope, country, region and competition that inform every finding below. This section is provided to cover basics and most often pre-purchase conversations, answered from the MMA Primary Research Dataset.

What is the current size of the Blood Sugar Breakfast Cereals Market?

The global blood sugar breakfast cereals market was valued at $6.4 billion in 2025. This covers low-glycemic, high-fiber, high-protein, and sugar-free cereals sold through retail, pharmacy, and online channels.

How large will the Blood Sugar Breakfast Cereals Market be by 2036?

MMA projects the market will reach approximately $13.8 billion by 2036. This represents cumulative growth of roughly $6.9 billion over the full ten-year forecast window.

What is the CAGR for the Blood Sugar Breakfast Cereals Market 2026 to 2036?

The market is forecast to grow at a 7.2% compound annual rate between 2026 and 2036. The bull case reaches 8.5% while the bear case falls to 5.9%.

Which segment is growing fastest?

High-Protein Low-Glycemic Cereals is the fastest-growing segment at 11.3% CAGR, roughly 1.57 times the overall market rate. High-Fiber Whole-Grain Cereals follows as the second-fastest segment at 8.6% CAGR each year.

Who are the major companies in the Blood Sugar Breakfast Cereals Market?

Leading companies include Kellogg's, General Mills, Nestle, Post Holdings, and Bob's Red Mill. These five brands together hold an estimated 38% of total global market revenue, based on MMA analysis of company disclosures.

Which country is growing fastest?

India is the fastest-growing major market, expanding at approximately 10.4% CAGR each year. Rising diabetes awareness and urban breakfast habits are driving this above-market growth across the country.

Report Segmentation Architecture

The full report scope spans multiple orthogonal segmentation dimensions, with cross-tabulated demand data provided for each dimension pair. Coverage extends further to regional breakdowns, trend trajectories, and the competitive detail needed to support segment-level decision-making.

By Primary Market Dimension

  • High-Protein Low-Glycemic Cereals
  • High-Fiber Whole-Grain Cereals
  • Low-Sugar Conventional Cereals
  • Sugar-Free Sweetener-Based Cereals
  • Hot Cereals and Oat Products
  • Diabetic-Friendly Muesli and Granola

By End-Use Industry

  • Diabetic and Prediabetic Households
  • Weight-Management Consumers
  • Older Adult and Clinician-Guided Buyers
  • Institutional and Healthcare Catering
  • General Health-Conscious Shoppers

By Commercial Dimension

  • Supermarket and Hypermarket Retail
  • Pharmacy and Drugstore Channels
  • Online and Subscription Sales
  • Private Label Programs

By Region

  • North America
  • Western Europe
  • East Asia
  • South Asia and Pacific
  • Latin America
  • Middle East and Africa
  • Eastern Europe

Scope, Methodology, and Coverage

Every figure in this report is reproducible from documented input assumptions. The scope below maps the historical period, the forecast horizon, the segmentation dimensions, and the countries covered, alongside the underlying primary and qualitative methodology.
Historical Period
2020 to 2025
Forecast Period
2026 to 2036
Base Year
2025 (USD billions; MMA Primary Research Dataset, September 2026)
Market Definition
Blood sugar breakfast cereals are ready-to-eat and hot cereals formulated or certified for lower glycemic response, including low-glycemic index, high-fiber, high-protein, sugar-free, and diabetic-friendly lines sold through retail, pharmacy, and online channels. The scope excludes conventional sweetened cereals, cereal bars, granola snacks, infant cereals, and medical nutrition products sold under clinical supervision.
Quantitative Units
USD billions (current prices); tonnes for volume references
Segmentation Dimensions
By Formulation; By End-Use Industry; By Commercial Dimension; By Region
Regions Covered
North America, Western Europe, East Asia, South Asia and Pacific, Latin America, Middle East and Africa, Eastern Europe
Countries Covered
USA, Canada, Mexico, Brazil, Argentina, Chile, UK, Germany, France, Poland, Turkey, Saudi Arabia, UAE, Egypt, South Africa, China, Japan, South Korea, India, Australia, and additional markets relevant to this sector
Key Companies Profiled
Kellogg's, General Mills, Nestle, Post Holdings, Bob's Red Mill, Quaker Oats, Weetabix, Bagrry's, Saffola, Calbee, Seven Sundays, Magic Spoon, Catalina Crunch, Nature's Path, Kashi, Barilla, Uncle Sam, Familia, Holland and Barrett, Dr. Schar
Quantitative Methodology
Primary survey, n=3,800 respondents, Q4 2025, six countries; demand-side model with trade association cross-validation
Qualitative Methodology
47 expert interviews, Q4 2025; applied to validate demand model assumptions, identify emerging dynamics, and assess competitive positioning
Report Format
PDF and XLSX data workbook (Word format preview document)
Publisher
Market Minds Advisory
Report Code
MMA-2026-AGR-306
Published
September 2026
Contact
sales@marketmindsadvisory.com | www.marketmindsadvisory.com

Purchase the full Blood Sugar Breakfast Cereals Market Report (2026 to 2036).

The full report delivers a detailed assessment of global blood sugar breakfast cereal demand, formulation mix, and competitive positioning through 2036. It includes segment forecasts by formulation, country-level data for all seven world regions, and profiles of the twenty companies most relevant to the category. Analysts also receive input cost modeling and portfolio margin benchmarking built from MMA's primary research dataset. A scenario planning module lets subscribers stress-test bull and bear assumptions against claim rules and ingredient prices. Quarterly updates keep the whole dataset current throughout the subscription year.
Ten-year segment and regional demand forecasts
Grain and protein price tracking by origin
Competitive benchmarking of top twenty brands
Glycemic claim rule and sugar tax modeling
Regional demand mechanism comparative analysis included
Quarterly primary survey data update access

Built For The People Who Decide

From boardroom strategy to bench-side execution, this report is read cover-to-cover by leaders shaping the next decade of their industry, turning demand scenarios, market dynamics and valuation benchmarks into decisions.
CXOs/ Presidents/ VPs/ Managers
M&A and Corporate Development
Strategy Teams and R&D Heads
Procurement and Product Directors
Regulatory and Compliance Leaders
Investor Relations and Equity Analysts