Market Minds Advisory
Blood Cancer Treatment Market

Blood Cancer Treatment Market: When Manufacturing Capacity Became The Real Bottleneck

A commercial reading of blood cancer treatment, where CAR-T therapy finally proved it can cure patients chemotherapy never could, and manufacturing capacity has become the industry's genuine real bottleneck now.

Lead Analyst

Alice Ballenger

Published

September 2026

Make Smarter Decisions with Customized Research Insights

Request a free sample report and evaluate market opportunities, growth trends, and competitive dynamics relevant to your business needs.

2025 MARKET VALUE$45.0BMarket Size 2025
2036 FORECAST VALUE$118.5BBase Case , 2026 to 2036
CAGR 2026 TO 20369.2 %Bull 10.4% / Bear 7.9%
INCREMENTAL OPPORTUNITY$69.3BNet 10- year value creation
EXPANSION MULTIPLE2.41x2036 value over 2026 base
Strategic Levers
M&A Pipeline
Regional Outlook
Country Rankings
Competitive Intelligence
Segmental Deep-dive
Call-Us : 91 93563 13602

Executive Snapshot and Market Trajectory

Blood cancer treatment crossed a genuine threshold once CAR-T therapy started producing durable remissions in patients who had exhausted every conventional treatment option available to them. The constraint shifted from finding a working therapy to actually manufacturing enough of it fast enough for patients waiting.
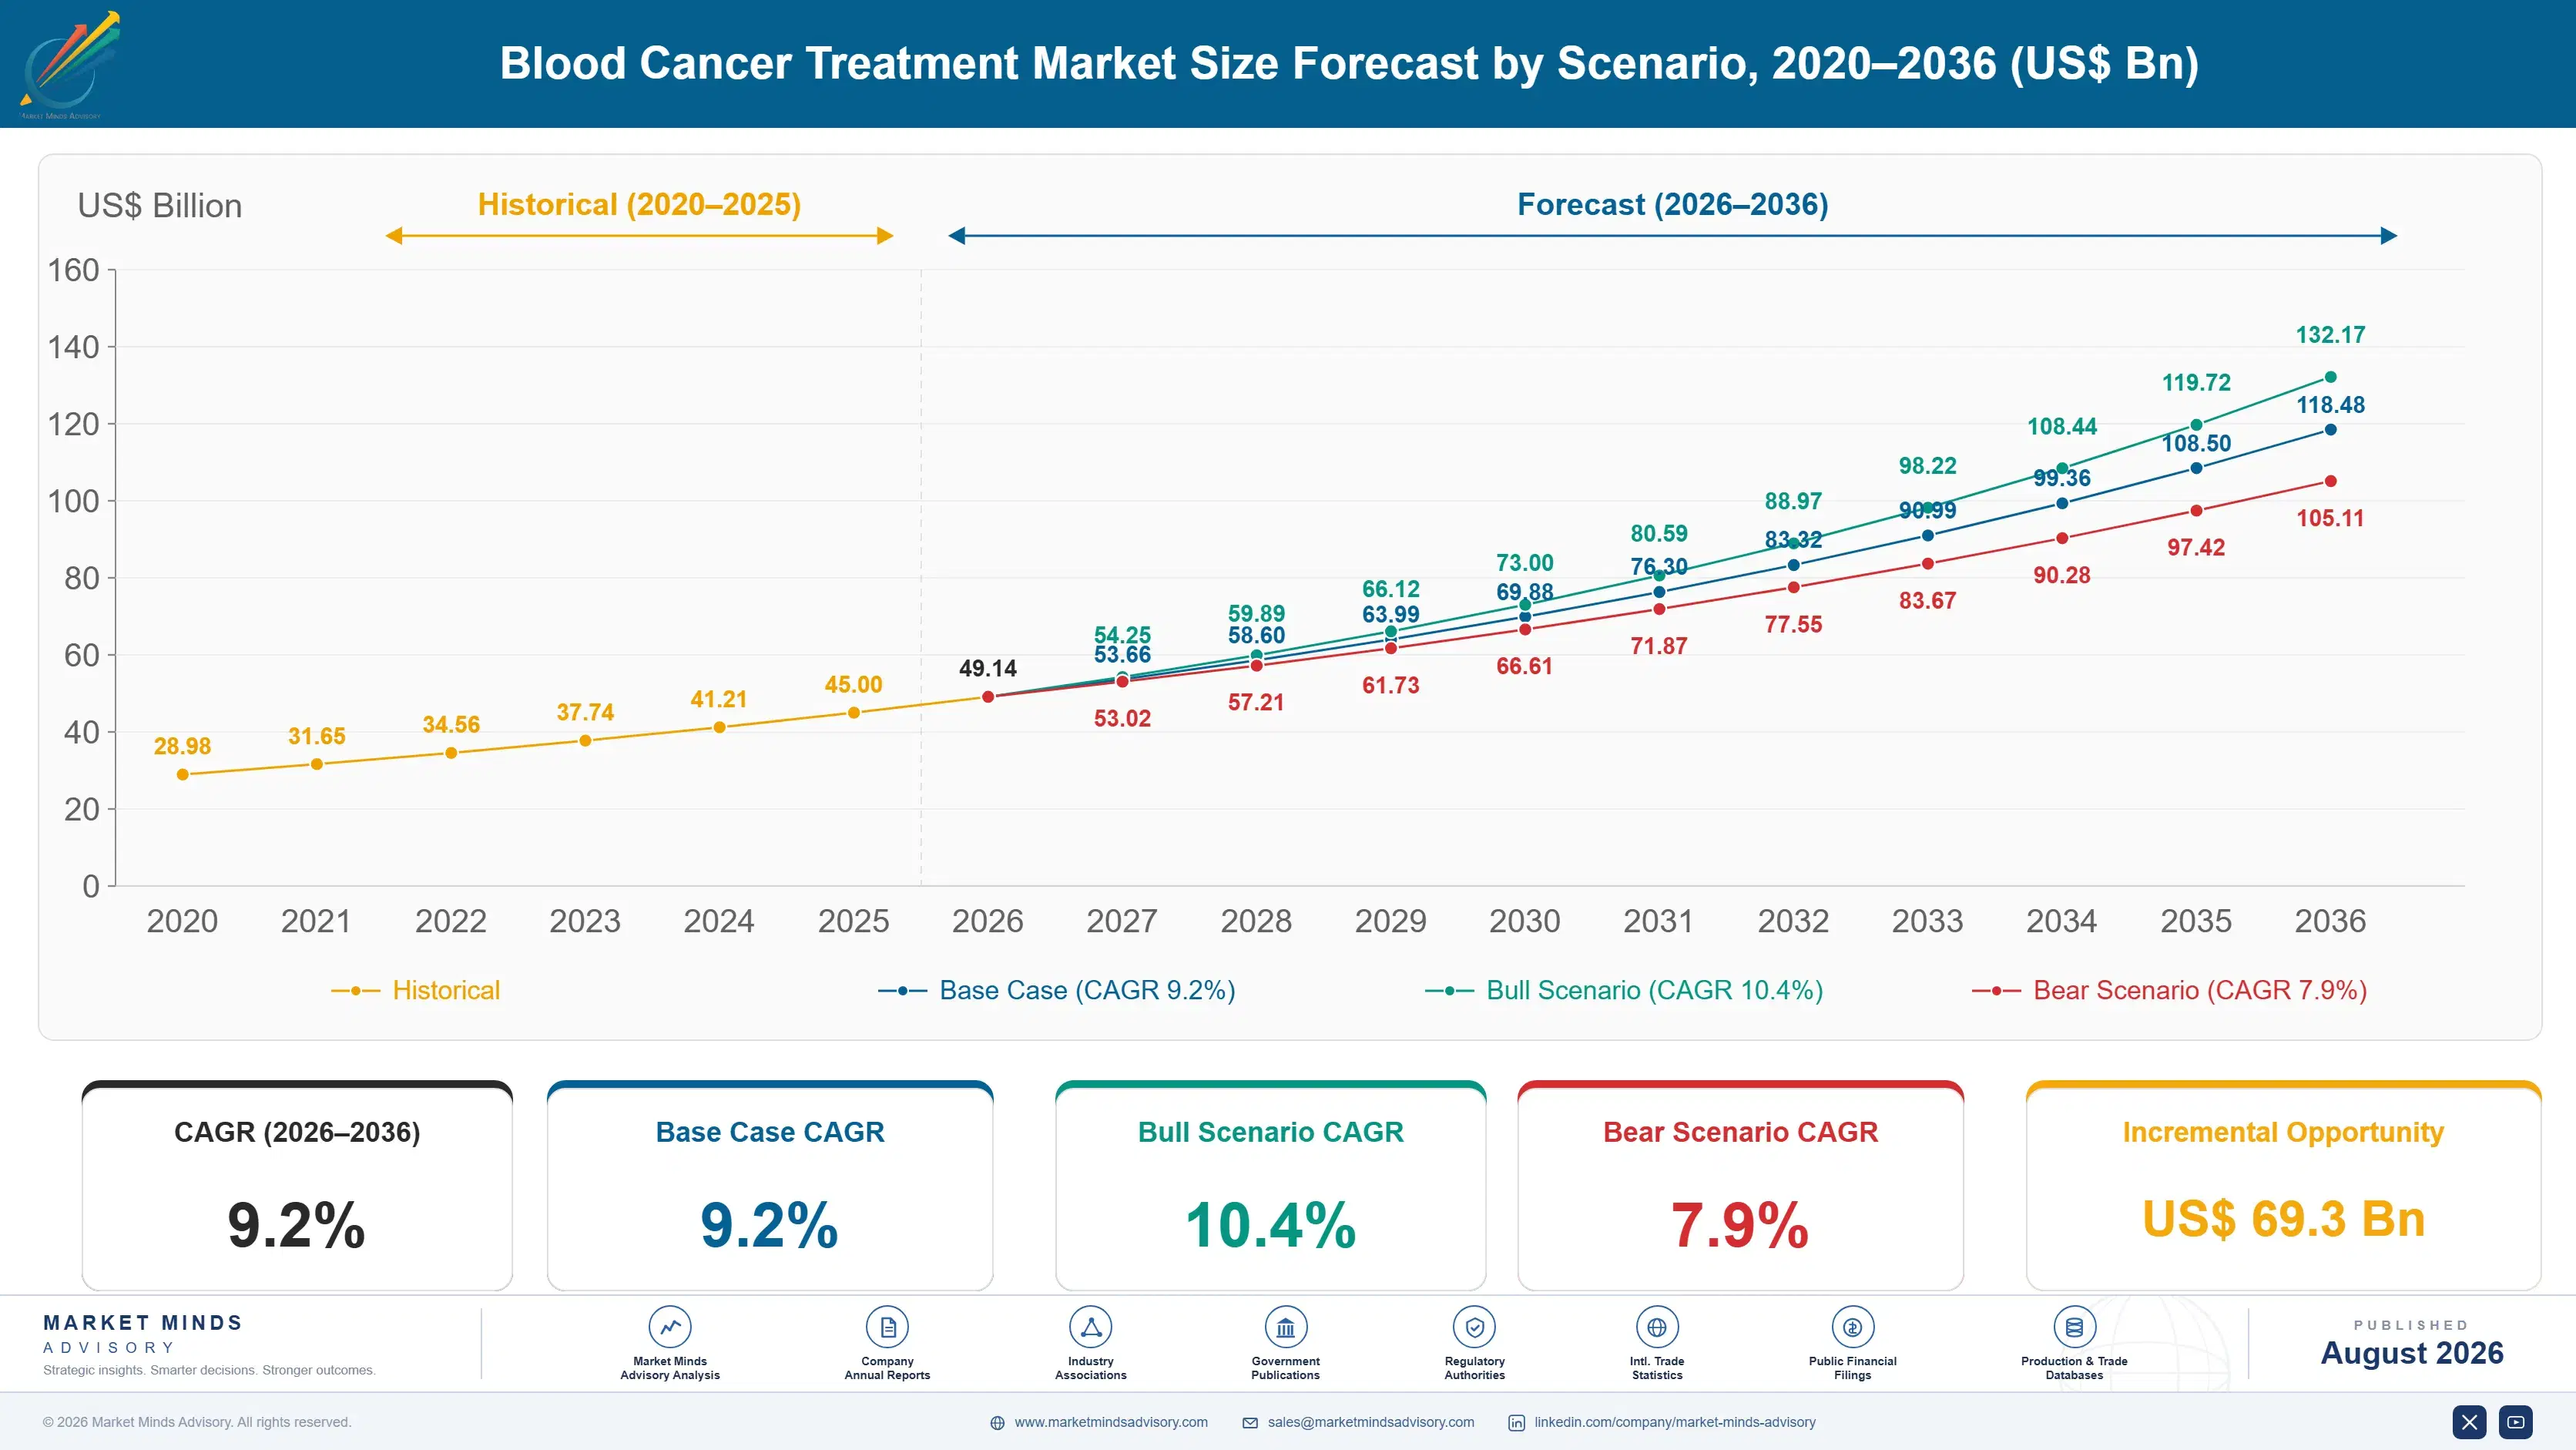
The market stands at USD 45.0 billion in 2025 and reaches USD 118.48 billion by 2036 at a 9.2% CAGR. CAR-T cell therapy grows fastest at 15.1%, roughly 1.64 times the overall rate, as manufacturing capacity expands and approvals extend into earlier treatment lines across most major markets. North America holds 38% of value on dense reimbursement infrastructure and the deepest concentration of specialized treatment centers, while Germany posts the quickest national growth at 11.8%.
Concentration is high at roughly 48%, dominated by biopharmaceutical majors holding both approved cell therapy platforms and the manufacturing infrastructure required to produce them at meaningful scale across most patient populations. Two forces dominate the period ahead. CAR-T manufacturing capacity is finally catching up with patient demand after years of production bottlenecks limiting access, and bispecific antibodies are emerging as an off-the-shelf alternative that sidesteps the personalized manufacturing constraint entirely.
Market Definition
The blood cancer treatment market covers therapeutic products and treatment modalities specifically indicated for leukemia, lymphoma, and multiple myeloma, valued at manufacturer revenue. Solid tumour oncology products and diagnostic testing services are excluded.
Base Year Value
$45.0B in 2025 (MMA Primary Research Dataset, August 2026)
Forecast Period
2026 to 2036, eleven discrete annual values
CAGR
9.2% base case. Bull 10.4%. Bear 7.9%.
Fastest Growth Segment
CAR-T Cell Therapy: 15.1% CAGR
Fastest Growth Country
Germany: 11.8% CAGR
Fastest Growth Region
South Asia and Pacific: 11.2% CAGR
Largest Region
North America: 38% of 2025 global value
Market Leaders
Bristol Myers Squibb, Johnson & Johnson, Novartis, Gilead Sciences, AbbVie. Source: MMA Analysis based on company annual reports.
Primary Survey
n=3,800 procurement and R&D decision-makers, Q4 2025, six countries
Methodology
Demand-side build-up, cross-validated against public data, 47 expert interviews

Blood Cancer Treatment Market Forecast Scenarios

blood-cancer-treatment-market-size-forecast-scenario-1787332195125
Growth from 2020 to 2025 compounded near 8.0%, and CAR-T therapy approvals expanded from a single indication into multiple blood cancer types, converting cell therapy from an experimental last resort into a genuine standard-of-care option for eligible patients. Manufacturing capacity constraints limited how quickly newly approved therapies could reach the full addressable patient population throughout the period, leaving considerable unmet demand behind even as clinical results kept improving.
Three mechanisms carry the base case to 9.2%. First, CAR-T manufacturing capacity expansion finally catching up with approved indications, converting years of production-constrained access into genuine patient reach. Second, bispecific antibodies reaching commercial scale as an off-the-shelf alternative that avoids the personalized manufacturing bottleneck cell therapy still faces. Third, regulatory approvals extending cell therapy into earlier treatment lines, expanding the addressable patient population considerably beyond the relapsed and refractory patients who could access it initially.
The bull case at 10.4% assumes manufacturing capacity expands faster and earlier-line approvals broaden the addressable patient population considerably across most eligible categories. The bear case at 7.9% assumes manufacturing bottlenecks persist longer than expected, reimbursement negotiations in major markets slow pricing realisation, and bispecific antibody adoption cannibalises CAR-T revenue faster than the category can grow.

Why Eligibility, Not Efficacy, Now Limits Patient Access

Three forces set demand here. Clinical efficacy drives the most durable volume, as CAR-T therapy produces durable remissions in patients who exhausted conventional treatment options previously. Manufacturing capacity drives a second stream, since expanded production infrastructure is finally letting approved therapies reach more eligible patients. Regulatory expansion drives a third stream, as approvals extend into earlier treatment lines beyond relapsed and refractory patients.
MARKET CONCENTRATIONCR5: 48%Highly concentrated across five biopharmaceutical majors with cell therapy platforms
CAR-T TREATMENT COSTUSD 400K to 500KAverage treatment cost for a single CAR-T cell therapy infusion
ELIGIBLE PATIENT ACCESS RATEAbout 35%Share of eligible patients who actually receive CAR-T therapy currently
DURABLE REMISSION RATEAbout 40%Durable remission rate achieved in patients responding to CAR-T therapy
VEIN-TO-VEIN TIMELINE3 to 6 weeksTime from patient referral to CAR-T cell therapy infusion
MANUFACTURING COST SHAREAbout 50% of costShare of treatment cost attributable to cell manufacturing and logistics
The commercial character is defined by a widening gap between clinical eligibility and actual treatment access. A patient can be clinically eligible for CAR-T therapy yet wait months for a manufacturing slot, a referral to a specialized center, or reimbursement approval, and some patients do not survive that wait. That mismatch concentrates risk with manufacturers whose capacity lags approved indications, and rewards manufacturers who scale ahead of demand.
The decade turns on whether off-the-shelf approaches like bispecific antibodies can match CAR-T's durable remission rates without requiring the personalized manufacturing process that limits patient access today. Manufacturing scalability and treatment durability remain the primary factors separating transformative therapies from incremental improvements. That shift matters more than any single approval, because it determines how many eligible patients actually receive transformative treatment rather than staying on the waiting list.
"The clinical trial proved the therapy works. What decides commercial winners now is a far duller question: can you actually manufacture enough doses for the patients who qualify."
Director, Oncology and Cell Therapy Practice · MMA Healthcare / Oncology Therape

Market Trends

Manufacturing Expansion Is Converting Rationing Into Reach

CAR-T manufacturing capacity has expanded considerably beyond the tightly constrained production infrastructure that limited patient access during the therapy's earliest commercial years, as manufacturers built additional production facilities and shortened the vein-to-vein manufacturing timeline that once forced patients to wait months for their engineered cells. That expansion is converting CAR-T from a therapy rationed by production capacity into one increasingly limited only by clinical eligibility and physician referral patterns, a fundamentally different and far more addressable constraint. Manufacturers who invested early in production scale-up are now capturing patient volume that capacity-constrained competitors simply cannot serve.
Market Impact: Achieves durable remission in 40%
Bispecific Antibodies Are Sidestepping The Manufacturing Bottleneck

Bispecific antibodies, which redirect a patient's own immune cells against cancer without requiring the personalized cell engineering CAR-T therapy demands, are emerging as a genuine off-the-shelf alternative that sidesteps the manufacturing bottleneck that has constrained cell therapy access since its earliest approvals. That capability matters considerably for patients in regions or treatment settings lacking access to specialized CAR-T manufacturing infrastructure, since a bispecific antibody can be administered essentially anywhere equipped to deliver standard infusion therapy. Manufacturers with strong bispecific antibody pipelines are positioning against CAR-T's inherent manufacturing constraint directly and deliberately.
Market Impact: Cuts manufacturing wait times by 40

Market Opportunities and Growth Drivers

Clinical Efficacy Is Creating Durable, Inelastic Demand

CAR-T therapy demonstrates durable remission rates in blood cancer patients who had exhausted conventional chemotherapy and targeted therapy options entirely, converting cell therapy from an experimental last resort into a genuine standard-of-care option that oncologists increasingly consider earlier in the treatment pathway rather than after every alternative fails. That clinical demonstration creates durable demand regardless of underlying healthcare spending cycles, since patients facing otherwise terminal blood cancer diagnoses represent genuinely inelastic demand for a therapy proven to extend survival meaningfully. Each new indication expansion adds directly to addressable patient population without requiring independent commercial persuasion from manufacturers already established.
Market Impact: Treatment costs exceed 400000 dolla

Manufacturing Capacity Is Finally Catching Up With Demand

Manufacturing capacity expansion has finally started catching up with approved CAR-T indications, converting a therapy once rationed by production bottlenecks into one increasingly limited only by physician referral and clinical eligibility rather than by how many doses a manufacturer can actually produce in a given quarter. That capacity expansion creates demand independent of broader healthcare spending cycles, since manufacturers with available production slots can serve patients regardless of macroeconomic conditions affecting other categories. Each additional manufacturing facility coming online adds directly to addressable patient volume without requiring independent commercial persuasion.
Market Impact: Serious toxicity affects 30% of pat

Market Restraints and Challenges

Treatment Cost Strains Payer Budgets And Delays Access

CAR-T cell therapy typically costs several hundred thousand dollars per patient, a price point that strains healthcare payer budgets and forces genuinely difficult reimbursement negotiations even in wealthy healthcare systems with established oncology coverage frameworks. The root cause is that personalized cell manufacturing, involving extracting a patient's own immune cells, genetically engineering them, and manufacturing a patient-specific product, carries costs that conventional mass-produced pharmaceuticals never face. The commercial impact is that reimbursement approval timelines delay patient access even after regulatory approval grants clinical availability. Mitigation runs through outcomes-based pricing agreements, manufacturing cost reduction, and payer risk-sharing arrangements.
Market Impact: Cuts manufacturing time by 40%

Toxicity Risk Confines Treatment To Specialized Centers

CAR-T therapy carries genuine risk of serious side effects, including cytokine release syndrome and neurological toxicity, that require specialized intensive care monitoring capability most community hospitals simply do not have available on site. The root cause is that engineered immune cells can trigger an intense, sometimes life-threatening inflammatory response that requires rapid clinical intervention from teams experienced specifically in managing this particular complication. The commercial impact is that treatment stays concentrated in specialized academic medical centers rather than spreading to community oncology practices broadly. Mitigation runs through community physician training, outpatient monitoring protocols, and improved cell engineering reducing toxicity.
Market Impact: Reaches 100% of infusion-capable se
3 additional market trends, 4 additional growth drivers, and 2 additional restraints and challenges are covered in the full report. Contact sales@marketmindsadvisory.com to access the complete intelligence.

Segment CAGR and Growth Architecture

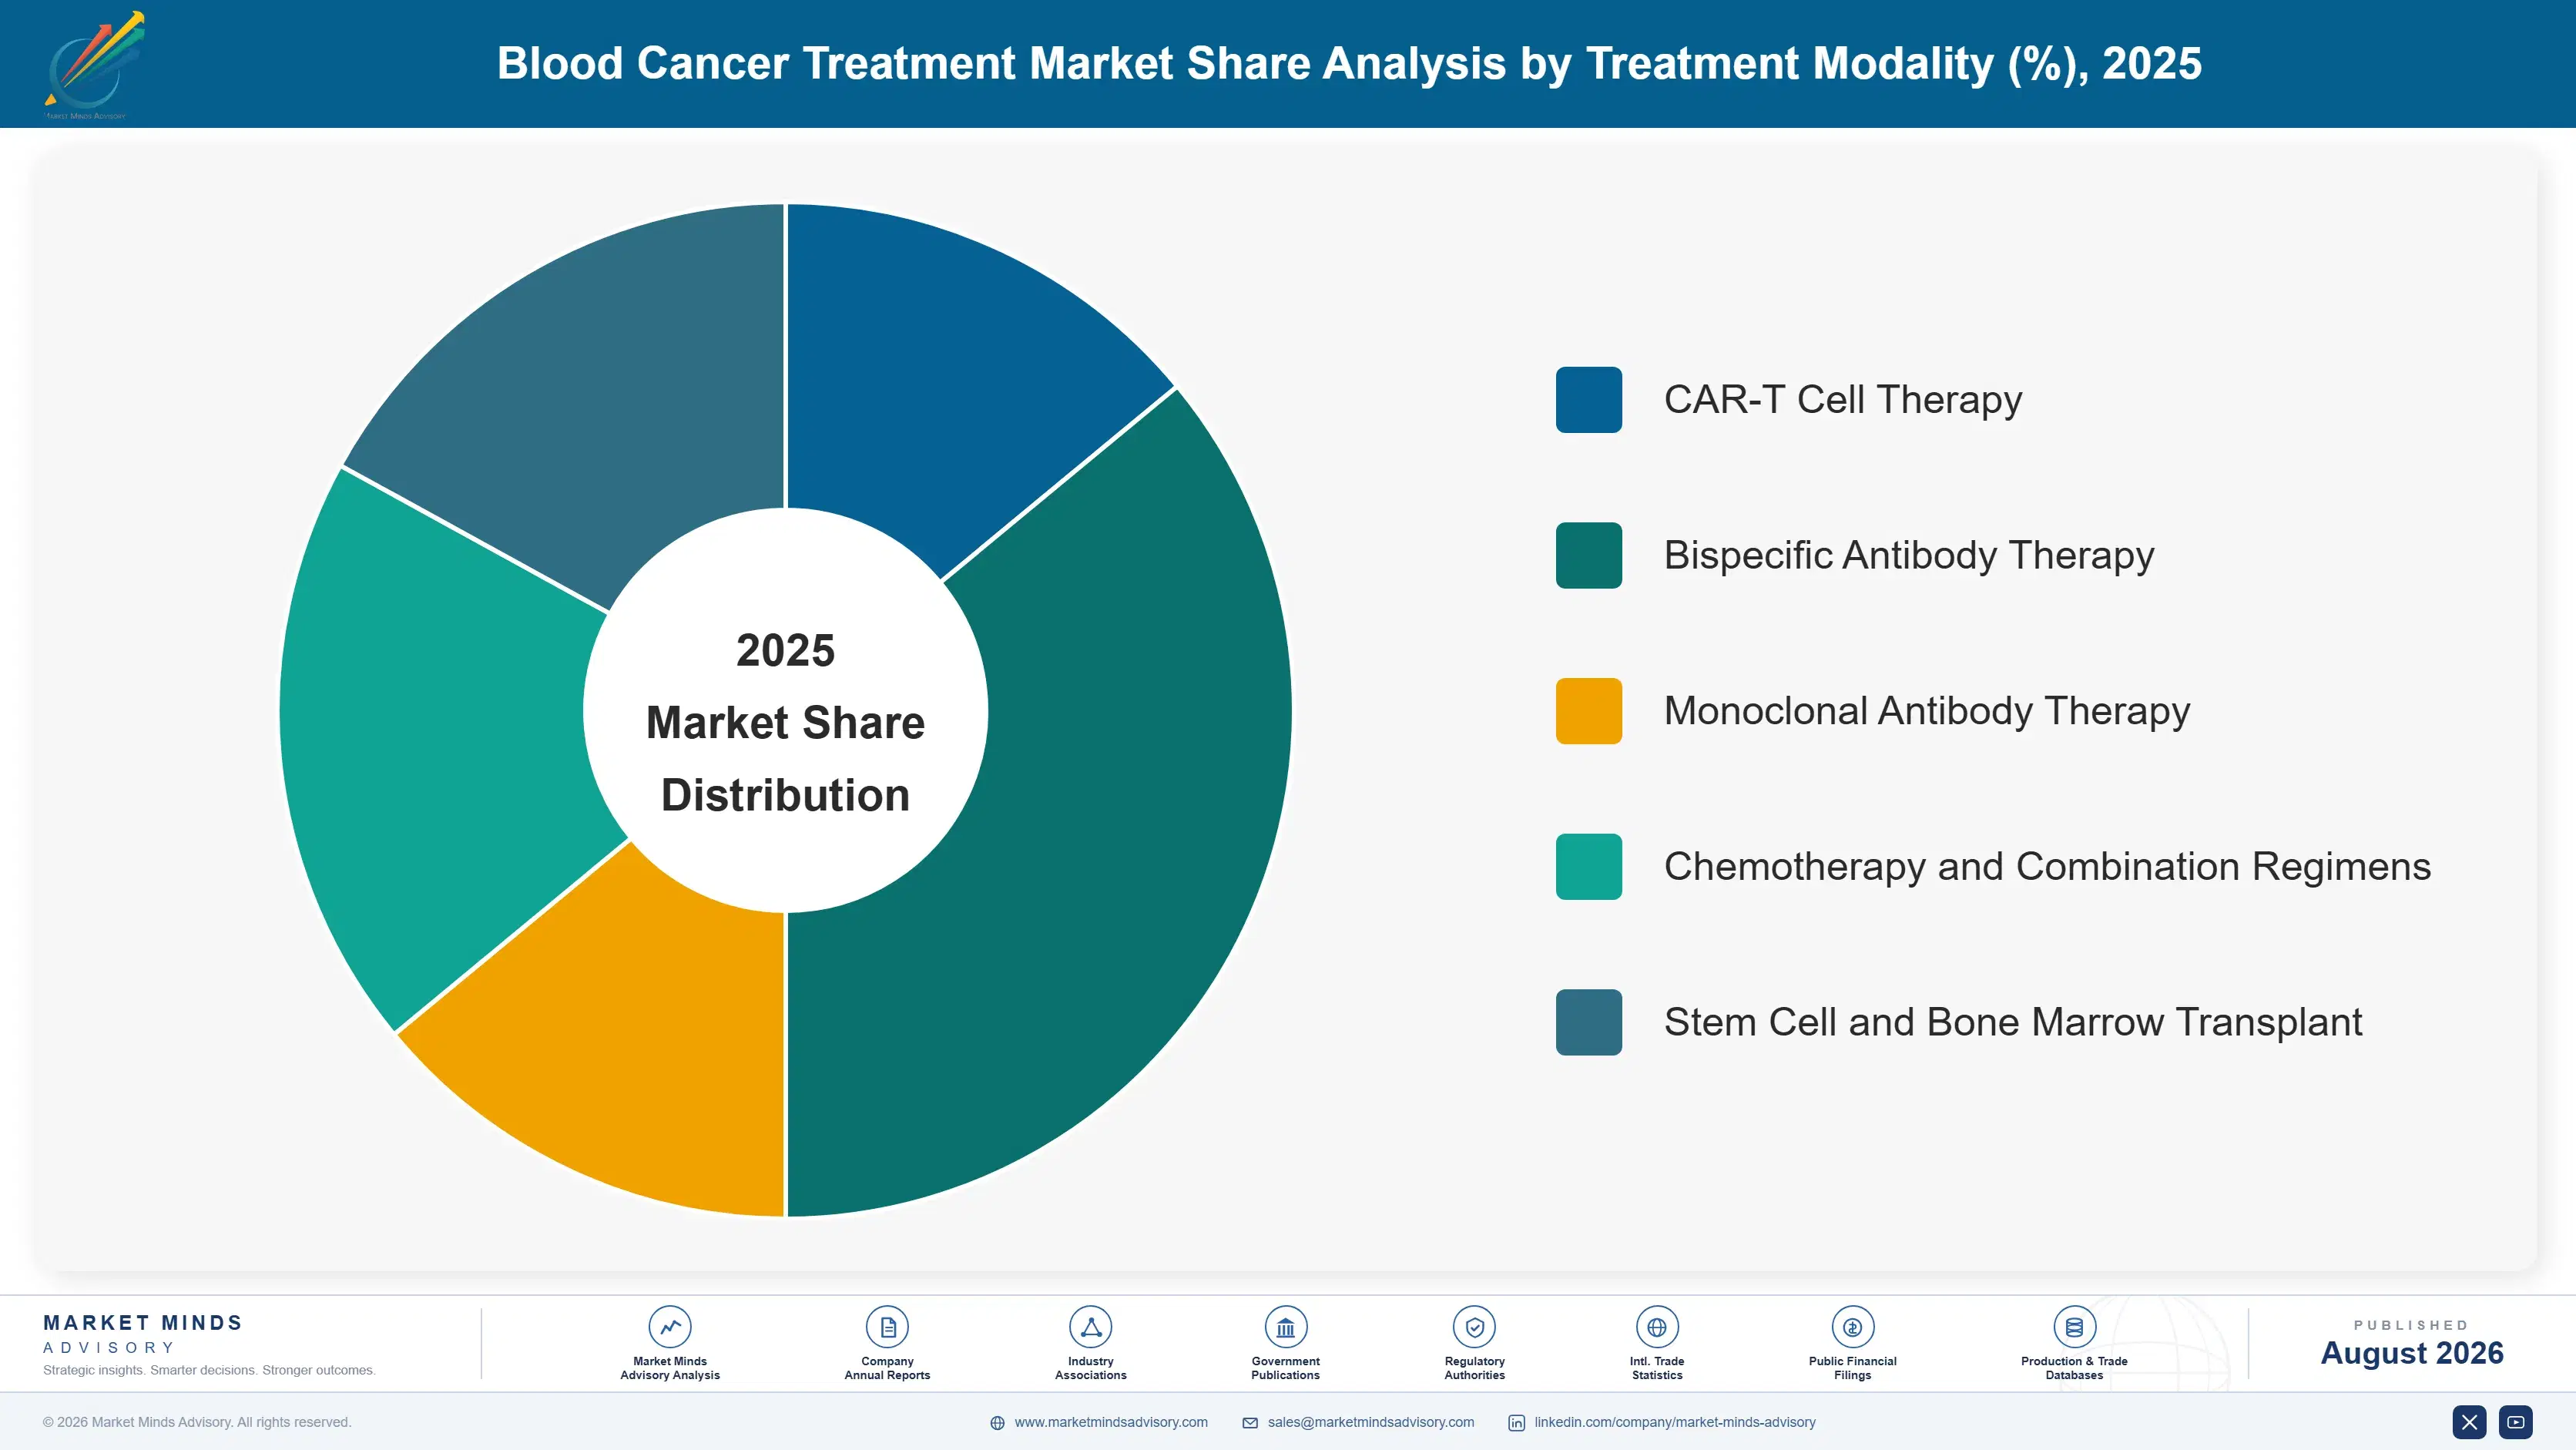
Segmentation follows treatment modality, a single clinical logic describing what mechanism actually attacks the cancer rather than which blood cancer type it treats specifically. Each modality carries its own manufacturing requirement, cost structure, and toxicity profile, so commercial position tracks the underlying mechanism rather than the specific disease indication it happens to address currently.
blood-cancer-treatment-market-market-share-analysis-1787332195658

CAR-T Cell Therapy

CAR-T cell therapy grows fastest at 15.1%, about 1.64 times the overall 9.2% rate, as manufacturing capacity expansion finally lets approved therapies reach more of their eligible patient population while regulatory approvals extend into earlier treatment lines across most major markets. Growth concentrates where manufacturers have solved the production bottleneck that once rationed access, since a therapy with proven durable remission rates faces genuinely inelastic demand once manufacturing capacity allows physicians to actually offer it. Bristol Myers Squibb and Gilead Sciences hold established positions in this segment, built on years of cell therapy manufacturing investment. Manufacturing scale and vein-to-vein timeline remain the primary factors separating credible offerings from therapies still constrained by production capacity alone.
CAGR 15.1%

Bispecific Antibody Therapy

Bispecific antibody therapy grows at 12.4%, redirecting a patient's own immune cells against cancer without requiring the personalized cell engineering CAR-T therapy demands, sidestepping the manufacturing bottleneck that has constrained cell therapy access since its earliest approvals reached patients. Adoption is concentrated in treatment settings lacking access to specialized CAR-T manufacturing infrastructure, since a bispecific antibody can be administered essentially anywhere equipped to deliver standard infusion therapy safely. Johnson & Johnson and AbbVie hold strong positions built on decades of monoclonal and bispecific antibody development experience across multiple oncology indications. Durability of remission compared to CAR-T remains the primary constraint on how broadly this format can substitute for cell therapy.
CAGR 12.4%
Full segment breakdown across 5 segments available in the complete report.

Regional Architecture and Country Demand Map

Reimbursement infrastructure depth and specialized treatment center concentration, rather than population, set this seven-region value distribution across the market. North America dominates on drug pricing and reimbursement infrastructure, East Asia follows on treatment center scale, and Germany grows fastest on reimbursement speed and treatment center density.

North America

North America holds 38% of value at 10.4% growth, well above the 22 to 32% band, because US drug pricing, faster FDA approval timelines, and the deepest concentration of specialized cell therapy treatment centers together make it the dominant market for advanced blood cancer treatment. Bristol Myers Squibb and Gilead Sciences both maintain deep domestic commercial infrastructure spanning years of cell therapy manufacturing and treatment center relationships. US oncologists are among the earliest adopters of newly approved CAR-T and bispecific therapies globally, reflecting regulatory and reimbursement speed advantage. Canadian demand follows comparable patterns at smaller scale. Domestic reimbursement frameworks increasingly treat cell therapy as standard oncology practice rather than a last resort.
Share: 38% | CAGR: 10.4% (2026 to 2036)

Western Europe

Western Europe holds 22% of value at 7.6% growth, shaped by strong national health system reimbursement frameworks that increasingly cover CAR-T and bispecific therapy despite considerably slower approval timelines than the United States typically achieves across most member states. Novartis and Johnson & Johnson both hold deep regional positions built on decades of oncology drug development and treatment center relationships across the continent. German and French treatment centers lead regional adoption, driven by comparatively faster national reimbursement decisions than other member states manage. Growth reflects steady expansion into remaining indications rather than any dramatic new adoption wave, since much of the addressable academic medical center network already offers cell therapy access.
Share: 22% | CAGR: 7.6% (2026 to 2036)
Regional intelligence for 5 additional markets available in the complete report: East Asia, South Asia and Pacific, Latin America, Middle East and Africa, Eastern Europe. Contact sales@marketmindsadvisory.com.
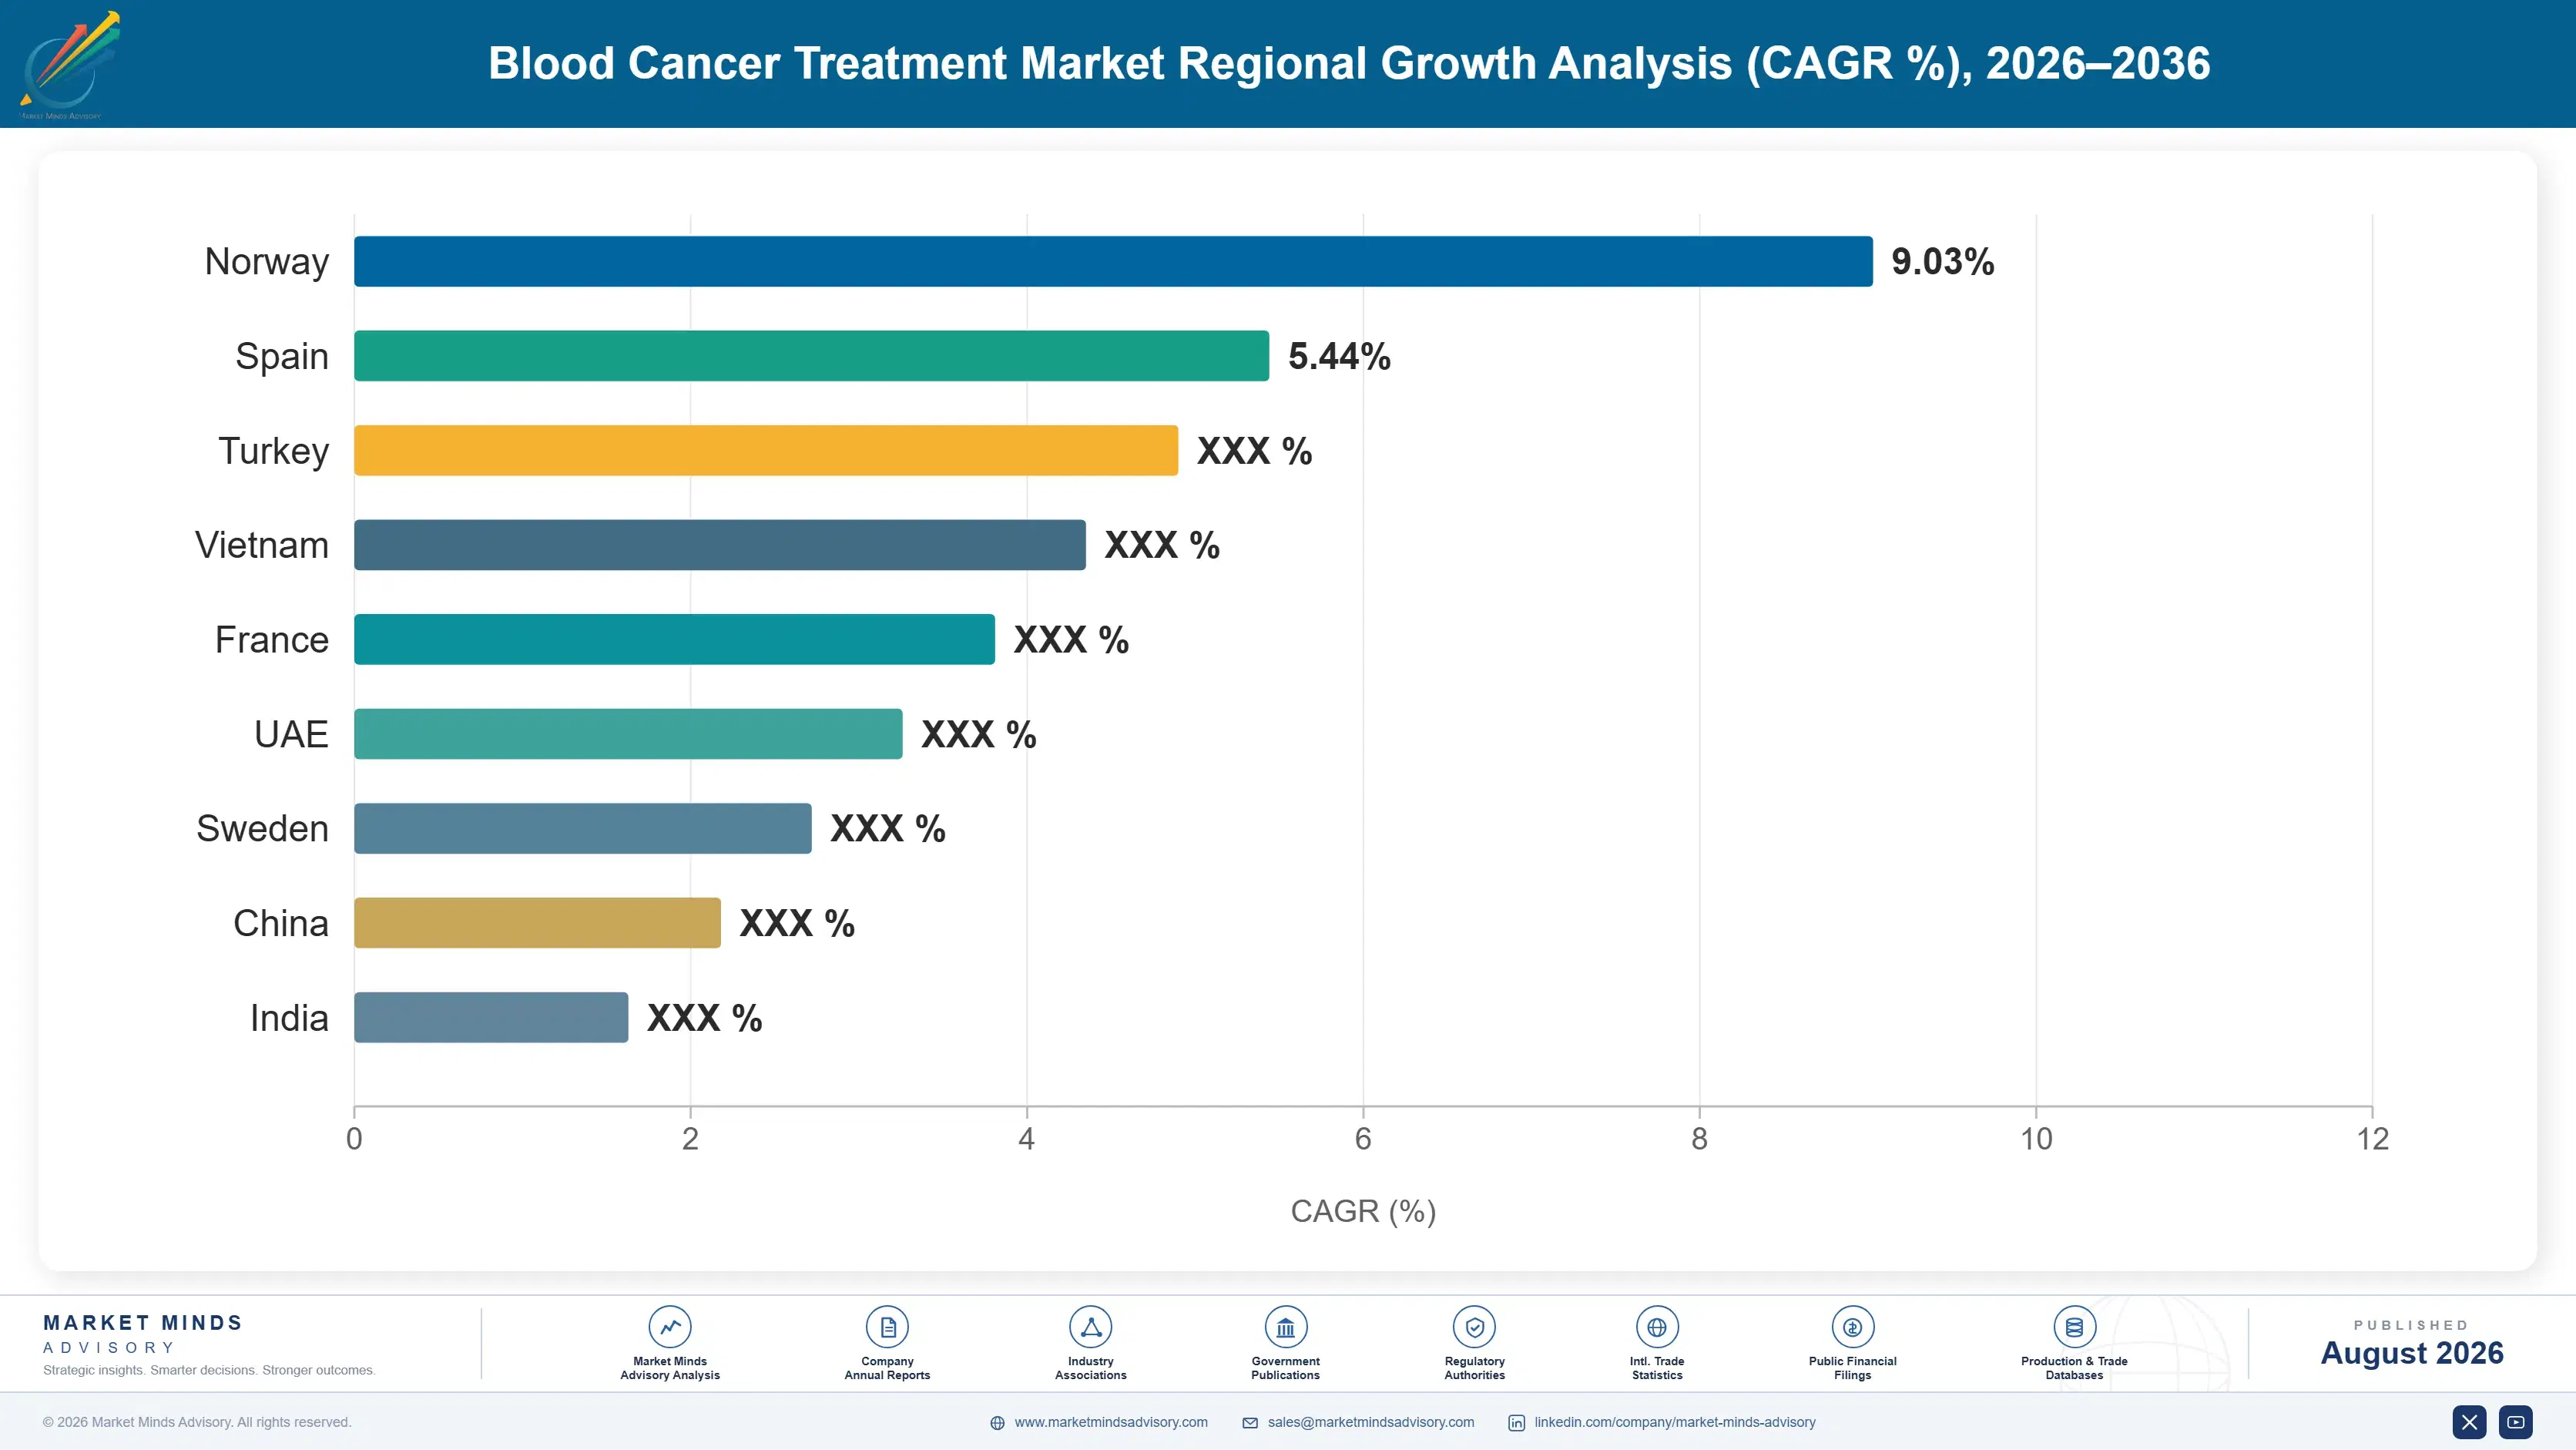
blood-cancer-treatment-market-country-cagr-analysis-1787332196173

Where Blood Cancer Treatment Manufacturers Hold Margin

A manufacturer selling a therapy still rationed by production bottlenecks while a competitor holds proven manufacturing scale and reimbursement relationships is competing on the wrong axis entirely. The four moves below shift earnings toward what actually captures share: manufacturing capacity investment, off-the-shelf alternative development, earlier treatment line expansion, and outcomes-based reimbursement positioning built early for cost-conscious payers.

Expand Manufacturing Capacity Ahead Of Patient Demand

Manufacturers that expand cell therapy manufacturing capacity ahead of demand, rather than treating capacity as a reactive constraint, capture patient volume that capacity-limited competitors simply cannot serve regardless of clinical superiority. That capability commands a premium of 20 to 35% in effective realized revenue over capacity-constrained competitors, since manufacturing throughput directly determines how many patients a company can actually treat and bill for in a given period. Bristol Myers Squibb and Gilead Sciences built this manufacturing scale over years, and it is not quickly replicated by manufacturers entering the category late.
Market Impact: Commands a 20 to 35% throughput adv

Build Off-The-Shelf Bispecific Pipelines Early On

Off-the-shelf bispecific antibodies that avoid the personalized manufacturing constraint CAR-T therapy still faces reach patients in treatment settings lacking specialized cell therapy infrastructure, expanding addressable market considerably beyond what manufacturing-constrained cell therapy alone can reach at meaningful scale across all care settings. That accessibility advantage matters especially in the 60% of markets without dense academic medical center networks, since a bispecific antibody can be administered essentially anywhere equipped for standard infusion therapy. Johnson & Johnson and AbbVie have both built bispecific antibody pipelines that increasingly compete directly against manufacturing-constrained cell therapy alternatives.
Market Impact: Reaches 60% of markets lacking cell

Pursue Earlier-Line Approvals To Expand Population

Regulatory approvals extending cell therapy into earlier treatment lines, rather than confining it to relapsed and refractory patients who exhausted every alternative, expand the addressable patient population by roughly 40%, since earlier-line patients vastly outnumber the heavily pretreated population therapies initially targeted. Manufacturers positioned with earlier-line clinical trial data and regulatory submissions before competitors reach the same milestone capture first-mover advantage in physician prescribing habits that persist well beyond the initial approval. Each earlier-line approval expansion adds directly to addressable patient population without requiring independent commercial persuasion from manufacturers already established.
Market Impact: Earlier-line approvals now expand t

Structure Outcomes-Based Pricing Ahead Of Payers

Payers increasingly demand outcomes-based pricing arrangements, cutting payer financial risk by roughly 30%, that tie payment to actual treatment durability rather than accepting full upfront cost regardless of whether a patient achieves durable remission, and manufacturers who structure these arrangements proactively secure formulary access that competitors offering only traditional pricing struggle to match. That positioning reaches budget-constrained payers who might otherwise delay coverage decisions indefinitely, opening reimbursement conversations pure price negotiation could never access on its own. Manufacturers leading on outcomes-based pricing increasingly shape payer expectations that competitors must eventually match.
Market Impact: Outcomes pricing cuts payer risk by

Who Controls the Margin Pool

Concentration is high at roughly 48% for the top five, dominated by biopharmaceutical majors holding both approved cell therapy platforms and the manufacturing infrastructure required to produce them at scale. The gap between leaders and challengers is manufacturing capacity depth and reimbursement relationship maturity rather than raw clinical data alone, broadly comparable across established players. All participants are assessed on one basis, revenue from blood cancer therapeutics, excluding
Competition runs along three lines. First, manufacturing capacity depth, since that increasingly determines which manufacturers can actually serve their full addressable patient population. Second, off-the-shelf alternative development, which shapes market position for years once a manufacturer establishes bispecific antibody credibility. Third, earlier treatment line expansion, since indication breadth directly determines addressable patient volume regardless of clinical superiority.

Pressure is building from two directions. Large diversified pharmaceutical majors are acquiring specialist cell therapy biotechs to build manufacturing and clinical capability faster than organic development allows. Meanwhile smaller biotech specialists are winning niche indication approvals directly through faster clinical development than large incumbents typically manage. Rankings should favour manufacturers combining manufacturing depth with genuine off-the-shelf pipeline breadth over those competing on cell therapy scale alone.
blood-cancer-treatment-market-company-positioning-matrix-1787332196691

Competitive Moat and Risk Dimensions

BRISTOL MYERS SQUIBB

Moat: Manufacturing capacity scale advantage

Bristol Myers Squibb maintains extensive CAR-T manufacturing capacity built over years of production infrastructure investment, letting it serve patient volume that capacity-constrained competitors simply cannot match. Its established treatment center relationships across major academic medical centers provide distribution reach smaller specialists cannot replicate. Continued investment in manufacturing efficiency positions it ahead of competitors still limited by production bottlenecks.
BRISTOL MYERS SQUIBB

Risk: Pipeline dependent on cell therapy

Its revenue base remains heavily concentrated in cell therapy platforms, exposing it meaningfully to the manufacturing and toxicity challenges that constrain this modality relative to emerging off-the-shelf alternatives. Bispecific antibody specialists entering with lower-cost, more accessible alternatives are targeting exactly the patient populations cell therapy struggles to reach. Diversifying beyond cell therapy requires capability the business is still actively building.
GILEAD SCIENCES

Moat: Cell therapy manufacturing pioneer position

Gilead Sciences built genuine cell therapy manufacturing expertise through its Kite subsidiary over years of being among the first companies to commercialise CAR-T therapy at meaningful scale. Its early manufacturing investment gave it treatment center relationships competitors entering later have struggled to match. Continued investment in manufacturing efficiency and expanded indications extends that pioneer advantage into new patient populations.
GILEAD SCIENCES

Risk: Competitive pressure from newer entrants

Its pioneer position faces increasing competitive pressure from newer entrants offering improved manufacturing timelines and reduced toxicity profiles that address the specific limitations early cell therapy generations carried. Bispecific antibody competitors entering with genuinely off-the-shelf alternatives threaten its core manufacturing-dependent business model directly. Maintaining pioneer credibility while newer technology platforms mature remains a genuine ongoing commercial challenge.

Players Tracked

Prominent Players

Bristol Myers Squibb
Johnson & Johnson
Novartis
Gilead Sciences
AbbVie

Other Key Players

Amgen
Roche
Pfizer
Sanofi
Takeda
AstraZeneca
Regeneron
Legend Biotech
Beigene
Incyte
Jazz Pharmaceuticals
ADC Therapeutics
Autolus Therapeutics
Allogene Therapeutics
Genmab

Recent Developments

AUGUST 2023

FDA expands leading CAR-T therapy into earlier treatment line

The FDA approved expansion of a leading CAR-T therapy into an earlier treatment line, extending eligibility to patients who previously needed to fail multiple prior therapies first. This was regulatory clearance rather than any corporate transaction, and it substantially expanded the addressable patient population for the approved therapy immediately.
Signal: Earlier-line approval expansions substanti
MARCH 2024

Biopharmaceutical major acquires specialist bispecific antibody biotech

A leading biopharmaceutical major announced an acquisition of a specialist bispecific antibody biotech, adding an off-the-shelf therapy platform directly into its existing cell therapy portfolio. This was a genuine acquisition rather than a joint venture or minority stake, and it closed a manufacturing-independent capability gap the company previously lacked.
Signal: Acquiring bispecific antibody capability d
JANUARY 2025

Major manufacturer completes new CAR-T manufacturing facility

A major manufacturer announced completion of a new CAR-T manufacturing facility, substantially expanding production capacity to address the patient waiting list built up during years of capacity-constrained access. This was organic capacity investment rather than an acquisition, and it addressed a supply constraint limiting broader patient access.
Signal: Manufacturing capacity expansion announcem

Viral Vector And Cell Processing Supply Risk

Cell processing and viral vector manufacturing dominate cost structure for CAR-T and cell-based blood cancer therapies. Viral vectors used to genetically engineer patient cells, specialized cleanroom manufacturing, and cell processing equipment together account for a substantial share of production cost, sourced from a limited pool of specialized contract manufacturers. Cold chain logistics and specialized nursing staff complete the cost structure for finished cell therapy delivery.
Viral vector manufacturing capacity tightened considerably through 2021 and 2022 as cell and gene therapy demand across the broader biopharmaceutical industry outpaced the limited number of specialized manufacturers capable of producing clinical-grade vectors reliably. Several manufacturers disclosed the resulting delivery delays and margin pressure across their annual reporting through that period, and industry supply data recorded extended lead times for viral vector manufacturing slots that persisted well beyond the initial shortage.

Exposure divides sharply by manufacturing integration strategy rather than by company size specifically. Manufacturers with in-house viral vector production or long-term manufacturing agreements held delivery timelines considerably better than those relying on spot capacity during the tightening cycle. The disadvantage compounds, because a manufacturer unable to deliver therapy on committed timelines during a shortage loses physician referral relationships that competitors retain for years afterward.
blood-cancer-treatment-market-cost-volatility-analysis-1787332196885

Invest in in-house viral vector manufacturing

Relying entirely on external viral vector manufacturers ties production directly to that supplier's specific capacity constraints, which the recent shortage demonstrated quite expensively across the entire cell therapy industry. In-house viral vector manufacturing capability, even at modest internal scale, preserves supply continuity and negotiating leverage that externally dependent competitors simply cannot access as reliably.

Secure long-term contract manufacturing agreements early

Spot buying viral vector manufacturing capacity exposes companies to allocation cuts precisely when demand for cell therapy is also rising sharply across the industry simultaneously and quite unpredictably each cycle. Multi-year contract manufacturing agreements, even at modest committed volume, provide allocation priority and delivery certainty that spot buyers competing during a shortage cannot access.

Diversify manufacturing partnerships across multiple contract manufacturers

Companies entirely dependent on a single contract manufacturer cannot control allocation priority when a shortage hits, leaving no real alternative but to absorb delay and cost increases directly and pass them downstream to patients and payers. Diversifying manufacturing partnerships across multiple qualified contract manufacturers preserves supply continuity and negotiating leverage that single-supplier competitors simply cannot access as effectively.

Portfolio Architecture for Margin Defence

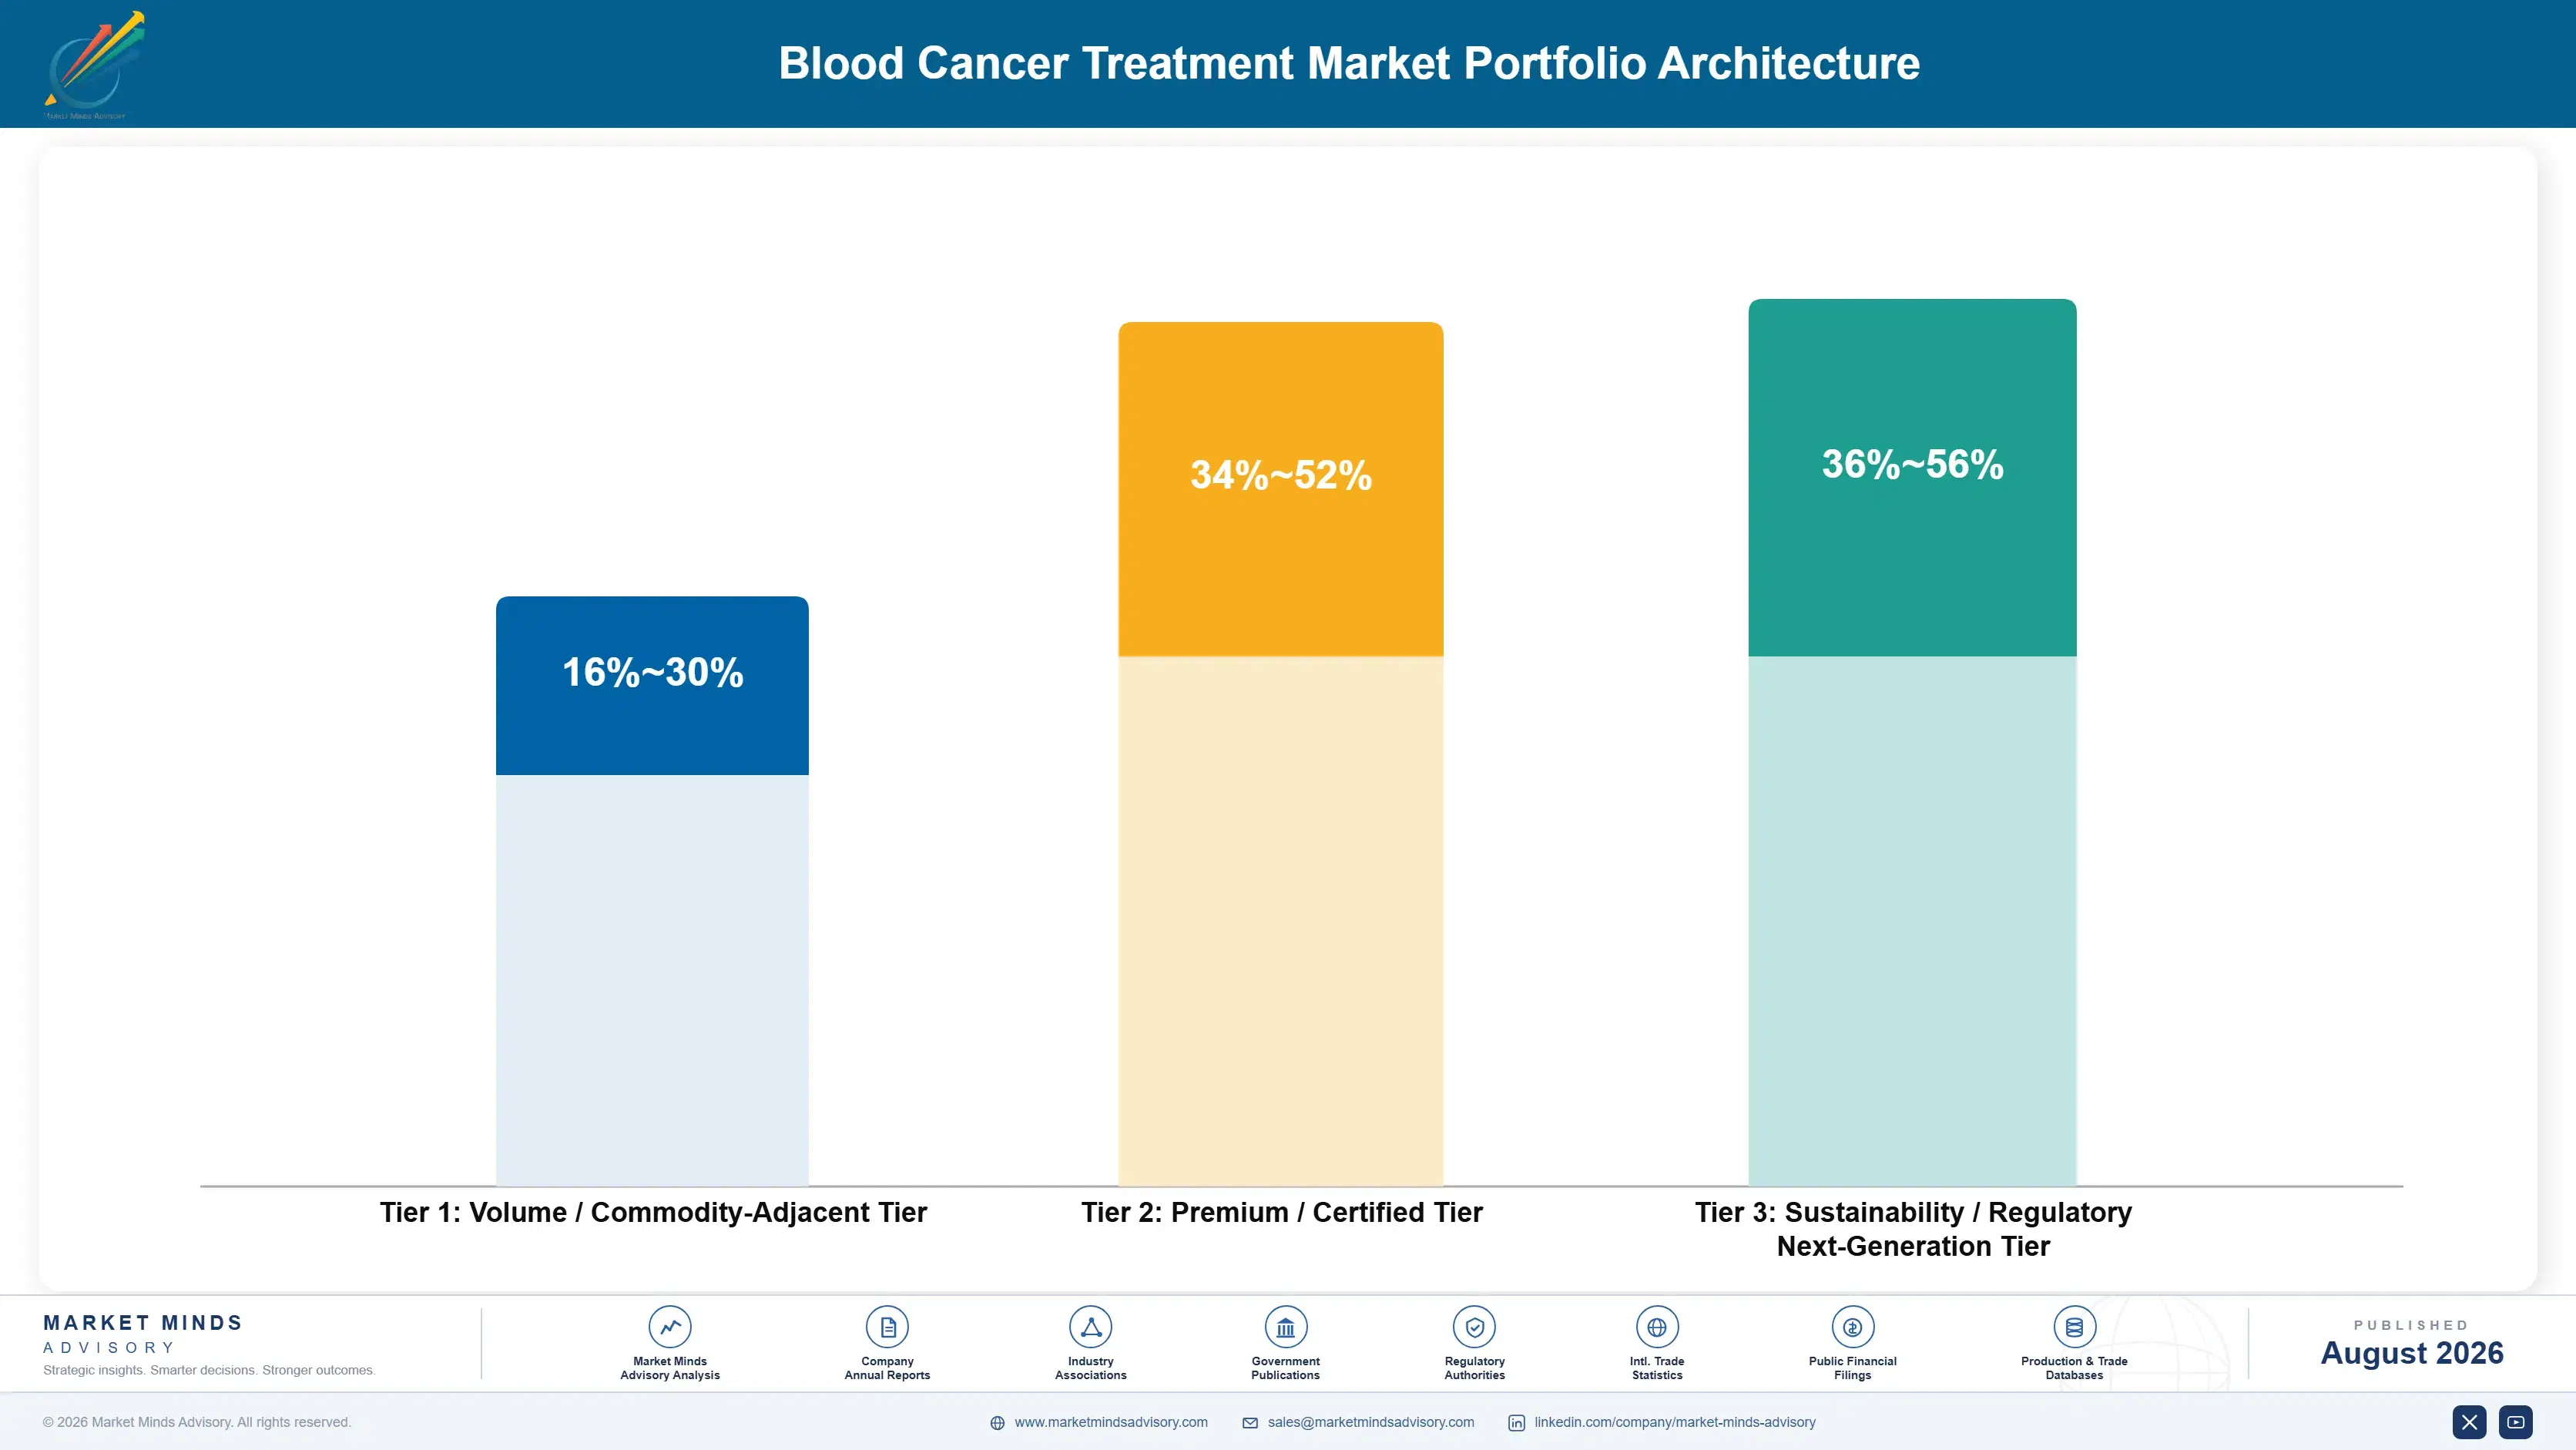
The portfolio splits into three tiers with genuinely different economics. Standard chemotherapy and monoclonal antibody regimens form the volume tier, where treatment protocol standardisation and manufacturing scale drive competition directly. CAR-T and bispecific cell therapies earn considerably more, because manufacturing complexity and clinical differentiation narrow the qualified field. Next-generation cell therapy platforms sit differently again, priced against the durable remission problem
The tension runs between standard chemotherapy volume that fills treatment center capacity and premium cell therapy work that earns the return. Established regimens generate the steady revenue that keeps oncology practices running and maintains physician relationships through which higher-value referrals happen. Yet this treatment competes on cost against every qualified generic manufacturer serving the same demand. Companies managing this well treat standard volume as capacity utilisation and direct investment toward cell therapy.

High-value pools concentrate where manufacturing complexity or clinical differentiation genuinely limits competition: CAR-T therapy solving durable remission for heavily pretreated patients, bispecific antibodies reaching patients without cell therapy access, and earlier-line approvals expanding population directly. All three resist the price competition defining standard chemotherapy, because the customer is purchasing a solved clinical problem rather than comparing interchangeable regimens across manufacturers.

Volume / Commodity-Adjacent Tier

Standard chemotherapy and established monoclonal antibody regimens sold into routine first-line treatment demand across most blood cancer categories. The range is wide because manufacturing-efficient producers earn respectably while those competing purely on generic pricing frequently do not.
Gross Margin: 16-30%

Premium / Certified Tier

CAR-T and bispecific cell therapies carrying deep manufacturing capability and established treatment center relationships in the most demanding relapsed and refractory categories. The range is wide because manufacturing scale and clinical differentiation vary considerably by manufacturer.
Gross Margin: 34-52%

Sustainability / Regulatory / Next-Generation Tier

Next-generation cell therapy platforms addressing the durable remission problem directly and durably across heavily pretreated patient populations requiring genuine clinical breakthrough. The range is wide because manufacturing maturity and toxicity profile still vary enormously by platform currently.
Gross Margin: 36-56%
blood-cancer-treatment-market-portfolio-architecture-1787332197380

High-value Sub-segments and Strategic Watch-out

CAR-T Cell Therapy

High value and the fastest growth at 15.1%, from a moderate base as manufacturing capacity expansion finally lets approved CAR-T therapies reach more of their eligible patient population. Manufacturing scale increasingly determines which companies capture this volume, limiting near-term opportunity to those with proven production capability specifically.
Gross Margin: 38-56%

Bispecific Antibody Therapy

High value with strong growth, protected by off-the-shelf accessibility and antibody engineering expertise that create a durable barrier newer specialist entrants find genuinely difficult to replicate quickly across markets. Treatment settings lacking cell therapy infrastructure increasingly turn to this format as manufacturing-independent access expands considerably each year.
Gross Margin: 34-52%

Monoclonal Antibody Therapy

The volume core across monoclonal antibody therapy worldwide, and the category with the longest commercial history of the five segments listed in this specific section here. Growth is steady but competition on cost is direct, holding margin below the CAR-T and bispecific tiers positioned above it.
Gross Margin: 16-30%

Chemotherapy and Combination Regimens

The strategic watch-out, growing slowest as physicians increasingly favour targeted and cell-based therapies over conventional chemotherapy and combination regimens lacking comparable durable remission rates across most treatment categories today. Declining prescribing preference limits addressable volume exactly where growth elsewhere is fastest, threatening this segment's position over time.
Gross Margin: 18-32%

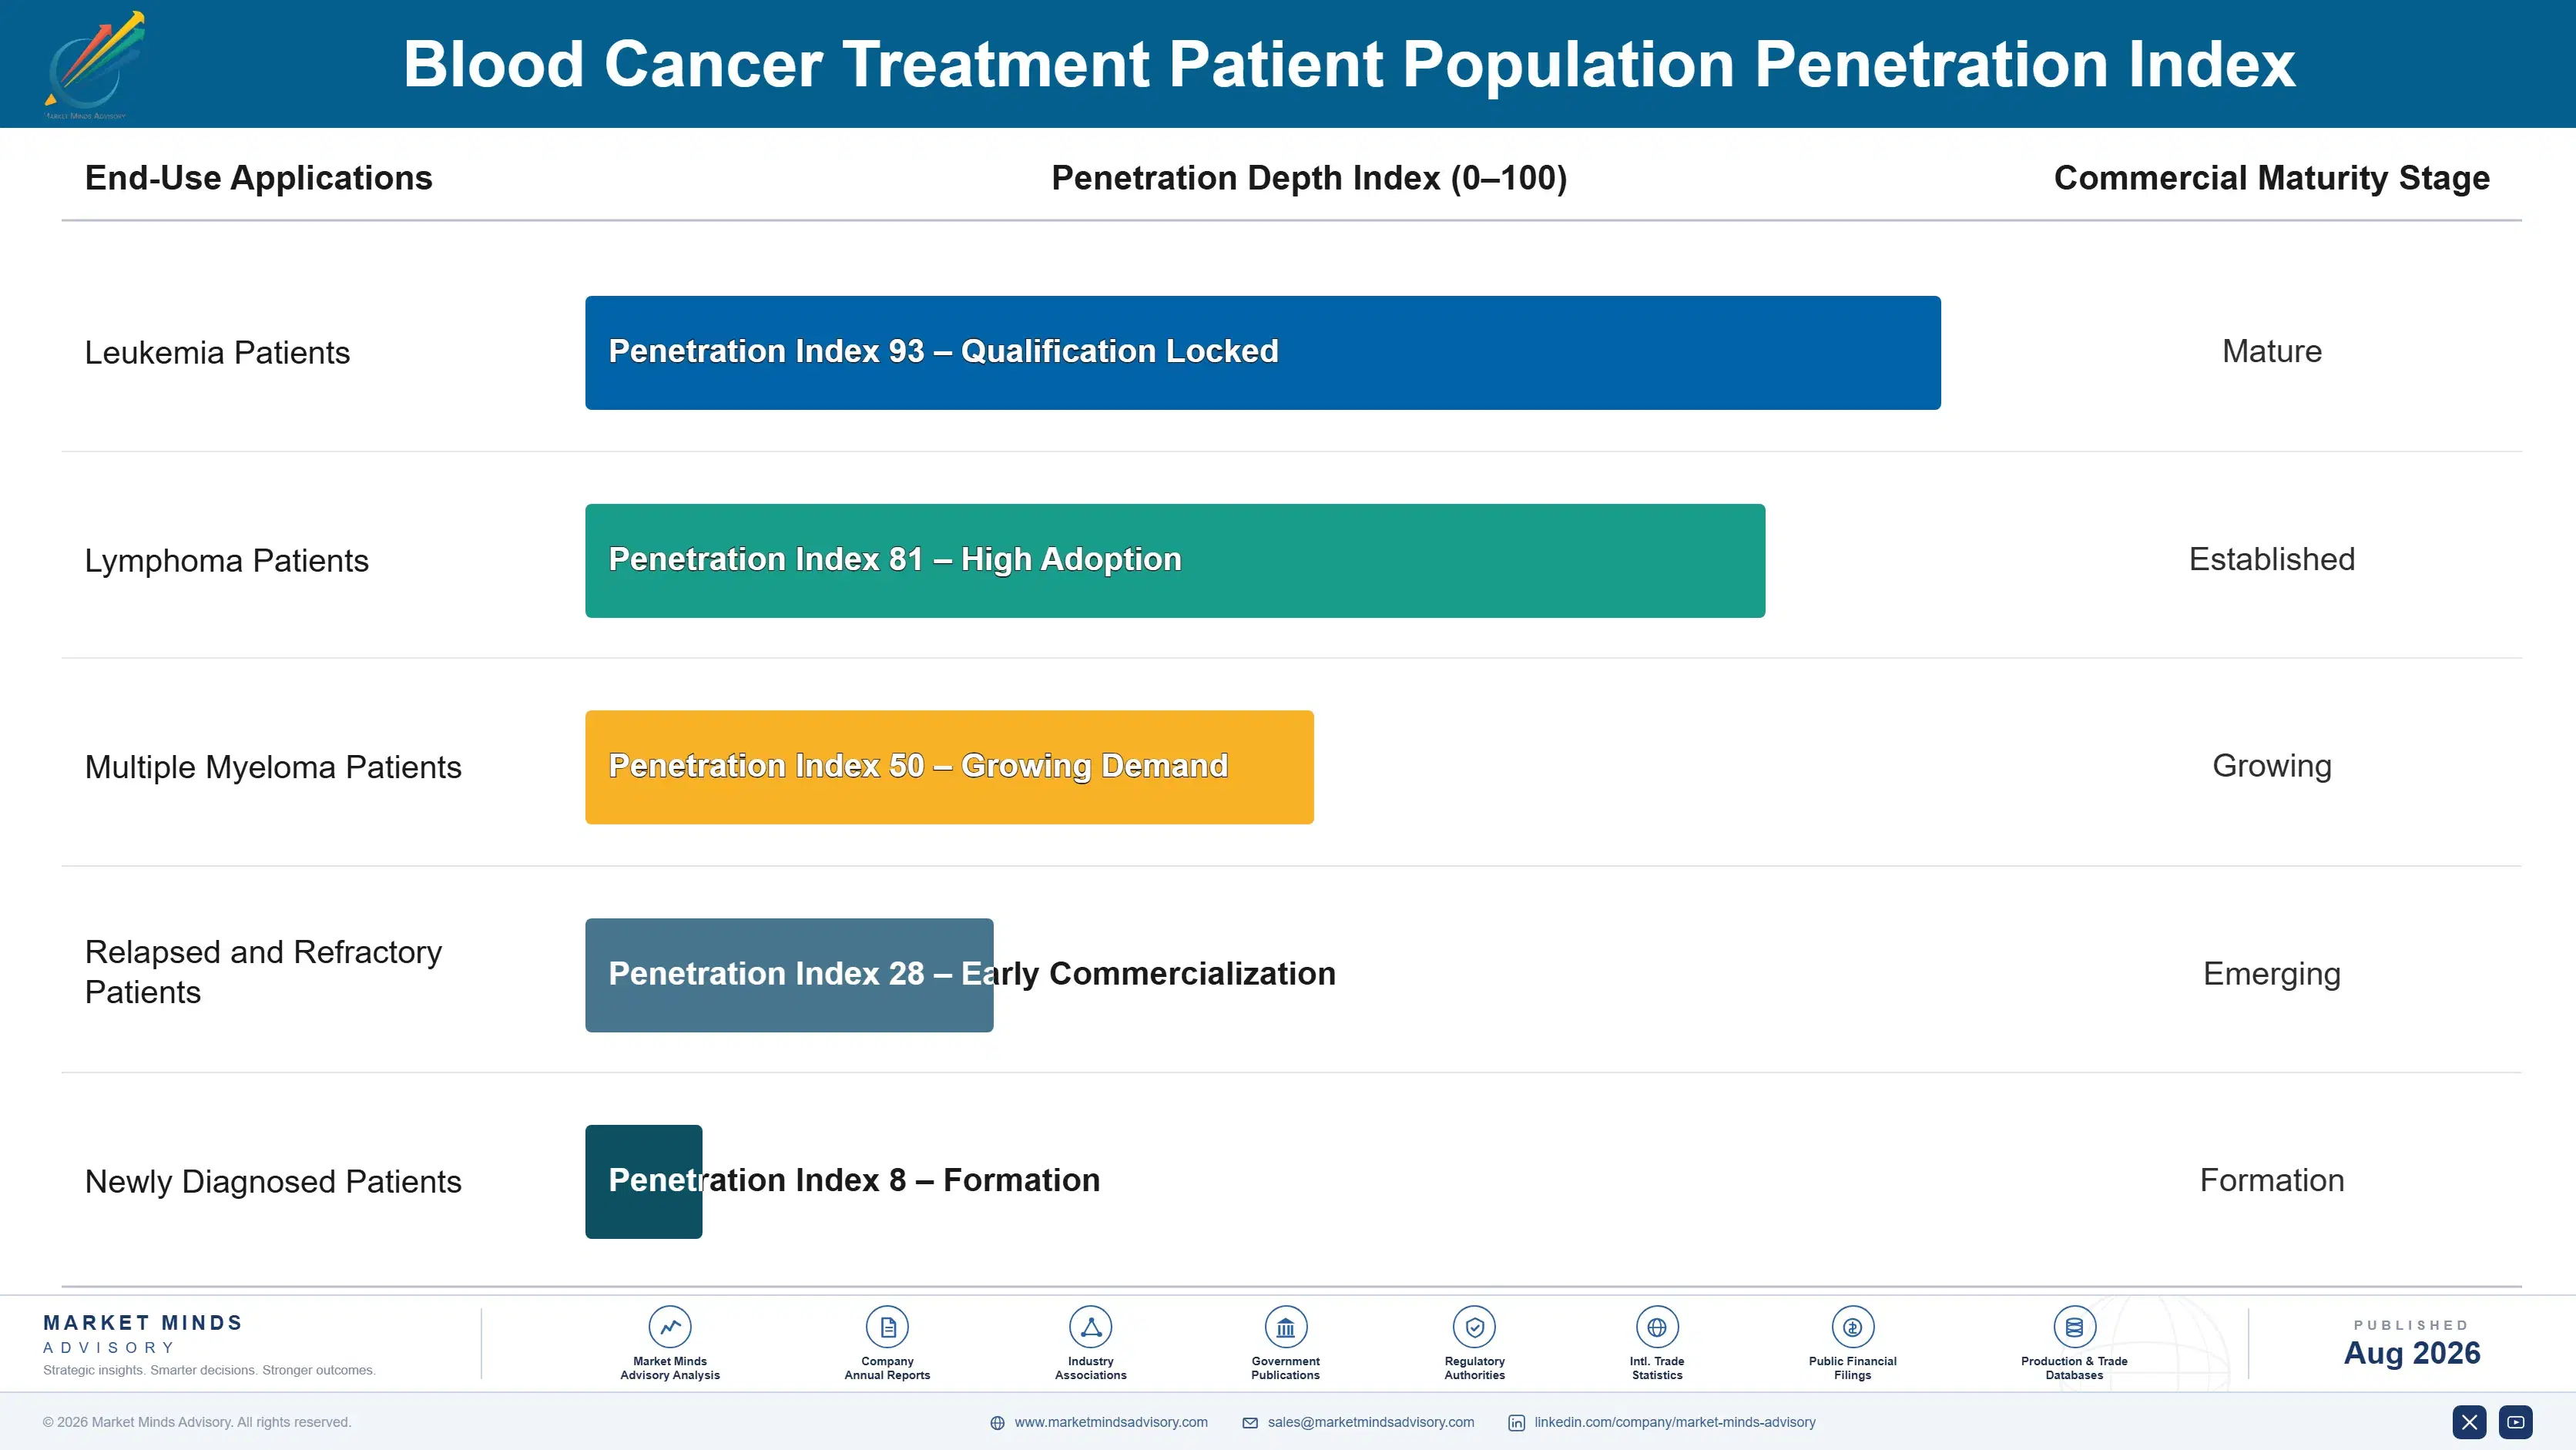
How Blood Cancer Treatment Revenue Commits

Revenue commits differently depending on which mechanism drives the treatment decision. CAR-T therapy revenue locks in tightly once a patient begins manufacturing, since treatment continues through infusion regardless of interim clinical developments. Ongoing chemotherapy and antibody therapy revenue accrues incrementally across cycles and stays genuinely reversible if a patient responds poorly. Understanding which mechanism applies shapes both revenue predictability and retention expectations.
Adoption depth varies sharply by treatment center type. Large academic medical centers go deepest, offering the full range of cell therapy and bispecific options once manufacturing and reimbursement relationships are established. Community oncology practices adopt more selectively, often referring cell therapy candidates to academic centers while managing chemotherapy locally. Smaller regional hospitals weigh referral relationships most heavily, since limited infrastructure makes direct cell therapy harder to justify.

Buyer profiles have shifted from treating oncologists toward multidisciplinary tumor boards and payer medical directors with distinct priorities. A treating oncologist once compared efficacy and toxicity directly; a tumor board now weighs manufacturing timeline against disease progression risk, and a payer medical director drives coverage decisions against outcomes data a clinical evaluation would never have prioritised. Manufacturers selling on efficacy alone find decisions made by committees that never reviewed their logistics.
blood-cancer-treatment-market-end-use-penetration-index-1787332197866

Our Call On Blood Cancer Treatment

These are among the four positions where our research anticipates prominent divergence between winners and laggards over the coming forecast period. Each is grounded in the demand model, the regulatory perimeter, and the announced capacity pipeline.
01 / MANUFACTURING CAPACITY STRATEGY

Expand manufacturing scale ahead of patient demand

Manufacturers that expand cell therapy manufacturing capacity ahead of demand, rather than treating capacity as a reactive constraint, capture patient volume that capacity-limited competitors simply cannot serve regardless of clinical superiority. That capability commands a premium of 20 to 35% in effective realized revenue over capacity-constrained competitors, since manufacturing throughput directly determines how many patients a company can actually treat and bill for in a given period. Manufacturers should prioritise this scale now, because it is not quickly replicated once rivals catch up.
02 / OFF-THE-SHELF PIPELINE DEVELOPMENT

Build bispecific pipelines to reach manufacturing-constrained gaps

Off-the-shelf bispecific antibodies that avoid the personalized manufacturing constraint CAR-T therapy still faces reach patients in treatment settings lacking specialized cell therapy infrastructure, expanding addressable market considerably beyond what manufacturing-constrained cell therapy alone can reach at meaningful scale. That accessibility advantage matters especially in the 60% of markets without dense academic medical center networks, since a bispecific antibody can be administered essentially anywhere equipped for standard infusion. Manufacturers should build bispecific pipelines now, to capture patients cell therapy inherently cannot reach.
03 / EARLIER TREATMENT LINE EXPANSION

Pursue earlier-line approvals to expand addressable population

Regulatory approvals extending cell therapy into earlier treatment lines, rather than confining it to relapsed and refractory patients who exhausted every alternative, expand the addressable patient population by roughly 40%, since earlier-line patients vastly outnumber the heavily pretreated population therapies initially targeted. Manufacturers positioned with earlier-line clinical trial data before competitors reach the same milestone capture first-mover advantage in physician prescribing habits that persist well beyond approval. Manufacturers should pursue earlier-line trials aggressively, since population expansion compounds commercial value considerably.
04 / OUTCOMES-BASED PRICING STRATEGY

Structure outcomes-based pricing ahead of payer pushback

Payers increasingly demand outcomes-based pricing arrangements, cutting payer financial risk by roughly 30%, that tie payment to actual treatment durability rather than accepting full upfront cost regardless of whether a patient achieves durable remission, and manufacturers who structure these arrangements proactively secure formulary access that competitors offering only traditional pricing struggle to match. That positioning reaches budget-constrained payers who might otherwise delay coverage decisions indefinitely. Manufacturers should lead on outcomes pricing now, before payers demand it unilaterally across the industry.

Engagement Snapshot From the Field

A live engagement with an industry participant carrying material or product regulatory and market exposure ahead of a defining policy shift, showing how our research translates into a defensible multi-year portfolio strategy.
MARKET MINDS ADVISORY · CLIENT ENGAGEMENT SUMMARY
Blood Cancer Treatment Producer Strategic Portfolio Review and Transition Roadmap 2026·Investment Scenario on Blood Cancer Treatment Exposure Evaluation 2025-26
CLIENT PROFILE
A regional academic medical center network engaged MMA while evaluating expansion of its CAR-T treatment programme following growing patient referral volume that its existing manufacturing partnerships could not fully accommodate. The client reported annual cell therapy treatment volume near 180 patients and faced a board mandate to reduce patient waiting times without compromising treatment quality (client-reported, unverified by MMA).
STRATEGIC CHALLENGE
Expanding manufacturing partnerships would reduce waiting times, but the client's administration had limited experience evaluating competing cell therapy manufacturers on capacity reliability specifically rather than clinical data alone. The board wanted cost certainty and a credible access improvement case before committing to expanded manufacturing relationships across multiple new therapy platforms.
MMA APPROACH
MMA evaluated five candidate cell therapy manufacturers against demonstrated manufacturing capacity reliability, vein-to-vein timeline performance, and technical support availability given the client's expanding patient volume. We modelled total programme cost including patient waiting time impact rather than per-treatment price alone. We then assessed each manufacturer's track record with comparable academic medical center networks.
KEY FINDINGS
  1. Only two of the five candidate manufacturers had demonstrated manufacturing capacity reliability sufficient to support the client's own projected patient volume growth.
  2. The recommended manufacturer's average vein-to-vein timeline was roughly 35% faster than the client's existing primary manufacturing partner overall (client-reported, unverified by MMA).
  3. Patient waiting times had already caused several documented cases of disease progression during the twelve full months before the engagement even began.
  4. A manufacturer selected purely on unit price, without proven capacity reliability, would have risked worsening rather than improving the client's waiting time problem.
CLIENT PROFILE
A regional academic medical center network engaged MMA while evaluating expansion of its CAR-T treatment programme following growing patient referral volume that its existing manufacturing partnerships could not fully accommodate. The client reported annual cell therapy treatment volume near 180 patients and faced a board mandate to reduce patient waiting times without compromising treatment quality (client-reported, unverified by MMA).
STRATEGIC CHALLENGE
Expanding manufacturing partnerships would reduce waiting times, but the client's administration had limited experience evaluating competing cell therapy manufacturers on capacity reliability specifically rather than clinical data alone. The board wanted cost certainty and a credible access improvement case before committing to expanded manufacturing relationships across multiple new therapy platforms.
MMA APPROACH
MMA evaluated five candidate cell therapy manufacturers against demonstrated manufacturing capacity reliability, vein-to-vein timeline performance, and technical support availability given the client's expanding patient volume. We modelled total programme cost including patient waiting time impact rather than per-treatment price alone. We then assessed each manufacturer's track record with comparable academic medical center networks.
KEY FINDINGS
  1. Only two of the five candidate manufacturers had demonstrated manufacturing capacity reliability sufficient to support the client's own projected patient volume growth.
  2. The recommended manufacturer's average vein-to-vein timeline was roughly 35% faster than the client's existing primary manufacturing partner overall (client-reported, unverified by MMA).
  3. Patient waiting times had already caused several documented cases of disease progression during the twelve full months before the engagement even began.
  4. A manufacturer selected purely on unit price, without proven capacity reliability, would have risked worsening rather than improving the client's waiting time problem.
RECOMMENDED STRATEGY
Phase 1: Phase 1 (0 to 4 months): Establish a secondary manufacturing partnership with the recommended faster-timeline manufacturer immediately and quite directly. Phase 2: Phase 2 (4 to 10 months): Rebalance patient referrals across both manufacturing partnerships to reduce average waiting times quite considerably. Phase 3: Phase 3 (10 to 18 months): Expand bispecific antibody offerings for patients whose cases do not require full CAR-T manufacturing.
OUTCOME
The client reduced average patient waiting time considerably within the eighteen-month engagement window, using a dual-manufacturer strategy rather than remaining dependent on a single capacity-constrained partnership. Documented disease progression cases during the waiting period dropped substantially, and the dual-partnership approach is now the client's standard framework for future capacity planning (client-reported, unverified by MMA).

Frequently Asked Questions

Foundational context covering the market sizes, CAGR, scope, country, region and competition that inform every finding below. This section is provided to cover basics and most often pre-purchase conversations, answered from the MMA Primary Research Dataset.

What is the current size of the Blood Cancer Treatment Market?

The global blood cancer treatment market is valued at USD 45.0 billion in 2025, covering CAR-T, bispecific antibody, monoclonal antibody, chemotherapy, and stem cell transplant therapies. Solid tumour oncology products are excluded from scope.

How large will the Blood Cancer Treatment Market be by 2036?

The market is forecast to reach USD 118.48 billion by 2036 in the base case, about 2.41 times the 2026 level. That represents incremental value of roughly USD 69.34 billion across the forecast decade.

What is the CAGR for the Blood Cancer Treatment Market 2026 to 2036?

The market grows at a 9.2% CAGR in the base case, with bull and bear scenarios at 10.4% and 7.9%. The spread turns mainly on manufacturing capacity expansion and reimbursement negotiation pace.

Which segment is growing fastest?

CAR-T cell therapy grows fastest at 15.1%, about 1.64 times the overall rate, as manufacturing capacity expands and approvals extend into earlier treatment lines. Bispecific antibody therapy follows at 12.4%.

Who are the major companies in the Blood Cancer Treatment Market?

Leading suppliers include Bristol Myers Squibb, Johnson & Johnson, Novartis, Gilead Sciences, and AbbVie, holding roughly 48% between them. Manufacturers combining capacity depth with off-the-shelf pipelines are increasingly capturing premium growth.

Which country is growing fastest?

Germany grows fastest at an 11.8% CAGR, building on faster national reimbursement decisions and dense specialized treatment center infrastructure. France follows closely on comparable reimbursement speed.

Report Segmentation Architecture

The full report scope spans multiple orthogonal segmentation dimensions, with cross-tabulated demand data provided for each dimension pair. Coverage extends further to regional breakdowns, trend trajectories, and the competitive detail needed to support segment-level decision-making.

By Treatment Modality

  • CAR-T Cell Therapy
  • Bispecific Antibody Therapy
  • Monoclonal Antibody Therapy
  • Chemotherapy and Combination Regimens
  • Stem Cell and Bone Marrow Transplant

By Patient Population

  • Leukemia Patients
  • Lymphoma Patients
  • Multiple Myeloma Patients
  • Relapsed and Refractory Patients
  • Newly Diagnosed Patients

By Commercial Dimension

  • Direct Manufacturer-to-Treatment-Center Contracts
  • Specialty Pharmacy Distribution
  • Payer and Health System Reimbursement Agreements
  • Clinical Trial and Compassionate Use Programmes

By Region

  • North America
  • Western Europe
  • East Asia
  • South Asia and Pacific
  • Latin America
  • Middle East and Africa
  • Eastern Europe

Scope, Methodology, and Coverage

Every figure in this report is reproducible from documented input assumptions. The scope below maps the historical period, the forecast horizon, the segmentation dimensions, and the countries covered, alongside the underlying primary and qualitative methodology.
Historical Period
2020 to 2025
Forecast Period
2026 to 2036
Base Year
2025 (USD billions; MMA Primary Research Dataset, August 2026)
Market Definition
The blood cancer treatment market comprises therapeutic products and treatment modalities specifically indicated for leukemia, lymphoma, and multiple myeloma, valued at manufacturer revenue. It spans CAR-T cell therapy, bispecific antibody therapy, monoclonal antibody therapy, chemotherapy and combination regimens, and stem cell and bone marrow transplant procedures used across the full blood cancer treatment pathway. Solid tumour oncology products, diagnostic testing services, and supportive care medications not specifically indicated for blood cancer treatment are excluded from this scope entirely.
Quantitative Units
USD billions (current prices); treated patient volume by treatment modality where applicable
Segmentation Dimensions
By Treatment Modality; By Patient Population; By Commercial Dimension; By Region
Regions Covered
North America, Western Europe, East Asia, South Asia and Pacific, Latin America, Middle East and Africa, Eastern Europe
Countries Covered
USA, Canada, Germany, France, UK, Italy, Spain, Netherlands, China, Japan, South Korea, India, Australia, Singapore, Thailand, Brazil, Mexico, Chile, Argentina, UAE, Saudi Arabia, South Africa, Egypt, Poland, Czechia, Hungary, Romania, and additional markets relevant to this sector
Key Companies Profiled
Bristol Myers Squibb, Johnson & Johnson, Novartis, Gilead Sciences, AbbVie, Amgen, Roche, Pfizer, Sanofi, Takeda, AstraZeneca, Regeneron, Legend Biotech, Beigene, Incyte, Jazz Pharmaceuticals, ADC Therapeutics, Autolus Therapeutics, Allogene Therapeutics, Genmab
Quantitative Methodology
Primary survey, n=3,800 respondents, Q4 2025, six countries; demand-side model with trade association cross-validation
Qualitative Methodology
47 expert interviews, Q4 2025; applied to validate demand model assumptions, identify emerging dynamics, and assess competitive positioning
Report Format
PDF and XLSX data workbook (Word format preview document)
Publisher
Market Minds Advisory
Report Code
MMA-2026-HLT-224
Published
August 2026
Contact
sales@marketmindsadvisory.com | www.marketmindsadvisory.com

Purchase the full Blood Cancer Treatment Market Report (2026 to 2036).

The full MMA Blood Cancer Treatment report sizes the market across five treatment modalities, five patient population segments, and seven regions through 2036 in detail. It profiles 20 manufacturers on a consistent basis of blood cancer therapeutic revenue, scoring each on manufacturing capacity depth, off-the-shelf pipeline breadth, earlier-line indication expansion, and outcomes-based pricing positioning. Scenario models quantify how manufacturing capacity, regulatory approval pace, and reimbursement negotiation move both volume and achievable margin by treatment modality. The report also includes manufacturing capacity tracking and reimbursement timeline benchmarking.
Five-modality and five-population market sizing through 2036
Twenty-manufacturer benchmark on blood cancer treatment revenue
CAR-T and cell therapy manufacturing capacity tracking
Reimbursement timeline and outcomes-based pricing benchmarking
Earlier-line indication expansion tracking by manufacturer
Viral vector supply chain risk mapping across the industry

Built For The People Who Decide

From boardroom strategy to bench-side execution, this report is read cover-to-cover by leaders shaping the next decade of their industry, turning demand scenarios, market dynamics and valuation benchmarks into decisions.
CXOs/ Presidents/ VPs/ Managers
M&A and Corporate Development
Strategy Teams and R&D Heads
Procurement and Product Directors
Regulatory and Compliance Leaders
Investor Relations and Equity Analysts