Market Minds Advisory
Blockchain in Agriculture and Food Supply Chain Market

Blockchain in Agriculture and Food Supply Chain Market: Blockchain in Agriculture and Food Supply Chain: Regulatory Traceability, First-Mile Data Capture and the Economics of Proving Origin

European deforestation rules and American food safety mandates finally forced agrifood buyers to prove origin, turning a decade of stalled pilots into audited compliance infrastructure that regulators now genuinely inspect.

Lead Analyst

Published

September 2026

Make Smarter Decisions with Customized Research Insights

Request a free sample report and evaluate market opportunities, growth trends, and competitive dynamics relevant to your business needs.

2025 MARKET VALUE$0.9BMarket Size 2025
2036 FORECAST VALUE$4.8BBase Case , 2026 to 2036
CAGR 2026 TO 203616.4 %Bull 17.6% / Bear 15.2%
INCREMENTAL OPPORTUNITY$3.7BNet 10- year value creation
EXPANSION MULTIPLE4.56x2036 value over 2026 base
Strategic Levers
M&A Pipeline
Regional Outlook
Country Rankings
Competitive Intelligence
Segmental Deep-dive
Call-Us : 91 93563 13602

Executive Snapshot and Market Trajectory.

Blockchain arrived in agrifood as a technology looking for a problem and spent the better part of eight years failing to find one. Regulation eventually supplied it, and did so in the only form that matters commercially: a penalty attached to records nobody was keeping. That changed everything.
What changed is that European deforestation rules and the American food traceability rule both attach legal consequence to records that most food supply chains simply do not hold. Compliance spending follows, and it concentrates on deforestation and land-use verification, growing at 24.6% against a market at 16.4%, half again the market rate. Europe leads because European law forces the question first. Importers carry the obligation and push the cost upstream to producers.
The competitive field is unusually fragmented for enterprise software, with the top five holding roughly 24% and no vendor able to claim a defensible position across commodities. Platform incumbents own the buyer relationship, specialists own the first-mile data capture, and the two keep colliding. Certification bodies and commodity traders are quietly becoming competitors. Consolidation of origin networks will decide the rankings over the next three years.
Market Definition
This market covers distributed-ledger and cryptographically verified record-keeping software applied to agricultural production and food supply chains, including provenance tracing, deforestation and land-use compliance, recall management, certification verification, condition record-keeping and settlement. It includes the first-mile data capture tooling sold as part of these programmes. It excludes general farm management software, ERP, commodity trading platforms, cryptocurrency and tokenised agricultural finance instruments.
Base Year Value
$0.9B in 2025 (MMA Primary Research Dataset, September 2026)
Forecast Period
2026 to 2036, eleven discrete annual values
CAGR
16.4% base case. Bull 17.6%. Bear 15.2%.
Fastest Growth Segment
Deforestation and Land-Use Compliance: 24.6% CAGR
Fastest Growth Country
Brazil: 22.8% CAGR
Fastest Growth Region
South Asia and Pacific: 18.6% CAGR
Largest Region
Western Europe: 31% of 2025 global value
Market Leaders
IBM, SAP, Oracle, Trustwell and TE-FOOD International lead on measured software and services revenue attributable to agrifood traceability. Source: MMA Primary Research Dataset, July 2026.
Primary Survey
n=3,800 procurement and R&D decision-makers, Q4 2025, six countries
Methodology
Demand-side build-up, cross-validated against public data, 47 expert interviews

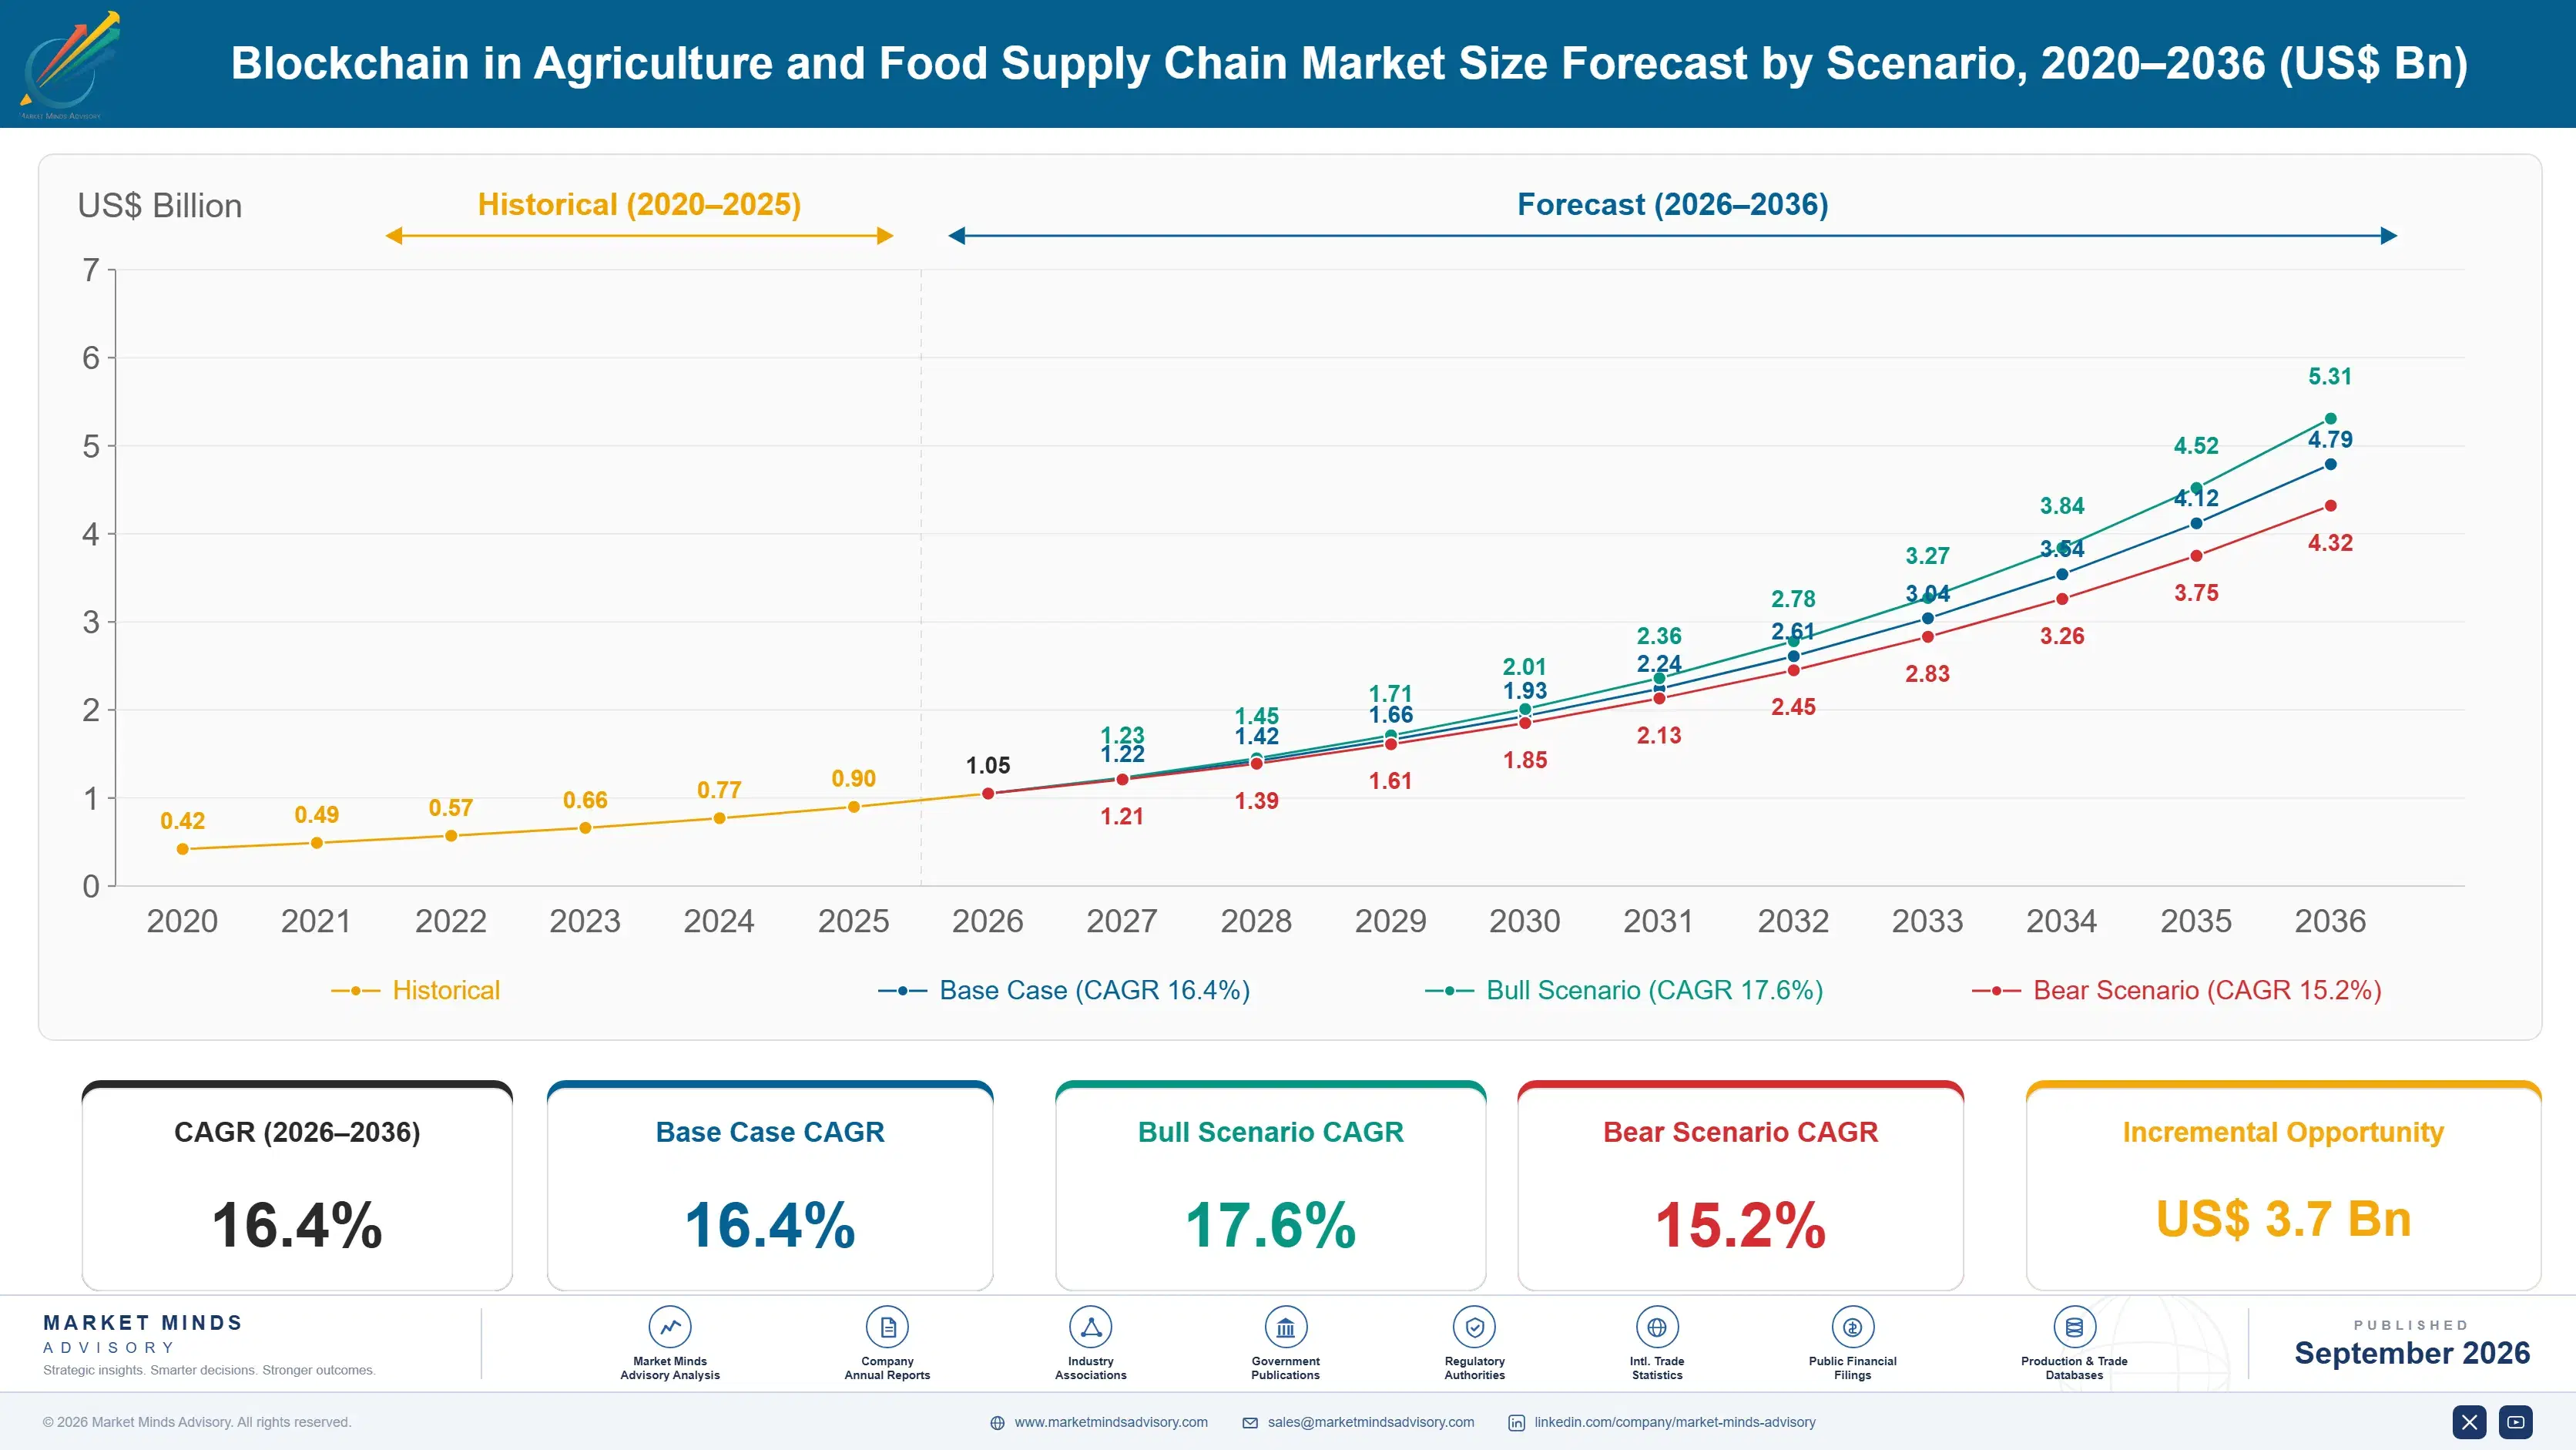
Blockchain in Agriculture and Food Supply Chain Market Forecast Scenarios

blockchain-in-agriculture-and-food-supply-chain-ma-size-forecast-scenario-1788417722530
Between 2020 and 2025 this market grew at 15.0%, which sounds impressive until the base is examined. Almost all of it came from pilots, grant-funded consortia and marketing programmes that produced a QR code on a package and very little else. Roughly one pilot in five reached production. The retail brand budget that funded the first wave had largely evaporated by 2023.
The base case rests on three mechanisms rather than on any technology improvement. The EU Deforestation Regulation makes plot-level geolocation a condition of market access for seven commodity groups, which converts traceability from a marketing choice into an import requirement. The FDA traceability rule attaches record-keeping obligations to specific high-risk foods with defined key data elements. Third, retailer and processor supplier contracts now flow those obligations upstream, which is what actually moves spending.
The bull case at 17.6% turns on enforcement being real: if European customs authorities reject shipments on inadequate geolocation evidence, procurement budgets move within a quarter. The bear case at 15.2% is the more familiar one. Regulatory timetables have already slipped repeatedly, and every delay pushes the compliance purchase into the following financial year. Vendors are pricing accordingly.

Proving Origin Became a Condition of Market Access

For most of the past decade this category sold a solution to a problem nobody was being penalised for. Food companies knew their supply chains were opaque. They also knew that opacity cost them nothing, because no regulator required otherwise and no consumer paid a premium large enough to matter. That has changed, and it changed through law rather than through any advance in the underlying technology.
TOP FIVE CONCENTRATION24%Fragmented field of specialists competing against platform incumbents
PILOT CONVERSION RATE19%Share of proofs of concept reaching production deployment
FIRST-MILE COST SHARE62%Portion of programme spend consumed capturing farm-level records
EUDR IMPORT EXPOSUREUSD 44bnAnnual European commodity imports falling under deforestation rules
RECALL TRACE TIME6.2 daysTime to identify affected lots without connected records
PRODUCER ONBOARDING SHARE38%Smallholder suppliers actually enrolled on operating traceability programmes
The commercially interesting fact is where the money goes. Only a minority of programme spend reaches anything resembling a ledger. Around 62% is consumed getting data out of farms, cooperatives, collection points and small processors that have no systems at all, often no reliable connectivity, and no commercial reason to cooperate. The distributed ledger is close to a commodity. First-mile capture is the expensive, defensible, genuinely difficult part.
That imbalance explains the fragmentation. Platform vendors own the relationship with the food manufacturer and the retailer but have no presence at origin. Specialists have spent years building producer networks in coffee, cocoa, palm and seafood, and hold the data nobody else can reach. Neither side can complete the picture alone, and acquisition has so far been slower than the regulatory clock demands.
"The most valuable asset in this market is not software at all. It is a working relationship with 40,000 smallholders who will actually enter data, and no amount of ledger engineering substitutes for it. The vendors who understood that early are the ones being bought."
Director, Agrifood Technology and Traceability Practice · MMA Agriculture Practice · September 2026

Market Trends

Compliance Budgets Replace Marketing Budgets as Primary Funder

The first wave of agrifood traceability was funded by brand and sustainability teams looking for a consumer-facing story, and those budgets are discretionary, small and the first cut in a downturn. Programmes funded that way collapsed between 2022 and 2024. What is funding the current wave is regulatory compliance, which sits with legal, quality and procurement, survives cost reviews and carries penalty exposure behind it. The shift changes who the buyer is, what evidence they require and how long the sales cycle runs. It also raises the technical bar considerably, because auditors ask harder questions than shoppers do.
Market Impact: Applies to USD 44bn imports
Geolocation Data Displaces Certification as Compliance Evidence

Voluntary certification schemes carried agrifood sustainability claims for two decades, and European deforestation rules bypassed them almost entirely. What EUDR requires is plot-level geolocation for the land a commodity came from, together with evidence that the plot was not forested after December 2020, and a certificate does not satisfy that. Certification bodies are responding by building geolocation capability themselves, which puts them into direct competition with the software vendors they previously partnered with. For producers, the practical consequence is that being certified no longer means being compliant. Certification revenue is falling where compliance spending rises fastest.
Market Impact: Sets 24 hour retrieval requirement

Market Opportunities and Growth Drivers

European Deforestation Regulation Attaches Consequence to Missing Records

EUDR requires operators placing cattle, cocoa, coffee, palm oil, rubber, soy and wood on the European market to file a due diligence statement carrying plot geolocation for the source land. The obligation sits with the importer, and the penalty structure includes fines calculated against turnover plus exclusion from public procurement. That combination reaches board level in a way sustainability reporting never did. Importers cannot generate the data themselves, so the obligation flows upstream through supply contracts to traders, processors and cooperatives, which is where the spending actually lands and where the difficulty genuinely sits.
Market Impact: Only 38% of producers enrolled

American Food Traceability Rule Defines Mandatory Data Elements

The FDA traceability rule specifies key data elements and critical tracking events for a defined list of higher-risk foods including leafy greens, soft cheeses, shell eggs, nut butters and several seafood categories. Unlike previous guidance it prescribes what must be recorded and how quickly it must be produced on request. Firms that could not identify affected lots inside 24 hours are now buying systems that can. The compliance date extension gave the industry more time but did not remove the obligation, and procurement decisions have continued at large processors regardless of the delay.
Market Impact: Delays cost 30 months exposure

Market Restraints and Challenges

First-Mile Data Capture Defeats Most Deployment Programmes

The chain is only as good as the first record, and the first record is usually made by a smallholder with a basic handset, intermittent connectivity and no incentive to be accurate. The root cause is commercial rather than technical: producers bear the cost of participation and capture almost none of the benefit, which sits downstream with the importer avoiding a penalty. Only 38% of intended smallholder suppliers are enrolled on active programmes. Vendors are addressing it through cooperative-level aggregation, offline-capable capture and premium-sharing arrangements that pay producers directly for verified data.
Market Impact: Shifts 62% of programme funding

Regulatory Timetables Keep Slipping and Budgets Slip Behind Them

Both major forcing regulations have been delayed, EUDR twice and the FDA rule by 30 months, and each postponement moves a signed compliance budget into a later financial year. The root cause is that the rules were written faster than the data infrastructure they assume could realistically be built, and industry associations have argued exactly that. The commercial impact is severe for vendors carrying implementation capacity against forecast demand. Some are responding by pricing on recall reduction and working capital instead, which survives a regulatory delay because it never depended on one.
Market Impact: Covers 7 regulated commodity groups
3 additional market trends, 4 additional growth drivers, and 3 additional restraints and challenges are covered in the full report. Contact sales@marketmindsadvisory.com to access the complete intelligence.

Segment CAGR and Growth Architecture

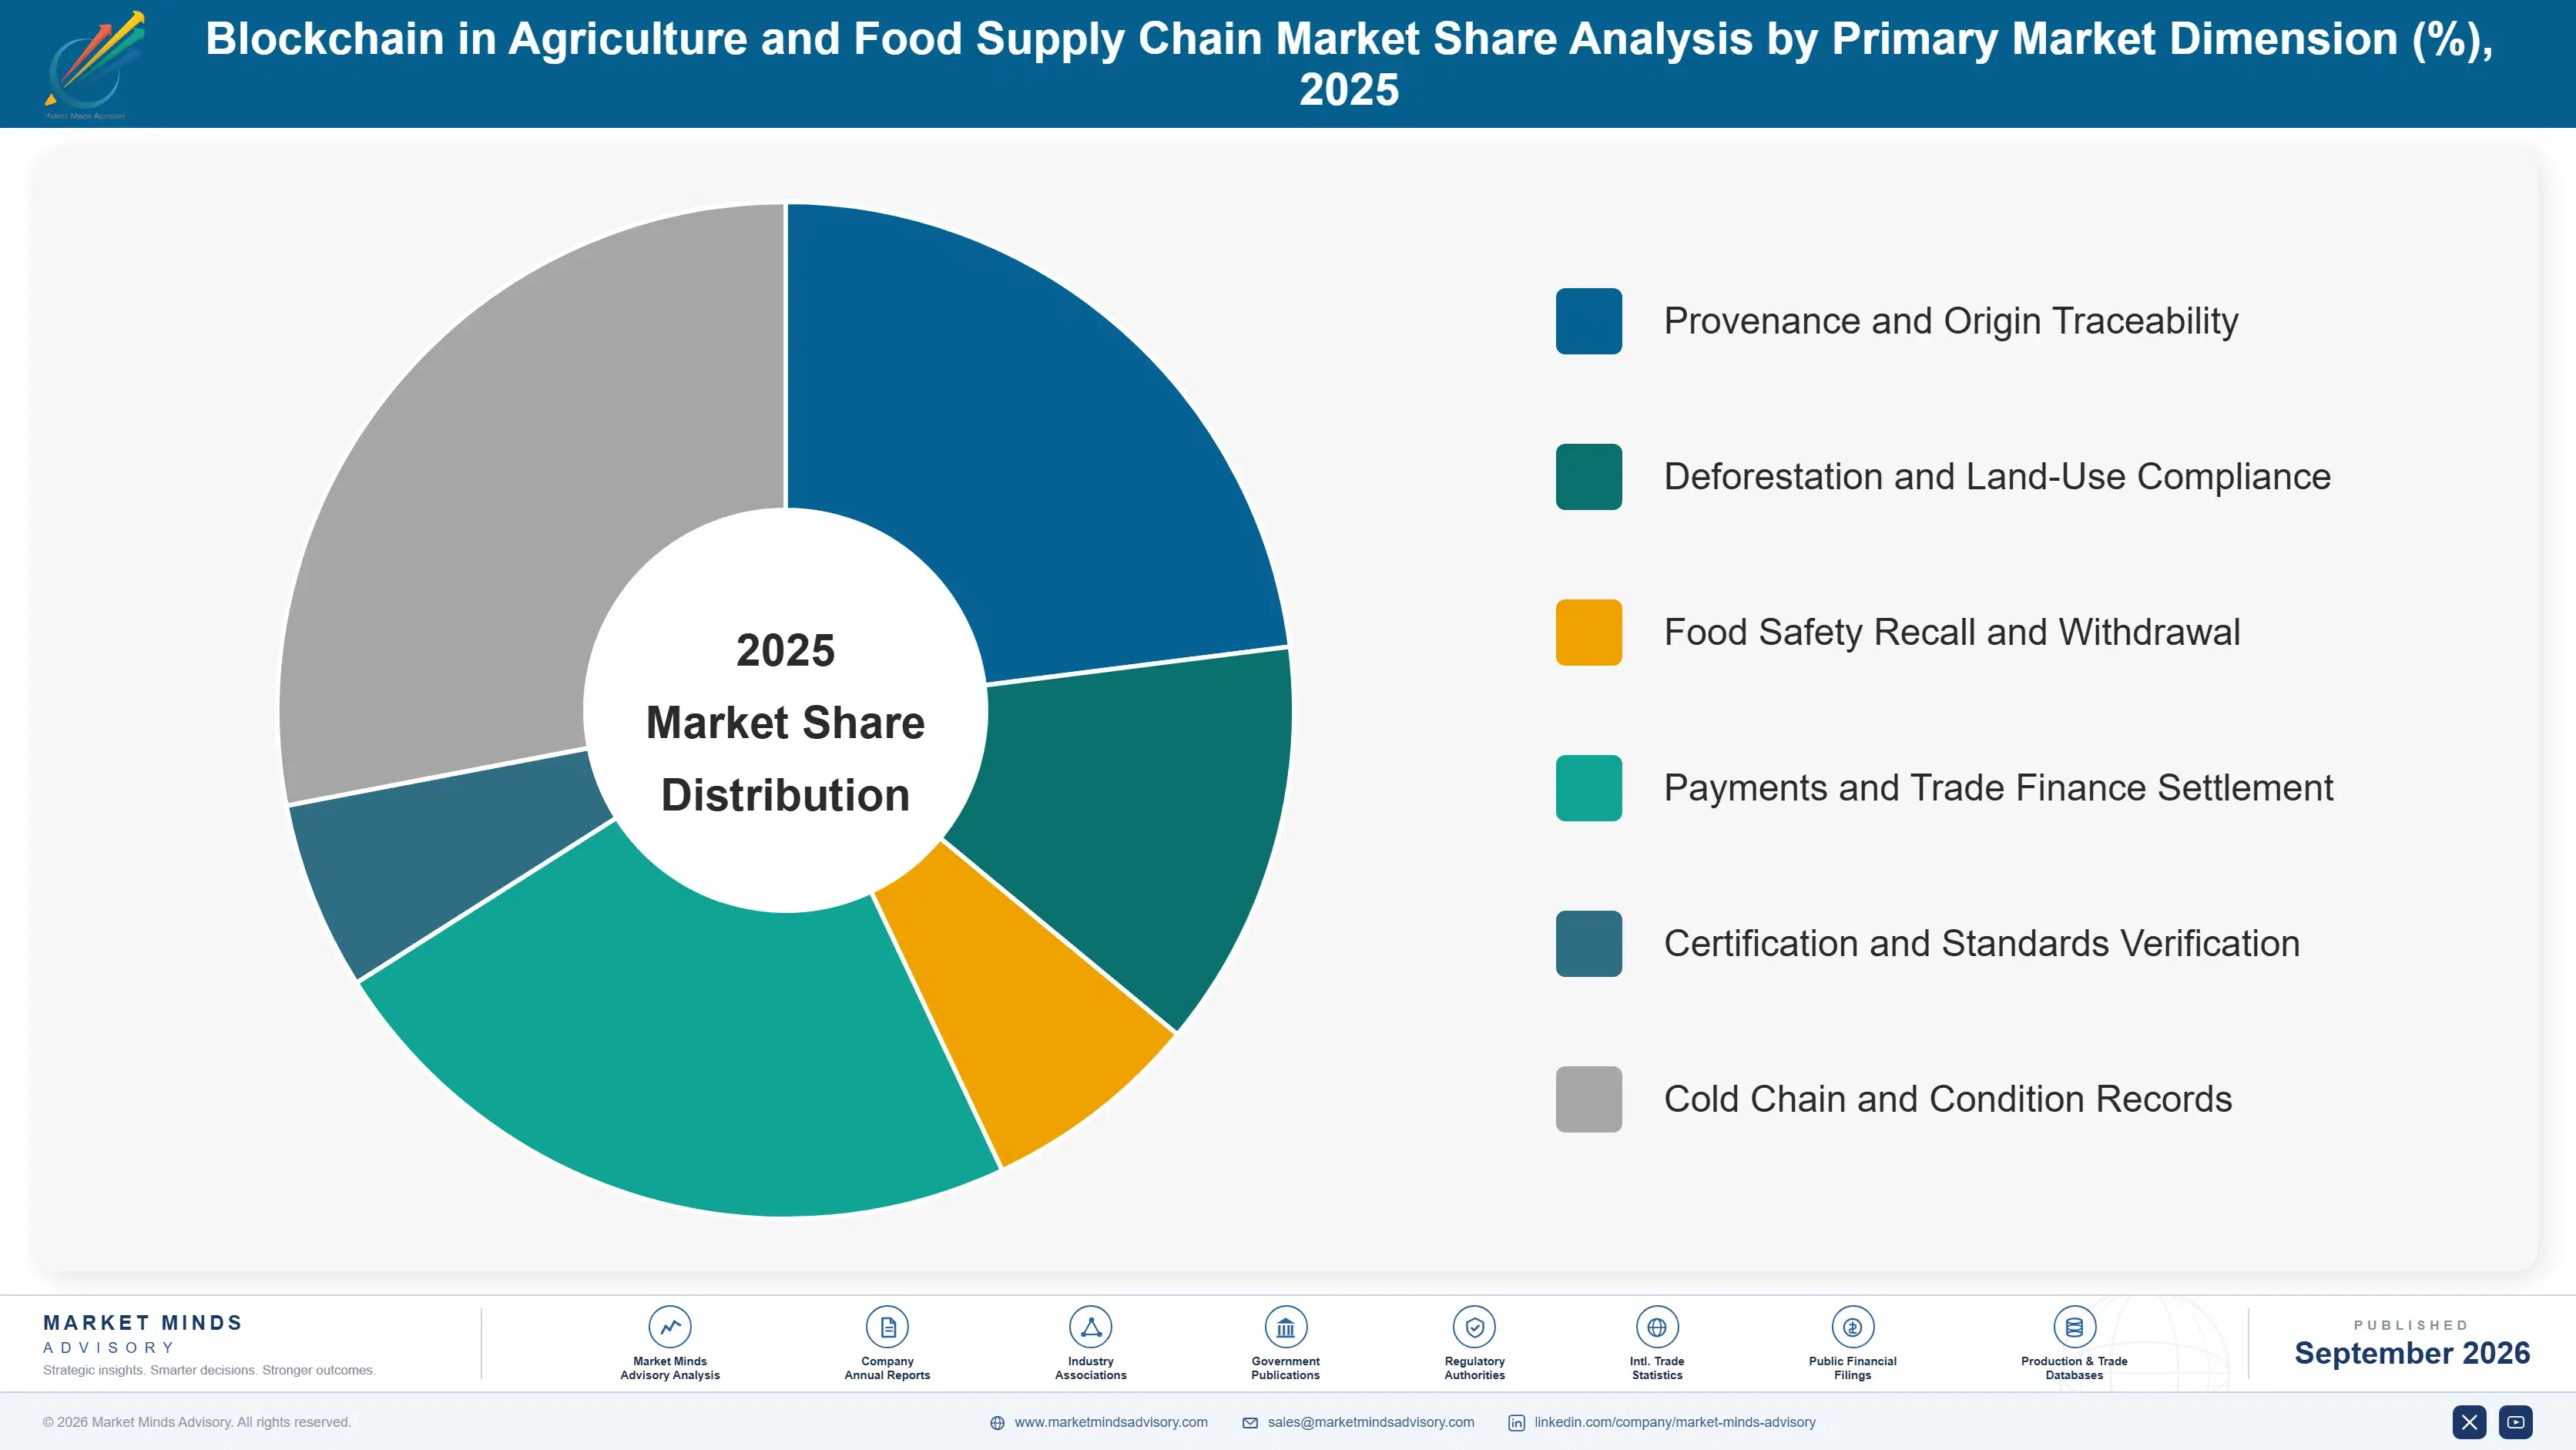
Segmentation follows what the software is bought to prove, since that determines who signs the contract and what evidence standard applies. Compliance-driven applications now dominate new spending, while the provenance and marketing applications that opened this market have flattened badly and are increasingly funded from within broader quality programmes. The gap between the two keeps widening every year.
blockchain-in-agriculture-and-food-supply-chain-ma-market-share-analysis-1788417723095

Deforestation and Land-Use Compliance

This is the segment European law created. Buyers are importers, traders and processors handling the seven EUDR commodity groups, and what they need is plot-level geolocation tied to a legally defensible due diligence statement, with satellite forest-cover evidence attached. Growth at 24.6%, half again the market rate of 16.4%, comes from the obligation being non-negotiable rather than from any advantage over alternatives. Competition here is unusual because satellite analytics firms, certification bodies and traditional traceability vendors all claim the work, and the winning configuration typically combines a geospatial layer with an existing producer network. Palm oil and cocoa moved first, and cattle is proving the hardest by a considerable distance.
CAGR 24.6%

Food Safety Recall and Withdrawal

Recall and withdrawal management sells on an argument that predates any regulation and survives every delay to one. The buyer is a quality or food safety director at a processor, distributor or retailer, and the deliverable is the ability to identify affected lots and their downstream destinations quickly enough to limit the withdrawal. The FDA traceability rule sharpened the requirement by specifying key data elements, which made previously optional record-keeping mandatory for defined food categories. Growth at 18.2% reflects a genuine and quantifiable benefit case rather than a compliance deadline. Leafy greens and seafood account for a disproportionate share of current deployments because their recall histories are the worst. Both categories carry unusually poor recall histories.
CAGR 18.2%
Full segment breakdown across 6 segments available in the complete report.

Regional Architecture and Country Demand Map

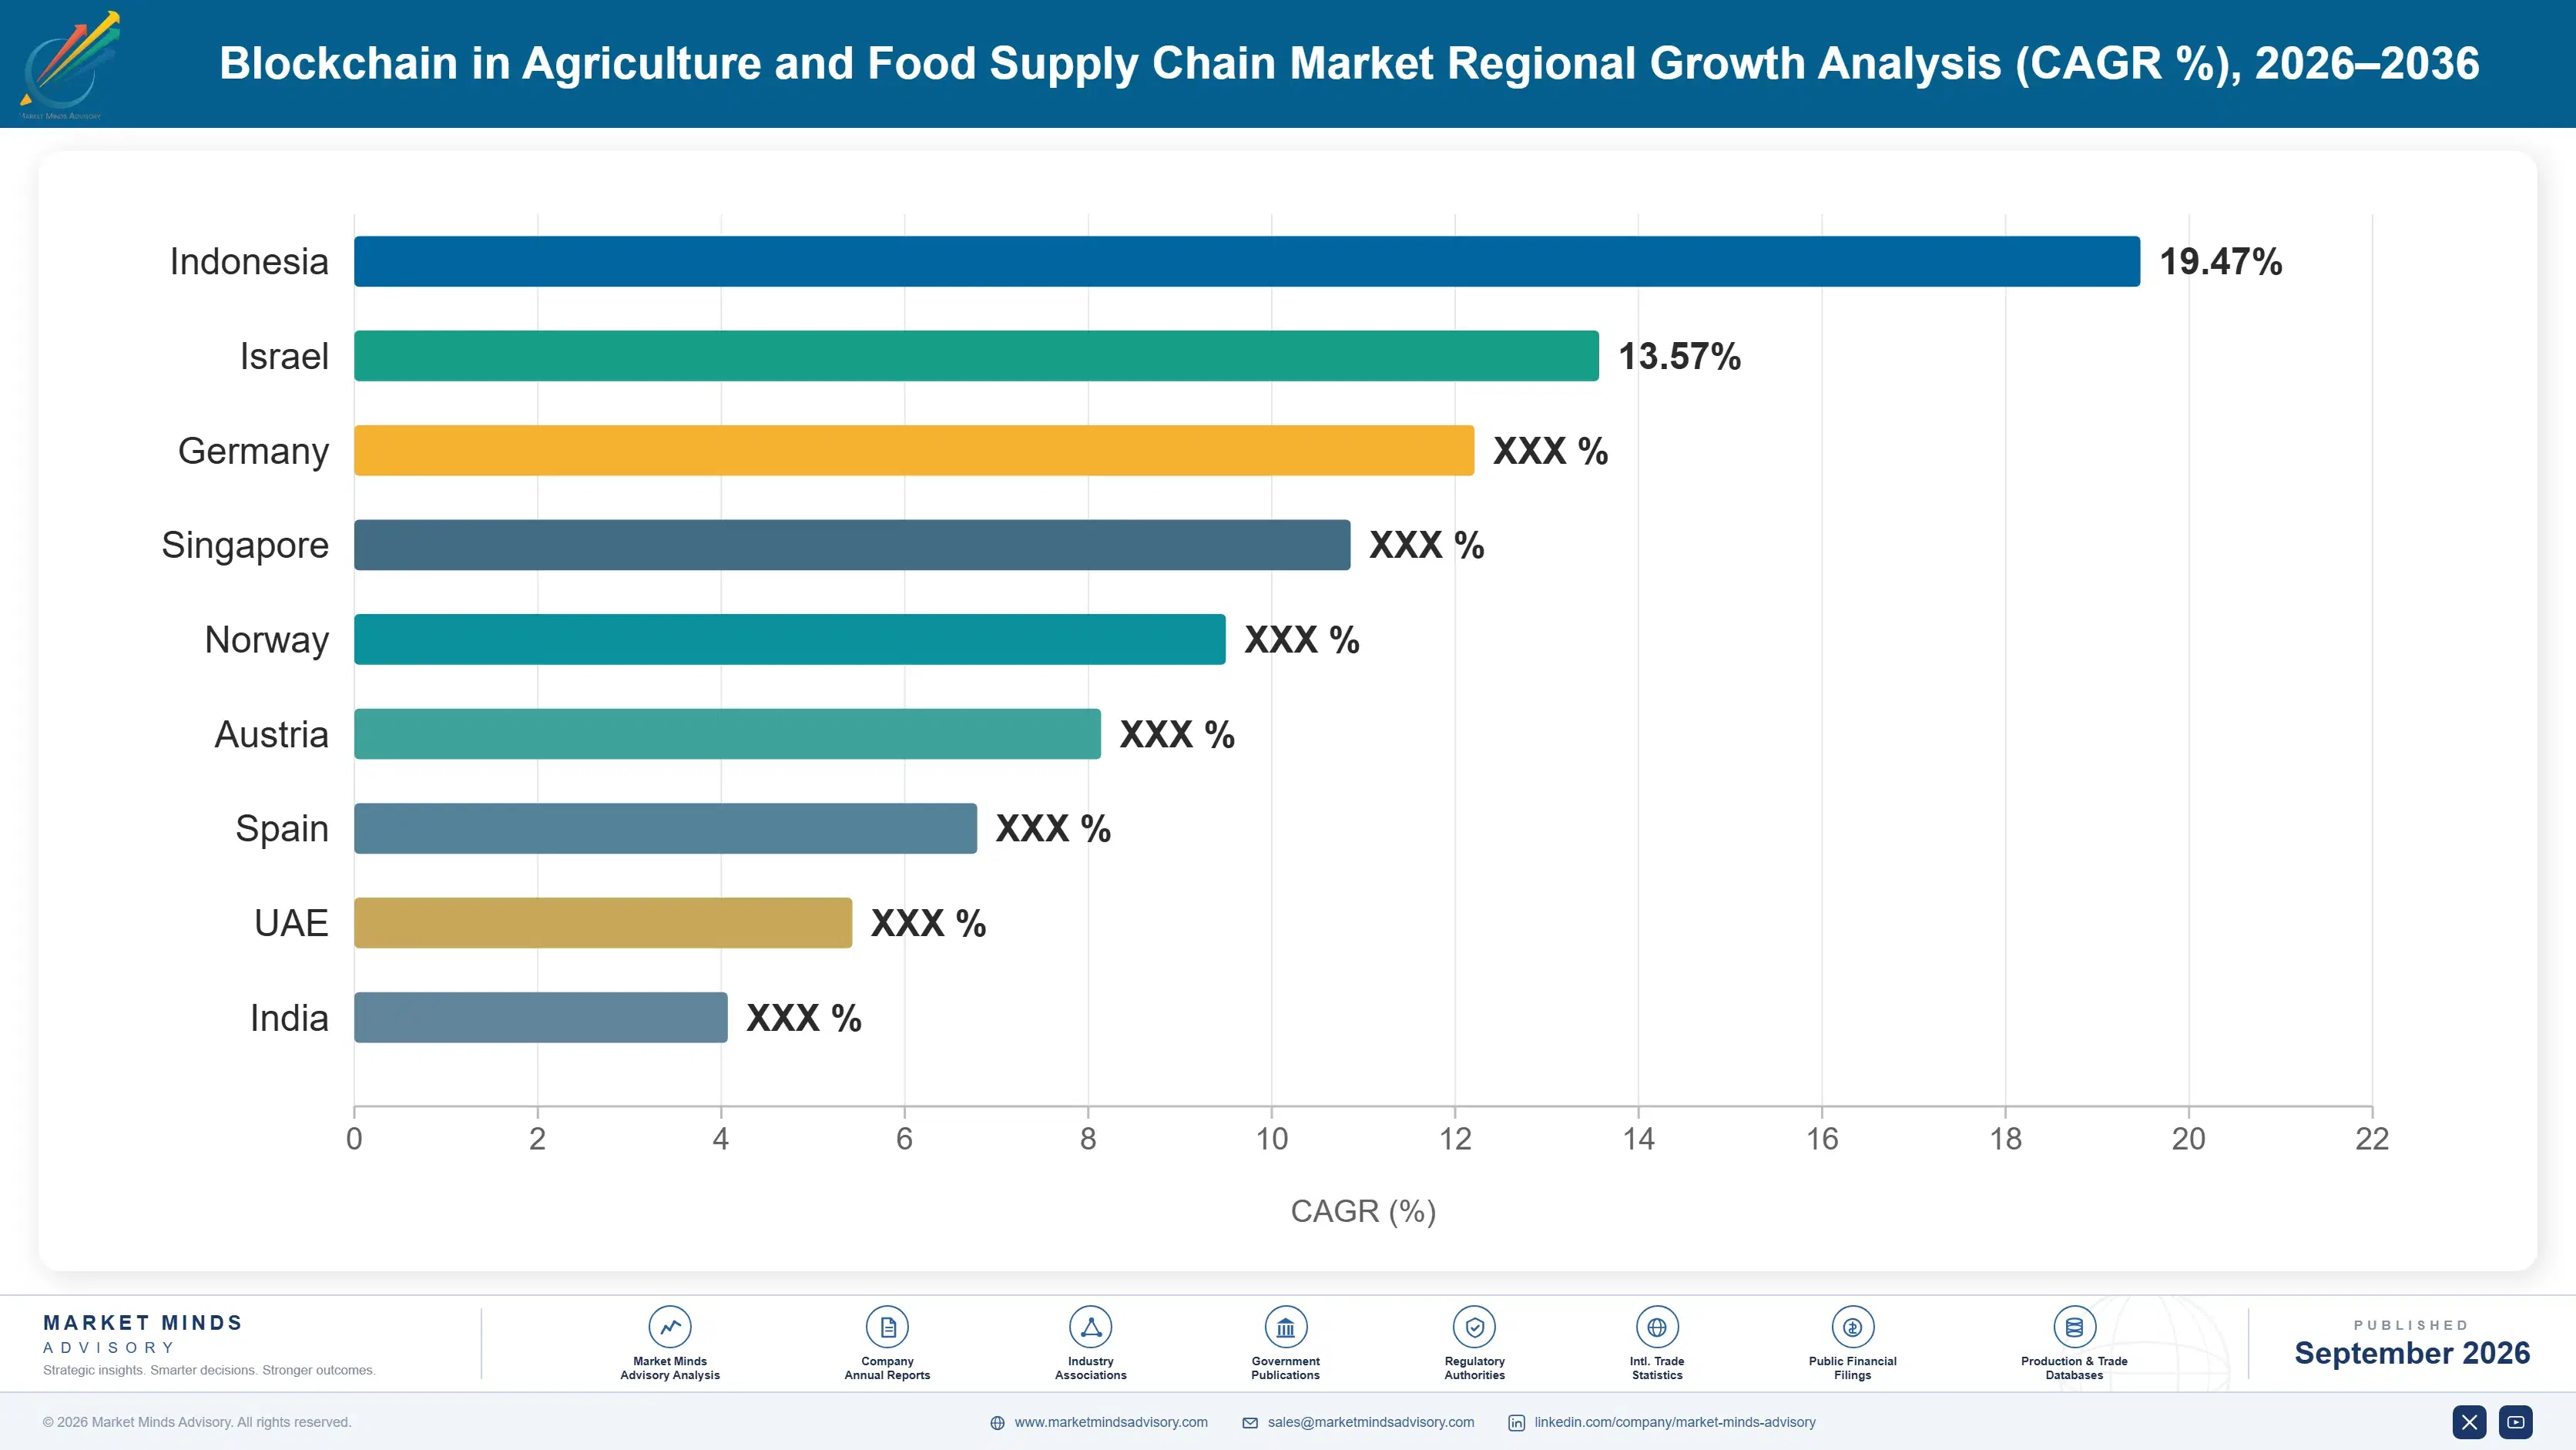
Regional demand tracks regulation and import exposure rather than agricultural output. The largest food producers are not the largest buyers; the largest importers are, because legal obligation attaches at the point where product enters a regulated market and flows upstream from there. Producing countries pay only where exporters do.

Western Europe

Europe holds 31% of this market, above the regional band, and the reason is specific rather than general: EUDR is the only regulation anywhere attaching import refusal to missing geolocation data, and the obligation sits with European operators. Dutch, German and Belgian traders handling cocoa, coffee, palm and soy carry the largest exposure of any commercial group in the world, since Rotterdam and Antwerp are where regulated commodities physically enter. French and Italian food manufacturers add demand through retailer supplier requirements that run ahead of the law. Nordic retailers bought early on sustainability grounds and are buying again on compliance grounds. Replacement of failed first-wave systems adds a further layer of demand across the region.
Share: 31% | CAGR: 14.8% (2026 to 2036)

North America

Demand here is driven by the FDA traceability rule and by recall economics rather than by anything environmental. Large processors in leafy greens, seafood and dairy began procurement well before the compliance date moved, because the record-keeping build takes longer than the extension granted. Retailer requirements amplify it: several national grocers now impose traceability terms on suppliers that exceed the federal rule. Canadian demand is smaller and follows American retailer specifications closely. What distinguishes the region is that buyers accept a recall cost argument, so vendors can sell without waiting for a regulator. Adoption is broad among large processors and thin among mid-sized ones, which is where the next wave of demand will come from.
Share: 26% | CAGR: 15.6% (2026 to 2036)
Regional intelligence for 5 additional markets available in the complete report: East Asia, South Asia and Pacific, Latin America, Middle East and Africa, Eastern Europe. Contact sales@marketmindsadvisory.com.
blockchain-in-agriculture-and-food-supply-chain-ma-country-cagr-analysis-1788417723660

Where Agrifood Traceability Margin Actually Sits

Software licence revenue is the smallest and least defensible part of this market. The commercially interesting positions sit in producer network access, regulatory interpretation and the unglamorous work of getting usable records out of places that have never kept any, and pricing should follow that reality rather than seat counts. Vendors that price on seats are underselling the work badly.

Own the Producer Network Rather Than the Platform

Any competent engineering team can build a ledger. Almost nobody can enrol 40,000 smallholders and keep their data flowing, which is why acquisition multiples for specialists with working origin networks have run at 3 to 4 times those paid for platform technology. Vendors holding such networks in cocoa, coffee or palm can charge for access on a per-producer basis and renew it annually, because the buyer cannot replicate it at any reasonable cost. This is the single most defensible position available in the category and it is being systematically undervalued by technology-led vendors.
Market Impact: Commands 3 to 4 times acquisition multiples currently

Price Against Recall Exposure Not Software Seats

Seat-based pricing anchors this software against enterprise applications costing a fraction as much to deliver, and it caps deal size at a level that cannot fund first-mile work. Pricing against avoided recall exposure changes the arithmetic entirely, since a single multi-state event costs between USD 15 million and USD 40 million and the range is driven by retailer delisting rather than product value. Vendors that reframe the conversation around that number sell to finance rather than to quality, and the average contract value roughly doubles. The evidence required is harder, but the budget is real.
Market Impact: Roughly doubles average contract value across 2 buyer types

Sell Regulatory Interpretation Alongside the Software

Importers do not want a ledger; they want a due diligence statement that will survive inspection. The gap between those two things is regulatory interpretation, and most buyers have no internal capability to close it. Vendors bundling advisory on EUDR scope, risk assessment methodology and evidence sufficiency capture services revenue at margins above the software itself, and typically add 30% to 40% to programme value. It also creates switching cost that software alone never generates, because the interpretation is embedded in how the customer files. Legal risk needs careful management here.
Market Impact: Adds a further 30% to 40% programme value

Build for Offline Capture Before Building Anything Else

Most deployment failures in this market are traced to the same point: the record never got made because there was no connectivity at the collection point, or the interface assumed literacy and a smartphone. Vendors that engineered for offline-first capture, voice input and low-cost handsets reach onboarding rates near 70% against a market average of 38%, and onboarding rate determines whether the whole programme delivers anything at all. This is unfashionable engineering work with no demonstration value whatsoever, and it decides more contracts than any analytics capability on the roadmap.
Market Impact: Lifts producer onboarding from 38% toward 70% completion

Who Controls the Margin Pool

This is a fragmented market by enterprise software standards, with the top five holding roughly 24% on measured agrifood traceability revenue and no participant holding a defensible position across more than two commodity groups. The gap between the leaders and the specialist challengers is narrower than the concentration figure suggests, because the leaders' revenue comes largely from adjacent platform sales while the specialists own the origin data. Several are small enough to be acquired outright.
Competition runs on three dimensions. The first is producer network reach, where specialists in cocoa, coffee, palm and seafood hold positions that cannot be bought quickly. The second is regulatory credibility: whether output has survived an actual customs inspection or FDA records request. The third is integration with the systems food companies already run, where the platform incumbents have an obvious advantage.

Pressure is now coming from two directions that were not competitors three years ago. Certification bodies are building geolocation capability directly, reasoning correctly that audit relationships are worth more than certificates. Commodity traders are doing the same thing internally, since they already hold the data and would rather sell compliance than buy it. Rankings will shift toward whoever consolidates origin networks fastest.
blockchain-in-agriculture-and-food-supply-chain-ma-company-positioning-matrix-1788417724217

Competitive Moat and Risk Dimensions

IBM

Moat: Deep enterprise integration reach

IBM's position rests on relationships with large food manufacturers and retailers that predate this category by decades, together with the integration capability to connect traceability records into ERP, quality and procurement systems already running. That connection is what turns a pilot into an operating process, and specialist vendors consistently struggle with it. The consulting arm makes complex multi-party deployments deliverable.
IBM

Risk: Weak presence at origin

The company has very little direct reach into cooperatives, collection points and smallholder producers, which is precisely where 62% of programme cost and nearly all of the difficulty sits. That leaves IBM dependent on partners for the hardest and most defensible part of the work. Food Trust also carried reputational damage from the first pilot wave.
SAP

Moat: Native supply chain data

SAP's advantage is that the transactional record of who bought what from whom already sits inside systems its customers run, so a compliance layer requires no new enterprise data capture. Green Token established credibility in palm oil and soy specifically, where mass balance accounting is the hard commercial problem. Existing relationships shorten procurement at large processors.
SAP

Risk: Limited smallholder commodity coverage

The approach works well where suppliers are themselves organised firms with systems, and much less well in cocoa, coffee and cattle, where the source is thousands of unregistered producers. Those are the commodities carrying the sharpest EUDR exposure and the fastest growth. Closing that gap requires acquisition or a producer network build SAP has not undertaken.

Players Tracked

Prominent Players

IBM
SAP
Oracle
Trustwell
TE-FOOD International

Other Key Players

Wholechain
Provenance
Farmer Connect
AgriDigital
GrainChain
Connecting Food
Bext360
OriginTrail
Optel Group
Circulor
BlockApps
Transparent Path
Aglive
Ripe Technology
Chainvine

Recent Developments

MARCH 2025

FDA extends food traceability rule compliance date by 30 months

The agency granted an extension moving the compliance date for the Food Traceability Rule to July 2028, following industry submissions arguing that supply chain record-keeping could not be built in the original window. The obligation itself was left unchanged. Nothing about the underlying record-keeping requirement changed at all.
Signal: Procurement at the largest processors continued regardless, because the build genuinely takes longer than the extension granted.
NOVEMBER 2025

European Commission agrees further simplification of deforestation rules

The Commission agreed changes easing due diligence obligations for downstream operators and adjusting the application timetable, after sustained pressure from producing countries and European importers arguing that the geolocation data infrastructure was not yet in place across smallholder supply bases. The obligation on operators placing regulated commodities remains in force.
Signal: Every delay moves signed compliance budget into a later year, which is the sharpest commercial risk vendors here carry.
JUNE 2025

Trustwell expands traceability platform through organic product development

The company added key data element capture and critical tracking event configuration aligned to the FDA rule, developed internally rather than acquired. The release targeted leafy greens, seafood and soft cheese producers facing the sharpest record-keeping obligations under the American rule. No acquisition was involved.
Signal: Food safety vendors are building compliance capability rather than buying it, which keeps specialist valuations lower than owners expect.

What This Software Actually Costs to Deliver

Delivery cost in this category is dominated by field implementation rather than by engineering. Producer onboarding, training and data collection infrastructure account for roughly 62% of programme cost, and that work is performed on the ground in producing countries. Software engineering runs near 18%, cloud and ledger infrastructure below 8%, and regulatory advisory the remainder. The cost base resembles a services business.
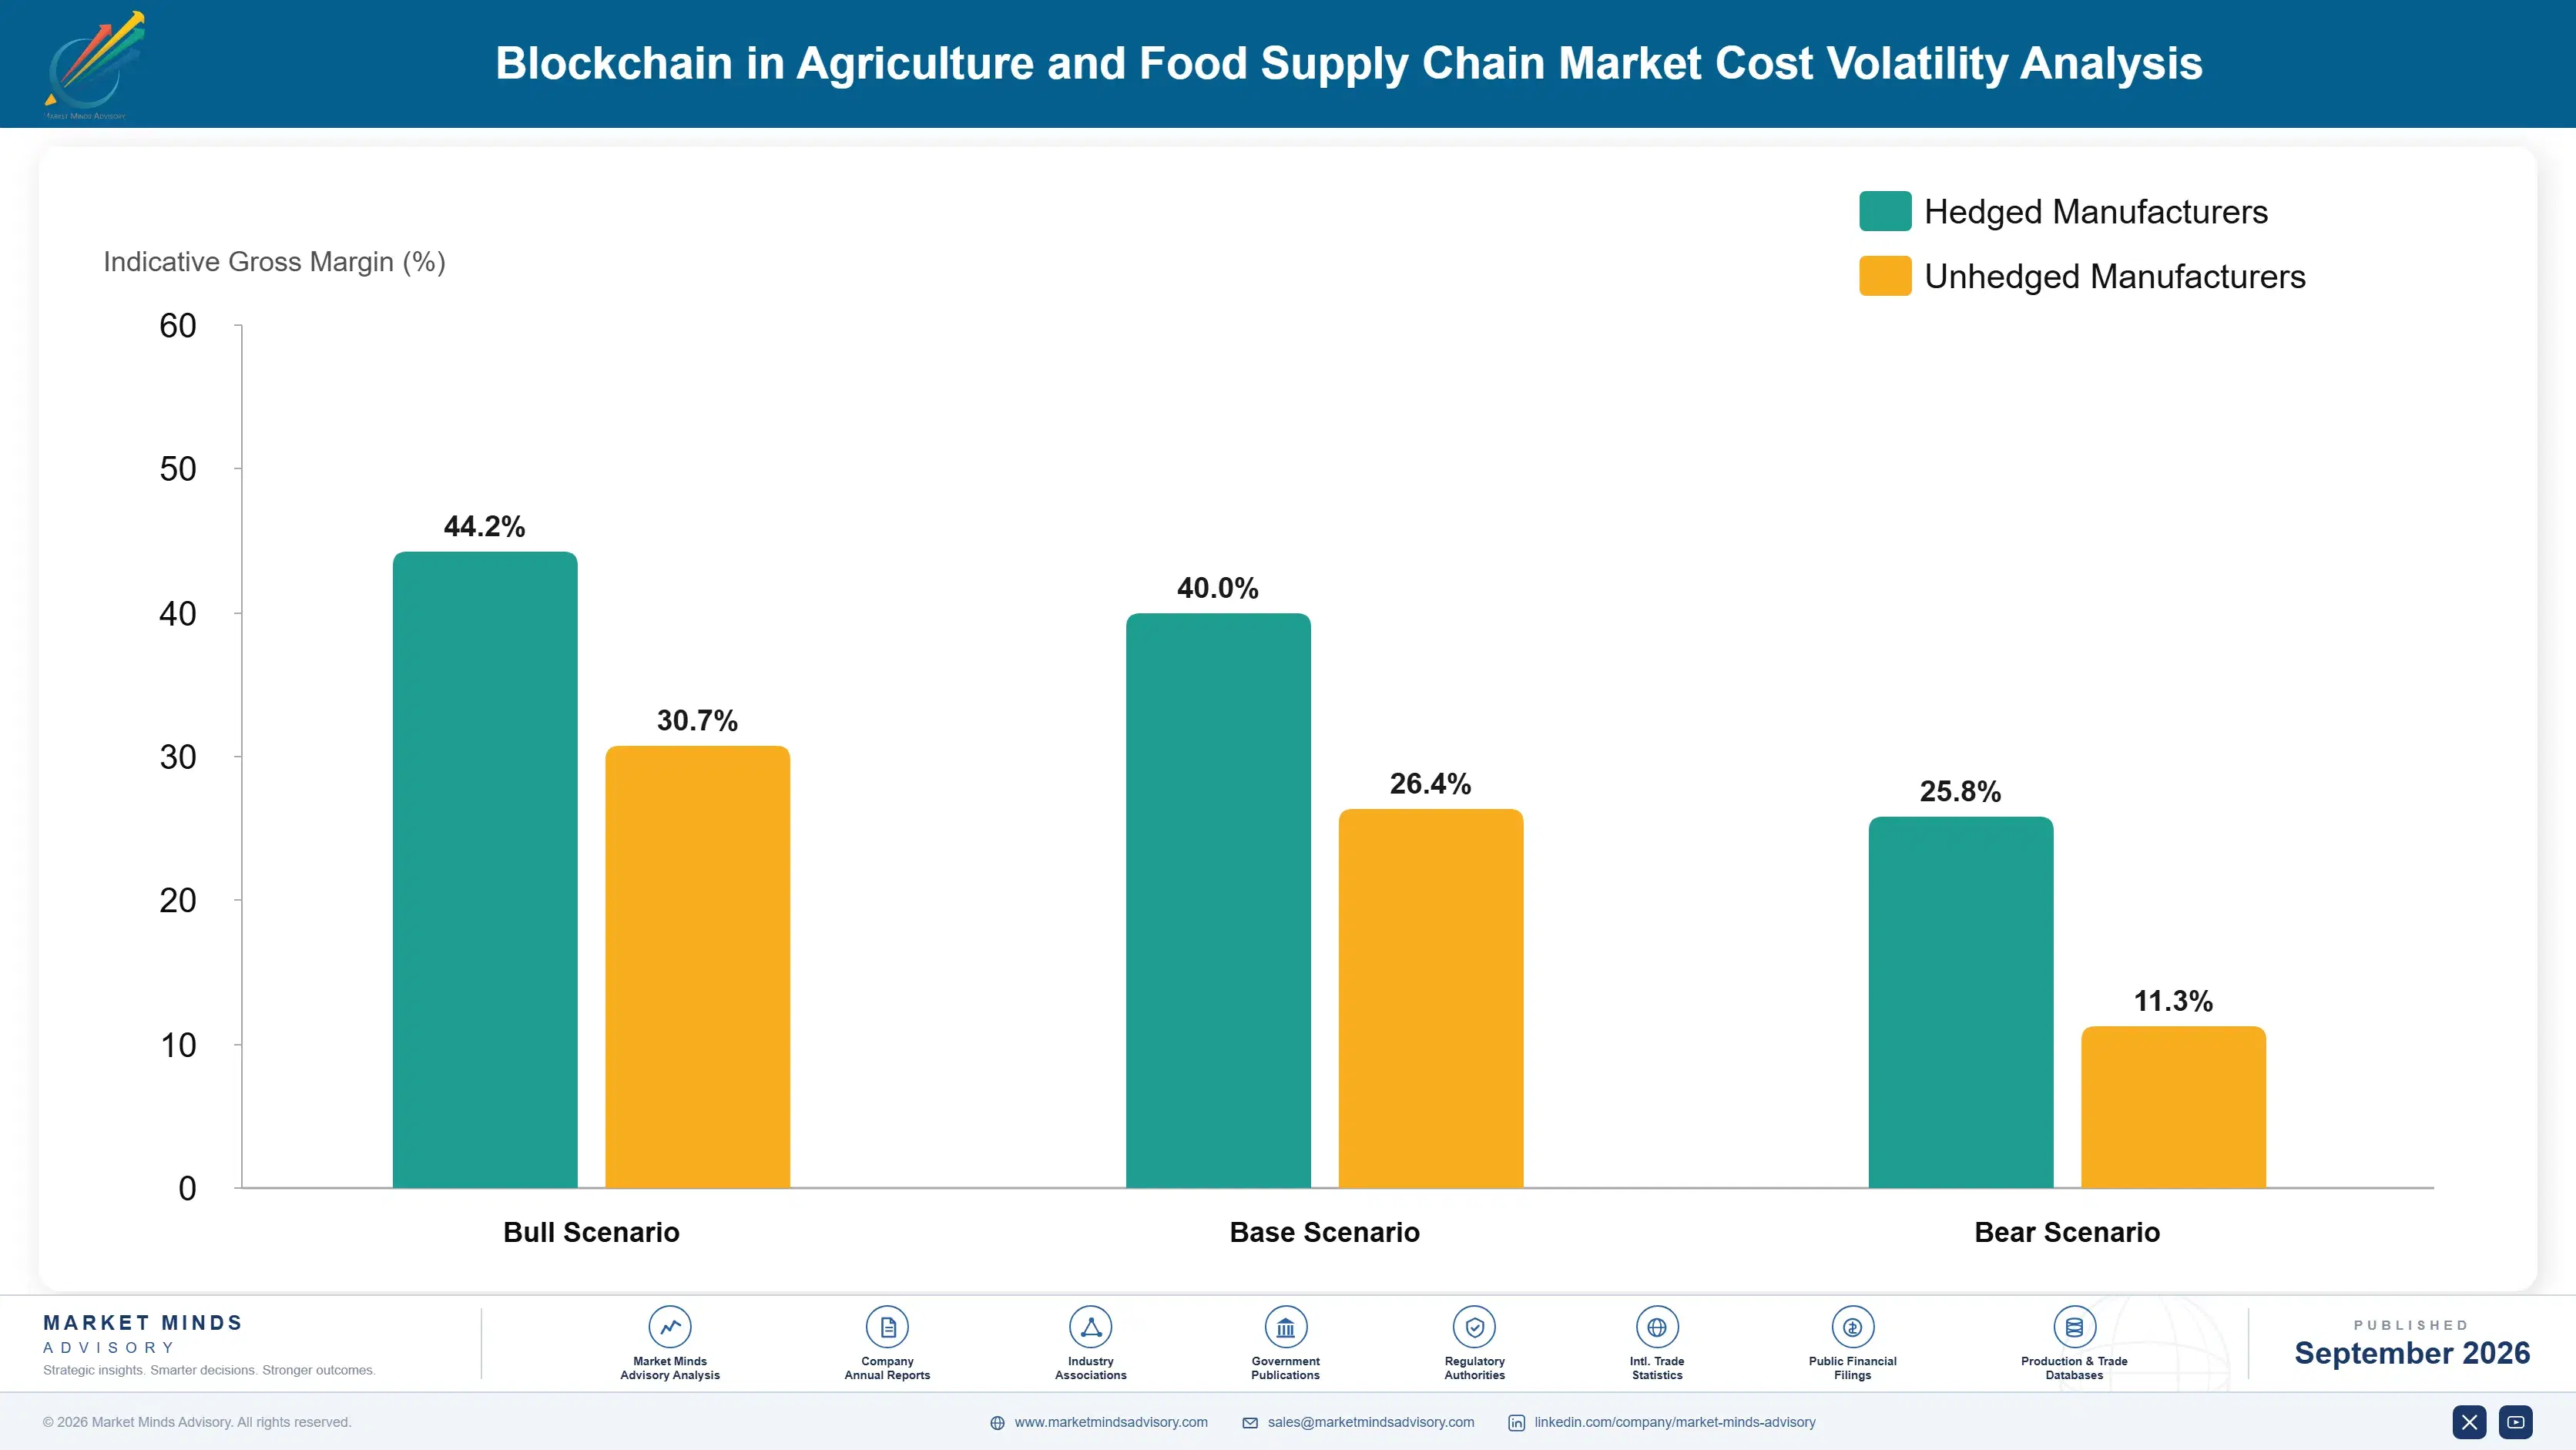
Field cost volatility is real and poorly forecast. Vendors running West African cocoa onboarding through 2024 and 2025 saw per-producer costs rise sharply as cocoa prices reached record levels, drawing local field agents into higher-paying buying roles and forcing wage increases to retain them. Several programmes ran materially over scope. USDA commodity price reporting documents the underlying move, and it fed directly into budgets priced against earlier assumptions.

The competitive disadvantage falls unevenly. Vendors selling fixed-price compliance programmes carry the field cost risk themselves, while those pricing per enrolled producer pass it to the customer and preserve margin. Platform incumbents avoid the exposure by subcontracting origin work, which protects margin but leaves them without the network the market values most. Specialists with owned field organisations carry the highest volatility and the strongest position at once.
blockchain-in-agriculture-and-food-supply-chain-ma-cost-volatility-analysis-1788417724420

Aggregate onboarding at cooperative level

Enrolling through cooperatives and collection centres rather than individual farms cuts per-producer field cost by roughly half, because one visit reaches hundreds of suppliers and the cooperative already holds membership records. It works only where cooperative structures are genuine rather than nominal, which varies sharply by country and commodity across producing regions. Genuine cooperative structures cannot be assumed anywhere.

Price per enrolled producer rather than fixed programme fee

Shifting to a per-producer enrolment charge transfers field cost volatility to the customer, who is usually far better able to absorb it than the vendor. Buyers accept the structure when it is presented alongside transparent unit economics. It also aligns commercial incentives, since both parties then benefit from onboarding rates rising rather than programme scope quietly expanding.

Share verified data across multiple buyers of the same origin

The same cooperative is frequently enrolled three or four times by different buyers running separate programmes, which is pure duplicated cost across the industry. Shared origin registries with per-buyer access charges recover the field investment several times over. Competitive sensitivity slows adoption, but pre-competitive sector initiatives in cocoa and coffee are now demonstrating that it does work.

Portfolio Architecture for Margin Defence

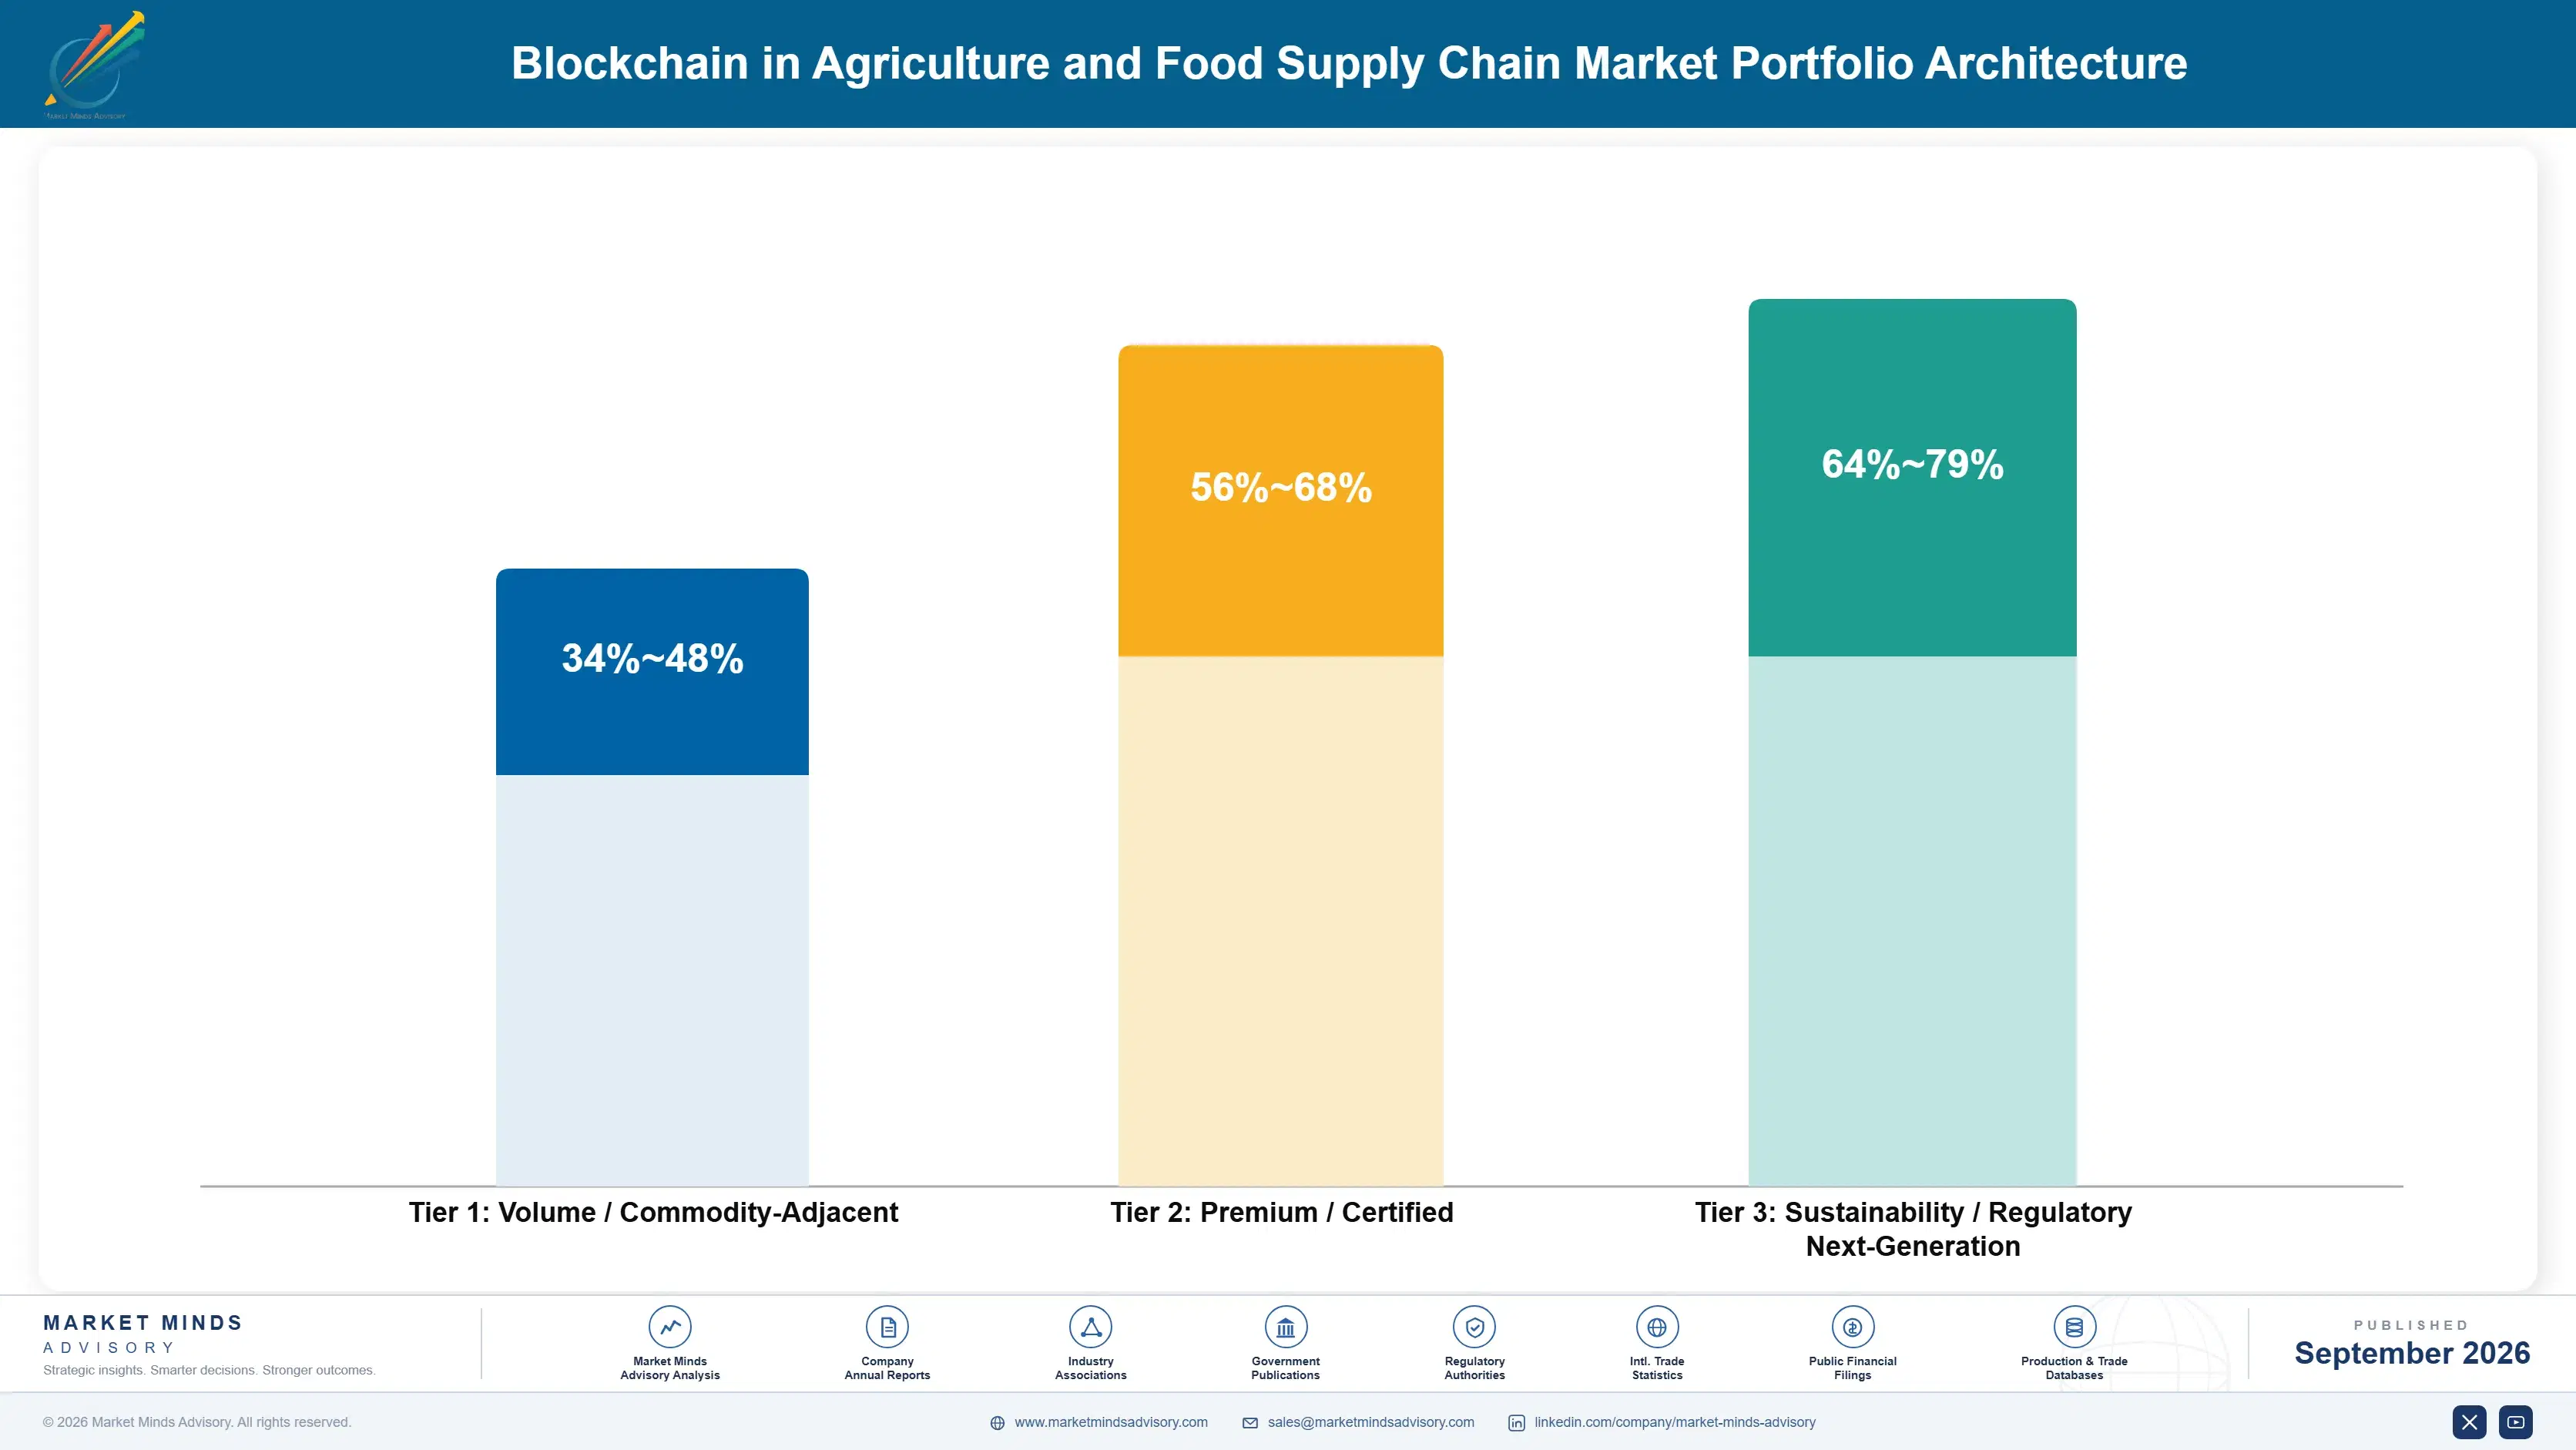
Margin architecture in this market inverts the usual software pattern. The platform layer, which vendors treat as their product, is the least profitable and least defensible part, running at gross margins well below enterprise software norms once field delivery is properly allocated. The compliance and verification layer earns considerably more because the buyer is purchasing legal comfort rather than functionality, and price sensitivity falls accordingly.
The volume tension is between programmes that enrol many producers cheaply and programmes that verify a few thoroughly. Cheap breadth wins deals and loses money; deep verification earns margin but covers a fraction of the supply base and fails the compliance test that requires complete coverage. Vendors that have solved this profitably did so by separating a low-cost capture layer from a higher-priced verification layer and pricing each independently, rather than bundling both into one figure.

High-value revenue concentrates in deforestation compliance for high-risk commodities and in recall management for the food categories with the worst incident histories. Both share a characteristic: the buyer faces a quantified downside that dwarfs the software cost. Everywhere else in this market the value proposition remains discretionary, and discretionary agrifood technology spending has been cut repeatedly for four years.

Volume / Commodity-Adjacent

Producer onboarding, first-mile capture tooling and basic provenance records. The wide range reflects whether field delivery is performed in-house or subcontracted, which changes cost structure fundamentally. Margin here is thin and competitive, and the work exists mainly to enable the layers above it.
Gross Margin: 34-48%

Premium / Certified

Verified traceability, certification integration and recall management sold to processors and retailers with existing quality systems. Buyers accept software-like pricing because the benefit case is quantified against recall exposure. Renewal rates are strong once a programme is embedded into food safety procedures.
Gross Margin: 56-68%

Sustainability / Regulatory / Next-Generation

Deforestation due diligence, geolocation verification and regulatory filing support. The widest range in the portfolio, reflecting how much advisory content is bundled and how mature the customer's own compliance function is. Highest margin and fastest growth, because the alternative to buying is losing market access.
Gross Margin: 64-79%
blockchain-in-agriculture-and-food-supply-chain-ma-portfolio-architecture-1788417724935

High-value Sub-segments and Strategic Watch-out

Deforestation Due Diligence Filing

High value and high growth simultaneously, because importers face import refusal rather than a fine they might absorb. The wide margin range reflects the advisory component, which varies with customer sophistication. Cattle supply chains carry the highest pricing of any commodity because they are the hardest to trace properly.
Gross Margin: 71-79%

Recall and Withdrawal Management

High value with moderate growth, funded from food safety budgets that survive cost reviews because the downside is quantified in millions. Sales cycles are long and evidence requirements are demanding, but renewal is close to automatic once the system is embedded in withdrawal procedures. Leafy greens and seafood dominate demand.
Gross Margin: 58-66%

Provenance and Origin Records

The volume core of the market and its least attractive part commercially. Growth has flattened as brand marketing budgets moved elsewhere, and pricing pressure is severe because the functionality is genuinely commoditised. It remains the data foundation everything else depends on, which is the only reason vendors keep it.
Gross Margin: 38-46%

Certification Body Verification Services

The strategic watch-out, because certification organisations are building this capability internally and hold audit relationships that software vendors cannot match. What today looks like a partnership channel may become the most credible competitor in the category within three years. Vendors treating certifiers as partners are misreading the direction of travel.
Gross Margin: 44-54%

How Traceability Spending Recurs

Revenue in this market is more annuity-like than the pilot history suggests, but the annuity attaches to producer enrolment rather than to software seats. Once a cooperative network is enrolled and its records flow, the maintenance charge renews annually because re-enrolling elsewhere costs more than the subscription. Programmes that stopped at platform licensing renew far less reliably, which is why churn correlates with whether the vendor owns origin data.
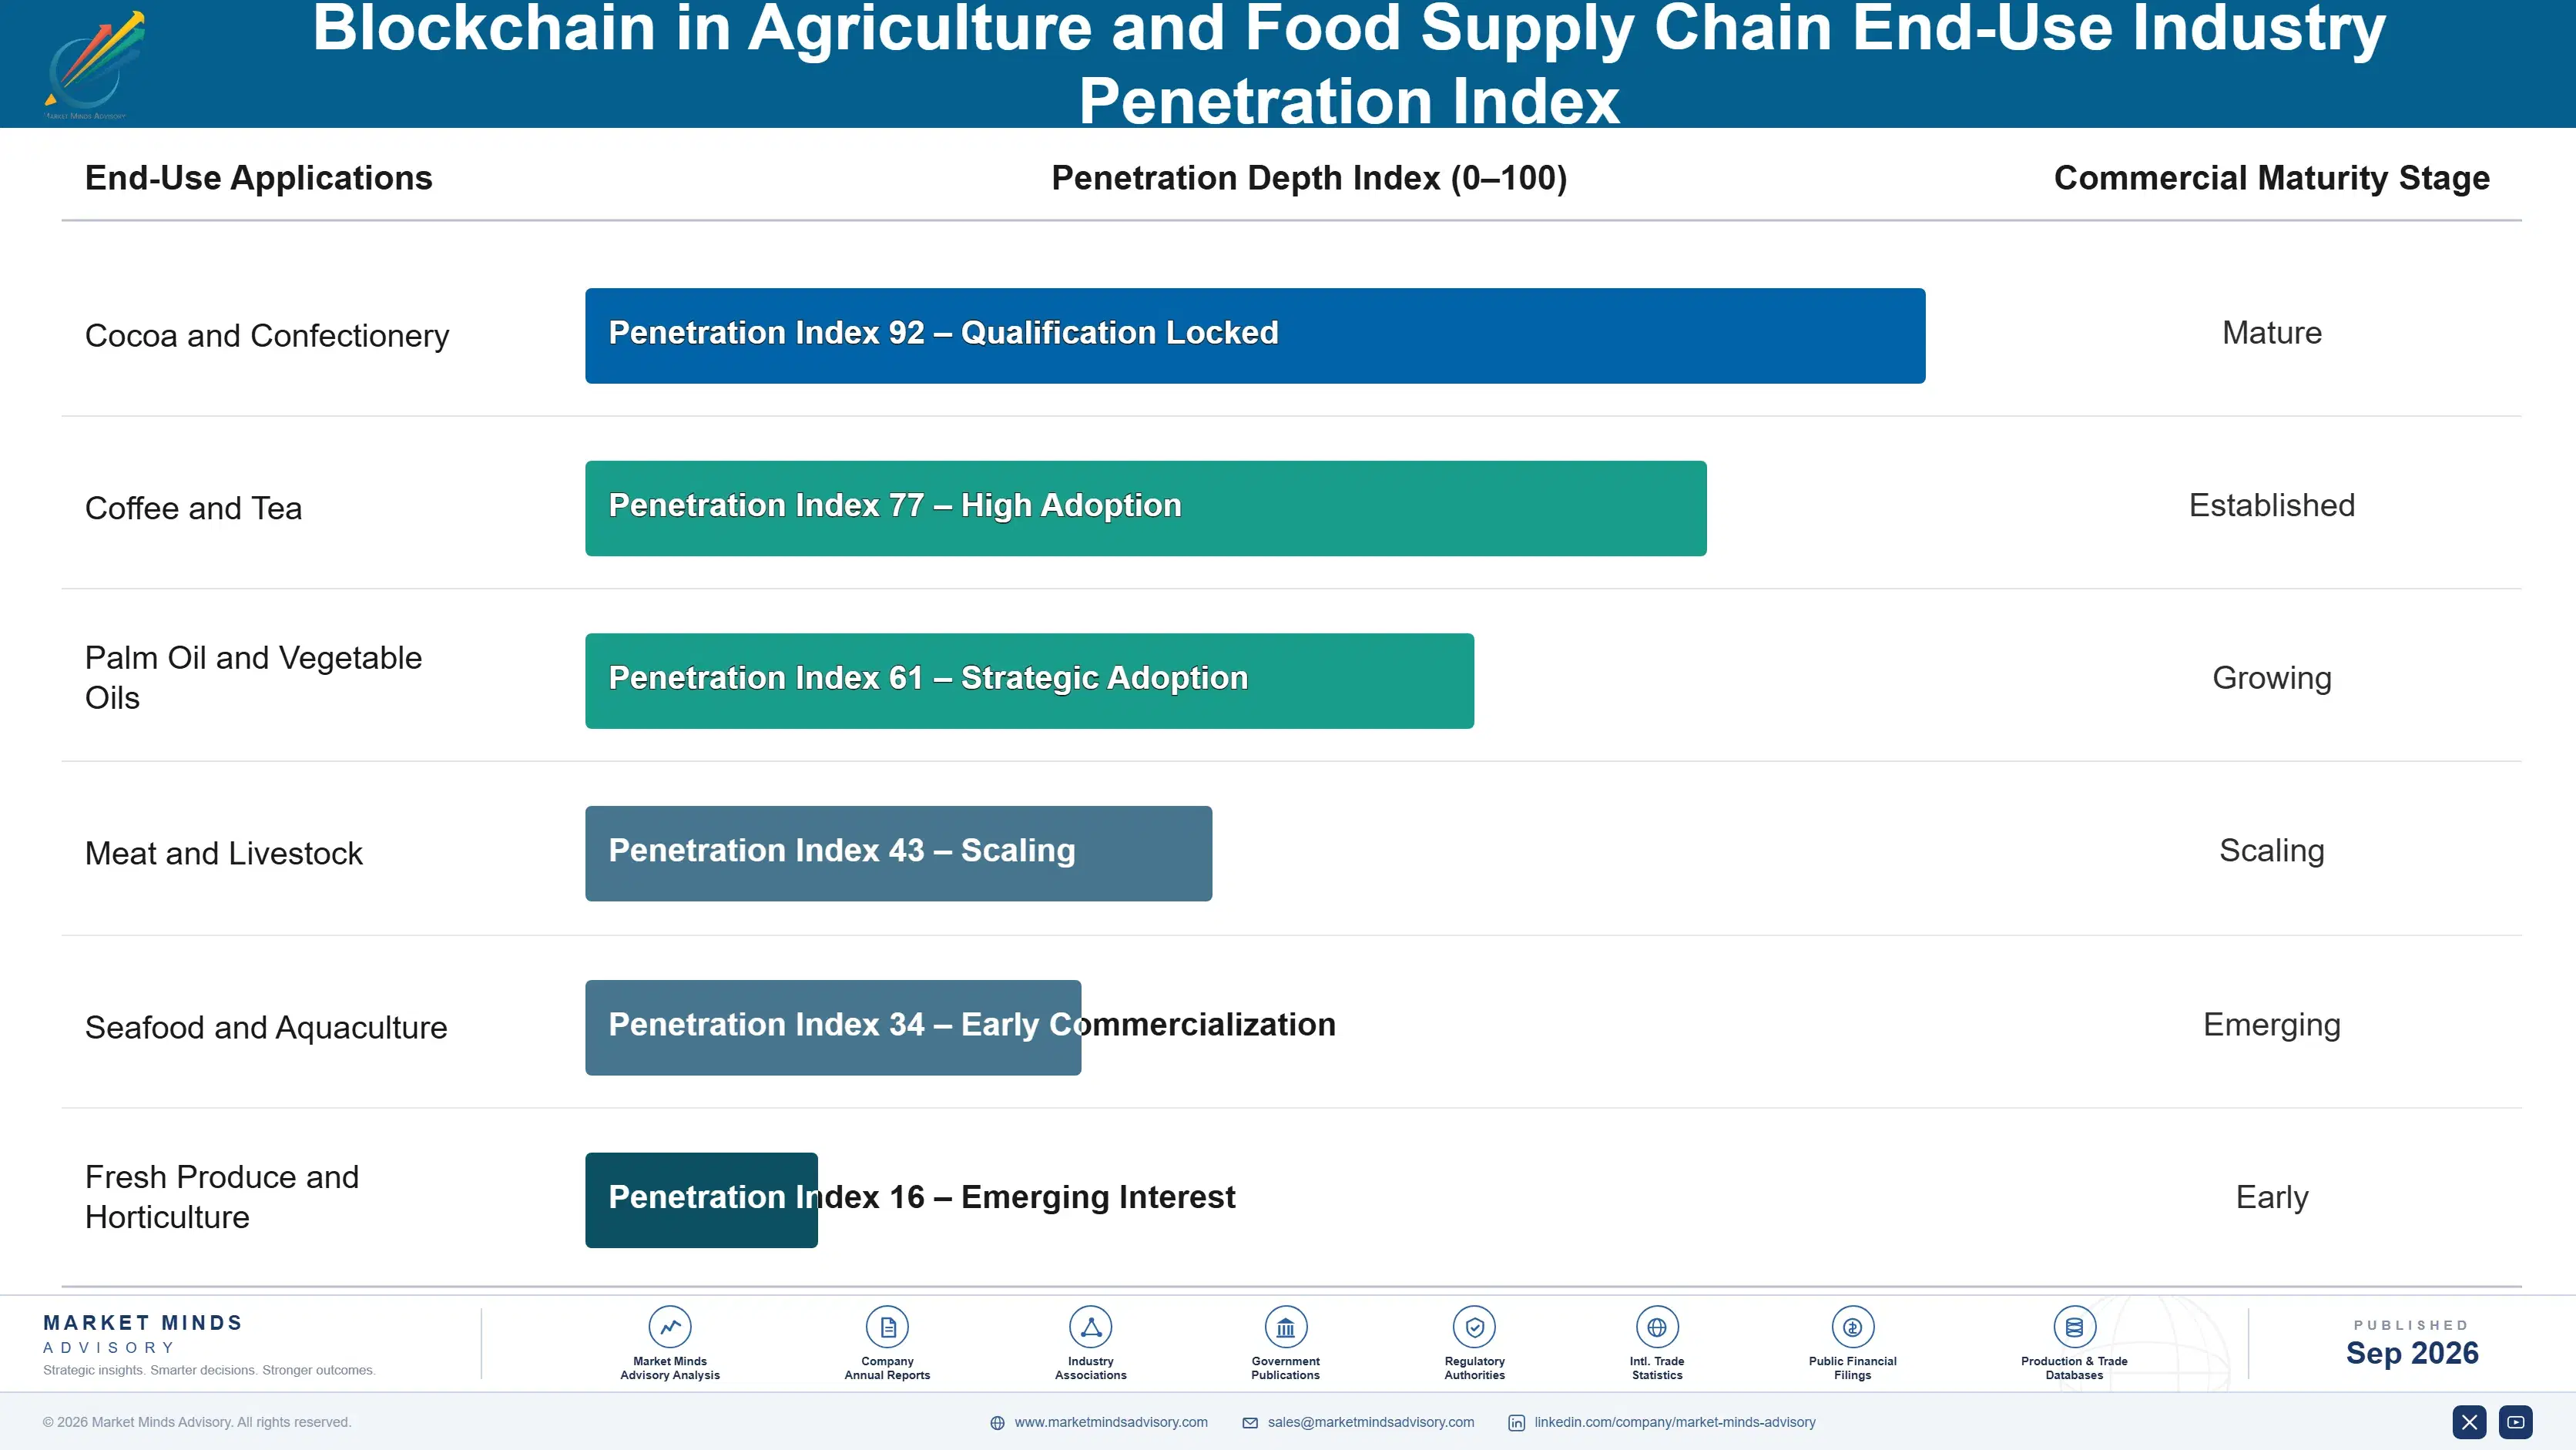
Stickiness varies sharply by end-use. Cocoa and coffee buyers renew at the highest rates, because their supply bases are fragmented enough that rebuilding would take years. Palm oil and soy sit lower, since suppliers are larger firms re-onboarded quickly. Seafood is high again, driven by regulatory import controls. Meat and dairy processors renew reliably once the system is written into withdrawal procedures. Grain buyers churn most.

The buyer profile has changed generationally. The first wave was bought by sustainability and innovation teams staffed by people who found the technology interesting. Today's buyer is a compliance officer or food safety director who does not care about the architecture and will not be sold on it. Vendors still leading with distributed ledger language are talking to a buyer who retired from the decision.
blockchain-in-agriculture-and-food-supply-chain-ma-end-use-penetration-index-1788417725432

Where Value Concentrates Now

These are among the four positions where our research anticipates prominent divergence between winners and laggards over the coming forecast period. Each is grounded in the demand model, the regulatory perimeter, and the announced capacity pipeline.
01 / ORIGIN NETWORK OWNERSHIP

Buy the producer relationships before competitors price them properly

The defensible asset in this market is a functioning relationship with thousands of producers who reliably enter data, and no engineering effort substitutes for it, however well funded. Specialists holding those networks in cocoa, coffee, palm and seafood are currently trading at 3 to 4 times platform technology multiples and remain cheap relative to what the regulation makes them worth. Acquirers who wait for the enforcement wave will pay considerably more than acquirers who move now, while the field is still fragmented and largely privately held.
02 / REGULATORY EVIDENCE STANDARDS

Sell what survives inspection, not what looks impressive in demonstrations

Importers are buying a due diligence statement that will withstand a customs officer, and every capability that does not contribute to that is decoration they will not fund and should never have been offered. Vendors whose output has already passed an actual inspection or records request hold an advantage that no product feature matches. The commercial discipline is to build toward the evidence standard rather than toward the roadmap, which requires resisting a considerable amount of internal engineering enthusiasm along the way.
03 / FIELD COST DISCIPLINE

Price per enrolled producer and stop absorbing field volatility

Roughly 62% of programme cost is field delivery performed in producing countries, and that cost moves with local commodity prices in ways no vendor can forecast reliably from one season to the next. Fixed-price compliance programmes transfer that risk onto the vendor balance sheet, where it has already destroyed the margin on several large contracts. Per-producer pricing passes the volatility to a customer far better placed to carry it and aligns both parties behind higher onboarding rates rather than quietly expanding scope.
04 / CERTIFIER COMPETITIVE THREAT

Treat certification bodies as competitors rather than as partners

Certification organisations hold audit relationships with exactly the producers this market needs to reach, and they have concluded, correctly, that verification services are worth considerably more than the certificates they currently sell. Several are now building geolocation capability directly rather than partnering for it, which converts what was a distribution channel into a direct rival. Vendors that continue treating certifiers purely as a distribution channel are misreading a shift that will reshape competitive positions across this whole category within roughly three years.

Engagement Snapshot From the Field

A live engagement with an industry participant carrying material or product regulatory and market exposure ahead of a defining policy shift, showing how our research translates into a defensible multi-year portfolio strategy.
MARKET MINDS ADVISORY · CLIENT ENGAGEMENT SUMMARY
Blockchain in Agriculture and Food Supply Chain Producer Strategic Portfolio Review and Transition Roadmap 2026·Investment Scenario on Blockchain in Agriculture and Food Supply Chain Exposure Evaluation 2025-26
CLIENT PROFILE
A European chocolate manufacturer with annual revenue near USD 2.4 billion (client-reported, unverified by MMA), sourcing cocoa from roughly 190,000 smallholder farms across Cote d'Ivoire, Ghana and Ecuador through a mix of direct cooperative relationships and traded volumes purchased from three international commodity houses. Roughly 40% of source volume had no plot-level location data of any kind at the point of engagement.
STRATEGIC CHALLENGE
The company faced EUDR obligations it could not meet on traded volumes, where suppliers were unwilling to disclose farm-level origin because that information constituted their commercial position. Internal estimates put the exposed volume at USD 310 million annually (client-reported, unverified by MMA). Two vendor pilots had already been run and neither had produced records that legal counsel considered defensible under inspection.
MMA APPROACH
MMA mapped the supply base by traceability status rather than by volume, separating directly sourced cooperative volume from traded volume and assessing what evidence each route could realistically produce. We interviewed 14 suppliers, three certification bodies and two customs advisory practices. Vendor capability was assessed against evidence sufficiency rather than feature comparison, which reordered the shortlist substantially and eliminated the incumbent.
KEY FINDINGS
  1. Traded volume, not direct sourcing, carried nearly all the compliance exposure, and no vendor solution addressed it because the barrier was commercial confidentiality rather than technology.
  2. Two of the three commodity houses already held usable geolocation data and were withholding it as negotiating leverage, not because they lacked the underlying records.
  3. Cooperative-level aggregation could cover 78% of the smallholder base at roughly a third of the per-farm onboarding cost the shortlisted vendors had quoted.
  4. The incumbent pilot vendor had never produced output tested against an actual customs inspection anywhere in Europe, which counsel identified as the decisive gap.
CLIENT PROFILE
A European chocolate manufacturer with annual revenue near USD 2.4 billion (client-reported, unverified by MMA), sourcing cocoa from roughly 190,000 smallholder farms across Cote d'Ivoire, Ghana and Ecuador through a mix of direct cooperative relationships and traded volumes purchased from three international commodity houses. Roughly 40% of source volume had no plot-level location data of any kind at the point of engagement.
STRATEGIC CHALLENGE
The company faced EUDR obligations it could not meet on traded volumes, where suppliers were unwilling to disclose farm-level origin because that information constituted their commercial position. Internal estimates put the exposed volume at USD 310 million annually (client-reported, unverified by MMA). Two vendor pilots had already been run and neither had produced records that legal counsel considered defensible under inspection.
MMA APPROACH
MMA mapped the supply base by traceability status rather than by volume, separating directly sourced cooperative volume from traded volume and assessing what evidence each route could realistically produce. We interviewed 14 suppliers, three certification bodies and two customs advisory practices. Vendor capability was assessed against evidence sufficiency rather than feature comparison, which reordered the shortlist substantially and eliminated the incumbent.
KEY FINDINGS
  1. Traded volume, not direct sourcing, carried nearly all the compliance exposure, and no vendor solution addressed it because the barrier was commercial confidentiality rather than technology.
  2. Two of the three commodity houses already held usable geolocation data and were withholding it as negotiating leverage, not because they lacked the underlying records.
  3. Cooperative-level aggregation could cover 78% of the smallholder base at roughly a third of the per-farm onboarding cost the shortlisted vendors had quoted.
  4. The incumbent pilot vendor had never produced output tested against an actual customs inspection anywhere in Europe, which counsel identified as the decisive gap.
RECOMMENDED STRATEGY
Phase 1: Renegotiate traded volume contracts to make geolocation disclosure a condition of supply, using volume commitment as the consideration rather than paying separately for data. Phase 2: Move direct sourcing onboarding to cooperative level immediately, accepting slightly lower granularity in exchange for covering the large majority of the smallholder base quickly. Phase 3: Replace the incumbent pilot vendor with one whose filings had survived inspection, and bundle regulatory advisory into the contract rather than sourcing it separately.
OUTCOME
The client secured geolocation disclosure from two of three commodity houses within seven months without paying a data premium, and covered 78% of its direct smallholder base through cooperative onboarding at roughly USD 4.1 million against an original vendor quotation near USD 12 million (client-reported, unverified by MMA). Compliance responsibility moved from sustainability to legal.

Frequently Asked Questions

Foundational context covering the market sizes, CAGR, scope, country, region and competition that inform every finding below. This section is provided to cover basics and most often pre-purchase conversations, answered from the MMA Primary Research Dataset.

What is the current size of the Blockchain in Agriculture and Food Supply Chain Market?

The market was worth USD 0.9 billion in 2025 and reaches USD 1.05 billion in 2026. Compliance-driven spending rather than brand marketing now accounts for the large majority of that figure.

How large will the Blockchain in Agriculture and Food Supply Chain Market be by 2036?

MMA forecasts USD 4.79 billion by 2036, an expansion of 4.56 times over the forecast period. That represents USD 3.74 billion of incremental annual revenue against 2026.

What is the CAGR for the Blockchain in Agriculture and Food Supply Chain Market 2026 to 2036?

The base case is 16.4% compound annual growth, with a bull case at 17.6% and a bear case at 15.2%. Regulatory enforcement intensity is what separates the three scenarios.

Which segment is growing fastest?

Deforestation and land-use compliance grows at 24.6%, half again the market rate of 16.4%. European import rules make plot-level geolocation a condition of market access for seven commodity groups.

Who are the major companies in the Blockchain in Agriculture and Food Supply Chain Market?

IBM, SAP, Oracle, Trustwell and TE-FOOD International lead on measured agrifood traceability revenue. Together they hold roughly 24%, which makes this unusually fragmented for enterprise software.

Which country is growing fastest?

Brazil grows fastest at 22.8%, because Brazilian beef, soy and coffee exporters carry the sharpest European deforestation exposure of any producing country and cattle traceability is the hardest problem here.

Report Segmentation Architecture

The full report scope spans multiple orthogonal segmentation dimensions, with cross-tabulated demand data provided for each dimension pair. Coverage extends further to regional breakdowns, trend trajectories, and the competitive detail needed to support segment-level decision-making.

By Primary Market Dimension

  • Provenance and Origin Traceability
  • Deforestation and Land-Use Compliance
  • Food Safety Recall and Withdrawal
  • Payments and Trade Finance Settlement
  • Certification and Standards Verification
  • Cold Chain and Condition Records

By End-Use Industry

  • Cocoa and Confectionery
  • Coffee and Tea
  • Palm Oil and Vegetable Oils
  • Meat and Livestock
  • Seafood and Aquaculture
  • Fresh Produce and Horticulture

By Commercial Dimension

  • Food Manufacturers and Processors
  • Commodity Traders and Importers
  • Grocery Retailers and Foodservice
  • Producer Cooperatives and Exporters
  • Certification and Audit Bodies
  • Government and Regulatory Agencies

By Region

  • North America
  • Western Europe
  • East Asia
  • South Asia and Pacific
  • Latin America
  • Middle East and Africa
  • Eastern Europe

Scope, Methodology, and Coverage

Every figure in this report is reproducible from documented input assumptions. The scope below maps the historical period, the forecast horizon, the segmentation dimensions, and the countries covered, alongside the underlying primary and qualitative methodology.
Historical Period
2020 to 2025
Forecast Period
2026 to 2036
Base Year
2025 (USD billions; MMA Primary Research Dataset, September 2026)
Market Definition
This market covers distributed-ledger and cryptographically verified record-keeping software applied to agricultural production and food supply chains, spanning provenance tracing, deforestation and land-use compliance, recall and withdrawal management, certification verification, condition record-keeping and settlement, together with the first-mile data capture tooling sold as part of those programmes. Revenue is measured as software licence, subscription and directly attributable implementation and advisory services. General farm management software, ERP, commodity trading platforms, cryptocurrency and tokenised agricultural finance instruments are excluded.
Quantitative Units
USD billions, software and attributable services revenue at vendor level
Segmentation Dimensions
Application type, end-use commodity industry, buyer type, region
Regions Covered
North America, Western Europe, East Asia, South Asia and Pacific, Latin America, Middle East and Africa, Eastern Europe
Countries Covered
United States, Canada, Germany, Netherlands, France, United Kingdom, Italy, Spain, Belgium, Poland, Brazil, Mexico, Colombia, Peru, Ecuador, China, Japan, South Korea, India, Indonesia, Malaysia, Vietnam, Thailand, Australia, Cote d'Ivoire, Ghana, Kenya, United Arab Emirates
Key Companies Profiled
IBM, SAP, Oracle, Trustwell, TE-FOOD International, Wholechain, Provenance, Farmer Connect, AgriDigital, GrainChain, Connecting Food, Bext360, OriginTrail, Optel Group, Circulor, BlockApps, Transparent Path, Aglive, Ripe Technology, Chainvine
Quantitative Methodology
Primary survey, n=3,800 respondents, Q4 2025, six countries; demand-side model with trade association cross-validation
Qualitative Methodology
47 expert interviews, Q4 2025; applied to validate demand model assumptions, identify emerging dynamics, and assess competitive positioning
Report Format
PDF and XLSX data workbook (Word format preview document)
Publisher
Market Minds Advisory
Report Code
MMA-2026-AGR-131
Published
September 2026
Contact
sales@marketmindsadvisory.com | www.marketmindsadvisory.com

Purchase the full Blockchain in Agriculture and Food Supply Chain Market Report (2026 to 2036).

The full MMA report examines how agrifood traceability moved from a discretionary marketing purchase to a regulated compliance obligation, and what that shift does to competitive positions across the vendor field. It sizes the market to 2036 across six application segments, seven regions and 28 countries, with segment-level growth rates and regional demand mechanisms set out in full. Competitive analysis covers 20 participants assessed on measured agrifood traceability revenue, including moat and risk assessment for the two leaders. The report quantifies delivery cost structure, first-mile onboarding economics and margin architecture by portfolio tier. It closes with four strategic verdicts and an anonymised client engagement covering EUDR readiness in cocoa.
Six application segments sized to 2036
Seven regions with demand mechanism analysis
Twenty vendors on consistent revenue basis
First-mile onboarding cost benchmarks by commodity
Margin architecture across three portfolio tiers
Anonymised European deforestation readiness client engagement

Built For The People Who Decide

From boardroom strategy to bench-side execution, this report is read cover-to-cover by leaders shaping the next decade of their industry, turning demand scenarios, market dynamics and valuation benchmarks into decisions.
CXOs/ Presidents/ VPs/ Managers
M&A and Corporate Development
Strategy Teams and R&D Heads
Procurement and Product Directors
Regulatory and Compliance Leaders
Investor Relations and Equity Analysts