Market Minds Advisory
Bioprocess Technology Market

Bioprocess Technology Market: Bioprocess Technology Market: Single-Use Adoption, Titre Economics and Capacity Utilisation 2026 to 2036

Cell culture titres rose roughly tenfold in two decades, which means the same drug now needs a fraction of the bioreactor volume it once did. Equipment demand had to change with it.

Lead Analyst

Published

September 2026

Make Smarter Decisions with Customized Research Insights

Request a free sample report and evaluate market opportunities, growth trends, and competitive dynamics relevant to your business needs.

2025 MARKET VALUE$26.4BMarket Size 2025
2036 FORECAST VALUE$66.1BBase Case , 2026 to 2036
CAGR 2026 TO 20368.7 %Bull 10.0% / Bear 7.4%
INCREMENTAL OPPORTUNITY$37.4BNet 10- year value creation
EXPANSION MULTIPLE2.30x2036 value over 2026 base
Strategic Levers
M&A Pipeline
Regional Outlook
Country Rankings
Competitive Intelligence
Segmental Deep-dive
Call-Us : 91 93563 13602

Executive Snapshot and Market Trajectory.

Cell culture titres climbed roughly tenfold across two decades, so a drug needing a 20,000 litre stainless steel train in 2005 can now be made in 2,000 litres. Equipment demand did not shrink alongside the volume. It moved to an entirely different kind of plant.
The market reaches USD 28.7 billion in 2026 and USD 66.1 billion by 2036, a 2.30 times expansion at 8.7% annually. Single-use bioreactors and fluid handling assemblies grow at 13.1%, half again the market rate of 8.7%, because smaller batches make cleaning validation an expense with no return at all. East Asia holds 27% of global spend, and India compounds fastest of any country at 14.2% on biosimilar and vaccine capacity being built right now.
Five suppliers hold 48% of bioprocess equipment and consumable revenue, and that concentration understates their position considerably, because a validated consumable is written into a regulatory filing. Sartorius, Danaher, Thermo Fisher Scientific, Merck KGaA and Repligen lead the category. Changing an approved filter or bag afterwards means a full regulatory submission, which is the reason supplier positions here outlast almost any commercial negotiation the customer might attempt.
Market Definition
This report covers bioprocess technology by equipment and consumable class: single-use bioreactors and fluid handling assemblies, stainless steel bioreactor systems, chromatography and purification equipment, filtration systems and membranes, cell culture media and reagents, and process analytical and automation systems. It excludes finished biologic drugs, contract manufacturing services, fill-finish and packaging equipment, laboratory-scale research instrumentation, and pharmaceutical small molecule process equipment.
Base Year Value
$26.4B in 2025 (MMA Primary Research Dataset, September 2026)
Forecast Period
2026 to 2036, eleven discrete annual values
CAGR
8.7% base case. Bull 10.0%. Bear 7.4%.
Fastest Growth Segment
Single-Use Bioreactors And Fluid Handling Assemblies: 13.1% CAGR
Fastest Growth Country
India: 14.2% CAGR
Fastest Growth Region
South Asia and Pacific: 11.0% CAGR
Largest Region
East Asia: 27% of 2025 global value
Market Leaders
Sartorius, Danaher, Thermo Fisher Scientific, Merck KGaA and Repligen lead on bioprocess equipment and consumable revenue. Source: MMA Analysis.
Primary Survey
n=3,800 procurement and R&D decision-makers, Q4 2025, six countries
Methodology
Demand-side build-up, cross-validated against public data, 47 expert interviews

Bioprocess Technology Market Forecast Scenarios

bioprocess-technology-market-size-forecast-scenario-1789993834054
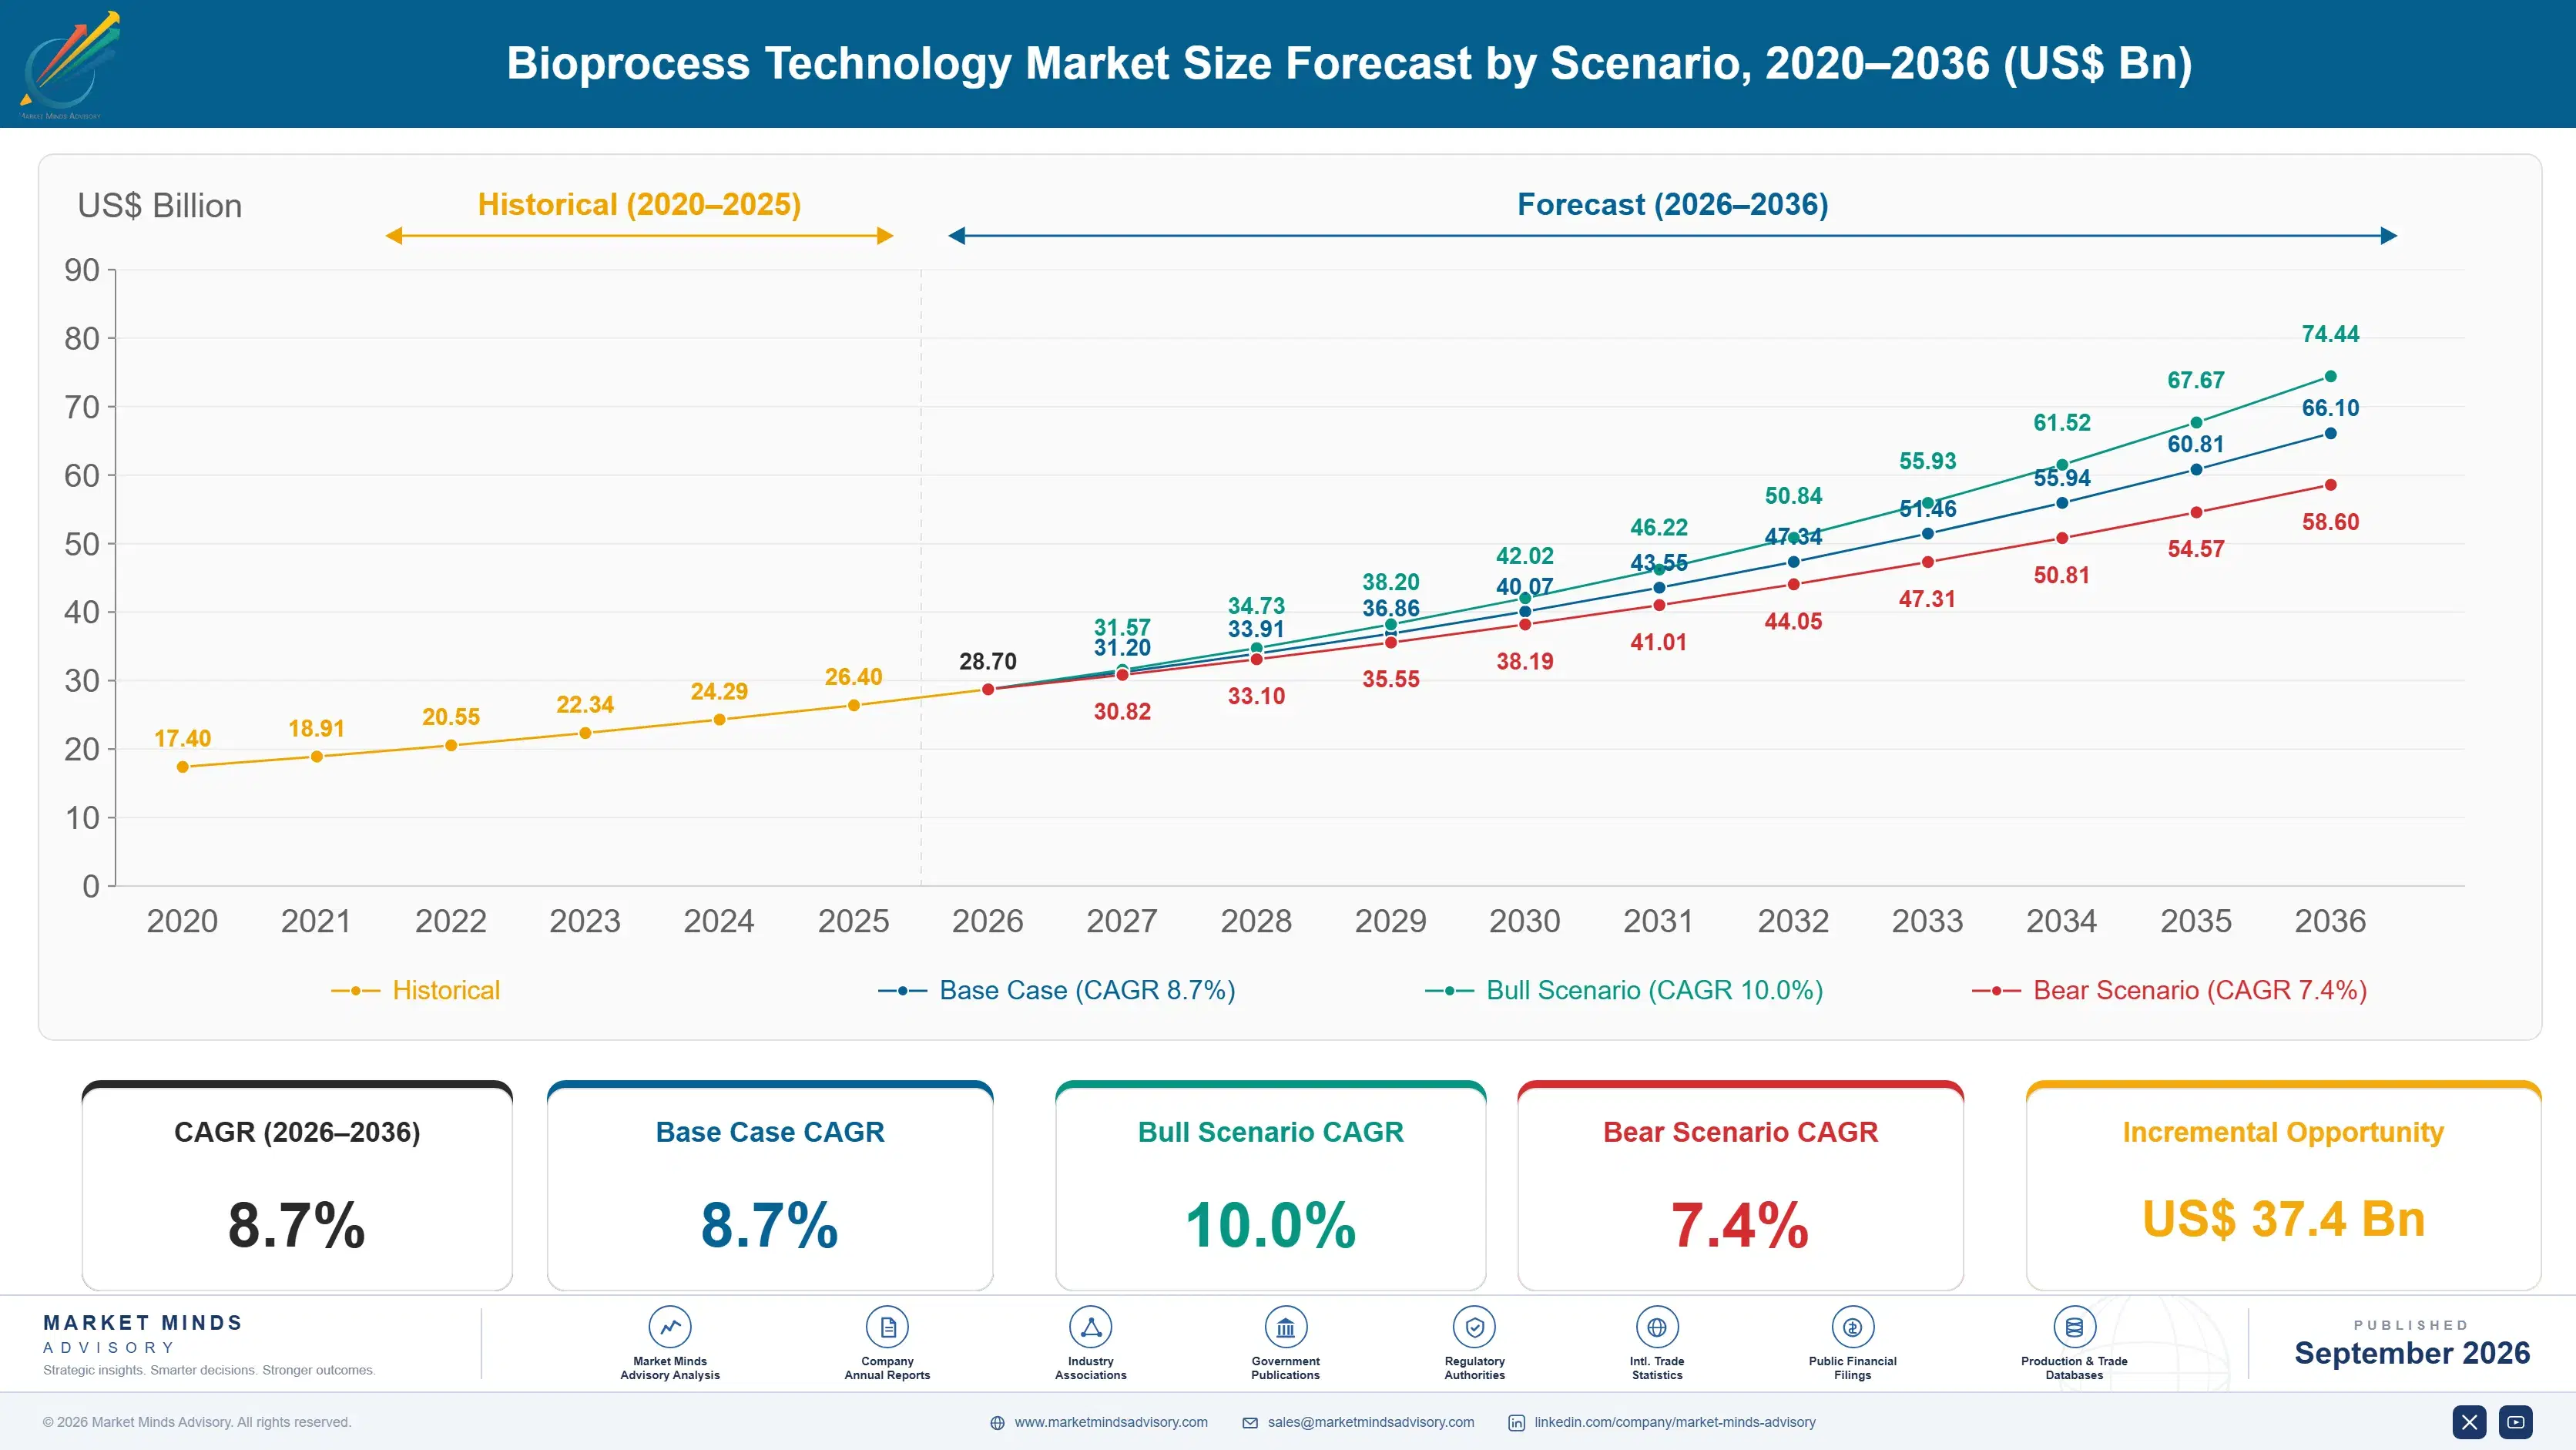
Between 2020 and 2025 the category compounded at 7.6%, and the period contained one distortion nobody should extrapolate from. Vaccine manufacturing pulled forward several years of single-use consumable demand into eighteen months, then supply chains unwound and inventories corrected sharply through 2023. Underneath that, the durable movement was continuous: monoclonal antibody and cell therapy pipelines expanded and biosimilar approvals accelerated across every major regulatory market.
The base case holds 8.7% on three mechanisms. Biologic pipelines keep expanding, with antibody-drug conjugates and cell therapies adding manufacturing complexity rather than only volume. Single-use adoption keeps displacing stainless steel because cleaning validation costs the same whatever the batch size, which penalises small batches severely. And biosimilar entry after patent expiries builds capacity in markets that never previously manufactured biologics at commercial scale, particularly across India, China and South Korea.
The bull case at 10.0% assumes cell and gene therapy manufacturing reaches commercial scale rather than remaining clinical, which would multiply equipment intensity per patient dose enormously. The bear case at 7.4% is titre improvement continuing to outrun demand: if productivity per litre keeps rising, drug volume growth stops translating into equipment volume growth at all.

Titre Rose, Volume Fell, Spend Grew

Productivity broke the relationship between drug demand and equipment volume. A monoclonal antibody culture yielding half a gram per litre in the early 2000s now routinely yields five, so the same annual drug supply needs a fraction of the bioreactor volume it once did. Anyone forecasting this market on biologic sales growth alone has been wrong in the same direction for fifteen years running.
TOP FIVE CONCENTRATION48%Held by suppliers whose consumables sit inside regulatory filings
CELL CULTURE TITRE5 g/LTypical antibody productivity against roughly one tenth historically
CONSUMABLE REVENUE SHARE63%Recurring materials rather than capital equipment across supplier revenue
FACILITY BUILD DURATION46 monthsFrom investment decision to approved commercial biologic production
CAPACITY UTILISATION64%Average across commercial biologic manufacturing plants operating worldwide
CHANGE NOTIFICATION PERIOD18 monthsTypical regulatory lead time before switching an approved consumable
What grew instead was the number of plants and the intensity of what runs inside them. Smaller batches meant more products per facility, faster changeover between them, and equipment that could be swapped rather than cleaned. Consumables now account for roughly 63% of supplier revenue, which converted an equipment business into a recurring materials business with entirely different economics attached to it.
The regulatory mechanism is what makes those positions durable. A filter, bag or resin used in approved commercial production is named in the regulatory filing, and changing it requires a notification process that typically runs 18 months. No manufacturing organisation undertakes that to save money on a consumable. Supplier positions consequently outlast commercial negotiations, procurement reorganisations and frequently the people who originally made the selection.
"Procurement teams arrive at these accounts convinced the consumable spend is negotiable. Then somebody explains that switching the filter means a regulatory submission and eighteen months of work for a saving that rounds to nothing. They stop asking. That conversation happens at least once a year somewhere."
Director, Biopharmaceutical Manufacturing and Bioprocess Practice · MMA Healthcare Practice · September 2026

Market Trends

Single-Use Displaces Stainless Where Batches Are Small

Cleaning validation for a stainless steel bioreactor costs roughly the same whether the batch is 20,000 litres or 2,000, which makes it disproportionately expensive as titres rise and batch volumes consequently fall. Single-use assemblies remove that expense entirely and cut changeover between products from several weeks down to a few days, which matters in any facility running multiple products through one suite. Single-use bioreactors and fluid handling grow at 13.1% against 8.7% for the market. Stainless steel retains large-volume established products where validation cost spreads across enough output to stay economic.
Market Impact: Plants take about 46 months

Modality Complexity Grows Faster Than Manufactured Volume

Antibody-drug conjugates, bispecific antibodies and cell therapies each require more processing steps, more purification stages and considerably tighter process control than a conventional monoclonal antibody at comparable volume. A cell therapy dose is manufactured per patient rather than per batch, which inverts the whole economics of the plant and the equipment inside it. Equipment and consumable intensity per gram of product therefore rises even where the gram count does not, which is the reason spend keeps growing through a period when the bioreactor volume requirement per gram has been falling steadily throughout.
Market Impact: Consumables reach 63% of revenue

Market Opportunities and Growth Drivers

Biosimilar Approvals Build Capacity In New Markets

Patent expiries on major monoclonal antibodies opened biosimilar manufacturing to companies that had never produced biologics at commercial scale, and most of that capacity is being built across Asia rather than added to existing Western plants. India compounds at 14.2%, faster than any other country measured, on biosimilar and vaccine capacity under construction right now. A new plant buys everything at once rather than incrementally, so each build represents equipment demand arriving inside a single 46 month cycle rather than spread thinly across decades of incremental purchasing behaviour by an established plant.
Market Impact: Titres rose about 10 times

Consumables Convert Equipment Sales Into Recurring Revenue

Bags, filters, chromatography resins, culture media and tubing assemblies together now represent roughly 63% of supplier revenue, and every one of them is consumed and reordered on a production schedule the customer cannot vary at will. That converted a capital equipment business carrying lumpy multi-year cycles into a materials business carrying predictable quarterly volume behind it instead. Suppliers accordingly price installed equipment to win the specification rather than to earn margin on the hardware, because the regulatory filing entry that follows is worth considerably more than the machine itself ever was.
Market Impact: Utilisation sits near 64%

Market Restraints and Challenges

Rising Titres Suppress Bioreactor Volume Demand

Cell culture productivity rose roughly tenfold across two decades and shows no sign of stopping, so each additional gram of biologic demand requires steadily less bioreactor volume than the gram before it did. The root cause is straightforward scientific progress in cell line engineering and media formulation, which nobody in the industry would want reversed. Commercially it caps equipment volume growth well below drug demand growth. Mitigation runs through consumable intensity, process analytical content and modality complexity, all of which rise per litre even as the litres required keep falling.
Market Impact: Changeover falls from 3 weeks

Installed Capacity Runs Well Below Design Utilisation

Commercial biologic manufacturing capacity runs at roughly 64% utilisation worldwide, a consequence of vaccine-era overbuilding and of clinical programmes that failed after capacity had already been committed and funded. The root cause is that a plant takes around 46 months to build against pipeline timelines nobody predicts reliably. Commercially this delays new capital equipment orders for as long as spare capacity exists somewhere. Mitigation runs through contract manufacturers absorbing some of that idle capacity, and through consumable demand that continues regardless of whether any new plants are being built anywhere at all.
Market Impact: Purification adds 4 extra stages
4 additional market trends, 3 additional growth drivers, and 2 additional restraints and challenges are covered in the full report. Contact sales@marketmindsadvisory.com to access the complete intelligence.

Segment CAGR and Growth Architecture

Segmentation follows equipment and consumable class, since each class carries different economics: whether it is capital or recurring, whether it is named in a regulatory filing, and how directly rising titres affect the volume required. Six classes cover the market, from single-use assemblies through to process analytical systems. Therapeutic modality and end-user type are separate dimensions handled elsewhere.
bioprocess-technology-market-market-share-analysis-1789993834626

Single-Use Bioreactors And Fluid Handling Assemblies

Single-use assemblies grow at 13.1%, half again the market rate of 8.7%, because cleaning validation costs roughly the same whatever the batch volume and titre improvement has made batches considerably smaller. Removing that validation entirely cuts changeover between products from weeks to days, which matters enormously in facilities running several products through the same suite. The consumable nature of the product is the commercial point: every bag and assembly is reordered on the production schedule, and each one is named in the regulatory filing. Switching supplier after approval requires a notification process running around 18 months, so selection decisions taken during process development effectively persist for the whole commercial product life.
CAGR 13.1%

Process Analytical And Automation Systems

Process analytical and automation systems compound at 11.4% as regulators and manufacturers both move toward controlling processes in real time rather than testing batches afterwards. Continuous processing, which runs product through purification without holding it in tanks between steps, is impossible without measurement good enough to release material on the process rather than on the assay. Adoption is uneven: established products rarely retrofit because the filing would have to change, while new facilities specify it from the outset. That split means growth arrives with newly built capacity and with new therapeutic modalities rather than through any upgrade cycle running across the existing installed base of manufacturing plants already operating today.
CAGR 11.4%
Full segment breakdown across 6 segments available in the complete report.

Regional Architecture and Country Demand Map

East Asia holds 27% of bioprocess spend, ahead of every other region, on biosimilar and vaccine capacity built out across China, South Korea and Japan over the past decade. North America follows closely behind at 26%, on originator manufacturing and cell therapy production concentrated there.

East Asia

East Asia takes 27% of bioprocess spend, the largest regional share, and the reason is capacity built during the past decade rather than any historical position. South Korean contract manufacturers operate some of the largest single-site biologic capacity anywhere, built specifically to serve Western originators on cost and scale. Chinese biosimilar and vaccine manufacturing expanded rapidly under national programmes treating biologics as a strategic industry. Japanese demand runs through established originators with substantial internal capacity of their own. Growth at 9.8% sits above the global rate, and new plants buy every equipment category at once rather than incrementally across decades. Singapore adds specialist capacity serving regional and Western customers alike.
Share: 27% | CAGR: 9.8% (2026 to 2036)

North America

Twenty-six percent of spend reaches North America, where originator manufacturing and cell therapy production account for most of it. Cell and gene therapy plants concentrate here more heavily than anywhere else, and their equipment intensity per patient dose is far above conventional biologic manufacturing at any volume. Capacity utilisation runs below the design assumption after vaccine-era overbuilding, which delays new capital orders without touching consumable demand at all. Sartorius, Danaher, Thermo Fisher Scientific and Repligen all hold substantial regional positions. Growth at 8.2% sits slightly below the global rate on that utilisation overhang, though consumable demand continues entirely unaffected by it. Canadian biologic manufacturing adds a smaller further increment of regional demand.
Share: 26% | CAGR: 8.2% (2026 to 2036)
Regional intelligence for 5 additional markets available in the complete report: Western Europe, South Asia and Pacific, Latin America, Middle East and Africa, Eastern Europe. Contact sales@marketmindsadvisory.com.
bioprocess-technology-market-country-cagr-analysis-1789993835151

Where Bioprocess Positions Are Won

A consumable named in an approved regulatory filing is worth far more than the equipment it actually runs on, capacity utilisation determines only when capital orders arrive and never once touches consumable demand, and the fastest growing manufacturing markets are building entire new plants rather than expanding them. The four levers follow those facts.

Win The Filing Entry During Development

A filter, bag or resin named in an approved regulatory filing stays there, because changing it requires a notification process running around 18 months that nobody undertakes to save money on a consumable. The decision is made during process development, years before commercial volume exists and when the customer is least price-sensitive. Suppliers competing on price at commercial launch are competing for a socket that closed long ago. Development-stage technical support costs real money against no immediate revenue at all, and it determines revenue across the entire commercial product life that follows afterwards.
Market Impact: An 18 month change process fully protects positions

Price Hardware To Win The Consumable Stream

Consumables represent roughly 63% of supplier revenue and recur on a production schedule the customer cannot vary, while the equipment itself sells once. Pricing installed hardware to win the specification rather than to earn margin on the machine is straightforward arithmetic once that ratio is understood. The discipline is organisational rather than analytical, since equipment and consumable businesses frequently carry separate margin targets that actively prevent the trade. Suppliers maximising hardware margin are protecting the smaller 37% of their revenue at the direct expense of the considerably larger recurring part behind it.
Market Impact: Consumables carry fully 63% of all supplier revenue

Follow New Plant Construction Into Growth Markets

India compounds at 14.2% and Middle East programmes are funding complete plants rather than expansions, and a new facility buys every category at once across a 46 month construction cycle. That is a completely different sales motion from serving an established manufacturing site, where purchases arrive incrementally and approved vendor lists closed years earlier. Reaching those projects requires supplier presence at the engineering and design stage rather than at the procurement stage. Suppliers arriving only when the purchase order is finally issued find the specification already written around somebody else entirely.
Market Impact: India compounds at fully 14.2% every single year

Sell Consumables Through The Utilisation Trough

Biologic manufacturing capacity runs at roughly 64% utilisation, which delays capital equipment orders while spare capacity exists but does not reduce consumable demand from the production that continues running. Suppliers organised entirely around capital equipment sales see a downturn arriving, where suppliers organised around consumables see a stable recurring base underneath. Building commercial coverage that stays genuinely valuable when nobody is buying equipment keeps the customer relationship alive through the trough. The commercial organisations that disappear entirely during a capital pause struggle badly to return once construction eventually resumes again.
Market Impact: Utilisation at just 64% delays all capital orders

Who Controls the Margin Pool

Five suppliers hold 48% of bioprocess equipment and consumable revenue, and that figure understates their actual position considerably. Sartorius, Danaher, Thermo Fisher Scientific, Merck KGaA and Repligen each hold consumable positions written into approved regulatory filings, which no competitor can displace through commercial means alone. All participants here are assessed on bioprocess equipment and consumable revenue rather than on any broader corporate measure.
Competitive activity concentrates on development-stage engagement rather than on commercial-stage selling, because that is where filing entries are decided. Suppliers compete through process development support, scale-up services and application expertise offered before any meaningful revenue exists. The second dimension is breadth, since customers increasingly prefer fewer suppliers across an integrated process train rather than best-of-breed selections that each require their own separate qualification work.

Pressure is emerging from Asian suppliers serving the biosimilar and vaccine plants being built across India, China and South Korea, where regulatory filings are being written now rather than inherited from anybody. Rankings shift where new capacity is built rather than where existing capacity operates, which is the reason regional presence during construction matters considerably more here than any installed base does.
bioprocess-technology-market-company-positioning-matrix-1789993835682

Competitive Moat and Risk Dimensions

SARTORIUS

Moat: Single-Use Filing Entrenchment

Sartorius holds single-use bag and filter positions written into a very large number of approved regulatory filings, each requiring an 18 month notification process to change. That is not a commercial relationship a competitor can win on price or service quality. The position was built during process development years before commercial production, and persists through procurement reviews unchallenged.
SARTORIUS

Risk: Capital Cycle Exposure

A substantial part of the business sells equipment into new facility construction, and capacity utilisation running near 64% delays those orders while spare capacity exists across the industry. The consumable base provides a floor, though it does not grow through a capital pause. Vaccine-era overbuilding created an overhang that resolves on pipeline timelines nobody controls or reliably predicts.
DANAHER

Moat: Integrated Process Train Breadth

Danaher supplies across upstream culture, purification, filtration and analytics, which lets a customer qualify one supplier relationship rather than several separate ones. That breadth matters increasingly as manufacturers reduce supplier counts to cut their own qualification workload. Assembling comparable coverage requires positions across genuinely different technology families, which is why it has generally been acquired rather than developed internally.
DANAHER

Risk: Acquisition Integration Complexity

Breadth assembled through acquisition carries the risk that customers experience separate businesses rather than an integrated offer, which removes the reason they consolidated suppliers in the first place. Commercial teams organised around acquired product lines rather than around the customer's process undermine the proposition. The competitive advantage exists only where integration reached the customer-facing organisation.

Players Tracked

Prominent Players

Sartorius
Danaher
Thermo Fisher Scientific
Merck KGaA
Repligen

Other Key Players

Eppendorf
Getinge
Bio-Rad Laboratories
Corning
Entegris
Parker Hannifin
Solventum
Meissner Filtration Products
PBS Biotech
Applikon Biotechnology
Distek
ABEC
Pall Corporation
Asahi Kasei Bioprocess
Tosoh Bioscience

Recent Developments

MARCH 2025

Sartorius Expands Single-Use Assembly Manufacturing Capacity

Sartorius expanded single-use bag and assembly production capacity serving biologic manufacturers, an organic capacity expansion rather than any acquisition or joint venture. Single-use consumables recur on the customer's production schedule and are named in regulatory filings, which makes supply reliability considerably more commercially important than unit pricing.
Signal: Supply reliability matters far more than unit price when the only alternative requires a regulatory submission.
OCTOBER 2024

Indian Biosimilar Manufacturers Commission New Commercial Capacity

Several Indian biosimilar manufacturers commissioned commercial biologic production capacity built to regulated Western market standards, capacity development rather than any corporate transaction. New facilities buy complete equipment sets across a 46 month cycle and write their filings from scratch, which opens supplier selections that established sites never present.
Signal: A new plant writes a fresh filing, which is the only moment a supplier position opens.
JULY 2025

Repligen Broadens Continuous Processing Product Range

Repligen broadened its product range supporting continuous bioprocessing, where material moves through purification without being held in tanks between steps, an organic development rather than a merger. Continuous processing depends on real-time measurement good enough to release material on process data rather than on batch assay results.
Signal: Continuous processing sells process analytics as a prerequisite rather than as any kind of optional upgrade.

What Bioprocess Supply Costs

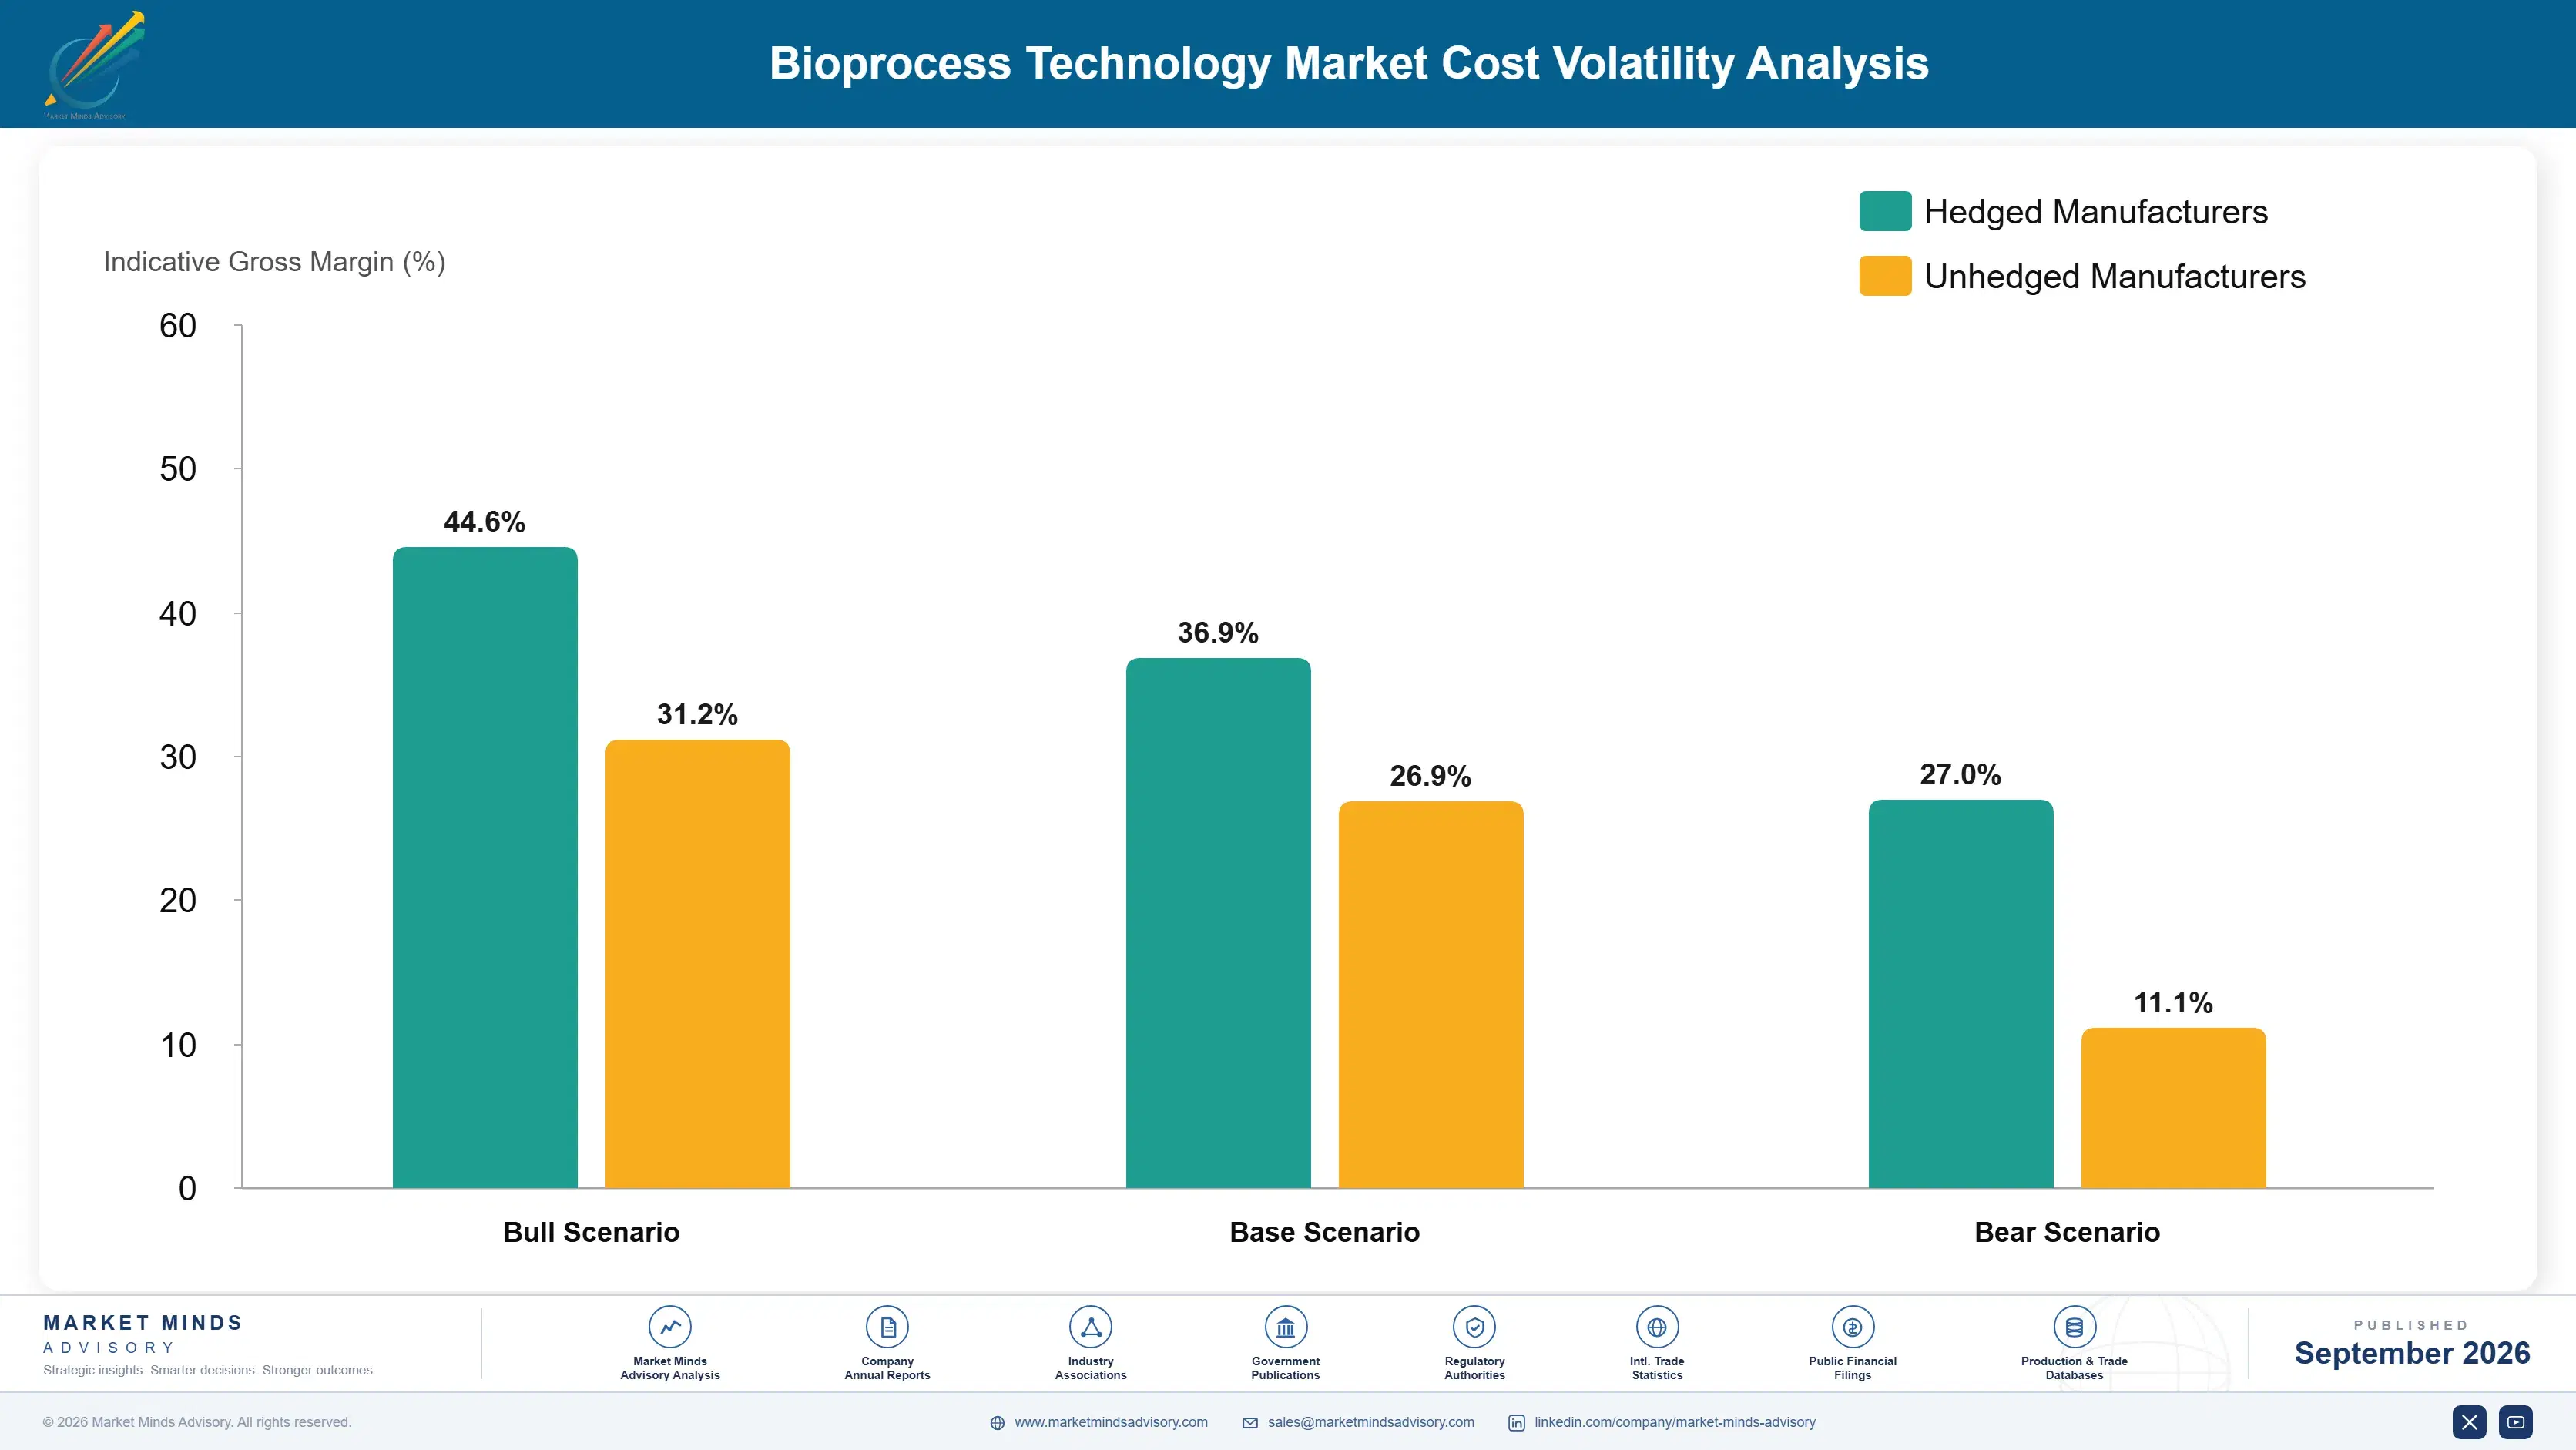
Polymer films and resins account for roughly 34% of single-use consumable cost, sourced from a small number of specialist converters qualified for biopharmaceutical contact. Chromatography resin and membrane media absorb around 22%, with agarose and specialist polymer supply concentrated in Sweden, Japan and the United States. Stainless steel and fabrication take about 16% of capital equipment cost, and validation documentation absorbs a further meaningful share.
Single-use film supply tightened severely during 2021 and 2022 when vaccine manufacturing consumed several years of demand within eighteen months, and lead times on qualified assemblies extended from weeks to many months. Sartorius Annual Report 2023 and Danaher Annual Report 2023 both record capacity constraints and subsequent inventory correction as principal operating factors. Manufacturers holding qualified dual sources managed the period considerably better than those on single supply.

The competitive disadvantage mechanism is film qualification rather than film price. A polymer film in contact with product is named in the filing like any other consumable, so a supplier without a qualified alternative source cannot switch when supply tightens regardless of what it costs. Exposure concentrates among smaller consumable suppliers with single converter relationships, while the largest firms qualified multiple sources after the shortage.
bioprocess-technology-market-cost-volatility-analysis-1789993835878

Qualify Second Film Sources Before They Are Needed

Polymer films run around 34% of single-use consumable cost and come from a small number of qualified converters. Qualifying an alternative source takes time and money against no immediate return, and it is the only thing that helps when supply tightens. Suppliers that qualified second sources after the vaccine-era shortage managed subsequent disruption considerably better than those that did not.

Hold Inventory Against Regulatory Change Lead Times

Switching an approved consumable requires a notification process running around 18 months, so a supply interruption cannot be solved by buying an equivalent product from somebody else. Inventory is therefore a regulatory necessity rather than a working capital inefficiency. Finance organisations treating bioprocess consumable stock as excess working capital are misreading what the inventory is actually there to cover.

Contract Resin Supply Across Multi-Year Horizons

Chromatography resin and membrane media absorb roughly 22% of consumable cost and come from concentrated specialist supply in a handful of countries. Multi-year contracted volume at agreed pricing removes exposure to a cost line that cannot be substituted quickly for regulatory reasons. Buying resin on annual arrangements leaves a filing-locked input exposed to whatever the market does next.

Portfolio Architecture for Margin Defence

Margin architecture separates on whether the product is named in a regulatory filing and whether it recurs. Stainless steel vessels and general fabrication earn least, since they are capital items competing on engineering and price against capable fabricators. Filtration hardware and standard media sit above. Single-use assemblies, chromatography resins and process analytical systems earn most, because each is filing-locked, recurring, or both at once.
The volume versus premium tension runs between capital and consumable rather than between product grades. Capital equipment wins the account and earns modest margin; consumables earn the return over the following decade. Suppliers running these as separate businesses with separate margin targets consistently protect hardware pricing at the cost of the specification, which is the wrong trade by a wide margin given consumables are 63% of revenue.

High-value pools concentrate where a development-stage decision becomes a commercial-stage annuity. Single-use assemblies and chromatography resins both work that way, and neither position is won at the point of purchase. Reaching them requires application and development support funded years before revenue, which is why the same five suppliers keep holding these positions across successive product generations.

Volume / Commodity-Adjacent

Stainless steel vessels, general fabrication, standard tubing and basic ancillary hardware, competing on engineering capability and price against capable contract fabricators. The ten point spread separates suppliers holding installed base service relationships from those selling equipment transactionally.
Gross Margin: 22% to 32%

Premium / Certified

Filtration systems, cell culture media and standard purification hardware, where qualification and documentation quality determine selection alongside performance. The twelve point spread tracks how much of a supplier's volume sits inside approved commercial filings rather than in clinical and development use.
Gross Margin: 38% to 50%

Sustainability / Regulatory / Next-Generation

Single-use assemblies, chromatography resins and process analytical systems, each named in regulatory filings and recurring on production schedules. The sixteen point spread reflects filing entrenchment depth, which varies enormously between suppliers and cannot be built quickly by anybody.
Gross Margin: 52% to 68%
bioprocess-technology-market-portfolio-architecture-1789993836383

High-value Sub-segments and Strategic Watch-out

Single-Use Bioreactors And Fluid Handling Assemblies

Grows at 13.1% as cleaning validation costs the same whatever the batch size, penalising the smaller batches that rising titres produce. The sixteen point spread reflects filing entrenchment. Changing an approved assembly requires around 18 months of regulatory notification work that nobody ever undertakes for purely commercial reasons.
Gross Margin: 52% to 68%

Process Analytical And Automation Systems

Grows at 11.4% as continuous processing and real-time release testing gradually replace conventional batch testing across newly built manufacturing facilities. The sixteen point spread reflects process integration depth. Established products rarely retrofit at all, because the approved regulatory filing describing them would have to change.
Gross Margin: 52% to 68%

Chromatography And Purification Equipment

Grows at 8.4% as antibody-drug conjugates and bispecific antibodies both add further purification stages well beyond anything that conventional monoclonal antibody processing ever required. The twelve point spread reflects resin position depth. Resin supply itself remains concentrated among a very small number of specialist producers worldwide.
Gross Margin: 38% to 50%

Stainless Steel Bioreactor Systems

Grows at 3.9%, slowest of the six classes, as single-use displaces it everywhere batch volumes are small enough to make validation uneconomic. The ten point spread reflects service attachment. Large-volume established products keep it commercially viable for the time being, though not indefinitely as titres keep climbing.
Gross Margin: 22% to 32%

Why Filing Entries Persist

The annuity here is unusually literal. A consumable named in an approved regulatory filing is reordered for as long as the product is manufactured, and changing it requires a notification process running around 18 months that nobody undertakes for commercial reasons. Biologic products stay on the market for well over a decade. The supplier selected during process development holds a position outlasting most commercial relationships anywhere.
Stickiness varies sharply by where the product sits in the process. A single-use bag or filter in contact with the drug is fully filing-locked. A chromatography resin is similarly fixed, because changing it alters the impurity profile. Automation software and ancillary hardware are far more substitutable, since they touch neither the product nor the approved process description. Suppliers frequently price these categories as though they carried equal defensibility, which they plainly do not.

The buyer profile has shifted from plant engineering toward process development scientists, and that changes what wins. An engineering organisation evaluated equipment on specification and price at purchase. A development scientist selects during scale-up on whether the supplier helped solve a problem, long before procurement is involved. Suppliers organised around the purchasing conversation arrive at a decision made elsewhere.
bioprocess-technology-market-end-use-penetration-index-1789993836874

What Decides Bioprocess Position

These are among the four positions where our research anticipates prominent divergence between winners and laggards over the coming forecast period. Each is grounded in the demand model, the regulatory perimeter, and the announced capacity pipeline.
01 / DEVELOPMENT STAGE ENGAGEMENT

Win The Filing, Not The Purchase Order

A consumable named in an approved regulatory filing requires a notification process running around 18 months to change, which no manufacturing organisation ever undertakes simply to save money on a filter or a bag. That selection decision is made during process development, years before commercial volume exists and at the precise point where the customer is least sensitive to price. Suppliers competing hard at commercial launch are competing for a socket that closed a very long time before they arrived.
02 / CAPITAL CONSUMABLE PRICING

Trade Hardware Margin For Recurring Volume

Consumables represent roughly 63% of supplier revenue and recur on production schedules the customer cannot vary at will, while the equipment itself sells only once into any given facility. Pricing installed hardware to win the specification rather than to earn margin on the machine is straightforward arithmetic once that revenue ratio is properly understood. The obstacle is organisational rather than analytical, since equipment and consumable units frequently carry separate margin targets that prevent the necessary trade being made at all.
03 / NEW CAPACITY COVERAGE

Be Present While Plants Are Designed

India compounds at 14.2% and Gulf programmes are funding complete new facilities rather than expansions, and a new plant buys every equipment category at once across a construction cycle running around 46 months. That is a fundamentally different sales motion from serving an established manufacturing site where the approved vendor lists closed years ago. Reaching those projects requires supplier presence during the engineering and design phase rather than arriving at the point when the purchase order is finally issued to somebody else.
04 / UTILISATION CYCLE RESILIENCE

Stay Valuable Through The Capital Pause

Biologic manufacturing capacity runs at roughly 64% utilisation worldwide, which delays new capital equipment orders for as long as spare capacity exists but leaves consumable demand from continuing production entirely untouched. Suppliers organised entirely around capital equipment sales experience that period as a genuine downturn, while suppliers organised around consumables see a stable recurring base sitting underneath it. Commercial organisations that disappear during a capital pause find it considerably harder to return once plant construction eventually resumes across the industry.

Engagement Snapshot From the Field

A live engagement with an industry participant carrying material or product regulatory and market exposure ahead of a defining policy shift, showing how our research translates into a defensible multi-year portfolio strategy.
MARKET MINDS ADVISORY · CLIENT ENGAGEMENT SUMMARY
Bioprocess Technology Producer Strategic Portfolio Review and Transition Roadmap 2026·Investment Scenario on Bioprocess Technology Exposure Evaluation 2025-26
CLIENT PROFILE
A mid-sized European bioprocess consumables supplier with filtration and single-use assembly product lines, holding positions in clinical-stage processes but converting relatively few of them into approved commercial filings. Revenue was growing with the industry but market share was not. The commercial organisation was structured around regional sales territories with targets set on quarterly revenue rather than on filing conversion.
STRATEGIC CHALLENGE
Management believed the problem was pricing at commercial launch, where larger competitors were assumed to be discounting. Sales leadership wanted authority to match. Nobody had examined whether the accounts being lost had ever been genuinely winnable at that stage, or whether the decision had already been made during process development years earlier.
MMA APPROACH
MMA traced a sample of lost commercial accounts back to the development stage decision and established when the supplier selection had actually been fixed in each case. We assessed the client's development-stage support coverage against competitors, and modelled the revenue value of a filing entry over a typical product life. The work drew on 47 expert interviews conducted in Q4 2025 with manufacturers and suppliers.
KEY FINDINGS
  1. Around 8 in 10 lost commercial accounts had a competitor consumable already named in the filing before the client's sales organisation had engaged at all.
  2. Development-stage technical support headcount ran roughly 3 times lower than the nearest larger competitor, measured per active clinical programme in the territory.
  3. A single filing entry generated revenue over the product life worth many multiples of the initial development-stage support cost (client-reported, unverified by MMA).
  4. Regional quarterly revenue targets actively discouraged the development-stage work entirely, since that effort produced no measurable revenue within any period the organisation actually tracked.
CLIENT PROFILE
A mid-sized European bioprocess consumables supplier with filtration and single-use assembly product lines, holding positions in clinical-stage processes but converting relatively few of them into approved commercial filings. Revenue was growing with the industry but market share was not. The commercial organisation was structured around regional sales territories with targets set on quarterly revenue rather than on filing conversion.
STRATEGIC CHALLENGE
Management believed the problem was pricing at commercial launch, where larger competitors were assumed to be discounting. Sales leadership wanted authority to match. Nobody had examined whether the accounts being lost had ever been genuinely winnable at that stage, or whether the decision had already been made during process development years earlier.
MMA APPROACH
MMA traced a sample of lost commercial accounts back to the development stage decision and established when the supplier selection had actually been fixed in each case. We assessed the client's development-stage support coverage against competitors, and modelled the revenue value of a filing entry over a typical product life. The work drew on 47 expert interviews conducted in Q4 2025 with manufacturers and suppliers.
KEY FINDINGS
  1. Around 8 in 10 lost commercial accounts had a competitor consumable already named in the filing before the client's sales organisation had engaged at all.
  2. Development-stage technical support headcount ran roughly 3 times lower than the nearest larger competitor, measured per active clinical programme in the territory.
  3. A single filing entry generated revenue over the product life worth many multiples of the initial development-stage support cost (client-reported, unverified by MMA).
  4. Regional quarterly revenue targets actively discouraged the development-stage work entirely, since that effort produced no measurable revenue within any period the organisation actually tracked.
RECOMMENDED STRATEGY
Phase 1: Phase one: build development-stage technical support coverage measured against active clinical programmes in each territory rather than against current territory revenue. Phase 2: Phase two: change commercial targets to measure filing entries won, since quarterly revenue targets penalise exactly the work that matters. Phase 3: Phase three: stop discounting at commercial launch on accounts where a competitor consumable is already named in the approved filing.
OUTCOME
The supplier redeployed technical resource toward development-stage programmes and changed how the commercial organisation was measured (client-reported, unverified by MMA). Filing entries won rose over the following year while launch-stage discounting fell. Management stopped treating commercial-stage losses as a pricing problem, which was the change that mattered most.

Frequently Asked Questions

Foundational context covering the market sizes, CAGR, scope, country, region and competition that inform every finding below. This section is provided to cover basics and most often pre-purchase conversations, answered from the MMA Primary Research Dataset.

What is the current size of the Bioprocess Technology Market?

Global value reaches USD 28.7 billion in 2026, measured as bioprocess equipment and consumable revenue across six classes. The 2025 base is USD 26.4 billion.

How large will the Bioprocess Technology Market be by 2036?

The market reaches USD 66.1 billion by 2036, an increase of USD 37.4 billion across the forecast period. That represents 2.30 times expansion from the 2026 base.

What is the CAGR for the Bioprocess Technology Market 2026 to 2036?

The base case runs at 8.7% annually, with a bull case at 10.0% if cell and gene therapy manufacturing reaches commercial scale and a bear case at 7.4% if titre improvement continues outrunning demand growth.

Which segment is growing fastest?

Single-use bioreactors and fluid handling assemblies grow at 13.1%, half again the market rate of 8.7%. Cleaning validation costs the same whatever the batch size, which penalises smaller batches.

Who are the major companies in the Bioprocess Technology Market?

Sartorius, Danaher, Thermo Fisher Scientific, Merck KGaA and Repligen lead on equipment and consumable revenue, together holding 48%. Eppendorf, Getinge and Corning hold smaller positions.

Which country is growing fastest?

India leads at 14.2%, on biosimilar and vaccine manufacturing capacity being built now to regulated Western market standards. China and South Korea follow closely behind.

Report Segmentation Architecture

The full report scope spans multiple orthogonal segmentation dimensions, with cross-tabulated demand data provided for each dimension pair. Coverage extends further to regional breakdowns, trend trajectories, and the competitive detail needed to support segment-level decision-making.

By Equipment And Consumable Class

  • Single-Use Bioreactors And Fluid Handling Assemblies
  • Process Analytical And Automation Systems
  • Chromatography And Purification Equipment
  • Filtration Systems And Membranes
  • Cell Culture Media And Reagents
  • Stainless Steel Bioreactor Systems

By End-Use Industry

  • Monoclonal Antibody Manufacturing
  • Vaccine Production
  • Cell And Gene Therapy Manufacturing
  • Biosimilar Production
  • Recombinant Protein And Enzyme Manufacturing
  • Plasma And Blood Product Processing

By Commercial Dimension

  • Originator Pharmaceutical Manufacturers
  • Contract Development And Manufacturing Organisations
  • Public Health And Institutional Producers
  • Direct Supplier Sales
  • Distributor And Channel Supply
  • Development Stage Technical Engagement

By Region

  • North America
  • Western Europe
  • East Asia
  • South Asia and Pacific
  • Latin America
  • Middle East and Africa
  • Eastern Europe

Scope, Methodology, and Coverage

Every figure in this report is reproducible from documented input assumptions. The scope below maps the historical period, the forecast horizon, the segmentation dimensions, and the countries covered, alongside the underlying primary and qualitative methodology.
Historical Period
2020 to 2025
Forecast Period
2026 to 2036
Base Year
2025 (USD billions; MMA Primary Research Dataset, September 2026)
Market Definition
This report covers bioprocess technology by equipment and consumable class: single-use bioreactors and fluid handling assemblies, stainless steel bioreactor systems, chromatography and purification equipment, filtration systems and membranes, cell culture media and reagents, and process analytical and automation systems. It excludes finished biologic drugs, contract manufacturing services, fill-finish and packaging equipment, laboratory-scale research instrumentation, and pharmaceutical small molecule process equipment.
Quantitative Units
USD millions, equipment and consumable revenue basis; installed bioreactor capacity in litres; cell culture titre in grams per litre; capacity utilisation as a percentage; regulatory change notification periods in months.
Segmentation Dimensions
Equipment and consumable class; therapeutic modality and end-use; commercial customer type and channel; geography across seven regions.
Regions Covered
North America, Western Europe, East Asia, South Asia and Pacific, Latin America, Middle East and Africa, Eastern Europe
Countries Covered
United States, Canada, Germany, Switzerland, Ireland, Denmark, Belgium, France, United Kingdom, China, South Korea, Japan, Singapore, India, Australia, Brazil, Argentina, Poland, Saudi Arabia, South Africa.
Key Companies Profiled
Sartorius, Danaher, Thermo Fisher Scientific, Merck KGaA, Repligen, Eppendorf, Getinge, Bio-Rad Laboratories, Corning, Entegris, Parker Hannifin, Meissner Filtration Products, Pall Corporation, Asahi Kasei Bioprocess, Tosoh Bioscience.
Quantitative Methodology
Primary survey, n=3,800 respondents, Q4 2025, six countries; demand-side model with trade association cross-validation
Qualitative Methodology
47 expert interviews, Q4 2025; applied to validate demand model assumptions, identify emerging dynamics, and assess competitive positioning
Report Format
PDF and XLSX data workbook (Word format preview document)
Publisher
Market Minds Advisory
Report Code
MMA-2026-HLT-651
Published
September 2026
Contact
sales@marketmindsadvisory.com | www.marketmindsadvisory.com

Purchase the full Bioprocess Technology Market Report (2026 to 2036).

This report sizes the global bioprocess technology market from 2026 to 2036 across six equipment and consumable classes, six therapeutic modalities and seven regions. It explains why a tenfold rise in cell culture titre broke the relationship between biologic demand and bioreactor volume, and why consumables at 63% of supplier revenue changed the economics of the industry. Regulatory filing lock-in is analysed as the mechanism that makes supplier positions durable, with the 18 month change notification period quantified against its commercial consequences. Cost composition is sourced to company annual reports. Regional analysis explains why East Asia leads at 27% of spend.
Six equipment and consumable classes sized to 2036
Titre and volume decoupling quantified across two decades
Regulatory filing lock-in analysed as competitive mechanism
Twenty named suppliers assessed on bioprocess revenue
Four revenue levers with quantified commercial impact
Anonymised consumables supplier commercial strategy engagement included

Built For The People Who Decide

From boardroom strategy to bench-side execution, this report is read cover-to-cover by leaders shaping the next decade of their industry, turning demand scenarios, market dynamics and valuation benchmarks into decisions.
CXOs/ Presidents/ VPs/ Managers
M&A and Corporate Development
Strategy Teams and R&D Heads
Procurement and Product Directors
Regulatory and Compliance Leaders
Investor Relations and Equity Analysts