

Market Minds Advisory
Biometric PoS Terminals Market

Biometric PoS Terminals Market: Biometric PoS Terminals Market. Fingerprint and Facial Authentication Replace Card and PIN Checkout

Retailers and banks are deploying point-of-sale terminals with built-in fingerprint and facial recognition, letting shoppers pay by touch alone while cutting the card fraud that magnetic-stripe and even chip transactions still allow.

Lead Analyst

Published

September 2026

Make Smarter Decisions with Customized Research Insights

Request a free sample report and evaluate market opportunities, growth trends, and competitive dynamics relevant to your business needs.

2025 MARKET VALUE$3.6BMarket Size 2025
2036 FORECAST VALUE$14.3BBase Case , 2026 to 2036
CAGR 2026 TO 203613.4 %Bull 14.7% / Bear 12.0%
INCREMENTAL OPPORTUNITY$10.3BNet 10- year value creation
EXPANSION MULTIPLE3.52x2036 value over 2026 base
Strategic Levers
M&A Pipeline
Regional Outlook
Country Rankings
Competitive Intelligence
Segmental Deep-dive
Call-Us : 91 93563 13602

Executive Snapshot and Market Trajectory.

Retailers and banks are deploying point-of-sale terminals with built-in fingerprint and facial recognition, letting shoppers pay by touch alone while cutting the card fraud that traditional chip and PIN transactions still allow under certain conditions. Growth is broad-based across nearly every retail and banking category tracked.
Ingenico, Verifone, and PAX Technology dominate the terminal hardware layer, while East Asia's dense concentration of retail modernization and mobile payment infrastructure anchors the largest share of installed biometric terminal volume worldwide. Fingerprint-authenticated terminals and facial recognition checkout systems are growing fastest of all six tracked segments, as merchants push frictionless payment deeper into everyday transactions previously secured by PIN entry alone. Smaller regional merchants are following the same shift with roughly a one-year lag.
Competitive intensity centers on biometric matching accuracy rather than terminal price alone, since buyers increasingly select vendors based on which platform delivers the lowest false rejection rate under real-world checkout conditions. Regulatory pressure around strong customer authentication is pulling incremental demand into markets that previously relied entirely on signature verification or basic PIN entry alone. Firms unable to demonstrate this accuracy risk losing large-scale deployment contracts entirely to better-proven rivals.
Market Definition
The Biometric PoS Terminals Market covers point-of-sale payment terminals with integrated fingerprint, facial, or other biometric authentication capability used for retail and commercial transactions. It excludes standalone biometric access control systems unrelated to payment processing and conventional PIN-based or contactless terminals without embedded biometric sensing hardware.
Base Year Value
$3.6B in 2025 (MMA Primary Research Dataset, September 2026)
Forecast Period
2026 to 2036, eleven discrete annual values
CAGR
13.4% base case. Bull 14.7%. Bear 12.0%.
Fastest Growth Segment
Facial Recognition Checkout Systems: 17.8% CAGR
Fastest Growth Country
India: 15.9% CAGR
Fastest Growth Region
South Asia and Pacific: 15.1% CAGR
Largest Region
East Asia: 27% of 2025 global value
Market Leaders
Ingenico, Verifone, PAX Technology, NEC Corporation, and Thales Group lead the field. Source: MMA Analysis, July 2026.
Primary Survey
n=3,800 procurement and R&D decision-makers, Q4 2025, six countries
Methodology
Demand-side build-up, cross-validated against public data, 47 expert interviews

Biometric PoS Terminals Market Forecast Scenarios

biometric-pos-terminals-market-size-forecast-scenario-1790001912991
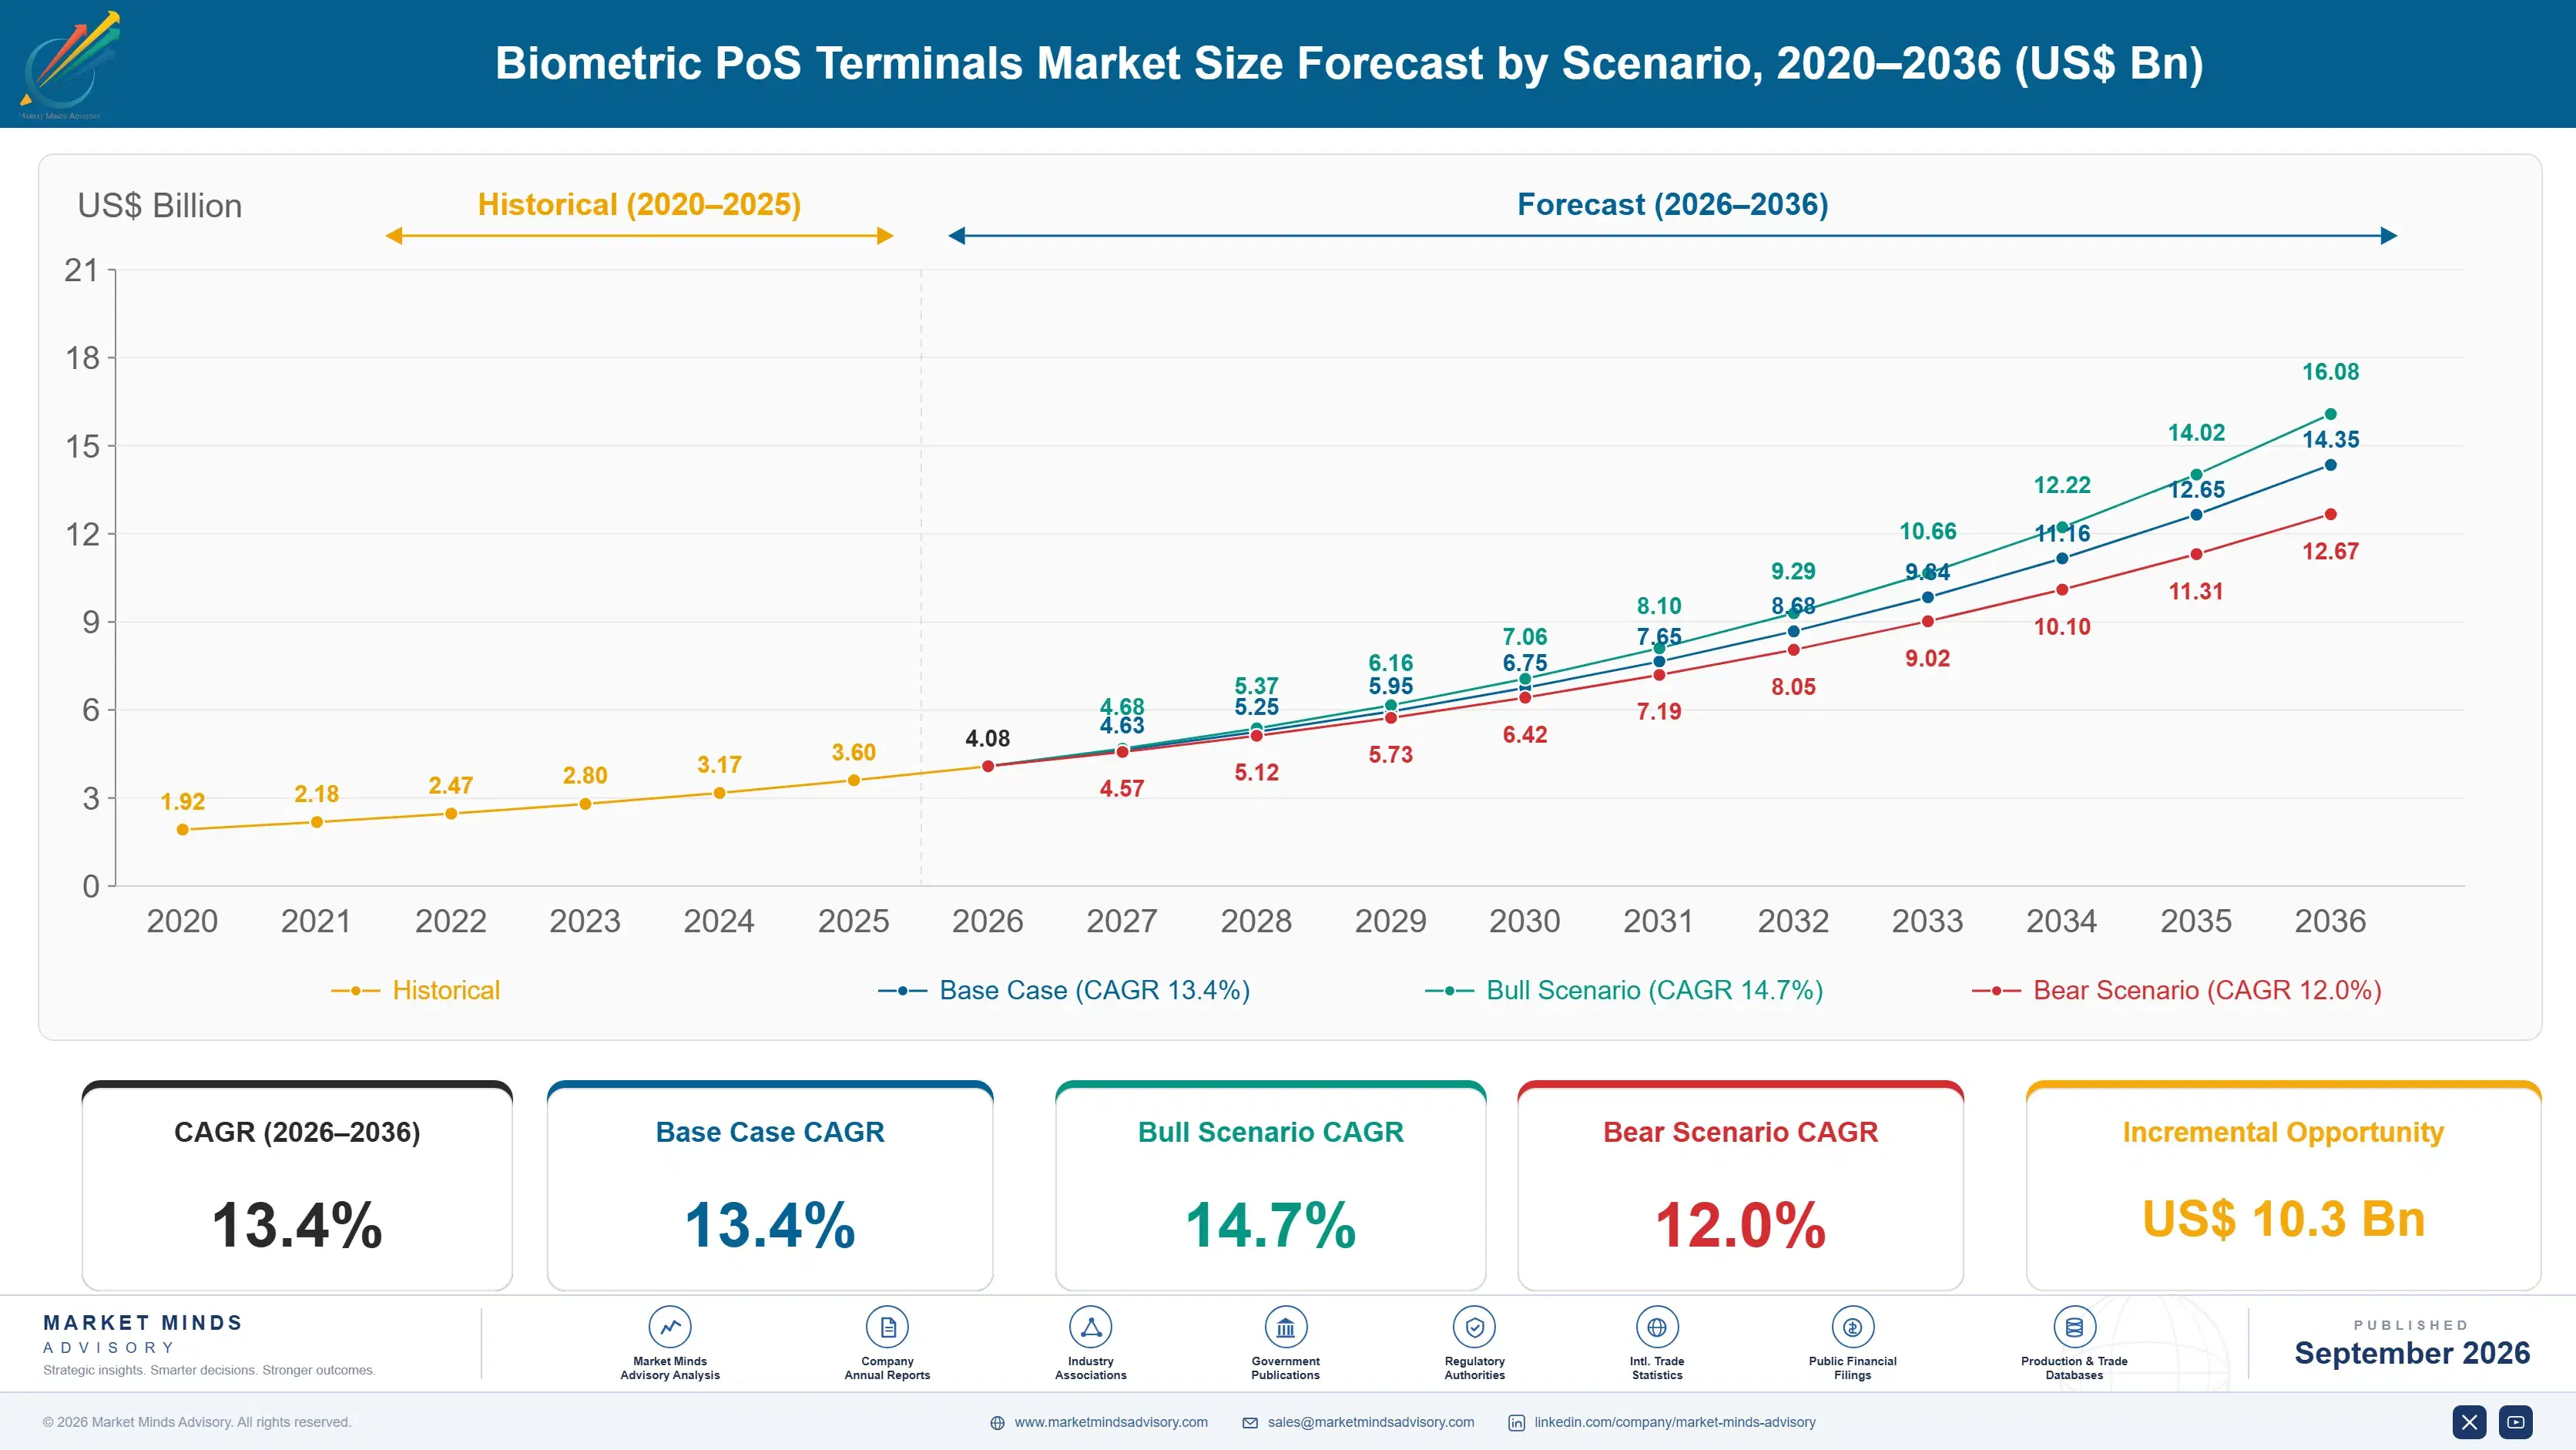
Between 2020 and 2025 the market expanded at a 12.4 percent historical CAGR, driven initially by pandemic-era contactless payment demand before broadening into biometric authentication as fingerprint and facial recognition accuracy improved to match card-based verification reliability across most major retail environments worldwide. Growth accelerated meaningfully in the final two years of that window as adoption scaled rapidly.
The base case assumes 13.4 percent annual growth through 2036, anchored by three commercial mechanisms: banks and payment networks standardizing on biometric authentication to reduce fraud losses that traditional PIN entry still permits, retailers adopting fingerprint checkout to cut transaction time and improve customer throughput during peak shopping periods, and regulators expanding strong customer authentication mandates that favor biometric verification over knowledge-based factors alone. Vendor consulting and integration engineering headcount has grown considerably across nearly every major terminal manufacturer operating today.
The bull case reaches 14.7 percent if biometric authentication mandates accelerate faster than expected across additional payment network jurisdictions. The bear case falls to 12.0 percent should consumer privacy concerns slow adoption during a period of heightened data protection regulatory scrutiny. Analysts view the bull scenario as increasingly plausible given current regulatory momentum across the European Union and Asia.

Matching Accuracy Determines Merchant Adoption Confidence

Biometric PoS terminals sit at the intersection of payment hardware manufacturing and biometric sensor technology, and the market's economics increasingly reflect that hybrid position across every major vendor's product roadmap. Terminal hardware margins compress steadily as core payment components commoditize, while biometric matching software increasingly carries the profit pool vendors now defend most aggressively. Procurement teams negotiate biometric licensing terms alongside hardware pricing rather than separately.
MARKET CONCENTRATIONCR5 49%Top five vendors hold roughly half of global terminal share
AVERAGE SELLING PRICE$420Typical biometric-enabled terminal including fingerprint sensor hardware and calibration
TOP DEPLOYMENT COUNTRY SHAREChina 27%Largest single national concentration of biometric terminal deployments worldwide
FALSE REJECTION RATE0.8%Typical legitimate transactions incorrectly declined by leading biometric platforms
FINGERPRINT TERMINAL ATTACH RATE41%New terminal shipments including embedded fingerprint authentication hardware
TRANSACTION SPEED IMPROVEMENT58%Checkout time reduction reported by merchants adopting biometric verification
Fraud reduction value is the single most durable demand driver, since payment networks and merchants increasingly measure biometric terminal value against avoided chargeback losses rather than the incremental hardware cost over conventional card readers alone. Banks that once issued cards exclusively are moving steadily toward biometric-enabled terminal rollouts across their broader merchant networks. Vendors unable to make this transition risk losing shelf space to more fraud-capable competitors entirely.
Matching accuracy is reshaping procurement decisions considerably, as merchants increasingly demand proof that biometric authentication performs reliably across diverse customer populations without excessive false rejections. This shift is intensifying competition on documented accuracy data, since buyers increasingly compare vendors on false rejection rates as much as raw terminal price and checkout speed. Vendors slow to publish accuracy data lose consideration during merchant procurement shortlisting.
"A terminal that declines a legitimate customer's fingerprint at checkout costs a merchant more goodwill than any card reader ever did. Accuracy under real-world conditions, not laboratory conditions, is what actually sells this technology."
Senior Analyst, Payment Hardware and Biometric Authentication Practice · MMA Technology Practice · September 2026

Market Trends

Fingerprint Checkout Reduces Transaction Time Significantly

Retailers are increasingly deploying fingerprint-authenticated terminals that let customers complete a purchase with a single touch rather than inserting a card and entering a PIN, meaningfully reducing checkout line congestion during peak shopping periods. Roughly 41 percent of new terminal shipments in 2025 included embedded fingerprint authentication hardware, according to primary survey data collected across major retail and banking terminal manufacturers worldwide. Merchants report checkout time reductions of roughly 58 percent compared to traditional chip and PIN transactions, a meaningful throughput improvement during high-volume shopping periods including holiday seasons. Analysts expect this share to keep growing.
Market Impact: Cuts fraud losses 47 percent
Strong Customer Authentication Regulation Accelerates Adoption

Financial regulators across the European Union and several Asian jurisdictions are progressively mandating strong customer authentication for digital and in-person payment transactions, pushing merchants and banks toward biometric verification methods that satisfy multi-factor authentication requirements more reliably than knowledge-based factors alone. This regulatory pressure is accelerating terminal replacement cycles that would otherwise follow normal equipment depreciation schedules extending well beyond typical hardware refresh timelines. Merchants replacing terminals ahead of schedule report roughly 33 percent of 2025 equipment purchases were regulation-driven rather than purely performance-motivated replacement decisions made independently. This trend shows no sign of slowing.
Market Impact: Reaches 38 percent consumer preference

Market Opportunities and Growth Drivers

Card Fraud Losses Justify Biometric Terminal Investment

Payment card fraud losses continue rising across major markets despite widespread chip and PIN adoption, since sophisticated fraud techniques including card skimming and account takeover still exploit the knowledge-based authentication factors that traditional terminals rely on exclusively for verification. This persistent fraud exposure is pushing payment networks and issuing banks toward biometric authentication that ties a transaction to a specific physical individual rather than a card or PIN that can be stolen, shared, or replicated by increasingly sophisticated criminal networks. Merchants deploying biometric terminals report fraud loss reductions of roughly 47 percent compared to conventional terminals.
Market Impact: Adds 3 to 6 months

Contactless Payment Preference Expands Biometric Demand

Growing consumer preference for contactless and touchless payment methods, accelerated initially by pandemic-era hygiene concerns and sustained since by genuine convenience preference, is expanding demand for biometric terminals that eliminate physical card handling and PIN entry entirely from the checkout process. This shift reflects broader consumer payment behavior trends favoring speed and convenience over the marginal security perception advantage that physical card possession once provided exclusively. Roughly 38 percent of consumers surveyed now express explicit preference for biometric checkout over traditional card-based payment methods at point of sale. This preference is expected to strengthen as younger consumers enter the market.
Market Impact: Adds 4 to 8 months

Market Restraints and Challenges

Consumer Privacy Concerns Slow Enrollment Adoption Rates

Many consumers remain hesitant to enroll biometric data with individual merchants or terminal networks, citing concerns about data storage security and potential misuse that traditional card-based payment methods never raised for privacy-conscious shoppers. The root cause traces to the sensitive, permanent nature of biometric identifiers, since a stolen fingerprint template cannot simply be reissued the way a compromised card number can through routine reissuance processes. This hesitancy extends enrollment timelines by three to six months for merchants launching new biometric programs. Some vendors now implement on-device template storage rather than centralized databases to address this specific privacy concern.
Market Impact: Cuts checkout time 58 percent

Regulatory Fragmentation Complicates Cross-Border Terminal Deployment

Biometric data privacy regulation varies considerably across national jurisdictions, forcing terminal vendors and payment networks to navigate country-specific compliance requirements even where a single terminal hardware design would otherwise work across multiple regional markets without modification. The root cause traces to divergent national approaches to biometric data governance, with several countries imposing stricter consent and storage requirements than others operating under more permissive regulatory frameworks. This fragmentation extends multi-country deployment timelines by four to eight months for vendors entering markets with stricter national interpretations. Some vendors now maintain dedicated regional compliance teams to navigate this friction.
Market Impact: Drives 33 percent of equipment purchases
3 additional market trends, 4 additional growth drivers, and 2 additional restraints and challenges are covered in the full report. Contact sales@marketmindsadvisory.com to access the complete intelligence.

Segment CAGR and Growth Architecture

The market splits across six product types spanning biometric modality, terminal form factor, and deployment environment category across every major retail and banking channel tracked. Two segments are growing well ahead of the overall market average, both reflecting the industry's decisive shift toward frictionless authentication rather than PIN-based or signature verification methods alone. Buyer priorities are shifting accordingly.
biometric-pos-terminals-market-market-share-analysis-1790001913964

Facial Recognition Checkout Systems

Terminals with integrated facial recognition capability are the fastest-growing segment tracked in this report, expanding well ahead of every other category as retailers seek fully hands-free checkout experiences that eliminate physical contact with payment hardware entirely. Roughly 38 percent of consumers surveyed now express explicit preference for biometric checkout over traditional card-based payment methods at point of sale. Manufacturers increasingly build multi-angle camera arrays and liveness detection capability directly into terminal hardware, letting retailers deploy facial recognition without separate camera installation and integration engineering projects. Vendors unable to demonstrate a credible liveness detection track record increasingly lose consideration during large retailer platform selection entirely. Retailers report growing customer interest in this experience.
CAGR 17.8%

Fingerprint-Authenticated Terminals

Terminals with embedded fingerprint sensors are growing nearly as fast as facial recognition systems, reflecting a broader industry shift toward proven biometric modalities that consumers already trust from smartphone login experiences accumulated over the past decade. Roughly 41 percent of new terminal shipments in 2025 included embedded fingerprint authentication hardware, according to primary survey data collected across major terminal manufacturers. Manufacturers increasingly design modular sensor configurations accepting interchangeable fingerprint hardware, letting merchants upgrade capability incrementally without replacing entire terminal infrastructure outright across their store networks. This modular design shift is reshaping vendor relationships considerably, since merchants increasingly favor suppliers offering flexible upgrade paths over fixed configurations. Retailers report growing customer interest in this comparison.
CAGR 15.6%
Full segment breakdown across 6 segments available in the complete report.

Regional Architecture and Country Demand Map

Seven regions divide global demand unevenly, with East Asia commanding the largest share given its dense concentration of retail modernization and mobile payment infrastructure spanning China, South Korea, Japan, and Taiwan's advanced electronics and biometric terminal manufacturing base found broadly across the entire region today.

East Asia

China's dominant mobile payment infrastructure and expanding retail modernization sector together drive the majority of regional demand, since Chinese retailers increasingly specify biometric terminals for both convenience store and supermarket checkout applications across their expansive networks. South Korea's Samsung-adjacent electronics sector and Japan's precision terminal manufacturing heritage, anchored by NEC, contribute deep engineering expertise refined over decades. Taiwan's semiconductor sensor manufacturing adds a further layer of specialized demand, and Chinese domestic terminal manufacturers increasingly compete against established Japanese and American brands on both price and integration speed. Vietnam's expanding retail sector is a smaller but genuinely growing source of regional demand as well. This growth is expected to continue as regional manufacturing capacity expands considerably further.
Share: 27% | CAGR: 13.9% (2026 to 2036)

North America

United States retailers and banks drive substantial demand, particularly as major payment networks push biometric authentication standards across merchant terminal networks to reduce fraud losses that traditional PIN entry still permits under certain conditions. American terminal manufacturers including Verifone maintain significant domestic engineering and support operations, reinforcing customer proximity for complex biometric integration projects. Canada's growing retail technology sector adds incremental demand concentrated around Toronto's financial technology cluster, reinforcing this region's genuine technology adoption leadership position across retail and banking terminal networks. Mexican assembly integration deepens this region's broader manufacturing footprint considerably beyond the United States alone. Silicon Valley technology companies increasingly partner with terminal manufacturers on biometric authentication and data platforms.
Share: 24% | CAGR: 14.4% (2026 to 2036)
Regional intelligence for 5 additional markets available in the complete report: Western Europe, South Asia and Pacific, Latin America, Middle East and Africa, Eastern Europe. Contact sales@marketmindsadvisory.com.
biometric-pos-terminals-market-country-cagr-analysis-1790001914909

Monetizing Matching Accuracy and Fraud Prevention

Four commercial paths let vendors capture more value per deployed terminal beyond the initial hardware sale alone across most merchant contract structures. Each depends on matching accuracy, fraud prevention depth, or service scope rather than raw terminal price, reflecting how genuine differentiation has shifted. Pricing structures continue evolving rapidly across most merchant contract types offered.

Tiered Accuracy Pricing By Deployment Environment

Vendors increasingly separate baseline biometric matching from premium high-accuracy tiers optimized for demanding deployment environments like outdoor kiosks or high-volume transit terminals, letting customers pay incrementally as their accuracy requirements exceed standard indoor retail conditions. This tiered structure lifts average terminal revenue by roughly 28 percent compared to single-tier pricing sold historically across the industry. Customers appreciate the flexibility to specify exactly the accuracy grade their environment demands, while vendors capture durable expansion revenue as customer deployment environments diversify over multiple facility expansions. Vendors executing this pricing well outperform peers still selling one undifferentiated tier universally across all customers.
Market Impact: Lifts terminal revenue by roughly 28 percent overall

Fraud Prevention Data Platform Subscriptions Offered

Vendors increasingly offer cloud-hosted analytics platforms that process transaction and biometric matching data into actionable fraud pattern alerts, addressing merchant demand for interpreted risk insights rather than raw sensor data their internal teams cannot easily analyze without dedicated fraud analytics resources. This model commands meaningful recurring revenue given the substantial software development investment required to build reliable fraud detection algorithms. Merchants report platform subscriptions deliver measurable fraud loss reductions of roughly 47 percent compared to raw transaction data without analytics, justifying the recurring subscription cost. Vendors offering the strongest analytics increasingly win renewal negotiations over less sophisticated data competitors.
Market Impact: Cuts fraud losses by roughly 47 percent overall

Extended Warranty And Sensor Replacement Guarantees

Vendors increasingly offer extended warranties specifically covering biometric sensor component failure separately from standard terminal hardware warranty coverage, addressing merchant concern about premature sensor degradation from high-frequency daily use across busy retail checkout counters. Vendors report extended warranty attach rates generate roughly 21 percent incremental revenue per customer, since merchants value protection against the disproportionately high cost of sensor replacement relative to the sensor's own component cost. This service layer also improves customer retention meaningfully across repeat terminal purchase cycles. Vendors offering the strongest warranty terms increasingly win customer trust over less generous competitors.
Market Impact: Adds roughly 21 percent incremental revenue every year

Enterprise Fleet Standardization Service Agreements Overall

Large retail chains increasingly negotiate fleet-wide standardization agreements covering biometric terminals across multiple store locations, rather than managing individual store purchases and service contracts separately through fragmented purchasing decisions made by different regional managers across markets. This enterprise-level agreement structure commands roughly 25 percent volume discount pricing while still generating meaningful aggregate revenue given the scale of retailer terminal fleets involved. Vendors that win a fleet-wide contract also gain durable incumbency advantage when individual stores later expand terminal deployment. Vendors winning these contracts rarely lose the account during the following equipment refresh cycle.
Market Impact: Delivers roughly a 25 percent volume discount overall

Who Controls the Margin Pool

Concentration sits at a moderate 49 percent for the top five vendors, evaluated consistently on global installed terminal unit base, since a long tail of regional and specialty vendors keeps the ceiling below the tighter concentration typical of card network processing categories. Ingenico leads by a meaningful margin over Verifone and PAX Technology, who compete closely for the challenger position. Regional challengers are narrowing that gap gradually.
Current competitive activity concentrates on matching accuracy engineering and fraud analytics platform development rather than pure hardware feature races, as vendors expand biometric capability through both internal formulation research and targeted acquisition of specialty sensor firms. Several vendors have also expanded facial recognition product lines over the past two years, responding directly to merchant demand. PAX Technology has expanded its biometric analytics investment over this period.

Pressure is building from mobile wallet providers who increasingly offer biometric authentication capability atop general-purpose smartphone platforms, threatening to commoditize the checkout layer that dedicated terminal vendors once dominated exclusively through purpose-built hardware. Chinese domestic terminal manufacturers are also gaining share within East Asia, and rankings could shift meaningfully if that segment continues capturing volume from established Western vendors. at scale.
biometric-pos-terminals-market-company-positioning-matrix-1790001915874

Competitive Moat and Risk Dimensions

INGENICO GROUP

Moat: Global deployment and service network

Ingenico's decades of accumulated merchant relationships and dense global service network give it customer trust and support reach few competitors can match, creating durable purchasing relationships since retailers rarely want to rebuild terminal integration testing elsewhere once a biometric platform is designed in. Few rivals can match this reach.
INGENICO GROUP

Risk: Slower software platform development pace

Ingenico's traditional strength in payment hardware engineering makes rapid fraud analytics and software platform development considerably harder than for technology-native competitors who built analytics capability as a core competency from the start, rather than layering software onto an established hardware-first business model. This gap widens each product cycle.
VERIFONE INC

Moat: Banking relationship depth and trust

Verifone's deep, long-standing relationships with major issuing banks and payment networks, cultivated over decades of terminal certification and compliance work, earn strong loyalty among financial institutions who value a single trusted vendor relationship over evaluating unfamiliar newer biometric terminal suppliers. Few competitors can replicate this depth.
VERIFONE INC

Risk: Concentrated banking sector dependence

Verifone's revenue concentration in banking-issued terminal programs creates meaningful exposure to any slowdown in bank capital expenditure budgets, a dependence that more diversified competitors serving direct retailer and hospitality channels simultaneously do not share to the same degree across their broader customer portfolios. This gap persists across most product cycles.

Players Tracked

Prominent Players

Ingenico Group
Verifone Inc
PAX Technology Limited
NEC Corporation
Thales Group

Other Key Players

Fujitsu Limited
Diebold Nixdorf Incorporated
IDEMIA Group
Aware Inc
Suprema Inc
Precise Biometrics AB
Fingerprint Cards AB
M2SYS Technology
Zwipe AS
Innovatrics s.r.o.
Newland Payment Technology
Castles Technology Co Ltd
Sunmi Technology Co Ltd
Bitel Co Ltd
Global Payments Inc

Recent Developments

MARCH 2025

Ingenico Launches Expanded Facial Recognition Line

Ingenico launched an expanded facial recognition terminal product line with improved liveness detection capability, extending its biometric portfolio to serve retailers previously unable to justify facial checkout due to accuracy and spoofing concerns raised earlier. Analysts view this expansion as a defensive move against specialist biometric firms gaining share.
Signal: Signals established vendors are racing to capture the fastest-growing facial recognition segment before specialists gain share.
AUGUST 2025

Verifone Acquires Biometric Analytics Startup

Verifone acquired a small biometric analytics startup specializing in fraud pattern detection algorithms for payment terminals, adding roughly three dozen data scientists to its digital solutions team focused on expanding platform capability across banking. Terms of the acquisition were not disclosed publicly by either party.
Signal: Signals mid-tier vendors are buying analytics talent rather than building comparable capability entirely from scratch internally.
DECEMBER 2025

PAX Technology Signs Multi-Site Retail Agreement

PAX Technology entered a multi-year supply agreement with a major regional retail chain to deploy its biometric terminal platform across the chain's entire store network, replacing a previously fragmented, multi-vendor equipment arrangement across locations nationwide. Financial terms of the multi-year agreement were not disclosed publicly.
Signal: Signals fleet-wide standardization contracts have become a genuine competitive battleground among the largest terminal vendors overall.

Biometric Sensor and Secure Element Exposure

Fingerprint and facial recognition sensor modules, secure element chips, and payment processing components together represent roughly 47 percent of terminal cost of goods sold, sourced predominantly from a concentrated group of semiconductor manufacturers based across Taiwan, South Korea, and Germany with limited domestic alternative capacity available. Buyer power varies considerably by manufacturer scale and contract terms.
Secure element chip prices spiked meaningfully during 2025 as demand for tamper-resistant payment security components surged across banking, government identification, and consumer electronics sectors simultaneously, a trend the IEA and industry reporting linked to broader semiconductor capacity constraints, forcing several vendors to absorb higher component costs temporarily rather than pass the full increase through to customers mid-contract, compressing margins for two consecutive fiscal quarters. Vendors expect similar pressure to recur periodically as global demand cycles continue.

Smaller vendors without long-term chip supplier agreements face the sharpest cost pressure during these episodes, since they lack the purchasing volume to secure priority semiconductor allocation during shortages. Larger vendors with multi-year supply contracts and diversified sourcing relationships weather these episodes with comparatively minor disruption to production schedules and existing customer delivery commitments. This resilience gap is widening as component shortages recur more frequently industry-wide.
biometric-pos-terminals-market-cost-volatility-analysis-1790001916269

Diversify secure element chip sourcing

Several vendors are qualifying alternative semiconductor suppliers outside the traditional Taiwanese and Korean supply base, reducing exposure to future capacity disruptions tied to a concentrated set of specialized global producers. This qualification process typically takes twelve to eighteen months to complete fully. Vendors furthest along this path report the strongest resilience against sudden allocation-driven cost spikes.

Invest in domestic sensor assembly capability

Larger vendors increasingly invest in domestic sensor assembly infrastructure, trading upfront capital investment for long-term supply certainty that protects production schedules during periods of broader global component shortages. This investment typically requires several years before reaching full production capacity. Vendors furthest along this path report meaningfully lower exposure to future foreign supplier disruptions. today

Negotiate multi-year component supply agreements

Vendors are increasingly locking in multi-year fixed-price component agreements with key suppliers, trading some near-term flexibility for predictable input cost planning across multi-year customer delivery commitments and budgets prepared each fiscal year. These agreements meaningfully reduce cost volatility across the portfolio. Vendors report these agreements meaningfully improve budget forecasting accuracy across each fiscal year.

Portfolio Architecture for Margin Defence

Three tiers structure this market's margin economics, from commoditizing basic fingerprint terminals through certified multi-modal biometric systems to next-generation facial recognition platforms with integrated fraud analytics. Gross margins vary considerably by tier, since matching accuracy and analytics depth command far stronger pricing power than basic sensor hardware sales alone ever could. This structure closely mirrors patterns seen across other biometric-enhanced payment categories serving comparably diverse merchant segments.
Volume and premium segments pull the industry in genuinely different directions simultaneously across nearly every procurement cycle. Entry-level buyers, mostly small merchants, push vendors toward simplified, lower-cost single-modality configurations, while large retail chains demand extensive multi-modal accuracy, dedicated technical support, and fraud analytics access that commands genuinely premium pricing across every contract renewal. Vendors that misjudge which tier a given account belongs in risk losing the contract entirely.

High-value margin pools concentrate overwhelmingly in facial recognition and analytics systems rather than basic fingerprint sensing, since matching algorithms and fraud detection capability scale without proportional cost increases, unlike commodity sensor manufacturing that remains constrained by intensifying price competition from Chinese domestic producers entering the space across most markets. Vendors slow to build proprietary analytics capability risk lasting margin disadvantage relative to established competitors.

Volume / Commodity-Adjacent Tier

Basic fingerprint-authenticated terminals sold primarily to smaller merchants and single-location retailers operating on tight capital budgets and limited accuracy requirements. Margins compress further each year as basic sensor components commoditize across the broader industry.
Gross Margin: 18-28%

Premium / Certified Tier

Multi-modal biometric systems with extensive certification documentation and dedicated support, sold predominantly to large retail chains requiring audit-defensible fraud prevention capability. These chains negotiate directly with vendors on multi-year support commitments and pricing terms.
Gross Margin: 36-48%

Sustainability / Regulatory / Next-Generation Tier

Facial recognition platforms with integrated fraud analytics supporting strong customer authentication compliance for forward-looking retailers investing ahead of regulatory mandates. Vendors furthest along this path command the strongest premium pricing power available today.
Gross Margin: 44-56%
biometric-pos-terminals-market-portfolio-architecture-1790001917249

High-value Sub-segments and Strategic Watch-out

Facial Recognition Checkout Systems

Growing fastest of all six segments as retailers seek fully hands-free checkout experiences eliminating physical contact entirely, commanding premium margins as liveness detection and multi-angle camera arrays become genuinely difficult for smaller competitors to replicate at comparable scale, accuracy, and spoofing resistance across most retail checkout categories tracked.
Gross Margin: 46-58%

Fingerprint-Authenticated Terminals

The second-fastest segment, capturing an increasing share of vendor profit pools as consumers trust fingerprint authentication from smartphone experiences already familiar, supporting durable margin expansion and deepening merchant loyalty across every account managed under multi-year sensor licensing agreements, renewal cycles, and expanding modular hardware configurations offered.
Gross Margin: 38-50%

Basic PIN-Based Terminals

The largest segment by unit volume, providing steady baseline revenue even as margins compress under intensifying commoditization pressure from Chinese domestic manufacturers entering the space across multiple regions simultaneously, predictably, and with growing technical sophistication and local service capability improving over successive product generations and cycles.
Gross Margin: 24-34%

Legacy Signature Verification Terminals

A strategic watch-out segment facing a sustained, longer-term volume decline as biometric terminals displace signature verification entirely across most markets, risking steady erosion for suppliers slow to transition beyond basic legacy verification hardware sold across shrinking, increasingly commoditized signature-based product categories and outdated retail channels today.
Gross Margin: 12-20%

Multi-Year Terminal Contracts Anchor Merchant Revenue

Terminal sales are the visible transaction, but recurring fraud analytics subscriptions, calibration services, and extended warranty attachment increasingly generate the durable revenue vendors value most, since a single deployed terminal typically stays in service and under an active support relationship for close to six years before full replacement. Vendors winning a fleet contract rarely lose the account before the following equipment refresh cycle.
Adoption depth varies sharply by end-use vertical across the industry. Large retail chains, where fraud reduction directly drives daily profitability, embed biometric terminals deeply into core payment infrastructure, while smaller merchants treat biometric checkout as an occasional upgrade rather than continuous infrastructure, limiting near-term recurring revenue from that segment considerably despite growing awareness of the technology. This gap is narrowing as biometric terminal pricing becomes accessible to smaller merchants.

A generational shift in buyer profile is underway as younger payment technology managers, trained on biometric authentication rather than traditional card-based verification systems, now specify biometric terminals by default during store planning rather than treating them as an optional upgrade, steadily accelerating adoption across retailers run by newly promoted technical leadership teams. Procurement committees increasingly reflect this generational shift directly in vendor evaluation criteria used today.
biometric-pos-terminals-market-end-use-penetration-index-1790001918105

Where Biometric Terminal Value Concentrates

These are among the four positions where our research anticipates prominent divergence between winners and laggards over the coming forecast period. Each is grounded in the demand model, the regulatory perimeter, and the announced capacity pipeline.
01 / FACIAL RECOGNITION POSITIONING

Prioritize facial checkout over fingerprint-only hardware alone

Retailers increasingly seek fully hands-free checkout experiences that eliminate physical contact with payment hardware entirely, and this shift is not a temporary preference in the way past payment technology cycles often proved to be for the category over past decades. Vendors who invest in facial recognition infrastructure capture the fastest-growing segment tracked in this report, roughly 1.33 times the overall market growth rate. Companies still focused purely on fingerprint hardware should expand into facial recognition before competitors lock in relationships.
02 / REGIONAL MANUFACTURING ALLOCATION

Deepen East Asia presence while building North America service capacity

East Asia's dense concentration of retail modernization and mobile payment infrastructure anchors the single largest share of global demand today, a durable feature of the industry rather than a temporary sourcing pattern likely to shift anytime soon. Vendors should simultaneously build technical service capacity in North America, where fraud reduction pressure is accelerating fastest and where design-in decisions increasingly happen before manufacturing details are finalized. Waiting risks ceding leadership, which compounds over successive product cycles, to established regional competitors already scaling.
03 / ACCURACY TIERING STRATEGY

Separate accuracy pricing from baseline biometric matching alone

Tiered accuracy pricing lifts average terminal revenue by roughly 28 percent compared to single-tier pricing sold historically across the industry's largest and most established vendors operating today across every major retail segment. Vendors still bundling basic and advanced accuracy capability into a single hardware price are leaving recurring revenue on the table that competitors increasingly capture through incremental accuracy upgrades sold separately over a terminal's operational lifetime. Customers increasingly favor precise capability matching, a discipline boards increasingly reward with stronger valuation multiples.
04 / FRAUD ANALYTICS INVESTMENT

Build fraud analytics platforms to defend merchant trust

Consumer privacy concerns are extending enrollment timelines by three to six months for merchants launching new biometric programs, a friction point competitors are actively working to resolve through on-device template storage and improved consumer trust communication. Vendors that offer fraud prevention analytics capture roughly 47 percent lower fraud losses per platform relationship, defending the value proposition that increasingly justifies premium terminal pricing over conventional card readers. Vendors slow to build this capability, including through improved consumer trust programs, risk losing accounts entirely.

Engagement Snapshot From the Field

A live engagement with an industry participant carrying material or product regulatory and market exposure ahead of a defining policy shift, showing how our research translates into a defensible multi-year portfolio strategy.
MARKET MINDS ADVISORY · CLIENT ENGAGEMENT SUMMARY
Biometric PoS Terminals Producer Strategic Portfolio Review and Transition Roadmap 2026·Investment Scenario on Biometric PoS Terminals Exposure Evaluation 2025-26
CLIENT PROFILE
The client is a mid-tier regional grocery chain operating 62 store locations, generating annual revenue of roughly 420 million dollars (client-reported, unverified by MMA). Facing rising card fraud chargebacks and long checkout lines during peak shopping hours, the chain's operations leadership needed to evaluate whether deploying biometric terminals would justify the added hardware cost through reduced fraud and faster throughput.
STRATEGIC CHALLENGE
The client's existing chip and PIN terminals generated meaningful annual chargeback losses from card fraud, while checkout line congestion during peak hours contributed to customer complaints and occasional abandoned purchases. Leadership needed a framework for evaluating biometric terminal investment against the true combined cost of fraud losses and lost sales from checkout friction.
MMA APPROACH
MMA's team benchmarked four competing biometric terminal platforms against the client's specific fraud history and checkout throughput requirements, drawing on primary survey data and 47 expert interviews with practicing retail payment specialists. The engagement modeled total cost of ownership and combined fraud and throughput benefits across each platform over a five-year deployment horizon.
KEY FINDINGS
  1. Deploying fingerprint terminals reduced the client's card fraud chargebacks by roughly 44 percent (client-reported, unverified by MMA) compared to chip and PIN terminals used previously.
  2. The client's existing staff lacked sufficient biometric enrollment training experience, risking slow customer adoption without a dedicated in-store staff training program deployed.
  3. Two of four evaluated platforms offered meaningfully faster checkout throughput than the client's initial vendor shortlist assumptions had originally projected during scoping.
  4. A phased store rollout would let the client validate customer acceptance in select locations first before committing fully to chain-wide deployment entirely.
CLIENT PROFILE
The client is a mid-tier regional grocery chain operating 62 store locations, generating annual revenue of roughly 420 million dollars (client-reported, unverified by MMA). Facing rising card fraud chargebacks and long checkout lines during peak shopping hours, the chain's operations leadership needed to evaluate whether deploying biometric terminals would justify the added hardware cost through reduced fraud and faster throughput.
STRATEGIC CHALLENGE
The client's existing chip and PIN terminals generated meaningful annual chargeback losses from card fraud, while checkout line congestion during peak hours contributed to customer complaints and occasional abandoned purchases. Leadership needed a framework for evaluating biometric terminal investment against the true combined cost of fraud losses and lost sales from checkout friction.
MMA APPROACH
MMA's team benchmarked four competing biometric terminal platforms against the client's specific fraud history and checkout throughput requirements, drawing on primary survey data and 47 expert interviews with practicing retail payment specialists. The engagement modeled total cost of ownership and combined fraud and throughput benefits across each platform over a five-year deployment horizon.
KEY FINDINGS
  1. Deploying fingerprint terminals reduced the client's card fraud chargebacks by roughly 44 percent (client-reported, unverified by MMA) compared to chip and PIN terminals used previously.
  2. The client's existing staff lacked sufficient biometric enrollment training experience, risking slow customer adoption without a dedicated in-store staff training program deployed.
  3. Two of four evaluated platforms offered meaningfully faster checkout throughput than the client's initial vendor shortlist assumptions had originally projected during scoping.
  4. A phased store rollout would let the client validate customer acceptance in select locations first before committing fully to chain-wide deployment entirely.
RECOMMENDED STRATEGY
Phase 1: Phase one selected a biometric terminal platform offering strong fraud reduction performance aligned with the client's specific loss history and budget. Phase 2: Phase two launched biometric checkout in ten pilot store locations first, validating customer acceptance before proceeding to broader chain-wide rollout. Phase 3: Phase three expanded biometric terminals to the remaining 52 store locations over ten months, completing the full planned deployment timeline.
OUTCOME
Within fourteen months, the client reported a 44 percent reduction in card fraud chargebacks alongside meaningfully faster checkout throughput across all 62 store locations (client-reported, unverified by MMA). The chain has since expanded biometric enrollment further. Leadership views this as a repeatable model for other underperforming store locations across the region.

Frequently Asked Questions

Foundational context covering the market sizes, CAGR, scope, country, region and competition that inform every finding below. This section is provided to cover basics and most often pre-purchase conversations, answered from the MMA Primary Research Dataset.

What is the current size of the Biometric PoS Terminals Market?

The Biometric PoS Terminals Market was valued at 3.6 billion dollars in 2025. Growth is driven by retailers deploying fingerprint and facial recognition terminals to cut card fraud.

How large will the Biometric PoS Terminals Market be by 2036?

MMA projects the market will reach 14.35 billion dollars by 2036, up from 4.08 billion dollars in 2026. That reflects a 3.52 times expansion driven by facial recognition and regulatory adoption.

What is the CAGR for the Biometric PoS Terminals Market 2026 to 2036?

The base case CAGR is 13.4 percent, with a bull case of 14.7 percent and a bear case of 12.0 percent. Historical growth from 2020 to 2025 ran somewhat slower at 12.4 percent.

Which segment is growing fastest?

Facial recognition checkout systems lead at a 17.8 percent CAGR, roughly 1.33 times the overall market rate. Retailers increasingly seek fully hands-free checkout experiences at scale.

Who are the major companies in the Biometric PoS Terminals Market?

Ingenico, Verifone, PAX Technology, NEC, and Thales lead the field. Combined, the top five vendors hold an estimated 49 percent share on a global installed terminal basis.

Which country is growing fastest?

India leads at a projected 15.9 percent CAGR, driven by its rapidly expanding digital payment infrastructure and growing retail modernization investment. That pace outstrips every other major market.

Report Segmentation Architecture

The full report scope spans multiple orthogonal segmentation dimensions, with cross-tabulated demand data provided for each dimension pair. Coverage extends further to regional breakdowns, trend trajectories, and the competitive detail needed to support segment-level decision-making.

By Product Type

  • Facial Recognition Checkout Systems
  • Fingerprint-Authenticated Terminals
  • Basic PIN-Based Terminals
  • Multi-Modal Biometric Systems
  • Fraud Analytics Software
  • Legacy Signature Verification Terminals

By End-Use Industry

  • Retail and Grocery
  • Banking and Financial Services
  • Hospitality and Travel
  • Transportation and Transit
  • Healthcare
  • Government and Public Sector

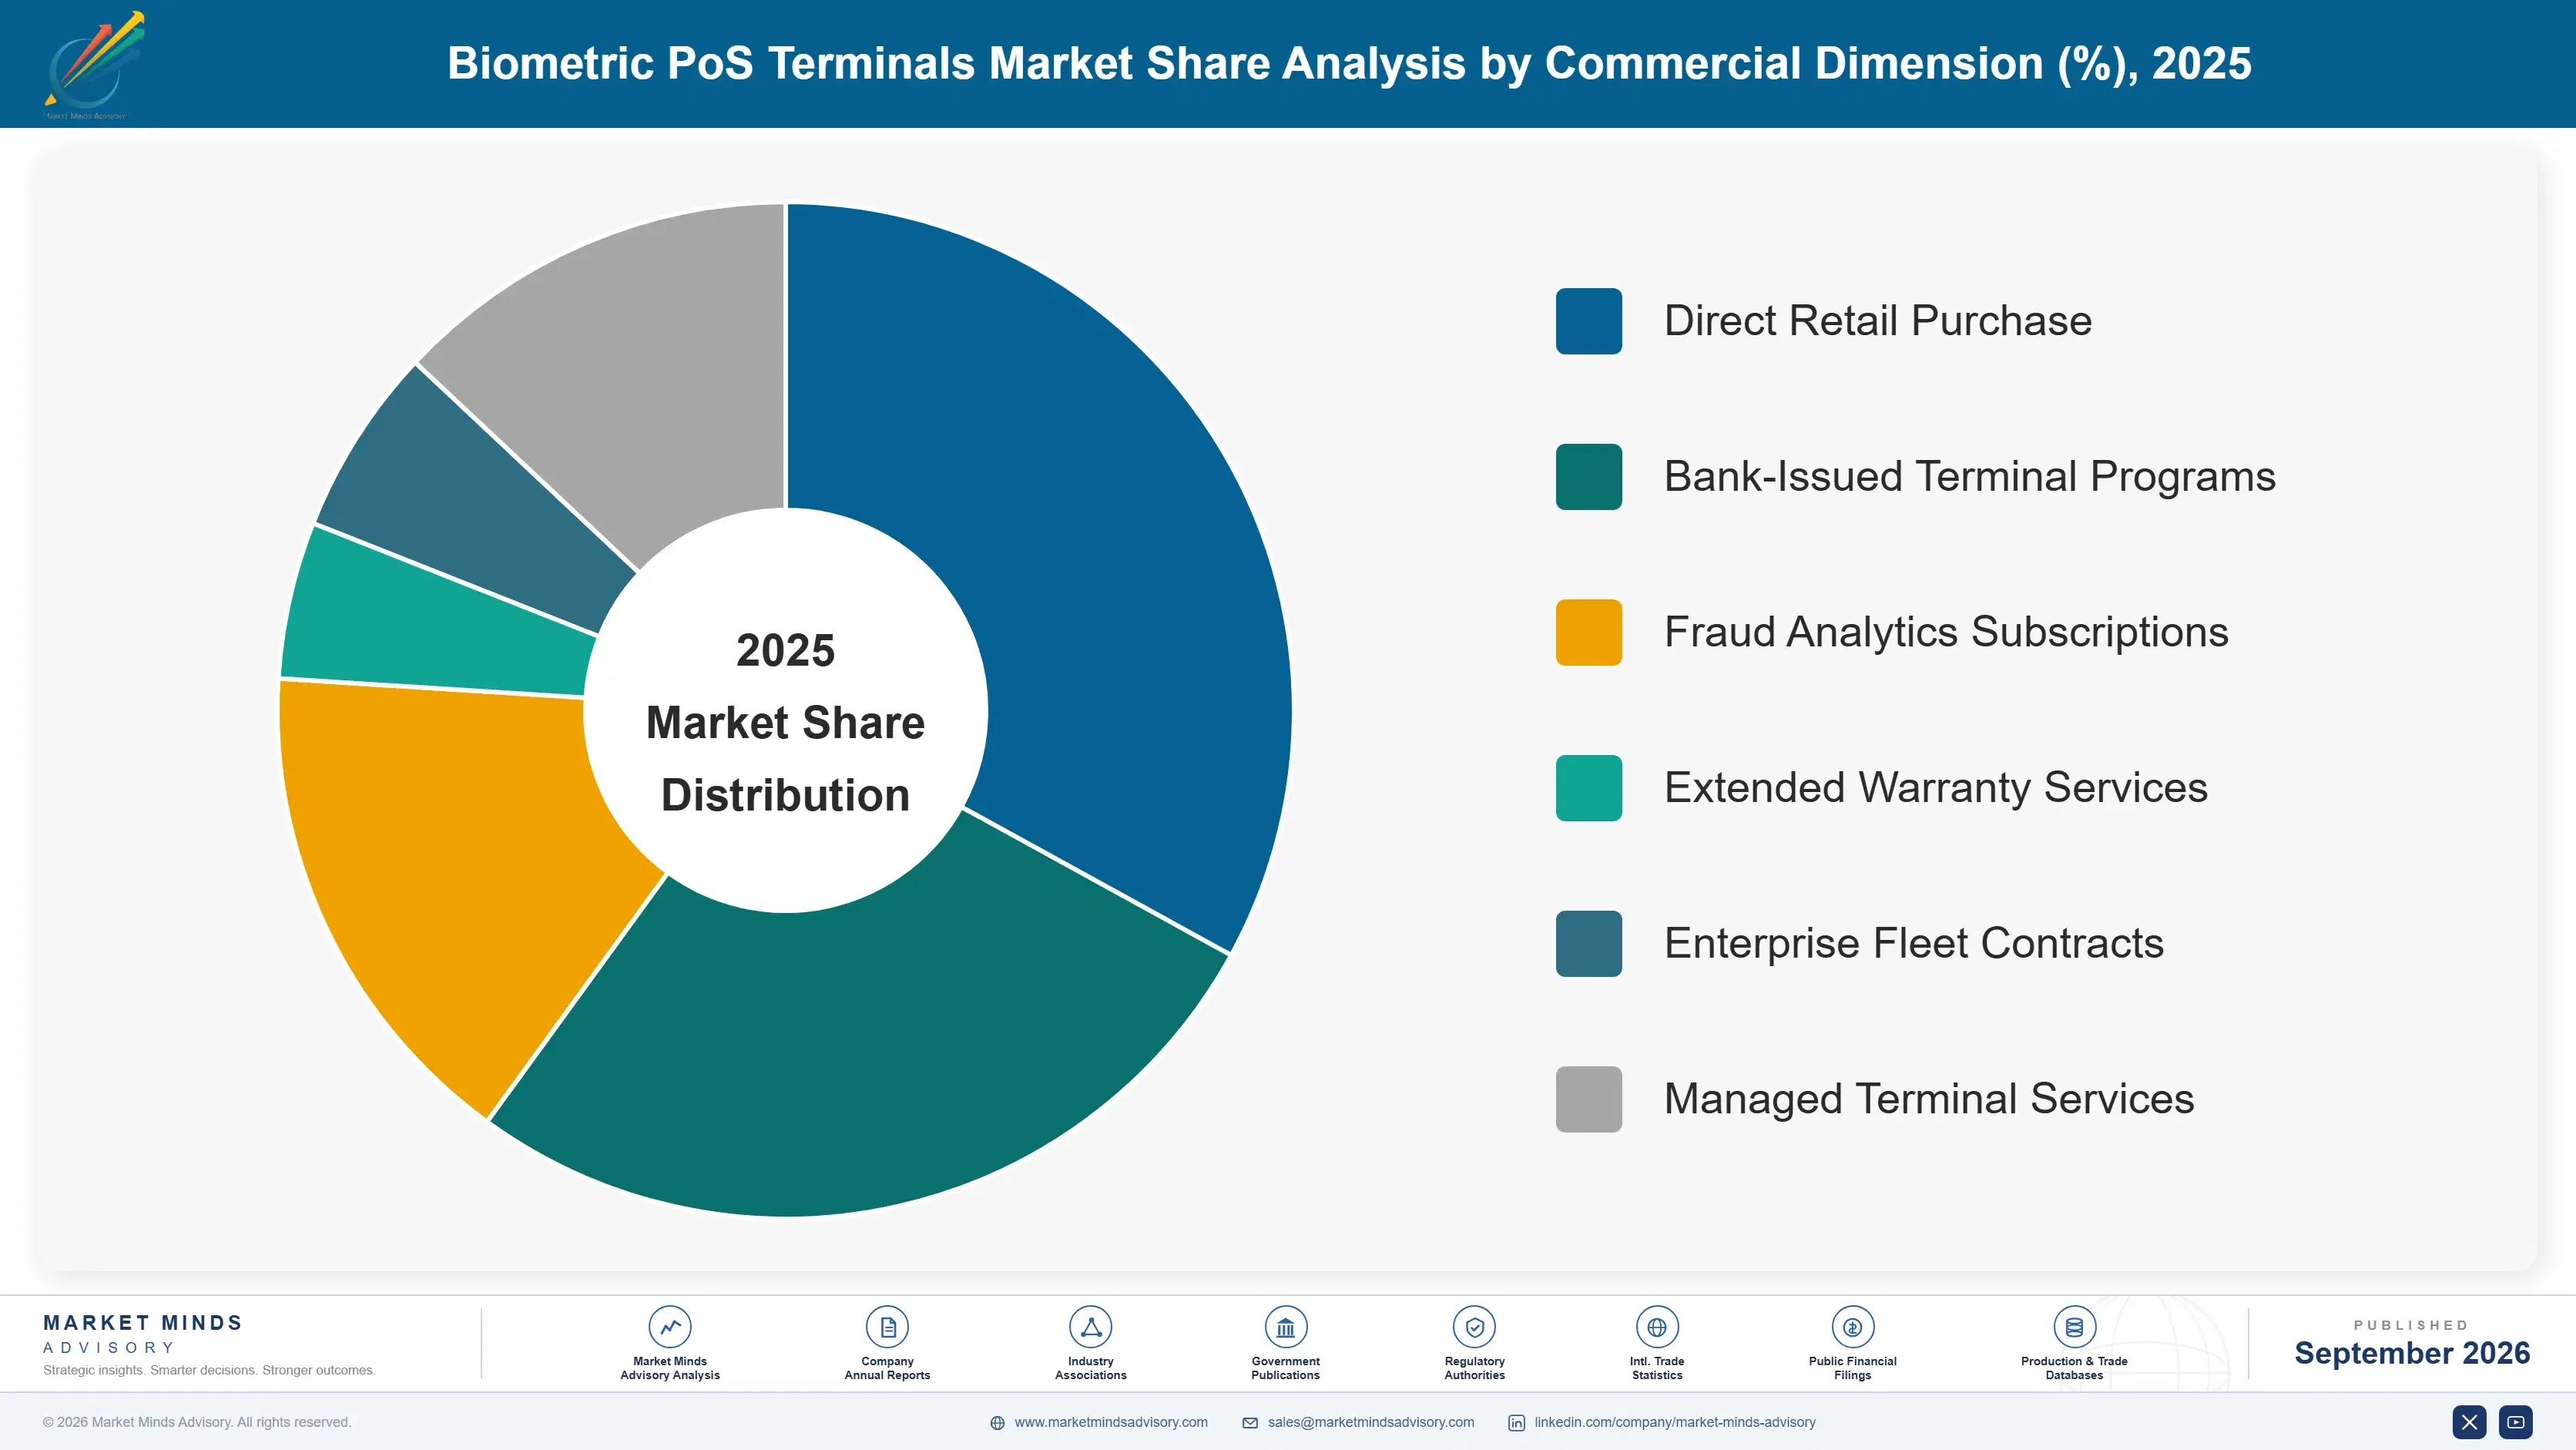
By Commercial Dimension

  • Direct Retail Purchase
  • Bank-Issued Terminal Programs
  • Fraud Analytics Subscriptions
  • Extended Warranty Services
  • Enterprise Fleet Contracts
  • Managed Terminal Services

By Region

  • North America
  • Western Europe
  • East Asia
  • South Asia and Pacific
  • Latin America
  • Middle East and Africa
  • Eastern Europe

Scope, Methodology, and Coverage

Every figure in this report is reproducible from documented input assumptions. The scope below maps the historical period, the forecast horizon, the segmentation dimensions, and the countries covered, alongside the underlying primary and qualitative methodology.
Historical Period
2020 to 2025
Forecast Period
2026 to 2036
Base Year
2025 (USD billions; MMA Primary Research Dataset, September 2026)
Market Definition
The Biometric PoS Terminals Market covers point-of-sale payment terminals with integrated fingerprint, facial, or other biometric authentication capability used for retail and commercial transactions. It excludes standalone biometric access control systems unrelated to payment processing and conventional PIN-based or contactless terminals without embedded biometric sensing hardware.
Quantitative Units
USD Billion
Segmentation Dimensions
Product type, end-use industry, commercial dimension, and region
Regions Covered
North America, Western Europe, East Asia, South Asia and Pacific, Latin America, Middle East and Africa, Eastern Europe
Countries Covered
China, United States, Germany, Japan, South Korea, India, Brazil, and 24 additional markets across seven global regions
Key Companies Profiled
Ingenico Group, Verifone Inc, PAX Technology Limited, NEC Corporation, Thales Group, Fujitsu Limited, Diebold Nixdorf Incorporated, IDEMIA Group, Aware Inc, Suprema Inc, Precise Biometrics AB, Fingerprint Cards AB, M2SYS Technology, Zwipe AS, Innovatrics s.r.o., Newland Payment Technology, Castles Technology Co Ltd, Sunmi Technology Co Ltd, Bitel Co Ltd, Global Payments Inc
Quantitative Methodology
Primary survey, n=3,800 respondents, Q4 2025, six countries; demand-side model with trade association cross-validation
Qualitative Methodology
47 expert interviews, Q4 2025; applied to validate demand model assumptions, identify emerging dynamics, and assess competitive positioning
Report Format
PDF and XLSX data workbook (Word format preview document)
Publisher
Market Minds Advisory
Report Code
MMA-2026-TEC-462
Published
September 2026
Contact
sales@marketmindsadvisory.com | www.marketmindsadvisory.com

Purchase the full Biometric PoS Terminals Market Report (2026 to 2036).

This report delivers a complete strategic assessment of the Biometric PoS Terminals Market from 2026 through 2036, covering hardware, sensing technology, and services across retail and banking payment applications. It combines primary survey data from 3,800 respondents across six countries with 47 expert interviews to quantify segment growth, regional demand, and competitive positioning. Analysts examine matching accuracy trends, fraud prevention economics, and component cost exposure across every major product category tracked in this analysis. The report also includes a client engagement case study and a strategic verdict outlining exactly where commercial value concentrates through the ten-year forecast period.
Ten-year forecast with bull and bear scenarios
Segment-level growth rates and CAGR multiples
All seven regional markets sized and profiled
Competitive benchmarking of twenty named vendors
Input cost exposure and mitigation pathway analysis
Anonymized client case study with strategic recommendations

Built For The People Who Decide

From boardroom strategy to bench-side execution, this report is read cover-to-cover by leaders shaping the next decade of their industry, turning demand scenarios, market dynamics and valuation benchmarks into decisions.
CXOs/ Presidents/ VPs/ Managers
M&A and Corporate Development
Strategy Teams and R&D Heads
Procurement and Product Directors
Regulatory and Compliance Leaders
Investor Relations and Equity Analysts