Market Minds Advisory
Biologics and Biosimilars Market

Biologics and Biosimilars Market: Patent Cliffs, Manufacturing Scale, and the Race to Replicate Complex Molecules

Originator patent expiries through 2029 open eleven blockbuster biologics to substitution, forcing manufacturers to defend molecule complexity while biosimilar entrants scale fermentation capacity and payers redirect formulary preference toward lower-cost equivalents.

Lead Analyst

Alice Ballenger

Published

September 2026

Make Smarter Decisions with Customized Research Insights

Request a free sample report and evaluate market opportunities, growth trends, and competitive dynamics relevant to your business needs.

2025 MARKET VALUE$485.6BMarket Size 2025
2036 FORECAST VALUE$1305MBase Case , 2026 to 2036
CAGR 2026 TO 20369.4 %Bull 10.6% / Bear 8.2%
INCREMENTAL OPPORTUNITY$773.3BNet 10- year value creation
EXPANSION MULTIPLE2.46x2036 value over 2026 base
Strategic Levers
M&A Pipeline
Regional Outlook
Country Rankings
Competitive Intelligence
Segmental Deep-dive
Call-Us : 91 93563 13602

Executive Snapshot and Market Trajectory

Eleven originator biologics lose core patent protection by 2029, and formulary committees are already redirecting new-patient starts toward approved biosimilars wherever interchangeability status holds, reshaping prescribing habits built over a decade in under two years across most major treatment categories worldwide and across every income tier of national health system.
Oncology and immunology dominate near-term substitution volume, with monoclonal antibody biosimilars capturing formulary share fastest in the United States and Germany. Manufacturing capacity originally built for originator scale now gets repurposed for biosimilar fill-finish runs, compressing unit costs as fermentation utilisation climbs past 80 percent across contract sites that once ran below 65 percent, a shift few originator manufacturers had fully priced into their defence strategy for the coming decade of sequential patent expiries.
Five originator groups still control most complex-molecule output, but Sandoz, Celltrion, and Samsung Bioepis have closed the analytical-similarity gap that once slowed approvals by years. Interchangeability designations from the FDA and parallel EMA extrapolation rulings now decide which molecules face substitution within eighteen months of exclusivity loss rather than the five-year window earlier biosimilar cycles typically required before meaningful formulary share changed hands across a therapeutic class.
Market Definition
This market covers therapeutic biologics, monoclonal antibodies, recombinant proteins, vaccines, cell and gene therapies, and their approved biosimilar equivalents, sold for human therapeutic use. It excludes diagnostic reagents, veterinary biologics, and contract development services sold independent of product ownership.
Base Year Value
$485.6B in 2025 (MMA Primary Research Dataset, August 2026)
Forecast Period
2026 to 2036, eleven discrete annual values
CAGR
9.4% base case. Bull 10.6%. Bear 8.2%.
Fastest Growth Segment
Biosimilars: 14.6% CAGR
Fastest Growth Country
India: 12.8% CAGR
Fastest Growth Region
South Asia and Pacific: 11.4% CAGR
Largest Region
North America: 30% of 2025 global value
Market Leaders
AbbVie, Amgen, Roche, Sandoz, Pfizer. Source: MMA Analysis based on company annual reports.
Primary Survey
n=3,800 procurement and R&D decision-makers, Q4 2025, six countries
Methodology
Demand-side build-up, cross-validated against public data, 47 expert interviews

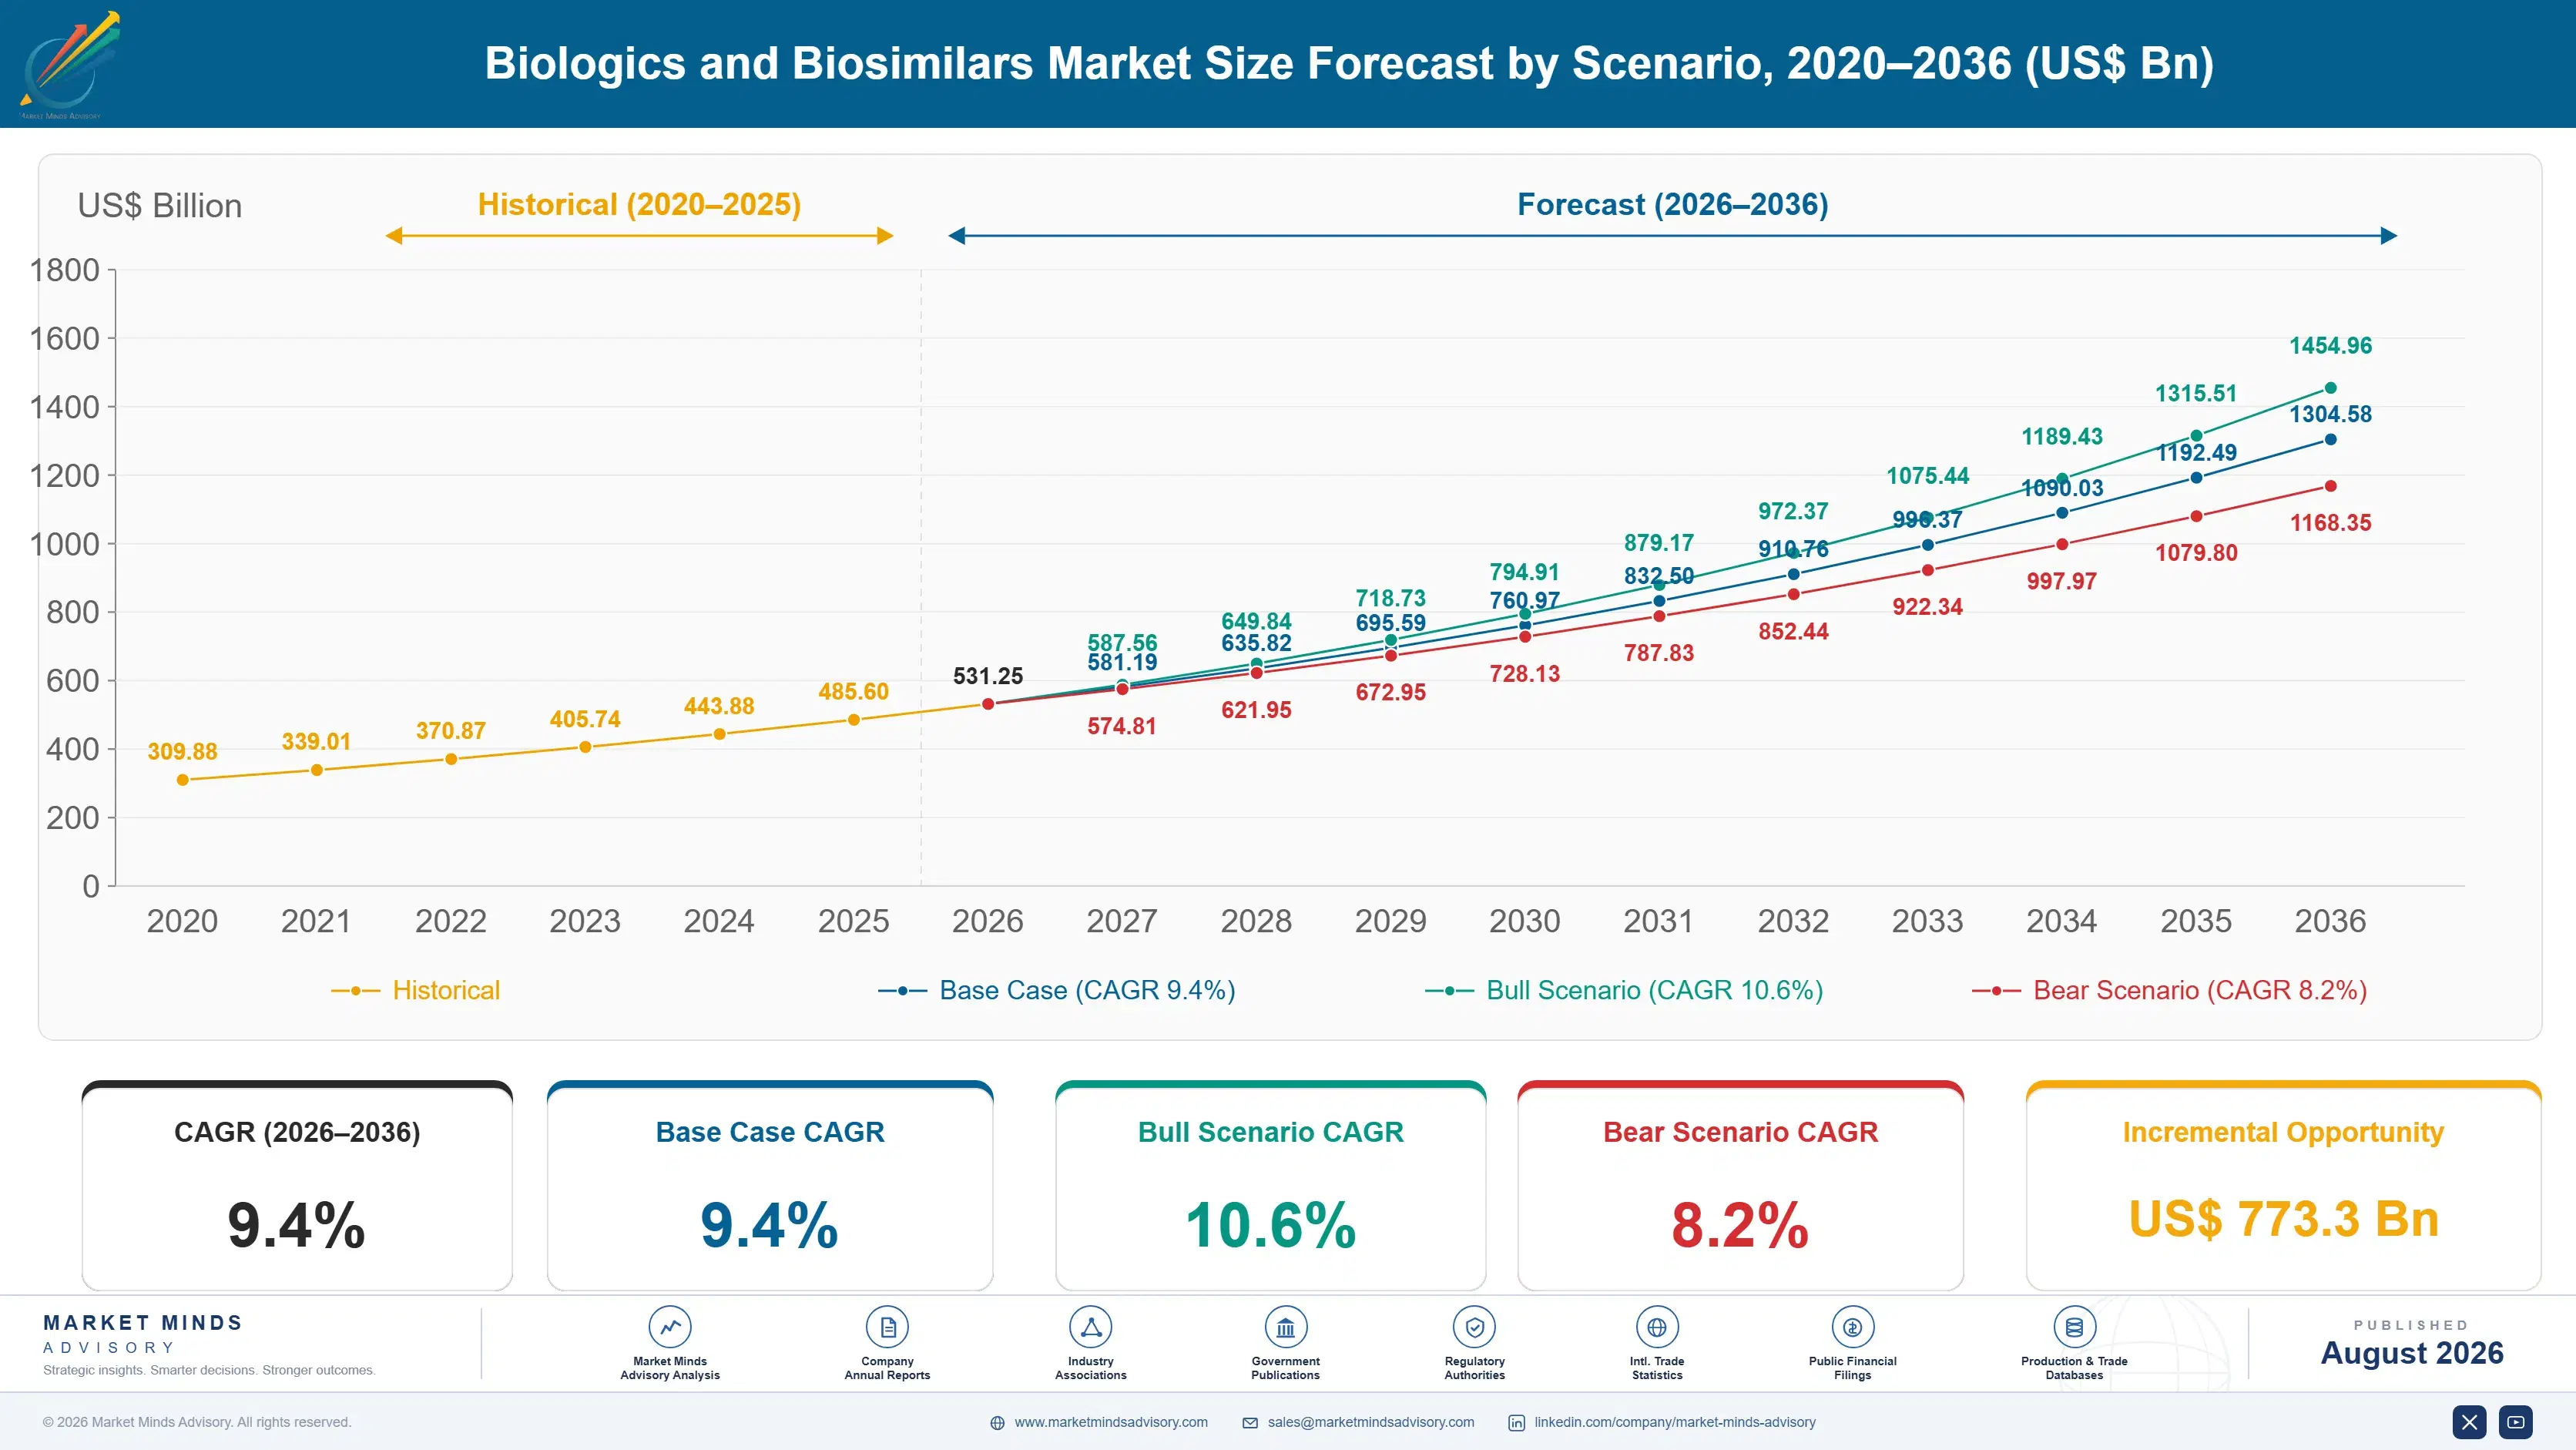
Biologics and Biosimilars Market Forecast Scenarios

biologics-and-biosimilars-market-size-forecast-scenario-1787325585273
Between 2020 and 2025, biologics revenue grew steadily as oncology and immunology launches added volume faster than early biosimilars eroded originator pricing, holding the historical growth rate near 8.4 percent even as several major patents began their final approach toward expiry across the period, setting up the acceleration that follows through the forecast window and beyond it into the next decade.
The base case assumes 9.4 percent annual growth through 2036, built on three mechanisms: sequential patent cliffs releasing eleven blockbuster molecules to substitution between 2025 and 2029, expanding biosimilar manufacturing capacity in India and South Korea that cuts per-unit fermentation cost, and payer mandates across the United States and Germany that now default new prescriptions to whichever approved product carries the lowest list price within its molecule class each quarter.
A bull case near 10.6 percent depends on interchangeability designations spreading to injectable oncology biosimilars without additional switching studies required by regulators. The bear case near 8.2 percent reflects prolonged patent litigation delaying entry, since originator holders have repeatedly used secondary formulation patents to push launch dates two to three years past core expiry in several documented cases.

Molecule Complexity Meets Manufacturing Scale

Biologics manufacturing has shifted from a scarcity problem to a scheduling problem. Single-use bioreactor capacity that took a decade to build now sits available for biosimilar contract runs the moment an originator's exclusivity lapses, and the sites that win that work are the ones already qualified against the reference molecule's analytical profile well before the patent clock runs out on the underlying exclusivity period.
TOP 5 CONCENTRATION38% CR5revenue share held by five largest global manufacturers
AVERAGE BIOSIMILAR DISCOUNT32%typical launch price cut versus originator list price
LEADING PRODUCING COUNTRYUnited States, 29%share of global production value, by home country
FERMENTATION UTILISATION81%average capacity use across qualified contract manufacturing sites
CROSS-BORDER TRADE44%finished product volume moving across national borders yearly
MEDIA AND RESIN COST26% of COGSinput cost weight from culture media and resins
Commercial behaviour splits cleanly along molecule age. Newly launched biologics still command premium list pricing protected by orphan designations and combination-therapy exclusivity, while molecules past their tenth year on market face biosimilar competition from three or more approved entrants within a single therapeutic class, particularly across oncology and autoimmune indications where switching has become routine rather than exceptional across most prescribing physicians in these fields.
The next decade turns on extrapolation policy. Regulators who let one biosimilar approval cover every indication of the reference product compress launch timelines by years; regulators who require indication-specific trials slow entrants and protect originator revenue for considerably longer, shaping where developers choose to file first and how much capital they invest well ahead of approval.
"The companies protecting biologics revenue longest aren't the ones with the best patents anymore. They're the ones who requalified their own manufacturing lines fastest for the molecule that comes after."
Director, Biopharmaceutical Manufacturing Practice · MMA Healthcare and Life Sci

Market Trends

Interchangeability Rulings Accelerate Pharmacy-Level Substitution Nationwide

FDA interchangeability status now covers more than thirty approved biosimilars, letting pharmacists substitute at the counter without prescriber sign-off in most states. The designation once required originator-style switching studies costing upward of 40 million dollars per molecule; abbreviated pathways introduced since 2023 cut that requirement for well-characterised monoclonal antibodies with sufficient prior real-world safety data. Germany and France run parallel automatic-substitution rules through statutory health insurers, pushing biosimilar uptake past 80 percent within two years of launch for insulin glargine and several oncology antibodies, a pace originator manufacturers had not budgeted against when setting five-year defence plans.
Market Impact: Opens $90B originator revenue
Contract Manufacturing Reallocates to Biosimilar Fill-Finish

Single-use bioreactor lines built during the 2021 to 2023 capacity boom now run biosimilar batches as originator exclusivity lapses across the eleven-molecule patent cliff running through 2029. Lonza, Samsung Biologics, and WuXi Biologics have each requalified existing fermentation trains against reference-product analytical profiles rather than building new capacity, cutting qualification time from eighteen months to under nine across most monoclonal antibody classes. Utilisation at qualified contract sites has climbed past 81 percent, tightening near-term slot availability for smaller biosimilar developers seeking capacity ahead of their own launch windows and forcing several to book slots more than a year out.
Market Impact: Shifts 70% of new starts

Market Opportunities and Growth Drivers

Sequential Patent Cliffs Release Eleven Blockbuster Molecules

Eleven biologics generating combined originator revenue above 90 billion dollars annually lose core patent protection between 2025 and 2029, including major oncology and immunology antibodies that anchor several manufacturers' entire growth narratives. Each cliff opens a distinct substitution window as payers move new-patient starts to approved biosimilars within months of launch rather than years. The Inflation Reduction Act's negotiated-price provisions add further pressure, since originator holders facing both biosimilar entry and government price setting have less room to defend list pricing than in prior patent-cliff cycles, particularly for molecules approved before 2015.
Market Impact: Delays entry 24 to 36 mo

Payer Mandates Default Prescriptions to Lowest-Cost Equivalent

CMS Medicare Part B reimbursement now pays the same rate for a reference biologic and its biosimilars, removing the margin incentive that once kept physicians defaulting to originator product regardless of price. Large pharmacy benefit managers have moved several major biosimilars to preferred formulary tiers ahead of their originators, and step-therapy requirements in commercial plans push roughly 70 percent of new prescriptions toward the lowest listed price within a therapeutic class. European statutory insurers apply comparable reference pricing, narrowing the addressable premium for late-lifecycle originator products across both major markets.
Market Impact: Adds 9 to 14 months entry

Market Restraints and Challenges

Secondary Formulation Patents Extend Effective Exclusivity

Originator manufacturers routinely file device, dosing-regimen, and formulation patents that extend commercial protection two to five years past a molecule's core patent expiry, a practice litigated repeatedly but rarely fully blocked. The root cause is patent law that treats delivery mechanism and formulation as independently patentable even when the underlying protein sequence is public. Biosimilar developers absorb the resulting delay as sunk clinical and manufacturing investment sitting idle for years. Several developers now file inter partes review challenges pre-emptively, and a handful of settlements have produced licensed early-entry dates ahead of full patent expiry, offering a partial mitigation path.
Market Impact: Adds 18% biosimilar uptake

Analytical Similarity Standards Vary Across Regulators

The FDA, EMA, and China's NMPA apply different analytical and clinical bridging requirements for biosimilar approval, forcing developers to run separate comparability packages per jurisdiction rather than one global dossier. The underlying cause is the absence of a harmonised international reference standard for complex glycoprotein characterisation across regulatory bodies. This adds nine to fourteen months and meaningful cost to each additional market entry. Developers increasingly front-load approval in the FDA or EMA first and use that dataset to accelerate secondary filings, though full harmonisation remains under discussion at the ICH level without a firm target date set.
Market Impact: Cuts qualification time 9 months
3 additional market trends, 4 additional growth drivers, and 3 additional restraints and challenges are covered in the full report. Contact sales@marketmindsadvisory.com to access the complete intelligence.

Segment CAGR and Growth Architecture

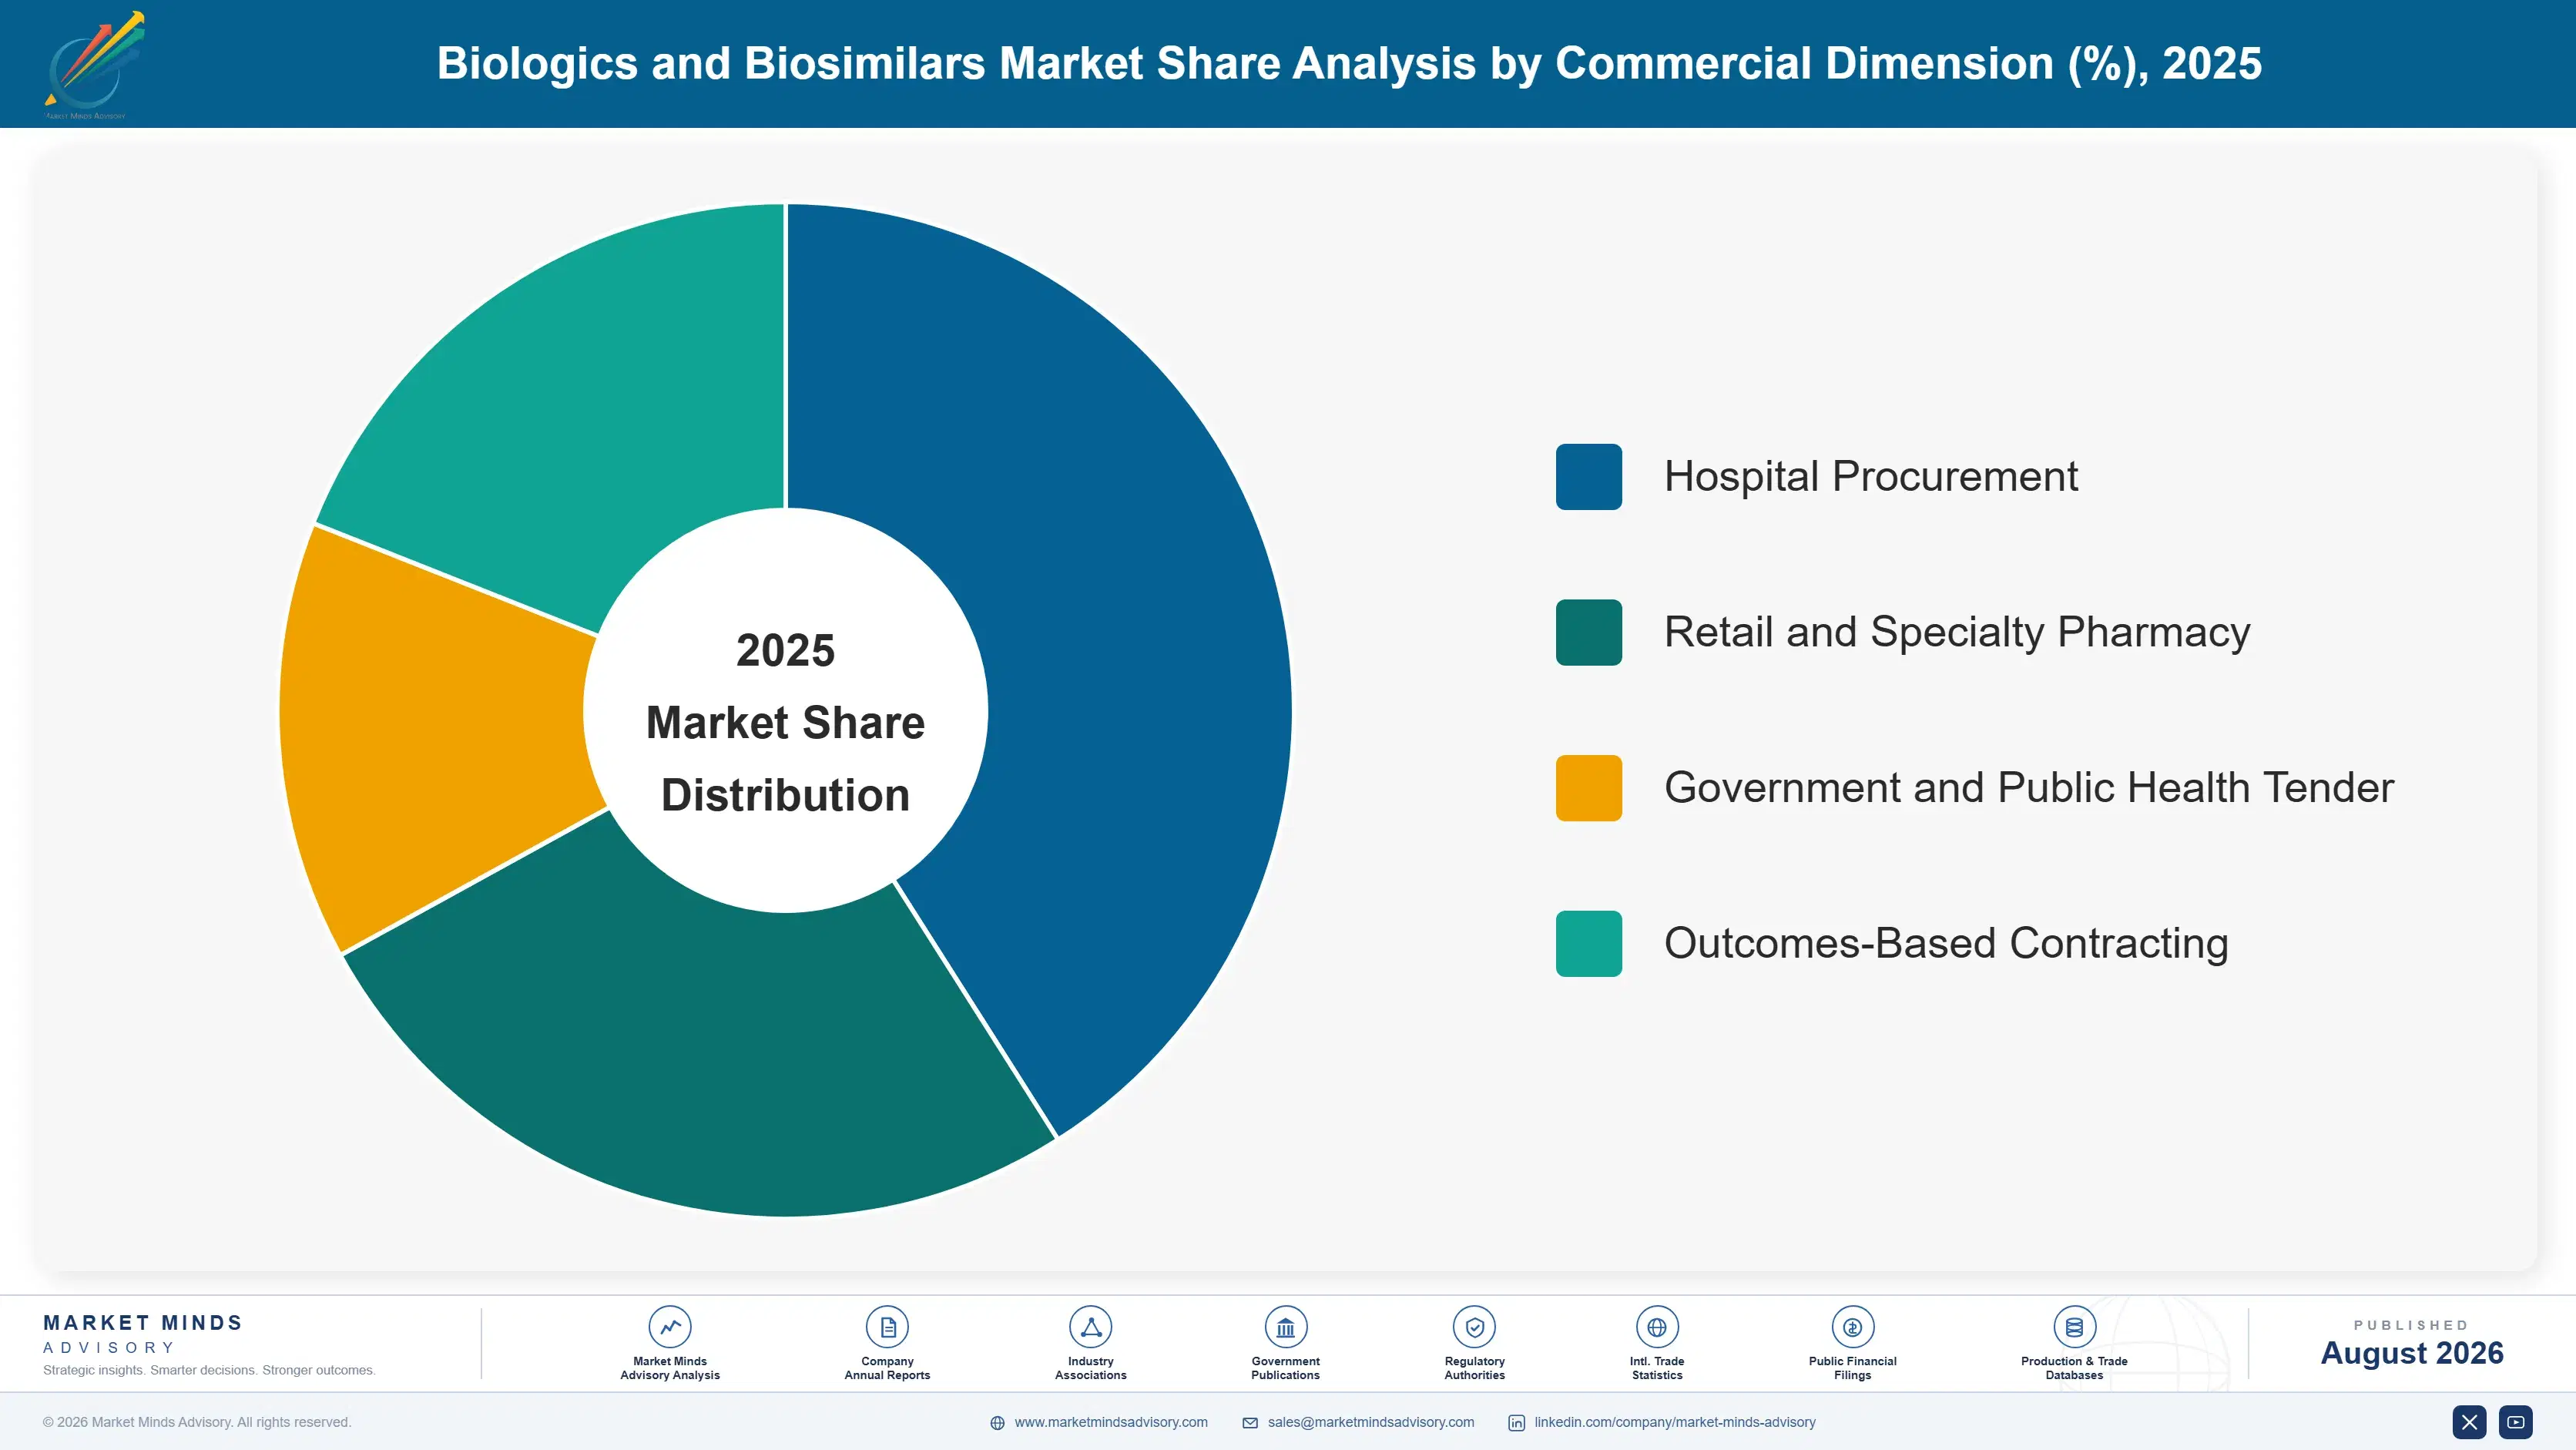
Segmentation follows product and molecule class, the classification regulators and payers already use to set approval pathways and reimbursement tiers. Biosimilars sit as a distinct class given their separate regulatory pathway and commercial dynamics relative to originator molecule families across every major therapeutic category this report covers, from oncology through chronic autoimmune care and rare disease treatment.
biologics-and-biosimilars-market-market-share-analysis-1787325585812

Biosimilars

Biosimilars are the fastest-growing product class as the eleven-molecule patent cliff runs through 2029, adding new approved entrants across oncology, immunology, and diabetes care each year. Sandoz, Celltrion, and Samsung Bioepis lead approval counts, backed by fermentation capacity requalified from originator-scale contract manufacturing built during the prior decade. Average launch pricing sits 30 to 35 percent below the reference product, widening as multiple biosimilars compete within a single molecule class over successive launch waves. Interchangeability designations now cover most major approved monoclonal antibody biosimilars in the United States, letting pharmacy-level substitution happen without prescriber intervention. Growth concentrates in markets with automatic-substitution policy, notably Germany and France, where national insurers have set explicit biosimilar uptake targets tied to formulary reimbursement rates.
CAGR 14.6%

Cell and Gene Therapies

Cell and gene therapies grow fastest among originator biologic classes as approved CAR-T and gene replacement products expand into earlier treatment lines and additional indications beyond their original approvals. Manufacturing remains the binding constraint: viral vector production and patient-specific cell processing carry far higher unit cost and longer lead times than recombinant protein manufacturing, keeping volumes modest relative to revenue generated per treated patient. Novartis, Bristol Myers Squibb, and Gilead's Kite Pharma unit hold most commercial slots worldwide. Payer reimbursement increasingly uses outcomes-based contracts given list prices that can exceed 400,000 dollars per treatment course, shifting risk toward manufacturers when durability of response falls short of trial data, a structure standard across most gene therapy launches in the United States.
CAGR 13.1%
Full segment breakdown across 6 segments available in the complete report.

Regional Architecture and Country Demand Map

North America and East Asia together account for more than half of global biologics revenue, while South Asia and Pacific posts the fastest regional growth on expanding biosimilar export manufacturing capacity built over the past five years across India and neighbouring markets in the wider region.

North America

The United States sets the pace here, carrying the largest single national share of originator biologics revenue and the fastest-moving biosimilar substitution policy of any major market. CMS Part B reimbursement parity between reference biologics and biosimilars removed the physician margin incentive that once favoured originator product by default, and interchangeability designations now let pharmacists substitute without prescriber approval across most monoclonal antibody classes sold nationally. Canada contributes a smaller but steadily growing share, with provincial formularies mandating biosimilar switching for existing patients rather than only new starts, a policy the United States has not adopted federally. Manufacturing investment concentrates around North Carolina and Massachusetts, where fermentation capacity gets requalified fastest for new biosimilar launches.
Share: 30% | CAGR: 10.2% (2026 to 2036)

Western Europe

Germany and France drive regional volume through statutory health insurance systems that apply automatic biosimilar substitution and reference pricing, pushing uptake past 80 percent within two years of launch for several major molecule classes across both countries. The United Kingdom runs a comparable framework through the NHS, though procurement moves through regional trusts rather than a single national tender, producing more uneven uptake speed across different parts of the country. Switzerland retains a disproportionate manufacturing footprint given Roche and Novartis's home-market production base, even as its small population keeps direct consumption modest relative to output. Growth trails North America and East Asia because much of the region's substitution wave already ran through earlier launch cycles.
Share: 22% | CAGR: 8.0% (2026 to 2036)
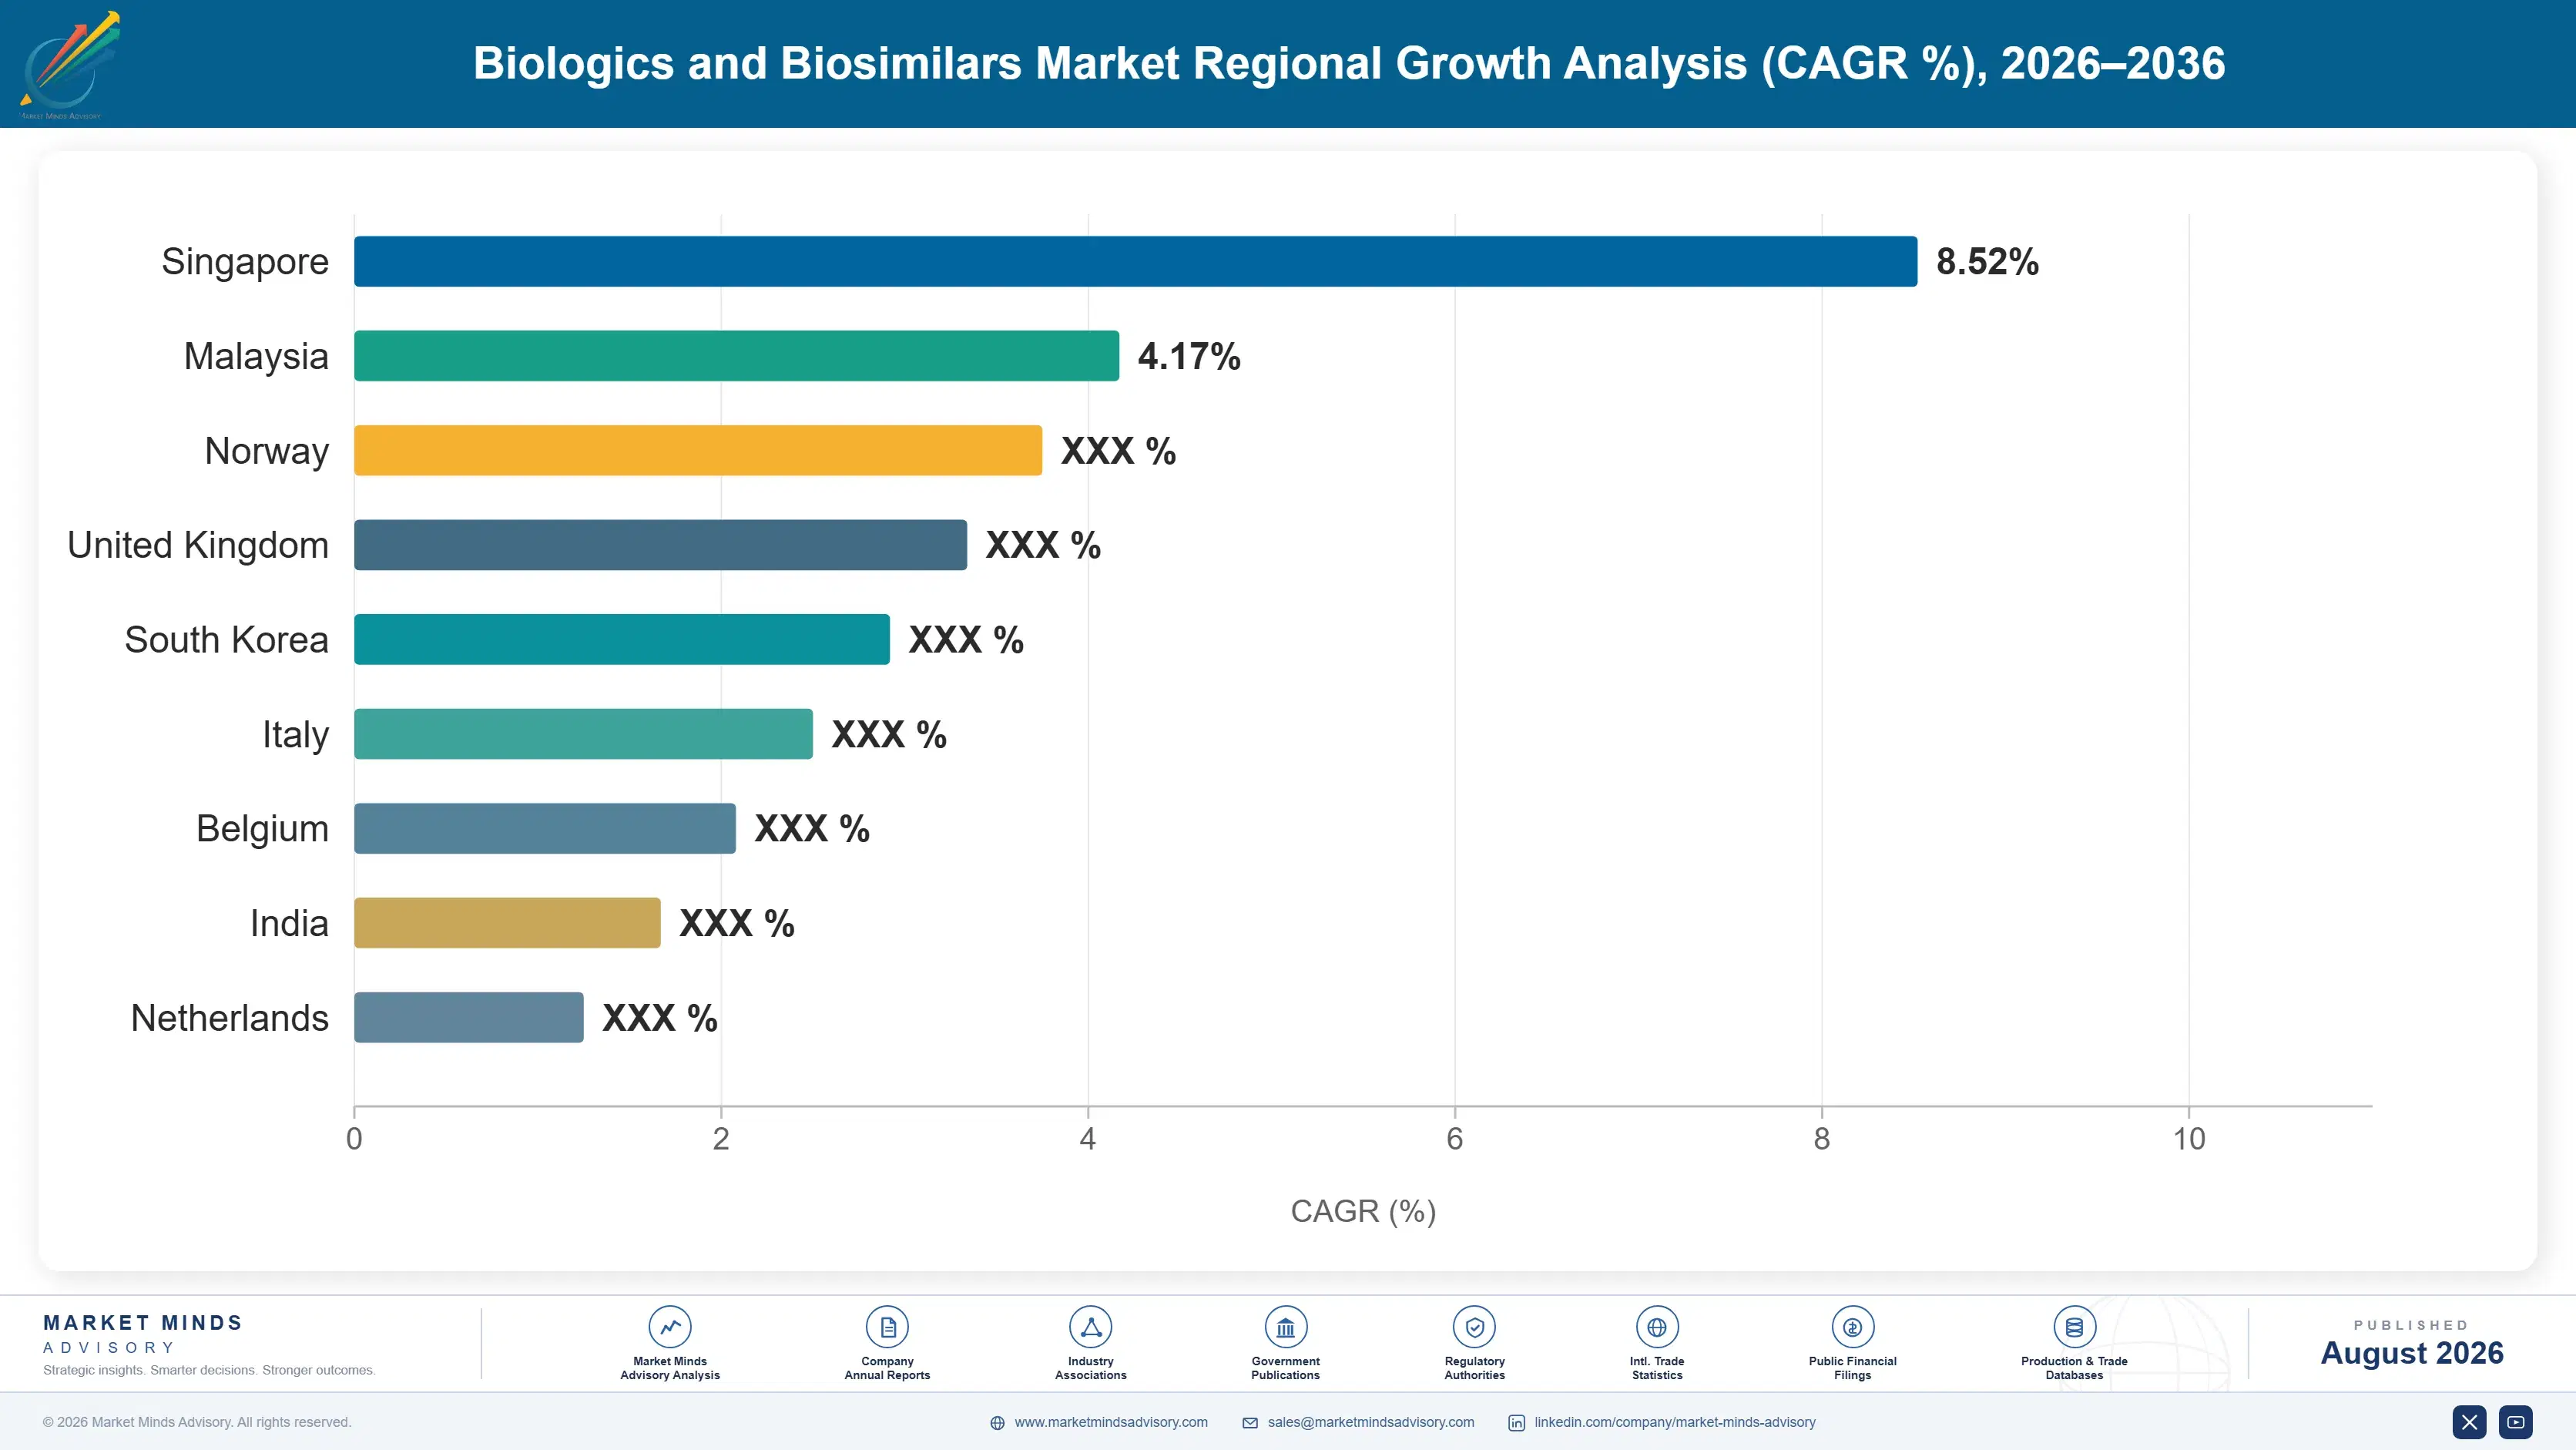
Regional intelligence for 5 additional markets available in the complete report: East Asia, South Asia and Pacific, Latin America, Middle East and Africa, Eastern Europe. Contact sales@marketmindsadvisory.com.
biologics-and-biosimilars-market-country-cagr-analysis-1787325586324

Where Biologics Margin Actually Concentrates

Margin no longer sits with whoever owns the molecule longest. It sits with whoever controls qualified fermentation capacity, interchangeability data, and the fastest path through comparability review once a patent cliff opens across a molecule class, and who moves before competitors even finish filing their own comparability packages with regulators in the relevant jurisdiction.

First-to-File Biosimilar Approval Timing Edge Wins

Developers who file the first substantially complete biosimilar application typically capture 180 days of exclusivity-adjacent commercial advantage before a second or third entrant reaches market, letting first movers set initial price anchoring within a molecule class before competitors arrive. Sandoz and Celltrion have built regulatory-affairs teams specifically to compress comparability review timelines, filing analytical packages 12 to 18 months ahead of core patent expiry so approval lands within weeks of the exclusivity window opening. Later entrants face a narrower pricing band, often 8 to 12 percentage points below the first biosimilar's launch discount, since payers have already anchored formulary tiers.
Market Impact: Adds 8 to 12 point pricing edge ear

Requalified Fermentation Capacity for Biosimilar Runs

Contract manufacturers that requalify existing single-use bioreactor trains against a reference molecule's analytical profile avoid the 200 million dollar-plus cost of new greenfield capacity, cutting time to first commercial batch from roughly 24 months to under 10 across most monoclonal antibody classes. Lonza and Samsung Biologics have each converted originator-scale capacity this way as multiple patent cliffs opened in sequence since 2023, avoiding years of construction and validation lead time. Utilisation at requalified sites now averages 81 percent, well above the 60 to 65 percent typical of newly commissioned greenfield facilities still working through validation batches and regulatory sign-off.
Market Impact: Cuts capex by $200M per new line bu

Interchangeability Designation Driving Pharmacy-Level Substitution Gains

Biosimilars holding FDA interchangeability status can be substituted at the pharmacy counter without prescriber sign-off, a designation that has pushed uptake past 60 percent within twelve months of launch for several monoclonal antibody classes, versus roughly 35 percent for biosimilars without the designation over the same period of comparison across similar molecules. Manufacturers now budget for switching study costs upward of 25 million dollars per molecule specifically to secure this status ahead of competitors, treating it as a distinct commercial asset separate from base biosimilar approval and worth the added upfront investment required.
Market Impact: Lifts uptake by 25 points within 12

Outcomes-Based Contracts for Gene Therapy Launches

Manufacturers of cell and gene therapies priced above 300,000 dollars per treatment course increasingly tie a portion of payment to durability of clinical response, shifting risk away from payers who would otherwise resist list pricing at that level for a single treatment course. Novartis and Bristol Myers Squibb both run outcomes-based agreements covering a meaningful share of their gene therapy revenue in the United States specifically. These structures have widened payer willingness to cover new launches by an estimated 15 to 20 percent versus flat list-price negotiation, according to MMA Primary Research interviews with payer-relations executives conducted in Q4 2025.
Market Impact: Widens payer coverage by 15 to 20 p

Who Controls the Margin Pool

CR5 sits at 38 percent, moderate for a therapeutics category, reflecting biologics' split between concentrated originator ownership and an increasingly fragmented biosimilar field. AbbVie, Amgen, Roche, Sandoz, and Pfizer hold the top five positions, but the gap to the next tier of challengers has narrowed as Celltrion and Samsung Bioepis add approved biosimilars faster than most originator portfolios add new molecules.
Current competitive activity centres on three fronts: originator manufacturers filing secondary formulation patents to extend effective exclusivity, biosimilar developers racing to file first substantially complete applications ahead of patent cliffs, and contract manufacturers requalifying existing capacity rather than building new lines. Pricing competition within biosimilar classes has intensified as three or more approved entrants now compete for the same substitution volume in oncology and immunology.

Emerging pressure comes from Chinese biosimilar developers, who have moved from domestic-only approval toward WHO prequalification and initial EMA filings, a path South Korean firms took a decade earlier. Rankings shift most at the molecule level rather than the corporate level: a manufacturer's position in one therapeutic class carries little predictive weight for its position in the next patent cliff, since fermentation requalification and regulatory filing speed reset with each new molecule.
biologics-and-biosimilars-market-company-positioning-matrix-1787325586841

Competitive Moat and Risk Dimensions

ABBVIE

Moat: Immunology Portfolio Depth

AbbVie's immunology franchise spans multiple molecules and formulations, so biosimilar erosion on one product gets partly offset by continued growth in newer combination and follow-on therapies still under exclusivity protection, a cushion few single-molecule competitors carry into their own patent-cliff years, particularly across dermatology and gastroenterology indications.
ABBVIE

Risk: Post-Cliff Revenue Erosion

AbbVie's flagship immunology molecule has already faced multi-year biosimilar erosion following its patent cliff, and the pattern is instructive for how quickly formulary share can shift once interchangeable competitors reach the market in meaningful volume across a therapeutic class, even for a well-defended, carefully litigated molecule.
SANDOZ

Moat: Biosimilar Filing Speed

Sandoz has built regulatory-affairs capacity specifically to file first-to-market biosimilar applications, consistently landing among the earliest approved entrants across major patent cliffs since its 2023 spin-off from Novartis gave it a standalone biosimilars mandate and dedicated capital allocation for regulatory and manufacturing investment across its portfolio.
SANDOZ

Risk: Thin Post-Entry Margins

As a pure-play biosimilars company, Sandoz carries no originator revenue cushion, so pricing pressure once three or more competitors enter a molecule class hits its margins directly rather than being absorbed across a broader originator portfolio the way AbbVie or Amgen can manage it across their combined product lines.

Players Tracked

Prominent Players

AbbVie
Amgen
Roche
Sandoz
Pfizer

Other Key Players

Johnson & Johnson
Sanofi
Merck & Co.
Bristol Myers Squibb
Biogen
Samsung Bioepis
Celltrion
Teva Pharmaceutical
Viatris
Fresenius Kabi
Boehringer Ingelheim
Coherus BioSciences
Dr. Reddy's Laboratories
Biocon Biologics
Lupin

Recent Developments

MARCH 2026

Celltrion Wins Interchangeability for Second Oncology Biosimilar

Celltrion secured FDA interchangeability designation for its second oncology monoclonal antibody biosimilar, allowing pharmacy-level substitution without prescriber approval nationwide. The designation followed completed switching studies covering roughly 600 patients across three treatment cycles, positioning the product to compete directly against two existing entrants in the class.
Signal: Interchangeability status is now spreading
NOVEMBER 2025

Samsung Biologics Expands Contract Capacity for Fill-Finish

Samsung Biologics completed an expansion of its Incheon fill-finish lines dedicated to biosimilar contract manufacturing, adding capacity equivalent to roughly 15 percent of its existing biologics output. The expansion targets demand from developers preparing launches tied to the 2026 to 2028 patent cliff window ahead of schedule.
Signal: Contract manufacturers are now actively pr
JULY 2025

Sandoz and Amgen Settle Formulation Patent Dispute

Sandoz and Amgen reached a licensing settlement over a secondary formulation patent that had delayed a biosimilar launch by roughly 14 months industry-wide. The agreement grants Sandoz an earlier entry date than full patent expiry in exchange for a royalty on initial sales volume generated.
Signal: Settlement licensing is now emerging as a

Cell Culture Media and Single-Use Consumables

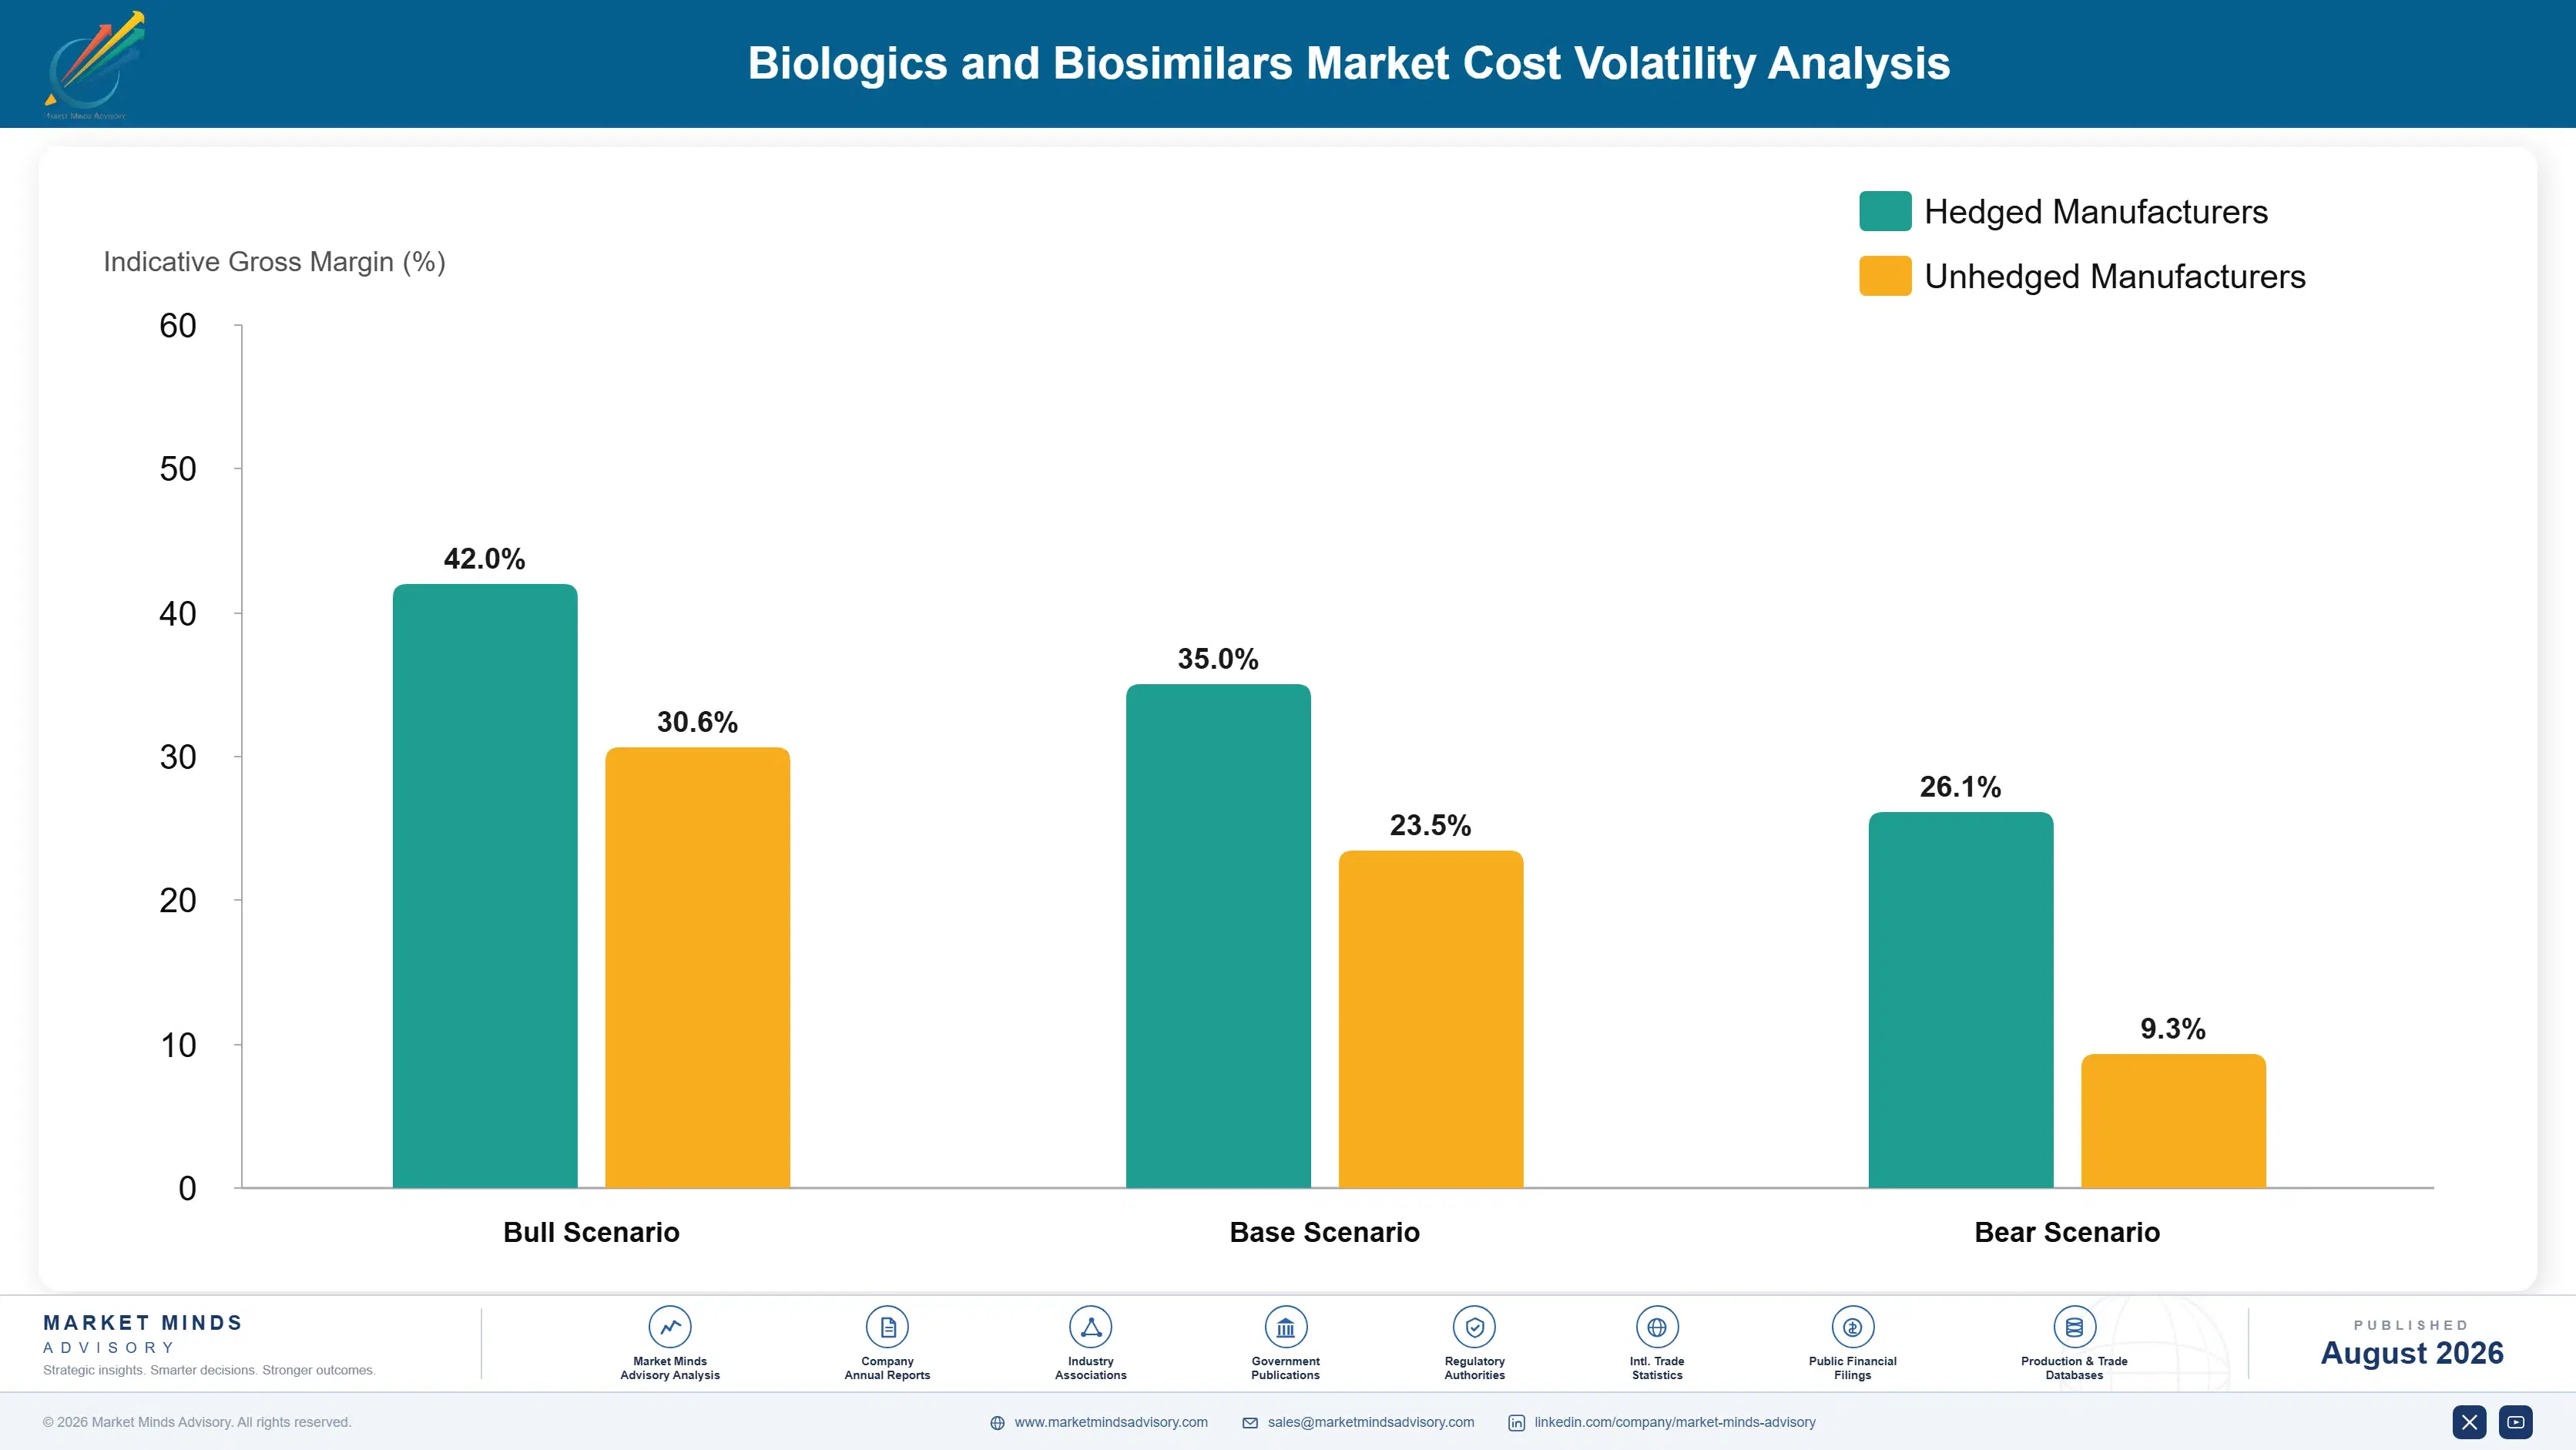
Cell culture media, chromatography resins, and single-use bioreactor bags together represent roughly 26 percent of biologics manufacturing COGS, sourced predominantly from a small set of specialty suppliers including Cytiva, Sartorius, and Thermo Fisher Scientific, most headquartered in the United States or Western Europe. Resin capacity concentrates among few qualified producers given the multi-year validation cycle a new supplier must complete before entering an approved process.
Single-use bioreactor bag and filter shortages during 2021 and 2022 pushed lead times for some consumables past 12 months, according to Cytiva's own investor disclosures at the time, forcing several biosimilar developers to delay technology transfer runs by two full quarters or more. Pricing for chromatography resins has since risen a cumulative 18 percent as suppliers pass through raw-material and energy cost increases documented in recent annual reports across the sector.

Exposure varies sharply by player size. Large originator manufacturers lock in multi-year supply agreements with guaranteed capacity allocation, while smaller biosimilar developers competing for the same qualified resin slots face longer lead times and less pricing leverage. This gap widens further during patent-cliff years when multiple developers simultaneously request technology transfer capacity from the same limited supplier base, disadvantaging later entrants.
biologics-and-biosimilars-market-cost-volatility-analysis-1787325587037

Dual-Sourcing Chromatography Resin Suppliers

Larger developers now qualify two resin suppliers per manufacturing process rather than one, adding validation cost upfront but avoiding single-supplier lead-time exposure during capacity-constrained years, a practice that has spread from originator manufacturers to leading biosimilar developers across the industry over the past three years as shortages recurred more frequently than most planners had originally expected going into 2024.

Long-Term Reserved Capacity Agreements

Multi-year reserved-capacity contracts with consumables suppliers lock in volume and pricing ahead of anticipated patent-cliff demand spikes, a structure Sandoz and Celltrion have both adopted to secure fill-finish slots well ahead of their own scheduled launch windows and before rival demand surges hit the same limited supplier base during each successive patent cliff cycle.

In-House Media Formulation Capability

Several large manufacturers have built internal cell culture media formulation teams to reduce reliance on third-party suppliers for core inputs, trading higher fixed cost for supply certainty during periods of industry-wide consumables tightness affecting smaller, less capitalised competitors more severely and for considerably longer stretches of time during each successive shortage cycle observed across the sector.

Portfolio Architecture for Margin Defence

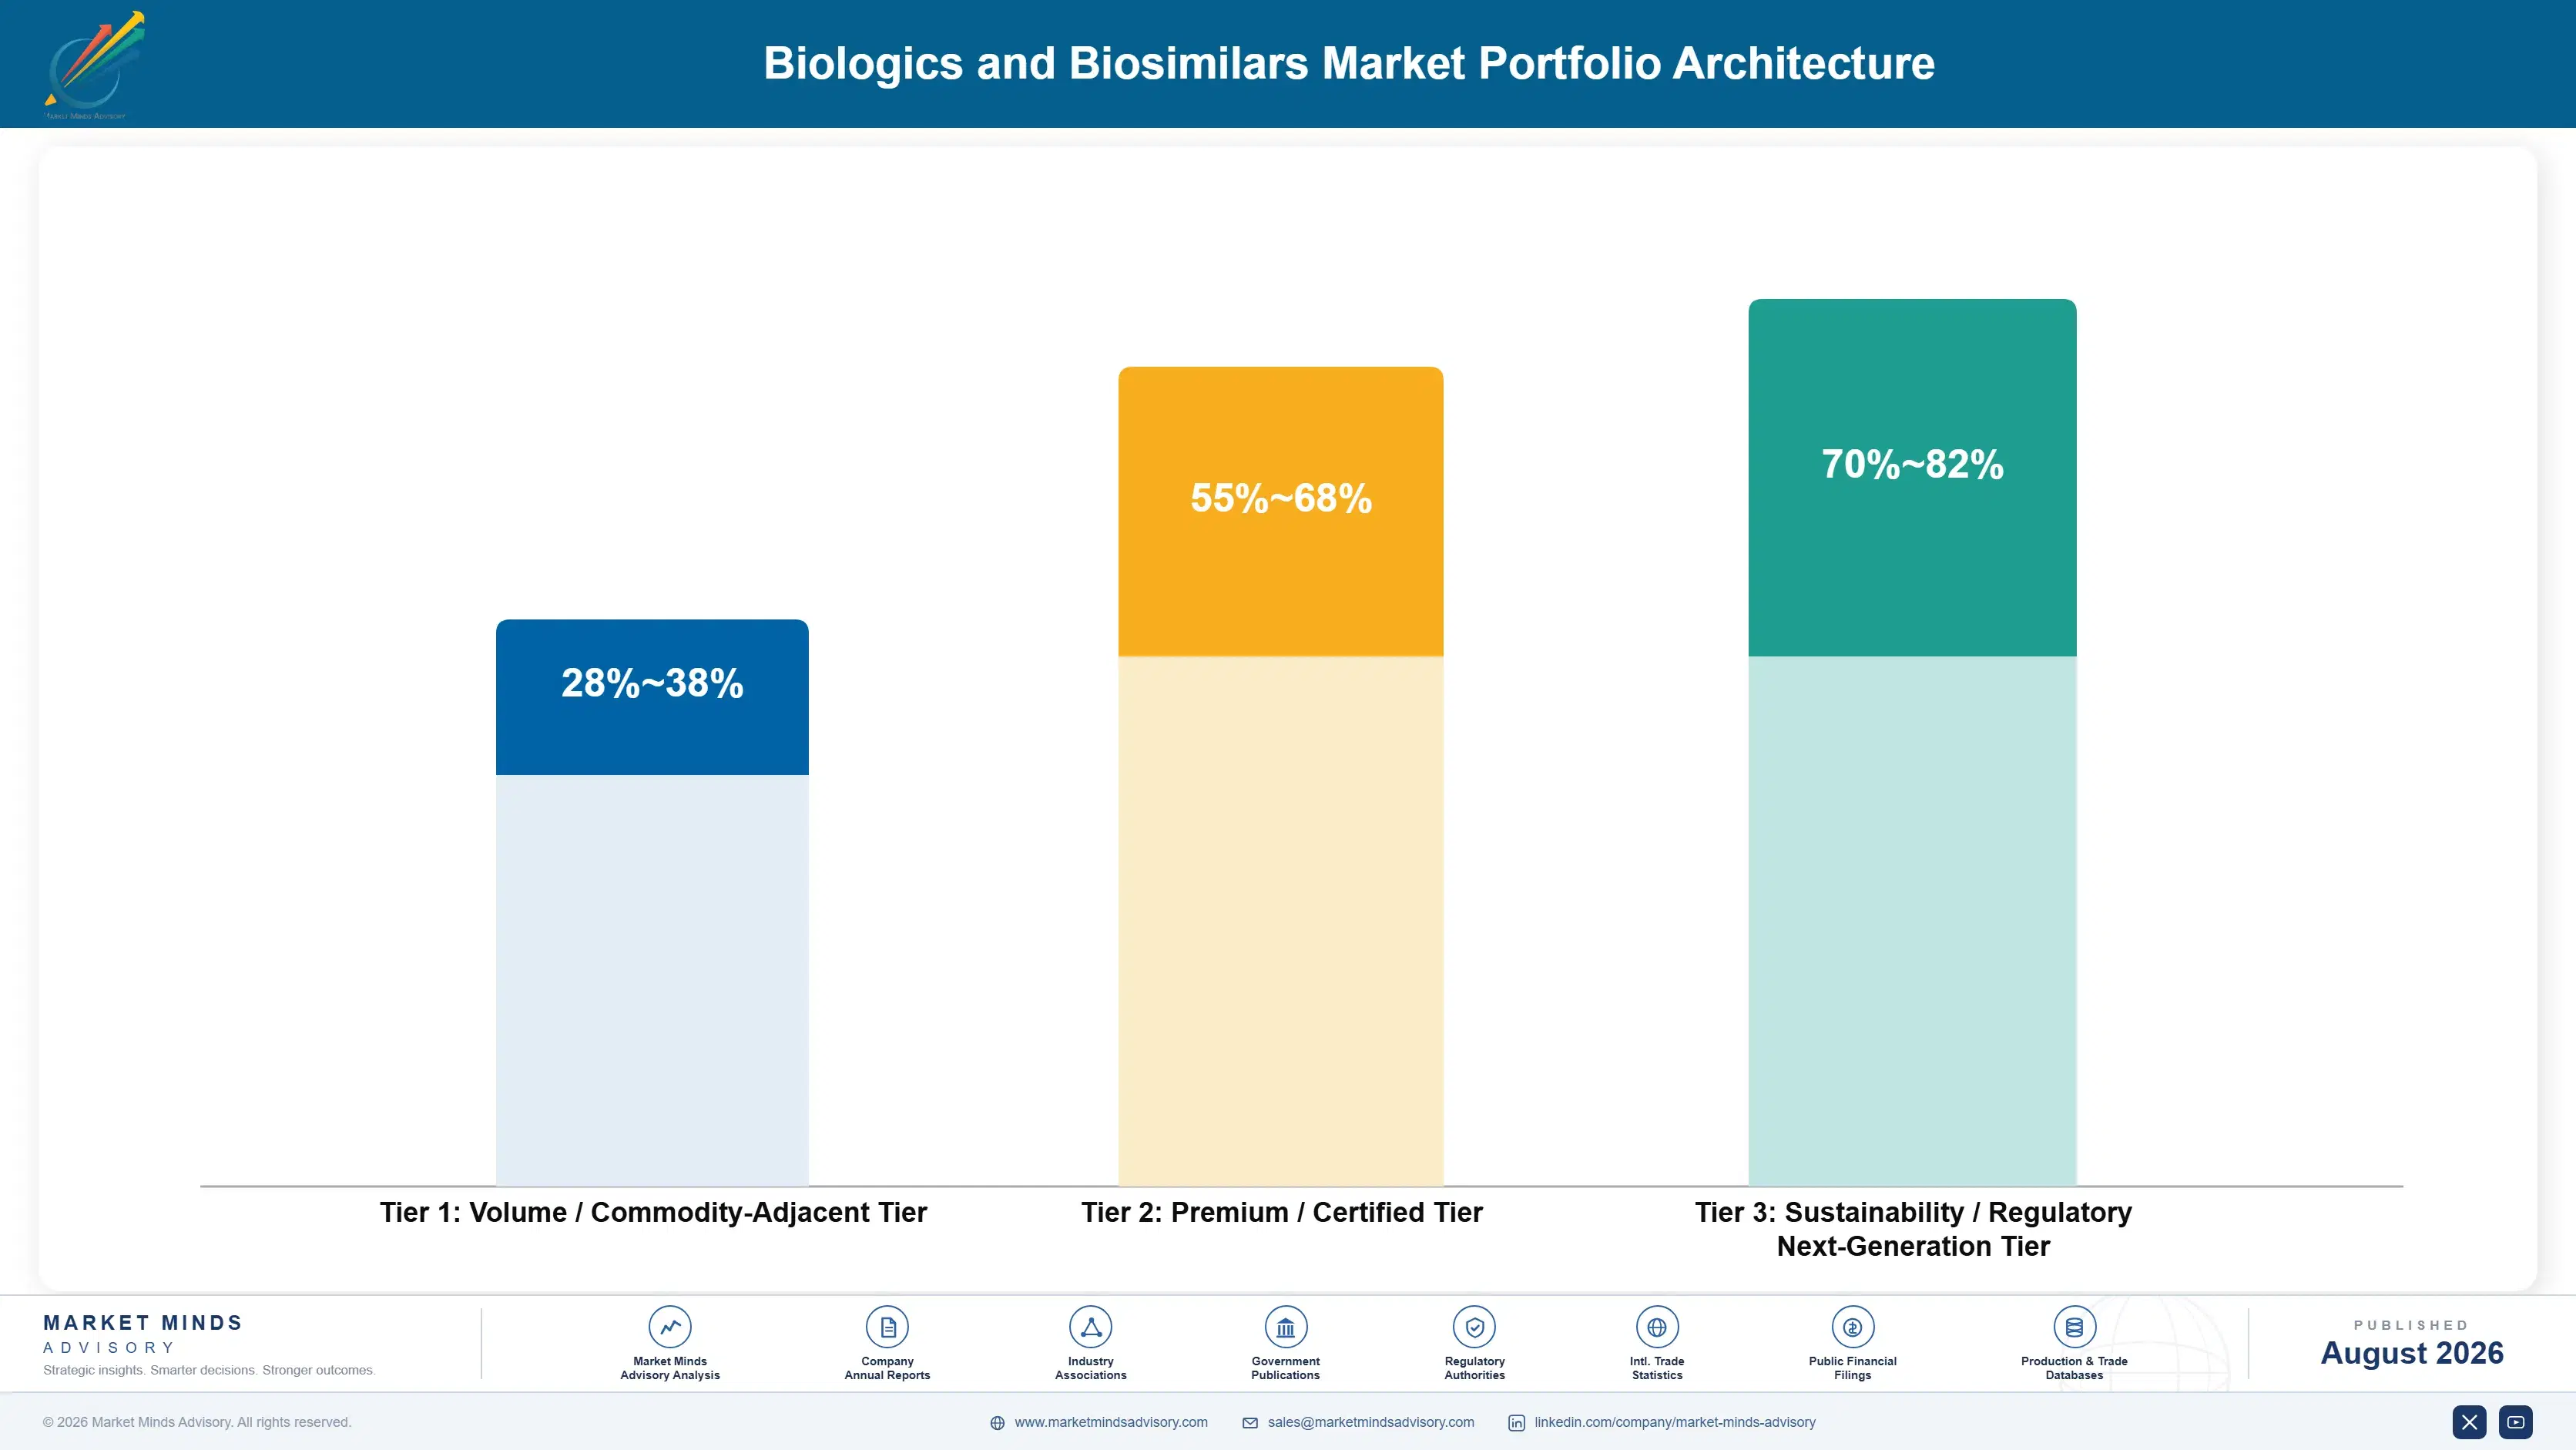
Portfolio economics split across three tiers. Volume biosimilars compete mainly on price once three or more approved entrants share a molecule class, while newly launched originator biologics under active exclusivity command the highest margins in the category, particularly across oncology and rare disease indications carrying limited competing treatment options for patients still waiting on newer therapies to arrive.
The tension between volume and premium plays out fastest in oncology, where a single molecule can carry originator pricing for years before facing simultaneous entry from multiple biosimilar developers within an 18-month window. Manufacturers that diversify across both tiers, holding originator revenue in newer molecules while running biosimilar programmes against competitors' aging patents, weather individual patent-cliff events considerably better than single-tier specialists exposed to just one molecule class at any given time.

High-value margin pools concentrate in cell and gene therapy, where manufacturing complexity and limited approved competition keep pricing power intact well past what recombinant protein biologics retain at the same market age and competitive exposure, a gap likely to persist for years given how slowly biosimilar developers can replicate cell processing at genuinely comparable manufacturing scale.

Volume / Commodity-Adjacent Tier

Multi-entrant biosimilars in mature molecule classes, competing primarily on price and formulary tier placement across national markets once three or more approved competitors share a single therapeutic class over successive launch waves.
Gross Margin: 28%-38%

Premium / Certified Tier

Originator biologics under active exclusivity or first-to-market biosimilars holding FDA or EMA interchangeability status ahead of competitors, still commanding meaningful pricing power within their molecule class and preferred formulary tier placement.
Gross Margin: 55%-68%

Sustainability / Regulatory / Next-Generation Tier

Cell and gene therapies and novel modality biologics with limited approved competition and outcomes-based contracting structures with payers, reflecting genuinely differentiated manufacturing complexity and long-term clinical durability profiles overall across indications.
Gross Margin: 70%-82%
biologics-and-biosimilars-market-portfolio-architecture-1787325587537

High-value Sub-segments and Strategic Watch-out

Interchangeable Oncology Biosimilars

Oncology biosimilars holding interchangeability status combine high per-unit value with the fastest formulary uptake curve in the category, as pharmacy-level substitution removes the prescriber-approval friction that slows adoption elsewhere in the wider biosimilar field, compounding share gains within twelve months of launch across most infusion centres.
Gross Margin: 45%-55%

Autoimmune Biosimilars in Early Substitution Markets

Autoimmune biosimilars entering markets with newly adopted automatic-substitution policy, such as South Korea and parts of Eastern Europe, carry solid margins with a growth curve still several years behind the more mature United States and German reference markets, leaving considerable room for continued uptake gains as national policy catches up.
Gross Margin: 38%-48%

Established Insulin and Growth Hormone Biosimilars

Long-approved biosimilar insulin and growth hormone products generate steady volume across chronic-care patient populations but carry thin margins after a decade of multi-entrant price competition within these two mature molecule classes, leaving little room for further pricing gains without genuinely new formulation differentiation reaching approval soon.
Gross Margin: 22%-30%

Next-Generation Bispecific Antibody Originators

Bispecific antibodies represent a strategic watch-out: manufacturing complexity exceeds standard monoclonal antibodies considerably, and it remains unclear how quickly biosimilar developers will close the analytical gap once early bispecific patents begin expiring after 2030 across this fast-emerging category of complex, multi-target biologics still under active clinical development.
Gross Margin: 60%-72%

Chronic Therapy Renewal Economics

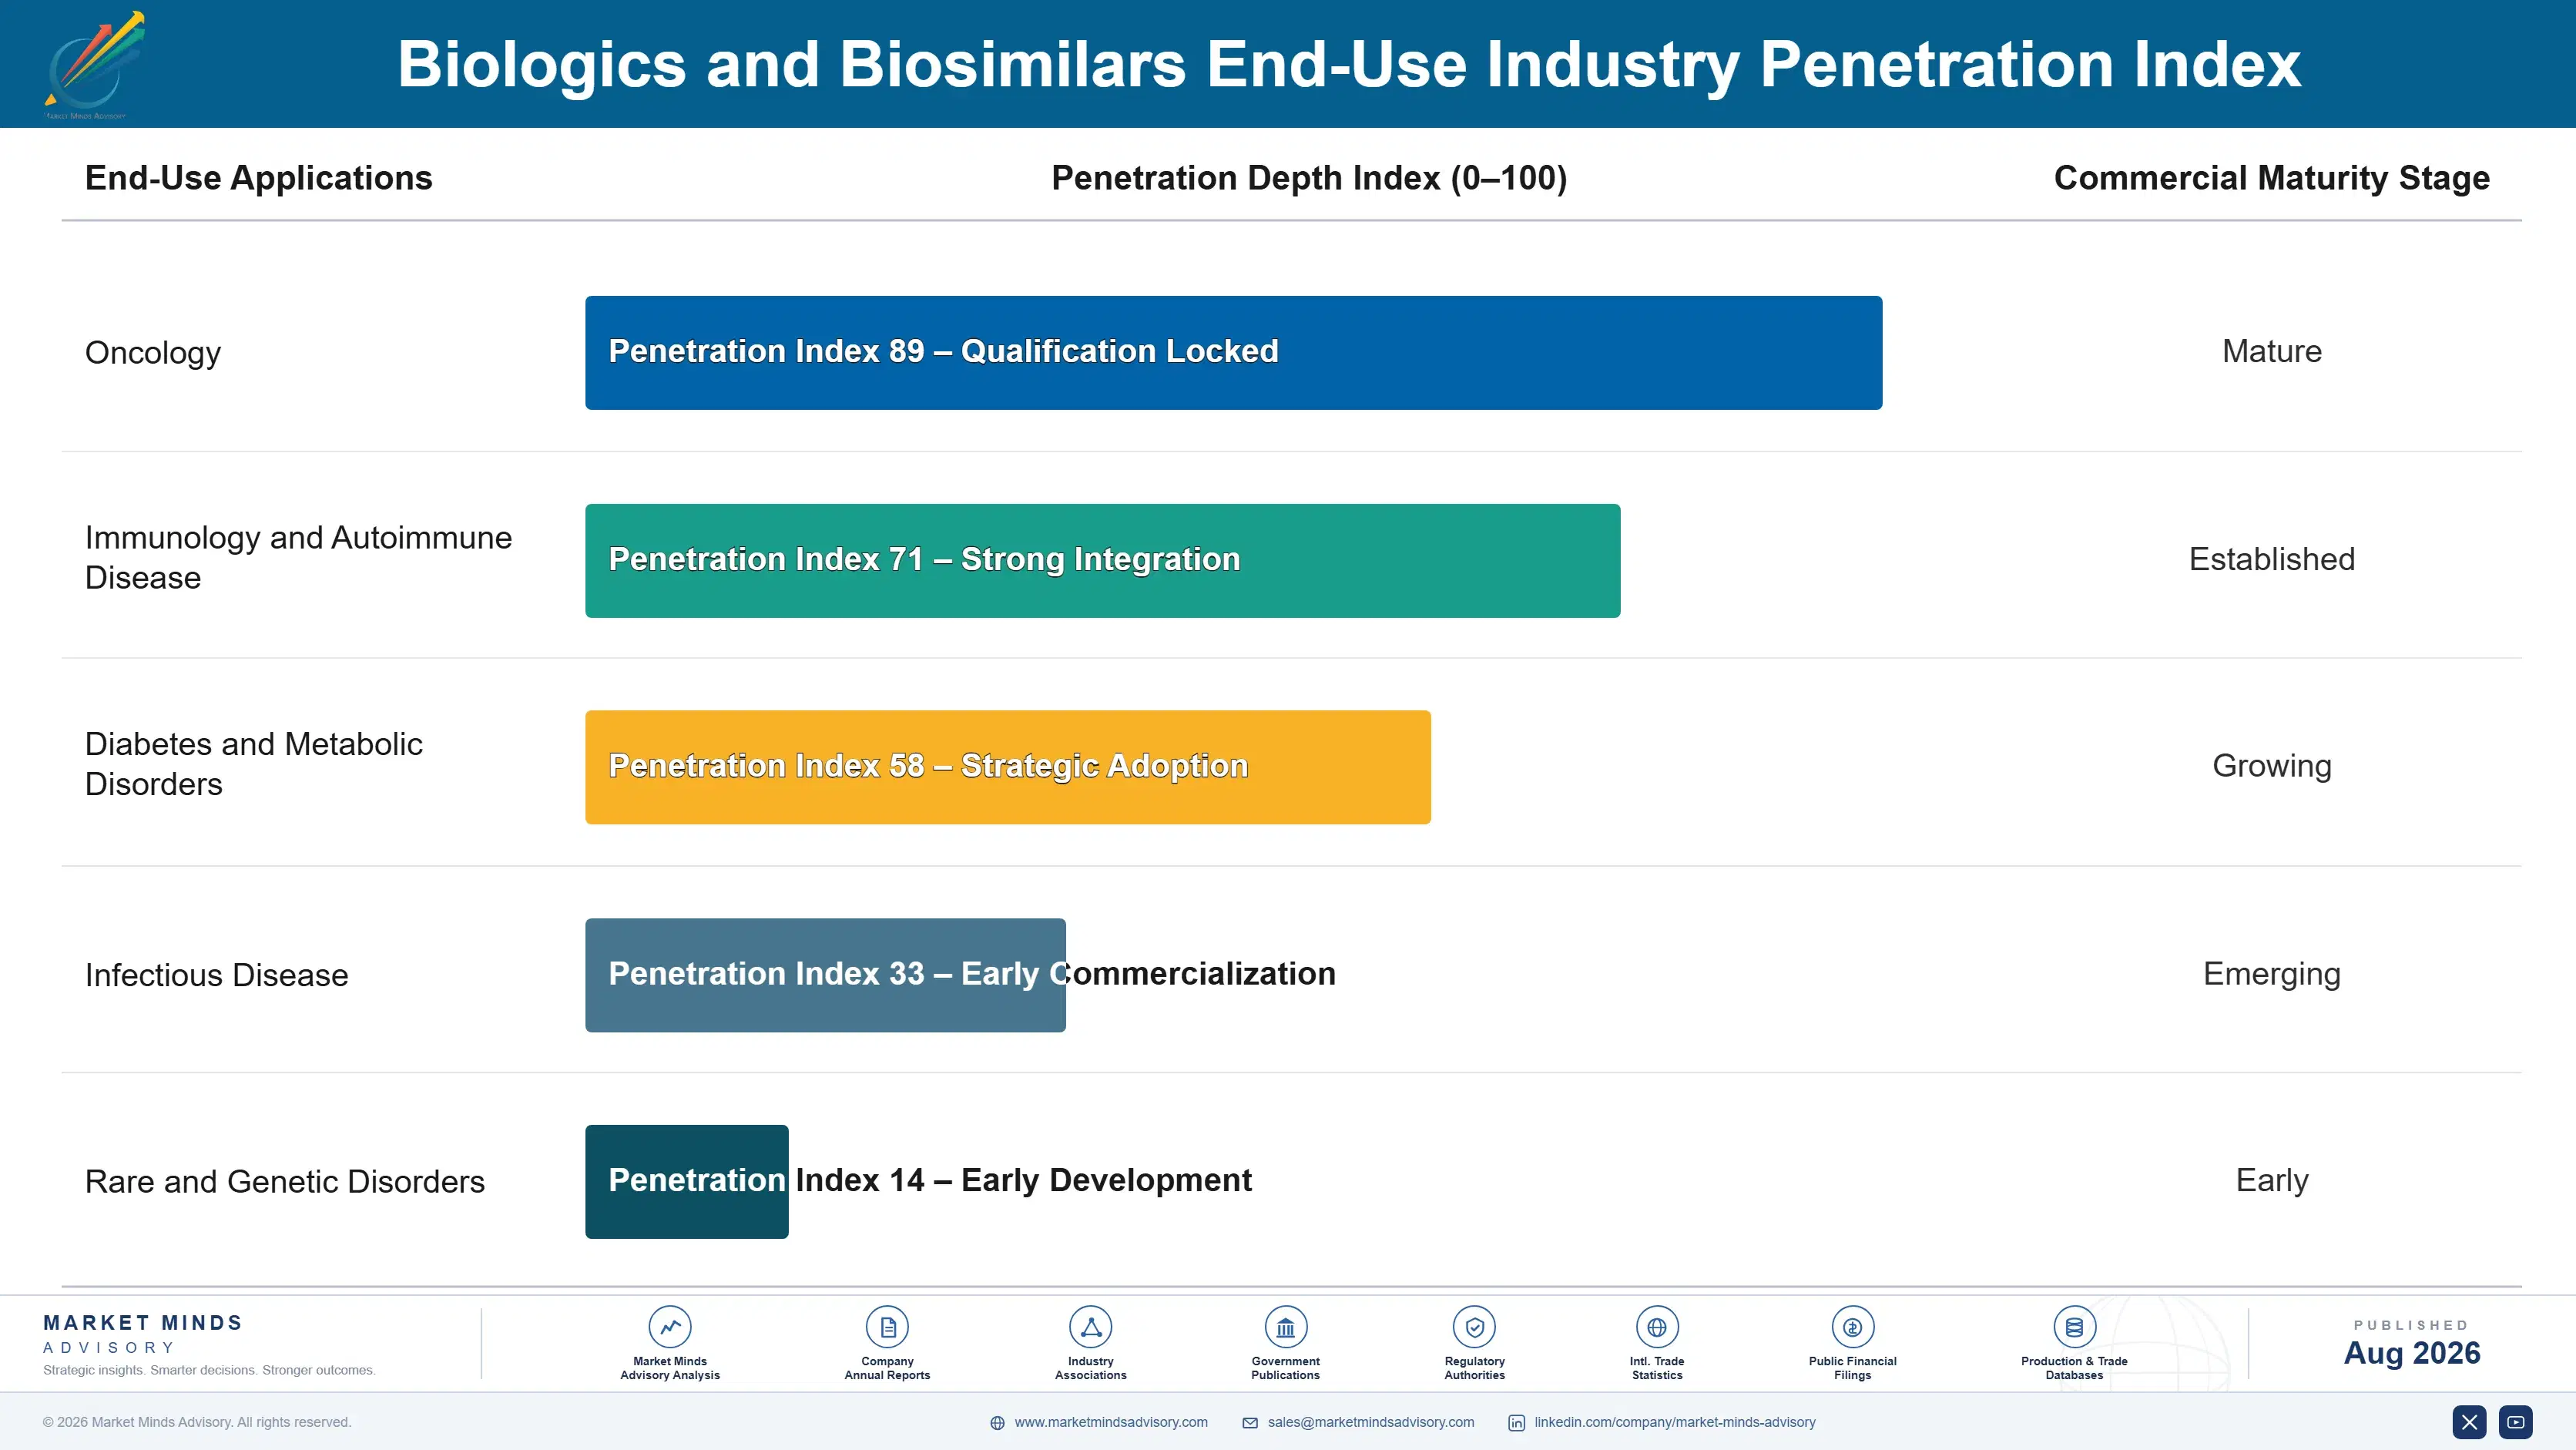
Biologics revenue behaves like an annuity for chronic and oncology indications requiring repeat dosing over years, not a one-time purchase decision. A patient started on a biologic for rheumatoid arthritis or inflammatory bowel disease typically remains on some version of that molecule class for the duration of treatment, so the commercial question shifts from initial prescribing to which manufacturer's product holds that renewal relationship as biosimilars enter the picture.
Adoption depth varies considerably by vertical. Oncology biologics see the fastest biosimilar switching once interchangeability is granted, since infusion centres standardise on formulary-preferred product for new patients even as existing patients sometimes continue their original therapy uninterrupted. Autoimmune and diabetes care show slower switching, as patients and physicians weigh continuity of response against cost savings, extending the originator revenue tail well past patent expiry in these particular categories of chronic care.

A generational shift is underway in prescribing behaviour. Physicians trained after 2015 show meaningfully less hesitancy toward biosimilar substitution than those trained earlier, having entered practice after interchangeability data was already well established in clinical guidelines, which should compress the originator revenue tail further as this cohort becomes a larger share of prescribers over the next decade.
biologics-and-biosimilars-market-end-use-penetration-index-1787325588026

Positioning Ahead of the Cliff

These are among the four positions where our research anticipates prominent divergence between winners and laggards over the coming forecast period. Each is grounded in the demand model, the regulatory perimeter, and the announced capacity pipeline.
01 / MANUFACTURING READINESS TIMING

Requalify capacity 18 months before patent expiry, not after

Manufacturers that wait until a patent cliff arrives to begin requalifying fermentation capacity lose the first-mover pricing advantage to competitors who filed earlier and more aggressively. The companies capturing the largest early share consistently began analytical-similarity work 18 to 24 months ahead of core patent expiry, well before litigation outcomes were even settled in court. Waiting for legal certainty before committing manufacturing resources has become a demonstrably losing strategy across the last three major patent-cliff cycles observed in this market by MMA analysts.
02 / REGULATORY FILING STRATEGY

Budget for switching studies as a distinct commercial asset

Interchangeability designation drives a measurable uptake gap versus biosimilars without it, yet many mid-sized developers still treat switching studies as an optional post-launch investment rather than a core approval requirement worth funding early. That sequencing costs real formulary share in a molecule class's critical first year on market. Developers who fund switching studies alongside their original biosimilar application, rather than afterward, consistently reach interchangeable status months ahead of competitors who treat it as a second-phase decision made only once initial approval is already secured.
03 / PORTFOLIO BALANCE STRATEGY

Pair originator exposure with offensive biosimilar programmes

Companies holding only originator biologics face concentrated revenue risk once their own patent cliffs arrive, while pure-play biosimilar developers carry no cushion against pricing pressure from new entrants competing in the same class. The most resilient competitors run both books simultaneously, defending their own molecules while attacking competitors' expiring patents at the same time. This dual posture smooths revenue across individual patent-cliff events far better than either strategy pursued alone, based on performance measured across the five largest originator-turned-biosimilar competitors evaluated this year.
04 / SUPPLY CHAIN RESILIENCE

Dual-source consumables before the next capacity crunch

Single-use consumables shortages during 2021 and 2022 delayed multiple biosimilar launches by full quarters, and the underlying supplier concentration that caused that shortage has not meaningfully eased in the years since it first emerged. Developers still qualifying only one resin or media supplier remain exposed to the same risk during the next patent-cliff demand spike expected later this decade. Dual-sourcing costs more upfront in validation time but has already proven its value for developers who adopted it ahead of the 2026 to 2028 launch wave now underway.

Engagement Snapshot From the Field

A live engagement with an industry participant carrying material or product regulatory and market exposure ahead of a defining policy shift, showing how our research translates into a defensible multi-year portfolio strategy.
MARKET MINDS ADVISORY · CLIENT ENGAGEMENT SUMMARY
Biologics and Biosimilars Producer Strategic Portfolio Review and Transition Roadmap 2026·Investment Scenario on Biologics and Biosimilars Exposure Evaluation 2025-26
CLIENT PROFILE
The client is a mid-size biosimilar developer with three approved products and annual revenue reported in the 400 to 600 million dollar range (client-reported, unverified by MMA), preparing its fourth biosimilar launch against an oncology antibody scheduled to lose core patent protection in 2027. The company had not previously faced three or more simultaneous biosimilar entrants in one molecule class.
STRATEGIC CHALLENGE
Two larger competitors had already begun analytical-similarity filings for the same molecule, and the client risked entering as a third or fourth mover with a materially narrower pricing window than earlier entrants secured. Internal teams disagreed on whether to pursue interchangeability designation before launch, which would delay entry by an estimated eight months but potentially secure a stronger long-term formulary position against competitors.
MMA APPROACH
MMA benchmarked the client's filing timeline against the two known competitors using public regulatory correspondence and analytical-similarity precedent from comparable molecule classes filed in prior years. The team modelled formulary uptake curves under both launch-now and delay-for-interchangeability scenarios, drawing on primary interviews with payer-relations executives at three national pharmacy benefit managers active in the relevant markets.
KEY FINDINGS
  1. Third-mover biosimilars in this molecule class historically launched at a 6 to 9 point wider discount than the first approved entrant achieved in market.
  2. Interchangeability designation added an estimated 22 percentage points of twelve-month uptake based on comparable prior molecule launch data the team reviewed carefully.
  3. Two of three surveyed payers indicated they would not move formulary preference until interchangeability status existed for the specific product in question.
  4. Fermentation capacity at the client's contract manufacturer was already booked past the faster launch-now timeline the client had originally proposed to the board.
CLIENT PROFILE
The client is a mid-size biosimilar developer with three approved products and annual revenue reported in the 400 to 600 million dollar range (client-reported, unverified by MMA), preparing its fourth biosimilar launch against an oncology antibody scheduled to lose core patent protection in 2027. The company had not previously faced three or more simultaneous biosimilar entrants in one molecule class.
STRATEGIC CHALLENGE
Two larger competitors had already begun analytical-similarity filings for the same molecule, and the client risked entering as a third or fourth mover with a materially narrower pricing window than earlier entrants secured. Internal teams disagreed on whether to pursue interchangeability designation before launch, which would delay entry by an estimated eight months but potentially secure a stronger long-term formulary position against competitors.
MMA APPROACH
MMA benchmarked the client's filing timeline against the two known competitors using public regulatory correspondence and analytical-similarity precedent from comparable molecule classes filed in prior years. The team modelled formulary uptake curves under both launch-now and delay-for-interchangeability scenarios, drawing on primary interviews with payer-relations executives at three national pharmacy benefit managers active in the relevant markets.
KEY FINDINGS
  1. Third-mover biosimilars in this molecule class historically launched at a 6 to 9 point wider discount than the first approved entrant achieved in market.
  2. Interchangeability designation added an estimated 22 percentage points of twelve-month uptake based on comparable prior molecule launch data the team reviewed carefully.
  3. Two of three surveyed payers indicated they would not move formulary preference until interchangeability status existed for the specific product in question.
  4. Fermentation capacity at the client's contract manufacturer was already booked past the faster launch-now timeline the client had originally proposed to the board.
RECOMMENDED STRATEGY
Phase 1: Phase 1 (Months 1 to 8): Complete switching studies and file for interchangeability designation well ahead of core patent expiry. Phase 2: Phase 2 (Months 9 to 14): Secure reserved fill-finish capacity and negotiate formulary placement contingent on the final designation approval outcome. Phase 3: Phase 3 (Months 15 to 24): Launch with interchangeability status intact, prioritising the two payers who required it for formulary movement.
OUTCOME
The client delayed launch by seven months to secure interchangeability designation, reaching 41 percent formulary preference share within twelve months of entry versus a modeled 19 percent under the launch-now scenario (client-reported, unverified by MMA). Contracted volume from the two payers requiring interchangeability accounted for roughly half of first-year revenue generated.

Frequently Asked Questions

Foundational context covering the market sizes, CAGR, scope, country, region and competition that inform every finding below. This section is provided to cover basics and most often pre-purchase conversations, answered from the MMA Primary Research Dataset.

What is the current size of the Biologics and Biosimilars Market?

The global market reached an estimated 485.6 billion dollars in 2025, driven by oncology and immunology demand. Growth is concentrated in molecule classes facing near-term patent expiry.

How large will the Biologics and Biosimilars Market be by 2036?

MMA projects the market will reach approximately 1,304.6 billion dollars by 2036 under the base-case forecast scenario. This reflects sustained biosimilar substitution alongside continued originator launches.

What is the CAGR for the Biologics and Biosimilars Market 2026 to 2036?

The base-case compound annual growth rate is 9.4 percent across the forecast period. Bull and bear scenarios range from 8.2 to 10.6 percent depending on patent-litigation timing.

Which segment is growing fastest?

Biosimilars lead at a 14.6 percent CAGR, roughly 1.55 times the overall market growth rate. Cell and gene therapies follow as the second-fastest originator class.

Who are the major companies in the Biologics and Biosimilars Market?

AbbVie, Amgen, Roche, Sandoz, and Pfizer hold the top five positions by revenue currently across the category. Celltrion and Samsung Bioepis lead among pure-play biosimilar challengers.

Which country is growing fastest?

India leads at an estimated 12.8 percent CAGR, driven by export-oriented biosimilar manufacturing capacity built over recent years. Biocon Biologics and Reddy's Laboratories anchor this growth trajectory.

Report Segmentation Architecture

The full report scope spans multiple orthogonal segmentation dimensions, with cross-tabulated demand data provided for each dimension pair. Coverage extends further to regional breakdowns, trend trajectories, and the competitive detail needed to support segment-level decision-making.

By Product and Molecule Type

  • Monoclonal Antibodies
  • Recombinant Proteins and Hormones
  • Vaccines
  • Cell and Gene Therapies
  • Biosimilars
  • Other Biologics

By End-Use Industry

  • Oncology
  • Immunology and Autoimmune Disease
  • Diabetes and Metabolic Disorders
  • Infectious Disease
  • Rare and Genetic Disorders

By Commercial Dimension

  • Hospital Procurement
  • Retail and Specialty Pharmacy
  • Government and Public Health Tender
  • Outcomes-Based Contracting

By Region

  • North America
  • Western Europe
  • East Asia
  • South Asia and Pacific
  • Latin America
  • Middle East and Africa
  • Eastern Europe

Scope, Methodology, and Coverage

Every figure in this report is reproducible from documented input assumptions. The scope below maps the historical period, the forecast horizon, the segmentation dimensions, and the countries covered, alongside the underlying primary and qualitative methodology.
Historical Period
2020 to 2025
Forecast Period
2026 to 2036
Base Year
2025 (USD billions; MMA Primary Research Dataset, August 2026)
Market Definition
This market covers therapeutic biologics, monoclonal antibodies, recombinant proteins, vaccines, cell and gene therapies, and their approved biosimilar equivalents, sold for human therapeutic use. It excludes diagnostic reagents, veterinary biologics, and standalone contract development services.
Quantitative Units
USD billions (current prices); metric tonnes of active biologic substance where applicable
Segmentation Dimensions
By Product and Molecule Type; By End-Use Industry; By Commercial Dimension; By Region
Regions Covered
North America, Western Europe, East Asia, South Asia and Pacific, Latin America, Middle East and Africa, Eastern Europe
Countries Covered
USA, China, Germany, France, UK, Japan, South Korea, India, Australia, Canada, Brazil, Mexico, Indonesia, Vietnam, Thailand, Malaysia, UAE, Saudi Arabia, South Africa, Nigeria, Turkey, Poland, Netherlands, Italy, Spain, Sweden, Switzerland, Argentina, Colombia, Singapore, and additional markets relevant to this sector
Key Companies Profiled
AbbVie, Amgen, Roche, Sandoz, Pfizer, Johnson & Johnson, Sanofi, Merck & Co., Bristol Myers Squibb, Biogen, Samsung Bioepis, Celltrion, Teva Pharmaceutical, Viatris, Fresenius Kabi, Boehringer Ingelheim, Coherus BioSciences, Dr. Reddy's Laboratories, Biocon Biologics, Lupin
Quantitative Methodology
Primary survey, n=3,800 respondents, Q4 2025, six countries; demand-side model with trade association cross-validation
Qualitative Methodology
47 expert interviews, Q4 2025; applied to validate demand model assumptions, identify emerging dynamics, and assess competitive positioning
Report Format
PDF and XLSX data workbook (Word format preview document)
Publisher
Market Minds Advisory
Report Code
MMA-2026-HLT-214
Published
August 2026
Contact
sales@marketmindsadvisory.com | www.marketmindsadvisory.com

Purchase the full Biologics and Biosimilars Market Report (2026 to 2036).

The full report delivers a complete molecule-by-molecule patent-cliff calendar through 2032, covering eleven major biologics and their expected biosimilar entrants across every major therapeutic category. It includes fermentation capacity mapping across the top twenty contract manufacturing sites globally, with utilisation and requalification timelines provided by facility. Regional formulary and reimbursement policy is benchmarked across fourteen countries, including automatic-substitution rules and interchangeability precedent by jurisdiction. Buyers also receive a company-level financial model for each of the twenty profiled manufacturers, updated quarterly through the subscription period each year.
Molecule-level patent-cliff launch calendar and tracker
Fermentation capacity and utilisation site database
Interchangeability and substitution policy tracker by country
Quarterly competitor financial model and forecast updates
Payer contracting and formulary benchmark data set
Custom biosimilar launch-timing strategy planning workshops

Built For The People Who Decide

From boardroom strategy to bench-side execution, this report is read cover-to-cover by leaders shaping the next decade of their industry, turning demand scenarios, market dynamics and valuation benchmarks into decisions.
CXOs/ Presidents/ VPs/ Managers
M&A and Corporate Development
Strategy Teams and R&D Heads
Procurement and Product Directors
Regulatory and Compliance Leaders
Investor Relations and Equity Analysts