Market Minds Advisory
Biofortification Market

Biofortification Market: Biofortification Market. Public Health Targets Meet Commercial Seed Genetics

Governments chasing measurable anemia and vitamin A deficiency reduction targets are pulling biofortified wheat, rice, and bean varieties out of NGO distribution programs into mainstream commercial seed catalogs across dozens of countries worldwide.

Lead Analyst

Published

September 2026

Make Smarter Decisions with Customized Research Insights

Request a free sample report and evaluate market opportunities, growth trends, and competitive dynamics relevant to your business needs.

2025 MARKET VALUE$0.3BMarket Size 2025
2036 FORECAST VALUE$1.1BBase Case , 2026 to 2036
CAGR 2026 TO 203612.4 %Bull 13.7% / Bear 11.0%
INCREMENTAL OPPORTUNITY$0.8BNet 10- year value creation
EXPANSION MULTIPLE3.22x2036 value over 2026 base
Strategic Levers
M&A Pipeline
Regional Outlook
Country Rankings
Competitive Intelligence
Segmental Deep-dive
Call-Us : 91 93563 13602

Executive Snapshot and Market Trajectory.

Biofortified crop varieties have moved decisively beyond their original NGO distribution model into mainstream commercial seed catalogs, as national governments increasingly write nutrition traits directly into public procurement specifications rather than treating them as a development-sector afterthought. Farmers increasingly encounter these varieties through ordinary retail seed channels.
Iron-biofortified beans and vitamin A-enriched cassava and sweet potato now grow fastest, reflecting the sheer scale of Sub-Saharan African adoption programs, while India's government-backed wheat and rice biofortification effort represents the single largest national program by farmer reach anywhere in the world. South Asia and Pacific commands the largest revenue share given this concentrated program scale. This concentration reflects genuine program scale rather than any single dominant crop category driving regional totals.
Seed companies increasingly stack biofortification traits alongside drought tolerance and disease resistance rather than marketing nutrition as a standalone selling point, since farmers still weigh agronomic performance more heavily than micronutrient content when choosing which variety to plant each season. Companies that master this dual positioning increasingly win preferred placement across both government procurement channels and voluntary commercial farmer purchasing decisions simultaneously, a combination rivals rarely manage.
Market Definition
This report covers the global market for biofortified crop varieties bred or engineered to carry elevated levels of vitamin A, iron, or zinc, including seed sales, licensing, and premium crop pricing across major staple crop categories. It excludes fortification achieved through post-harvest additive processing except where directly compared for competitive context.
Base Year Value
$0.3B in 2025 (MMA Primary Research Dataset, September 2026)
Forecast Period
2026 to 2036, eleven discrete annual values
CAGR
12.4% base case. Bull 13.7%. Bear 11.0%.
Fastest Growth Segment
Biofortified Beans and Pulses: 14.8% CAGR
Fastest Growth Country
India: 15.6% CAGR
Fastest Growth Region
South Asia and Pacific: 14.6% CAGR
Largest Region
North America: 22% of 2025 global value
Market Leaders
Bayer AG, Corteva Agriscience, Syngenta AG, UPL Limited, Kaveri Seed Company Limited. Source: MMA Analysis based on company annual reports and hectare adoption data.
Primary Survey
n=3,800 procurement and R&D decision-makers, Q4 2025, six countries
Methodology
Demand-side build-up, cross-validated against public data, 47 expert interviews

Biofortification Market Forecast Scenarios

biofortification-market-size-forecast-scenario-1789957651722
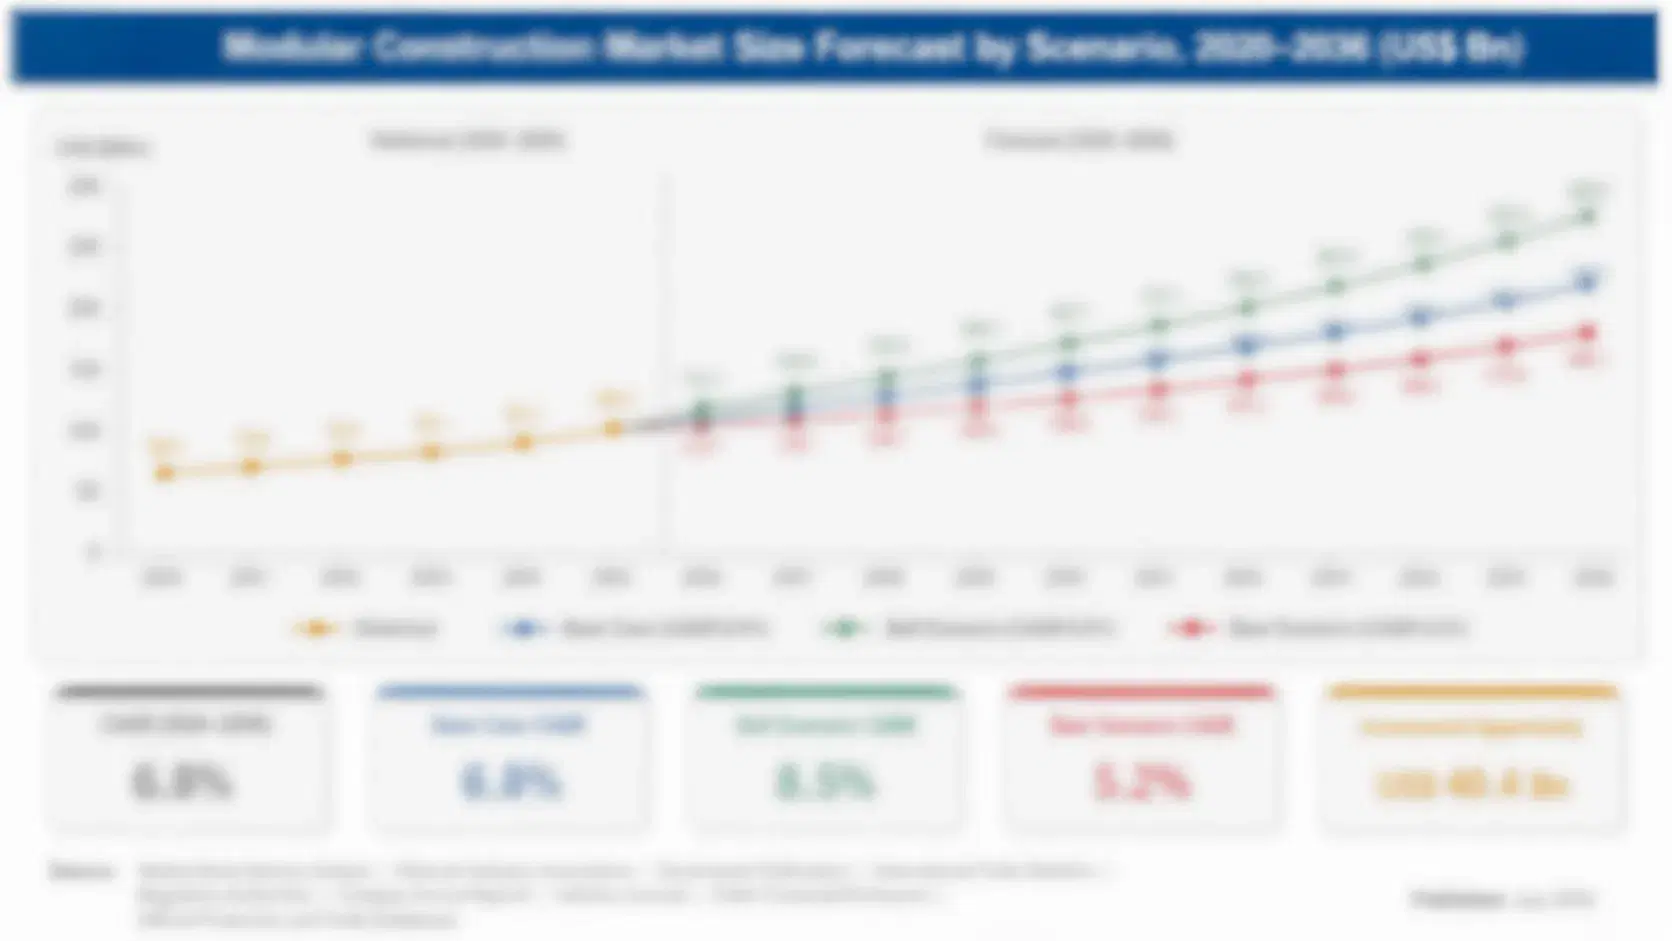
Global biofortified crop adoption grew at an accelerating pace between 2020 and 2025, as national governments across South Asia and Sub-Saharan Africa expanded biofortified variety inclusion in public seed distribution programs and school feeding procurement specifications during the period. The historical growth rate ran close to 11.2% annually across this period, reflecting accelerating adoption momentum nationwide across multiple program countries.
The base case assumes continued government procurement mandate expansion, growing private seed company commercialization of biofortified hybrid varieties, and increasing trait-stacking that pairs nutrition with agronomic performance improvements. Together these three mechanisms sustain strong double-digit growth even as farmer awareness gaps in some markets continue to moderate the pace of variety replacement across smallholder-dominated regions. Continued private seed company investment in trait-stacked hybrid development represents an emerging fourth mechanism adding meaningful incremental commercial volume beyond the base case assumption.
Accelerated government procurement mandates tied to national anemia reduction targets could pull forward adoption well ahead of the base case timeline. Conversely, persistent seed multiplication and distribution infrastructure gaps in smallholder-dominated markets could slow scale-up considerably below current projections. Either scenario would meaningfully reshape near-term investment decisions across breeding, multiplication, and government partnership development. Program funders are watching both scenarios closely.

Nutrition Traits Move Into Commercial Seed Catalogs

Biofortification occupies a genuinely unusual commercial position, since the crops themselves emerged from public research institutions and development funding rather than private breeding investment, yet commercial seed companies now compete directly to distribute and multiply these same varieties. Few agricultural technologies carry this much cross-sector complexity, since most commercial seed products never require navigating public health policy alongside conventional agronomic performance standards.
FARMER ADOPTION RATE38%smallholder farmer adoption share across active program regions today
YIELD PARITY ACHIEVEMENT92-98%biofortified variety yield relative to conventional equivalent varieties
TOP PRODUCING COUNTRY SHARE29%India share of total global biofortified hectares planted
SEED PRICE PREMIUM8-15%typical premium over conventional certified seed pricing today
PROGRAM COUNTRY COVERAGE40+ countriesnations with active biofortification distribution programs running currently
VARIETY RELEASE CYCLE7-9 yearstypical breeding timeline from cross to commercial release
That transition rewards seed companies who built distribution relationships with national agricultural extension networks and government procurement agencies early, since biofortified variety adoption still depends heavily on public program endorsement rather than pure open-market demand. Companies increasingly treat government relationship management as a genuine competitive capability rather than a peripheral regulatory function. Companies that built these relationships years ago increasingly command procurement terms that reflect genuine institutional trust rather than pure commodity seed competition on price alone.
Trait-stacking has become the dominant commercialization strategy, since farmers respond more reliably to yield and disease resistance improvements bundled alongside nutrition traits than to nutrition content marketed on its own without comparable agronomic performance guarantees. This approach increasingly determines which companies win the largest, most durable government procurement contracts available across multiple program countries simultaneously.
"Biofortification stopped being a development program and started being a seed company product line. That shift changes everything about how this market behaves."
Director, Agricultural Biotechnology and Seed Genetics Practice · MMA Agricultural Biotechnology and Seed Genetics Practice · September 2026

Market Trends

Government Procurement Mandates Pull Biofortified Seed Into Public Programs

National governments across India, Rwanda, Nigeria, and an expanding list of additional countries have begun writing biofortified variety requirements directly into public seed distribution and school feeding procurement specifications, converting what was previously voluntary NGO-driven adoption into policy-mandated demand. India's public distribution system has progressively expanded fortified rice inclusion requirements, creating guaranteed procurement volume that private seed companies increasingly compete to supply. This shift from voluntary to mandated demand fundamentally changes the commercial calculus for seed companies, since guaranteed government procurement volume justifies seed multiplication investment that pure market-based demand previously could not reliably support at comparable scale.
Market Impact: Targets deficiency reduction by 30 percent
Private Seed Companies Commercialize Hybrid Biofortified Varieties

Major seed companies have moved beyond distributing open-pollinated varieties developed by public research institutions toward commercializing their own proprietary hybrid biofortified varieties, capturing licensing revenue and brand differentiation that open-pollinated distribution never provided. This shift lets companies combine biofortification traits with proprietary yield and disease resistance genetics developed through their own breeding programs, creating genuinely differentiated commercial products rather than generic public-domain varieties. Seed companies increasingly view biofortified hybrid development as a legitimate product category deserving dedicated breeding investment rather than a corporate social responsibility side project. This shift also opens revenue streams generic public-domain distribution never allowed.
Market Impact: Improves repurchase rates by 35 percent

Market Opportunities and Growth Drivers

National Anemia and Vitamin A Deficiency Targets Drive Procurement

Government health ministries across South Asia and Sub-Saharan Africa have adopted measurable anemia and vitamin A deficiency reduction targets tied to national nutrition strategies, creating direct policy pressure for agriculture ministries to expand biofortified crop distribution as a cost-effective public health intervention. India's national nutrition strategy explicitly cites biofortified crop adoption as a delivery mechanism for reaching rural populations that supplement distribution programs struggle to serve consistently. This cross-ministerial alignment between health and agriculture policy has proven durable across multiple government administrations, unlike many development-sector initiatives that lose momentum with political transitions.
Market Impact: Limits adoption to 38 percent uptake

Climate-Resilient Trait Stacking Improves Commercial Viability

Breeding programs increasingly stack biofortification traits alongside drought tolerance and disease resistance genetics, addressing the core farmer objection that nutrition traits alone provide insufficient reason to switch from familiar conventional varieties. This stacking approach has meaningfully improved farmer adoption rates in pilot regions where combined varieties demonstrated yield stability advantages during drought years alongside their nutritional benefits. Seed companies report that trait-stacked biofortified varieties achieve considerably higher voluntary repurchase rates than nutrition-only varieties lacking comparable agronomic performance credentials. Several major seed companies have begun publishing comparative trial data documenting these combined performance advantages directly to farmer audiences through extension networks.
Market Impact: Delays scale-up 2 seasons

Market Restraints and Challenges

Farmer Willingness to Pay Lags Behind Program Ambitions

Many smallholder farmers remain reluctant to pay a premium for biofortified seed absent clear yield or agronomic advantages, since nutrition content alone does not directly affect farm income the way yield improvements do. The root cause is economic: farmers making seed purchase decisions under tight budget constraints prioritize traits with observable, immediate financial return over nutrition benefits that primarily accrue to household consumption rather than farm revenue. This limits voluntary market-based adoption outside government-subsidized distribution programs considerably. Seed companies increasingly address this by bundling biofortification with demonstrable yield improvements rather than marketing nutrition content as a standalone value proposition.
Market Impact: Covers 40 plus national programs

Seed Multiplication Infrastructure Gaps Slow Scale-Up

Many smallholder-dominated markets lack the certified seed multiplication and distribution infrastructure needed to scale biofortified variety availability at the pace government procurement mandates increasingly demand. The root cause is chronic underinvestment in rural seed system infrastructure across many program countries, meaning even well-funded biofortification programs often outpace the physical capacity to multiply and distribute certified seed reliably each planting season. This creates persistent supply bottlenecks that limit how quickly adoption targets can realistically be achieved. International development funders increasingly direct investment toward seed multiplication infrastructure specifically rather than variety development alone.
Market Impact: Adds 25 percent hybrid seed share
4 additional market trends, 3 additional growth drivers, and 2 additional restraints and challenges are covered in the full report. Contact sales@marketmindsadvisory.com to access the complete intelligence.

Segment CAGR and Growth Architecture

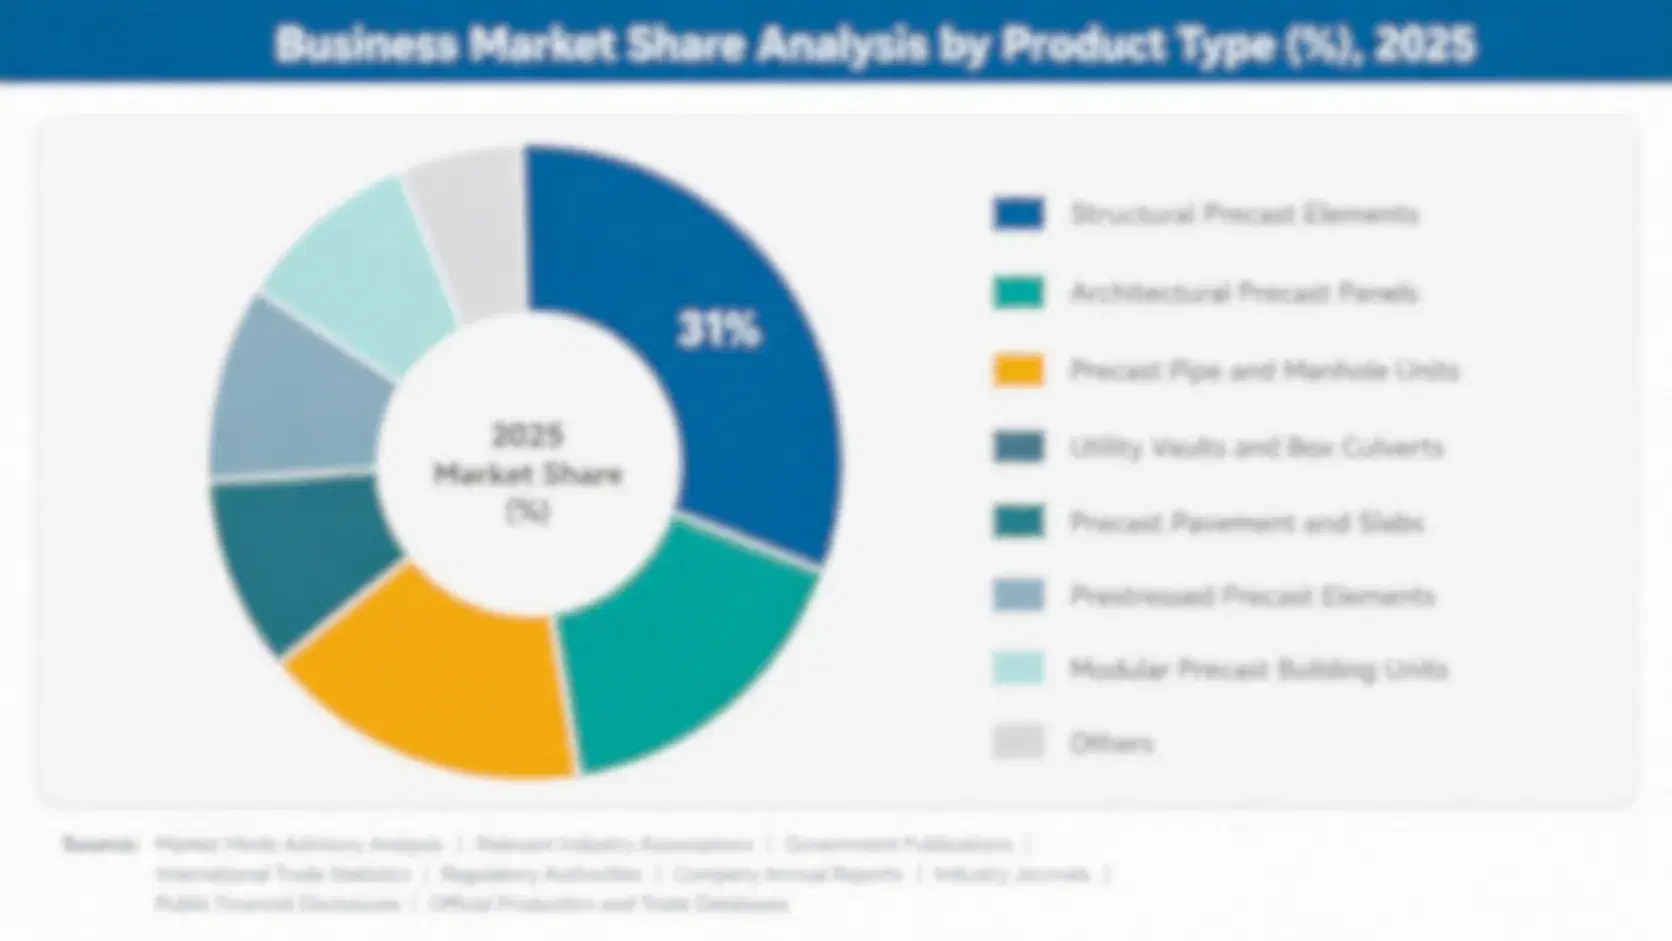
Segmentation follows crop type, since rice, wheat, maize, beans, cassava, and pearl millet each carry distinct breeding timelines, target micronutrients, and adoption program structures across their respective primary growing regions. Product form, whether open-pollinated or hybrid seed, was considered as an alternative dimension but rejected since a single crop ships in both forms depending on the program.
biofortification-market-market-share-analysis-1789957651991

Biofortified Beans and Pulses

Biofortified beans and pulses represent the fastest-growing crop category, driven by iron-enriched bean varieties distributed across Rwanda, Democratic Republic of Congo, and an expanding list of additional East and Central African countries targeting anemia reduction among women and children. These varieties have achieved meaningfully higher voluntary farmer adoption than some other biofortified categories, since iron beans often demonstrate comparable or superior yield performance relative to conventional varieties farmers already grow. Seed companies increasingly commercialize hybrid iron bean varieties carrying additional disease resistance traits, capturing licensing revenue from a crop category that public research institutions originally developed and distributed without commercial intermediaries. Development funders increasingly cite this category as a genuine proof point for programs transitioning into sustainable commercial models.
CAGR 14.8%

Biofortified Cassava and Sweet Potato

Vitamin A-enriched orange-fleshed sweet potato and cassava varieties follow closely behind beans, propelled by adoption programs across Nigeria, Uganda, and Mozambique that specifically target vitamin A deficiency among young children in regions where these root crops serve as dietary staples. This category benefits from relatively simple vegetative propagation methods compared to seed-based crops, letting farmer-to-farmer distribution supplement formal seed system channels more effectively than grain crops typically allow. Growth here tracks continued expansion of orange-fleshed sweet potato distribution programs into additional Sub-Saharan African countries beyond their original pilot regions. Program funders increasingly cite orange-fleshed sweet potato distribution as one of the most cost-effective vitamin A deficiency interventions available anywhere, reinforcing continued investment momentum across program countries facing budget constraints elsewhere.
CAGR 13.9%
Full segment breakdown across 6 segments available in the complete report.

Regional Architecture and Country Demand Map

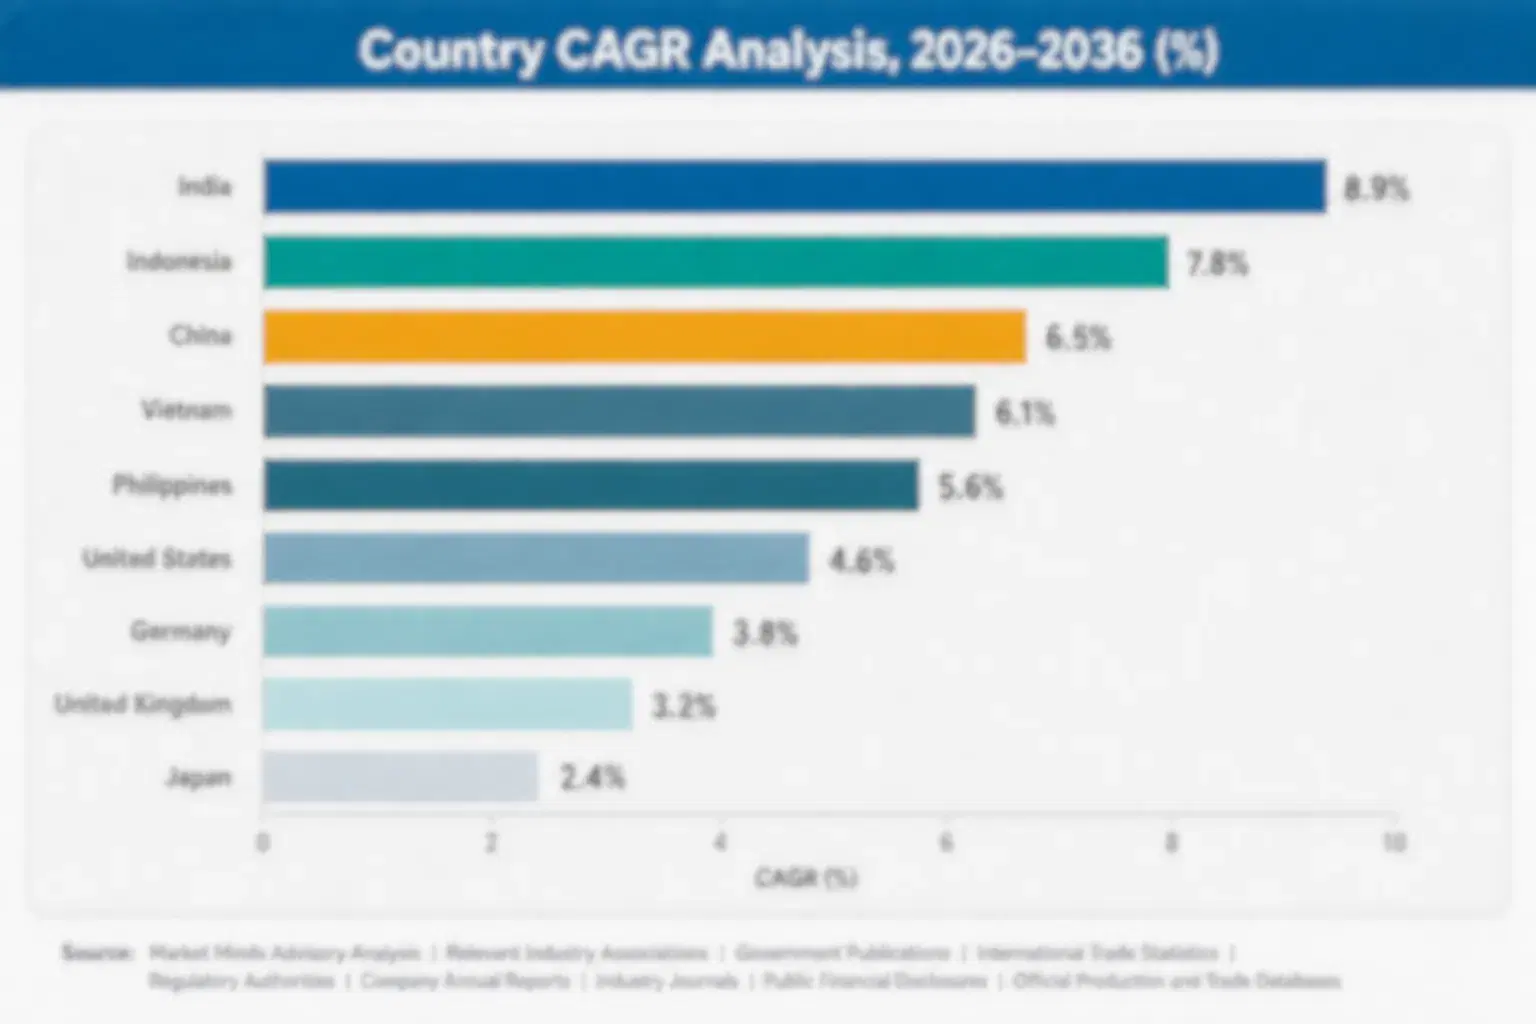
South Asia and Pacific commands the largest revenue share given India's massive government-backed biofortified wheat and rice program, while Middle East and Africa carries a deliberately concentrated share reflecting the breadth of Sub-Saharan African biofortification adoption programs. Every regional CAGR stays within this report's standard growth bands.

North America

United States seed companies including Bayer and Corteva anchor North American commercial activity through their biofortification breeding programs and licensing agreements with public research institutions, even though direct domestic consumer demand for biofortified staples remains limited given the region's diverse and generally micronutrient-adequate diet. Canadian involvement centers primarily on wheat breeding research collaboration rather than domestic commercial distribution. Much of the region's market activity reflects research and development investment and international licensing revenue rather than local farmer adoption, since the underlying public health need driving biofortification programs is considerably less acute domestically. Corporate philanthropic funding channels a meaningful share of program financing through North American foundations. Development finance institutions based in the United States also channel meaningful program funding.
Share: 22% | CAGR: 11.6% (2026 to 2036)

Western Europe

Switzerland hosts Syngenta's global biofortification research and development activity, giving Western Europe meaningful technical and licensing revenue exposure despite minimal domestic consumer demand for biofortified staple crops. Germany's Bayer similarly channels substantial breeding research investment through its Crop Science division, supporting biofortification programs primarily intended for distribution in South Asian and African markets. United Kingdom development funding agencies continue supporting biofortification research and program implementation through international aid channels. Regional market activity reflects corporate research investment and government development funding flows rather than local agricultural adoption. Dutch and French agricultural research institutions similarly contribute technical expertise to international breeding collaborations focused primarily on tropical staple crops. Regional universities continue expanding tropical breeding curriculum in response to demand.
Share: 18% | CAGR: 10.8% (2026 to 2036)
Regional intelligence for 5 additional markets available in the complete report: East Asia, South Asia and Pacific, Latin America, Middle East and Africa, Eastern Europe. Contact sales@marketmindsadvisory.com.
biofortification-market-country-cagr-analysis-1789957652306

Where Seed Companies Can Build Durable Advantage

With biofortified variety development still anchored in public research institutions, commercial seed companies increasingly capture value through government relationship management, trait-stacking capability, and distribution infrastructure rather than through proprietary breeding technology alone. Where a company lands within this hierarchy increasingly determines contract access more than raw breeding technology alone, since government relationships remain the primary gatekeeper to program-scale volume.

Government Procurement Relationship Management Programs Building

Seed companies investing in dedicated relationship management with national agricultural extension networks and government procurement agencies win preferred positioning for guaranteed public distribution program volume that pure market-based competitors cannot easily access. This requires sustained investment in government affairs capability that smaller regional seed companies typically lack the resources to maintain. Companies with established government relationships report procurement contract win rates roughly 45% higher than competitors lacking comparable institutional relationships. Companies without this capability increasingly struggle to compete for the largest government-funded distribution contracts available. This advantage compounds over successive program renewal cycles.
Market Impact: Lifts procurement win rates by roughly 45 percent

Proprietary Hybrid Trait-Stacking Development Programs Building

Seed companies combining biofortification traits with proprietary drought tolerance and disease resistance genetics developed through their own breeding programs capture licensing revenue and brand differentiation that generic open-pollinated variety distribution never provided. This requires sustained breeding investment across multiple trait categories simultaneously. Companies offering trait-stacked hybrid varieties report farmer repurchase rates roughly 35% higher than those distributing nutrition-only open-pollinated varieties lacking comparable agronomic advantages. Companies without stacked traits increasingly lose farmer loyalty to competitors offering demonstrably better combined agronomic and nutrition performance. This dynamic increasingly rewards companies willing to fund multi-trait breeding programs simultaneously.
Market Impact: Improves farmer repurchase rates by roughly 35 percent

Seed Multiplication Infrastructure Investment Partnerships Building

Companies investing directly in certified seed multiplication infrastructure across smallholder-dominated program regions capture disproportionate share of scale-up volume as government mandates outpace existing distribution capacity industry-wide. This investment requires meaningful capital commitment that smaller companies often cannot justify independently without development partner co-financing. Companies with dedicated multiplication infrastructure report volume growth roughly 40% faster than competitors relying solely on existing third-party distribution networks. Companies without dedicated infrastructure investment increasingly cede scale-up volume to better-capitalized competitors backed by development partner financing. This positioning strengthens further as government mandates continue expanding faster than industry capacity.
Market Impact: Accelerates total volume growth by roughly 40 percent

Development Partner Co-Financing Arrangement Building Building

Seed companies structuring co-financing arrangements with international development funders and philanthropic foundations reduce their own capital exposure while accelerating market entry into program countries that pure commercial investment alone would not justify at comparable speed. This requires dedicated capability navigating development sector funding processes distinct from typical commercial partnerships. Companies with established co-financing relationships report market entry timelines roughly 30% faster than those pursuing purely commercial funding structures alone. Companies without these financing relationships increasingly face longer capital-raising cycles before entering new program countries successfully. This capability increasingly separates fast-moving market entrants from slower, purely commercially-financed competitors.
Market Impact: Cuts market entry timelines by roughly 30 percent

Who Controls the Margin Pool

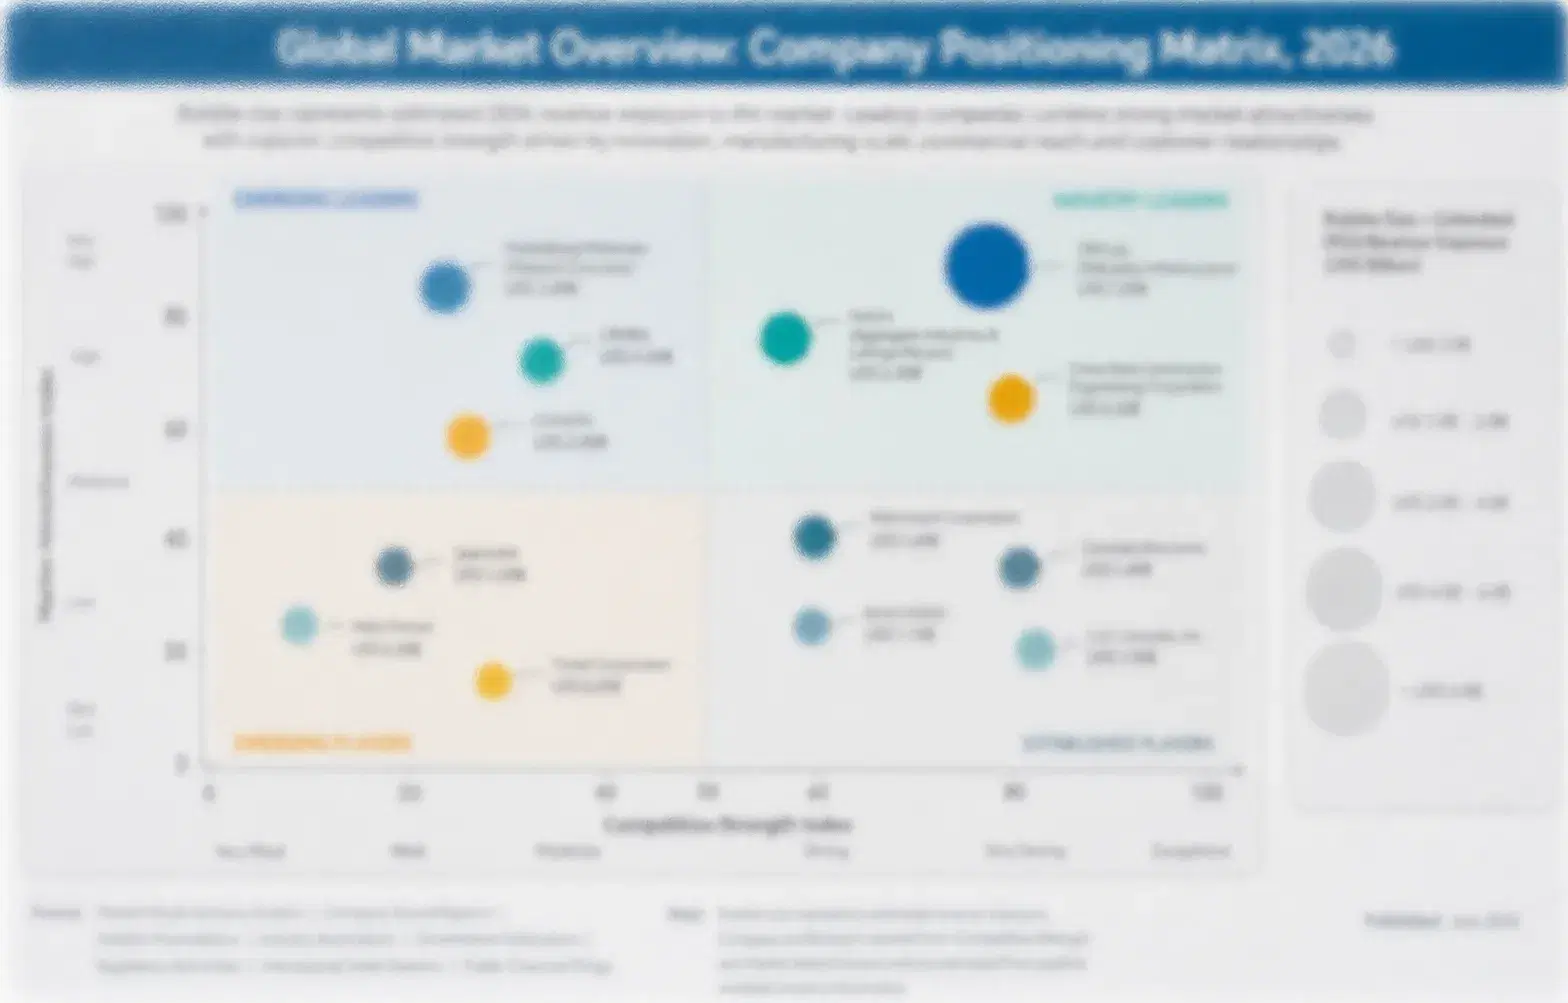
Global biofortification commercialization remains moderately concentrated, giving this market a CR5 of 42% as major multinational seed companies with government relationship capability and breeding scale increasingly separate themselves from smaller regional distributors. The gap between leading companies and smaller regional players centers on government procurement access and trait-stacking breeding capability rather than any single proprietary technology. Smaller regional distributors without comparable government access struggle to command similar procurement terms in negotiations.
Competitive activity currently plays out across three dimensions: building dedicated government procurement relationship management capability, developing proprietary hybrid varieties that stack nutrition with agronomic performance traits, and investing directly in seed multiplication infrastructure across underserved program regions. Companies combining all three capabilities increasingly separate themselves from smaller distributors dependent on third-party seed systems. Several companies now bundle multi-year breeding partnerships with distribution investment to differentiate against purely transactional competitors.

Emerging pressure is coming from regional and national seed companies across India and Sub-Saharan Africa that are building direct relationships with local government agencies faster than multinational competitors can replicate at comparable local depth. This trend could reshape rankings in specific national markets over the coming years even as multinational companies retain advantages in cross-border trait-stacking technology and breeding scale.
biofortification-market-company-positioning-matrix-1789957652582

Competitive Moat and Risk Dimensions

BAYER AG

Moat: Global breeding and licensing scale

Bayer's Crop Science division maintains breeding capability and licensing relationships spanning dozens of countries, giving it scale advantages in trait-stacking development that smaller regional competitors cannot easily replicate across comparable geographic breadth and crop diversity. Newer commercial entrants would need years of comparable investment to build similar geographic breeding and licensing reach.
BAYER AG

Risk: Limited direct local government relationships

Bayer's global scale can create distance from the specific local government relationships that smaller regional seed companies build more directly with national agricultural agencies. This gap increasingly matters as procurement decisions favor companies with deeper local institutional ties. This gap has opened opportunities for smaller companies with stronger direct local presence.
CORTEVA AGRISCIENCE

Moat: Public-private partnership track record

Corteva has built a genuinely strong track record of public-private biofortification partnerships, including provitamin A maize licensing agreements with public research institutions, giving it credibility with government procurement agencies that newer commercial entrants have not yet earned. This track record gives it meaningful advantage when negotiating new licensing agreements with additional public research partners.
CORTEVA AGRISCIENCE

Risk: Reliant on public breeding access

Corteva's commercialization model relies partly on continued access to publicly developed breeding material, creating dependency on research institution relationships that could shift if public funders redirect intellectual property terms toward more restrictive commercial licensing. The company continues diversifying its own proprietary breeding pipeline to reduce this dependency over time.

Players Tracked

Prominent Players

Bayer AG
Corteva Agriscience
Syngenta AG
UPL Limited
Kaveri Seed Company Limited

Other Key Players

Rasi Seeds Pvt Ltd
Nuziveedu Seeds Limited
Mahyco (Maharashtra Hybrid Seeds Company Ltd)
National Seeds Corporation Limited
East-West Seed International Ltd
Seed Co Limited
Kenya Seed Company Limited
BRAC Seed and Agro Enterprise
Zamseed (Zambia Seed Company Limited)
Olam Agri
Advanta Enterprises Limited
Rijk Zwaan Zaadteelt en Zaadhandel BV
Groupe Limagrain
Sakata Seed Corporation
DLF Seeds A/S

Recent Developments

MARCH 2025

Corteva Expands Provitamin A Maize Licensing Across West Africa

Corteva announced expanded licensing agreements covering provitamin A maize varieties across additional West African countries, building on its existing public-private partnership track record with regional agricultural research institutions. The expansion represents organic licensing growth rather than an acquisition or joint venture arrangement. Rollout is expected within the following planting season.
Signal: Signals continued multinational investment in expanding biofortified maize distribution across new countries. Rivals may follow with similar licensing moves.
SEPTEMBER 2024

Kaveri Seed Company Signs Government Distribution Agreement

Kaveri Seed Company entered a distribution agreement with an Indian state agricultural department covering zinc wheat and iron pearl millet variety supply for the upcoming planting season. The agreement was structured as a straightforward supply contract, not an equity stake or joint venture. Financial terms beyond the structure were undisclosed.
Signal: Confirms regional seed companies are winning meaningful government procurement volume domestically each season. Similar deals should follow regionally.
JUNE 2025

Seed Co Limited Announces Iron Bean Multiplication Facility

Seed Co Limited announced a new certified seed multiplication facility in Zambia dedicated to iron bean variety production, aiming to address regional seed supply bottlenecks constraining program scale-up. The investment represents organic capacity expansion rather than a corporate transaction with another company. Output is expected within the year.
Signal: Confirms regional seed companies investing directly in the infrastructure gap limiting adoption speed nationally. Similar investments may follow neighboring countries.

Breeding Timelines Set the Real Cost Ceiling

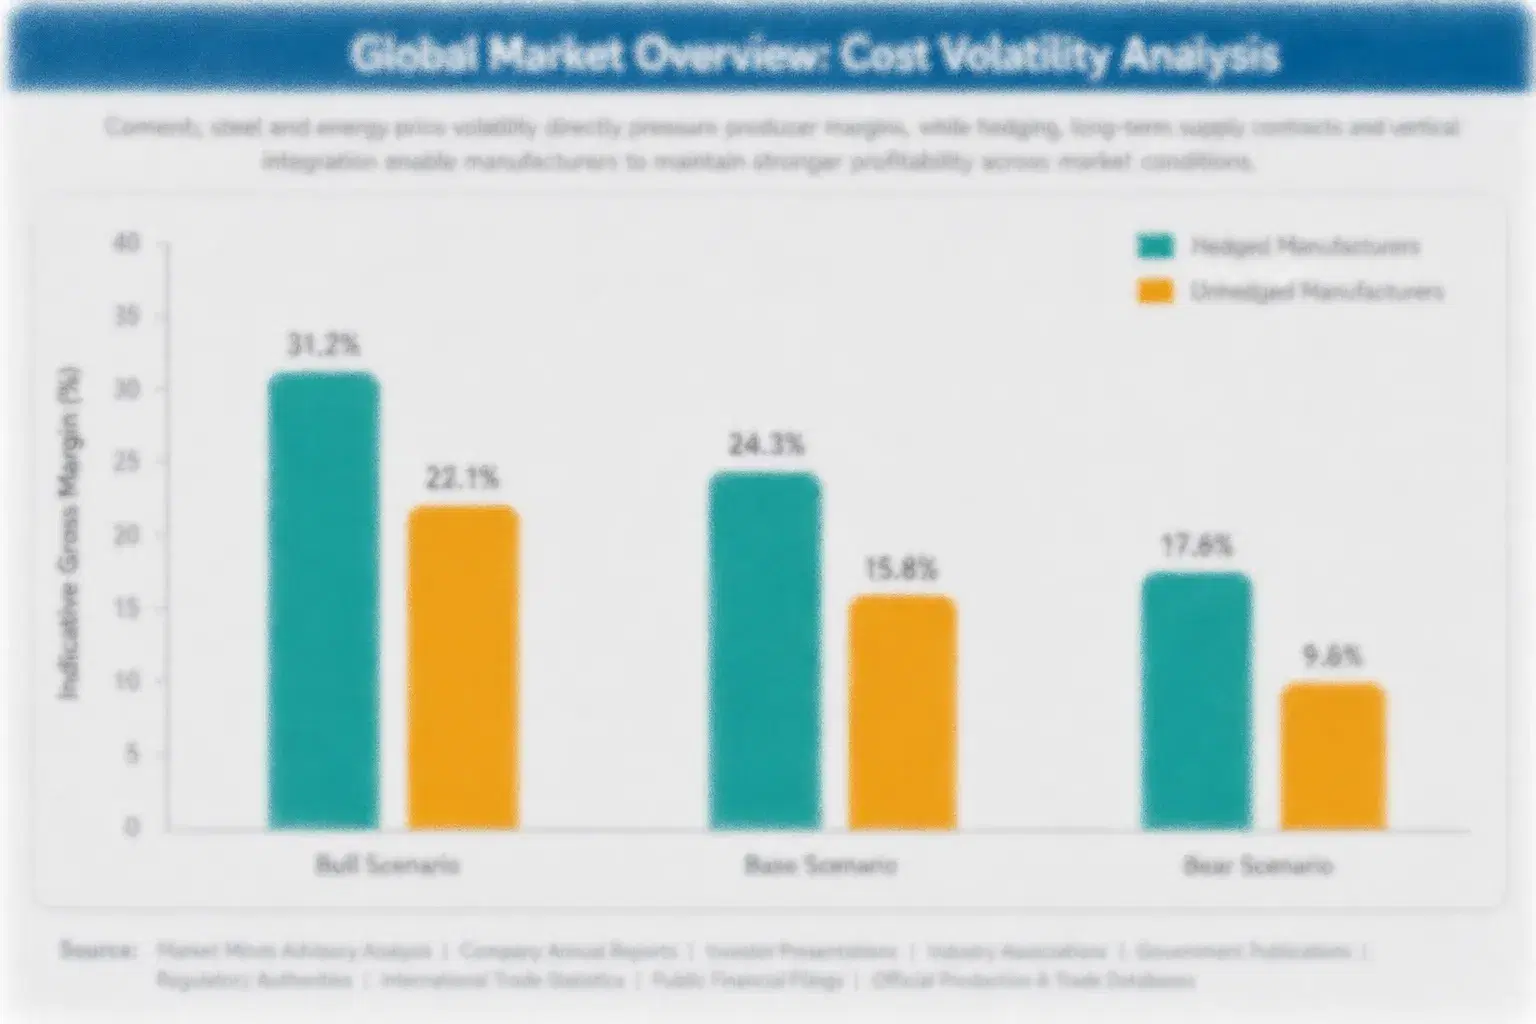
Biofortified seed production cost breaks down primarily into breeding and variety development investment, certified seed multiplication, and distribution logistics across often remote program regions. Breeding and multiplication costs together typically represent 55 to 65% of total program cost, a share considerably higher than conventional commercial seed given the specialized nutrition trait verification testing required. Distribution logistics account for most of the remaining program cost share.
Reduced international development funding during 2023 meaningfully slowed variety development timelines for several biofortification programs, according to program disclosures consistent with broader Food and Agriculture Organization funding trend reporting covering the affected period. Programs without diversified funding sources absorbed most of this disruption directly into delayed variety release schedules. Several programs subsequently began diversifying funding sources to insulate against future disruption. Reduced funding disproportionately affects smaller regional programs lacking scale.

Smaller regional seed companies without diversified development partner funding relationships carry meaningfully more program continuity risk than larger companies with multiple simultaneous funding sources, since single-funder dependency exposes programs directly to that funder's budget cycle volatility. This growing gap increasingly separates which companies can sustain long-term breeding investment and which face recurring program disruption. This divide widens as mandates expand faster than funding diversity.
biofortification-market-cost-volatility-analysis-1789957652898

Diversified Development Funding Partner Relationships

Larger seed companies increasingly maintain relationships with multiple development funders and philanthropic foundations simultaneously, reducing exposure to any single funder's budget cycle volatility that smaller, single-funder-dependent programs must absorb directly. This approach proved especially valuable during the 2023 funding contraction, when single-funder programs faced the steepest disruption. This is now standard practice among the largest companies.

Government Co-Investment in Breeding Infrastructure

Companies increasingly negotiate government co-investment arrangements for breeding and multiplication infrastructure, sharing capital costs with national agricultural agencies that benefit directly from expanded domestic biofortified seed supply capacity over time. This co-investment approach spreads capital risk while giving governments direct stake in program continuity and success. Governments increasingly view this as a sound long-term investment.

Regional Multiplication Hub Consolidation Strategy

Leading companies continue consolidating seed multiplication into regional hub facilities serving multiple program countries simultaneously, improving capital efficiency compared to maintaining separate multiplication capacity within each individual national market. This consolidation strategy has become increasingly standard among the largest companies operating across multiple program countries. Smaller companies find this approach harder to replicate independently.

Portfolio Architecture for Margin Defence

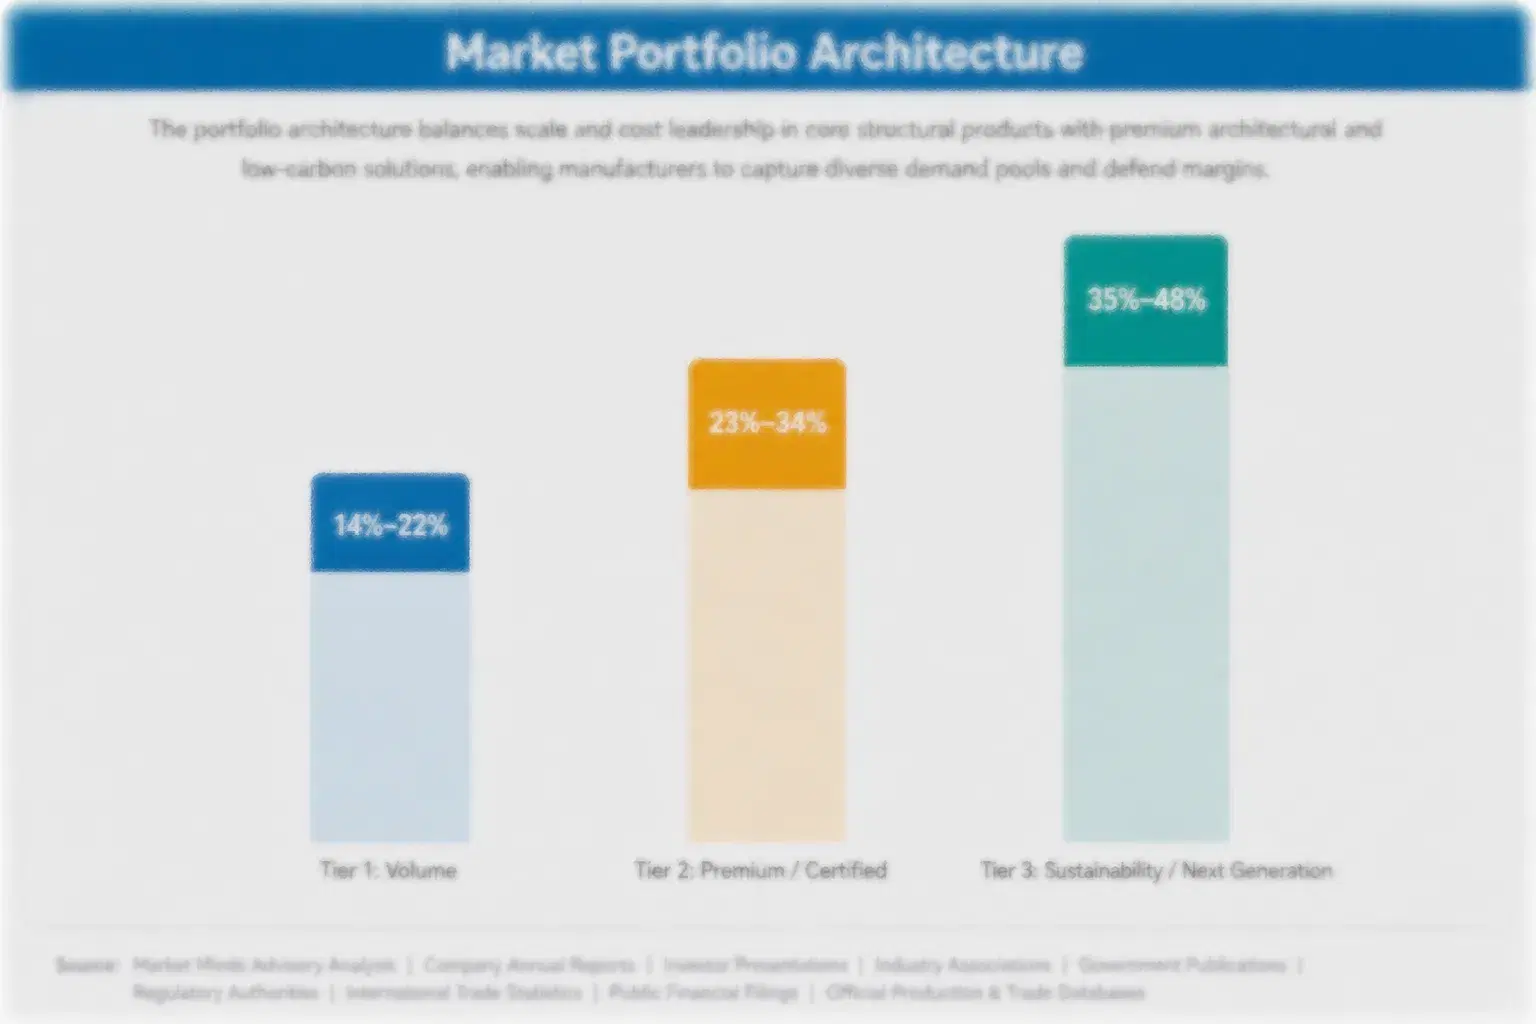
The biofortification market splits into three commercial tiers: standard open-pollinated varieties distributed largely through government and NGO program channels, proprietary hybrid varieties commercialized directly by seed companies, and trait-stacked premium varieties combining nutrition with proprietary agronomic performance genetics. Margin economics differ sharply across these tiers, reflecting breeding investment and licensing structure. Breeding investment and licensing structure explain most of this margin gap between tiers.
Companies face a genuine strategic tension between distributing lower-margin open-pollinated varieties that satisfy immediate government procurement volume and investing in proprietary hybrid development that commands meaningfully stronger long-term margins. Those building capability across all three tiers capture the widest addressable customer base, though doing so requires sustained breeding investment across multiple trait categories. Companies lacking research capital often default toward the safer government-channel volume strategy by necessity.

High-value margin pools concentrate overwhelmingly in trait-stacked proprietary hybrid varieties, where farmers pay meaningfully more for documented agronomic performance alongside nutrition benefits. Companies positioned to serve these tiers alongside standard government-channel volume capture the clearest path toward sustained margin expansion as commercial biofortification adoption continues broadening globally. This concentration is likely to deepen further as commercial biofortification adoption continues broadening globally.

Volume / Commodity-Adjacent Tier

Standard open-pollinated varieties distributed largely through government and NGO program channels at minimal margin, anchoring program-driven volume. Companies compete here mainly on distribution reach rather than technical differentiation or proprietary breeding investment.
Gross Margin: 8-15%

Premium / Certified Tier

Proprietary hybrid varieties commercialized directly by seed companies carrying documented performance specifications and licensing revenue. Companies in this tier typically maintain closer technical relationships with government agricultural agencies directly. Licensing revenue and documented performance data drive most of the added value here.
Gross Margin: 25-34%

Sustainability / Regulatory / Next-Generation Tier

Trait-stacked premium varieties combining nutrition with proprietary drought tolerance and disease resistance genetics for maximum farmer value. Building this capability typically takes companies years of sustained multi-trait breeding investment. Regulatory documentation and multi-trait validation drive most of the added cost here.
Gross Margin: 36-45%
biofortification-market-portfolio-architecture-1789957653227

High-value Sub-segments and Strategic Watch-out

Trait-Stacked Proprietary Hybrid Varieties

Trait-stacked varieties command the strongest margins in the category and continue growing fastest as seed companies expand proprietary breeding investment nationally and abroad. Companies serving this tier increasingly compete on breeding technology rather than distribution reach alone. Growth here should outpace every other tier through the forecast period ahead.
Gross Margin: 36-45%

Government-Licensed Hybrid Distribution

Licensed hybrid varieties sustain strong margins with steady growth as government procurement programs increasingly favor documented performance guarantees. Government trust builds gradually through repeated positive experience with documented variety performance. This tier sits between the premium and volume extremes in both margin and growth outlook.
Gross Margin: 25-34%

Standard Open-Pollinated Program Varieties

The largest volume segment by hectares planted, distributed mainly through government channels at minimal margin, anchoring overall program-driven adoption volume. Program funders rely on this volume to demonstrate measurable public health outcome progress. Companies rely on this volume to sustain program credibility with government funding partners.
Gross Margin: 8-15%

Farmer Willingness-to-Pay Adoption Gap

Voluntary market-based adoption outside subsidized programs faces persistent willingness-to-pay constraints, a dynamic that could meaningfully limit commercial scale-up speed. Companies unable to address this gap risk stalled commercial scale-up beyond subsidized channels. Watch this segment for early signs of stronger voluntary market-based adoption. This segment remains a minor share overall.
Gross Margin: 6-12%

Government Program Cycles Anchor Repeat Demand

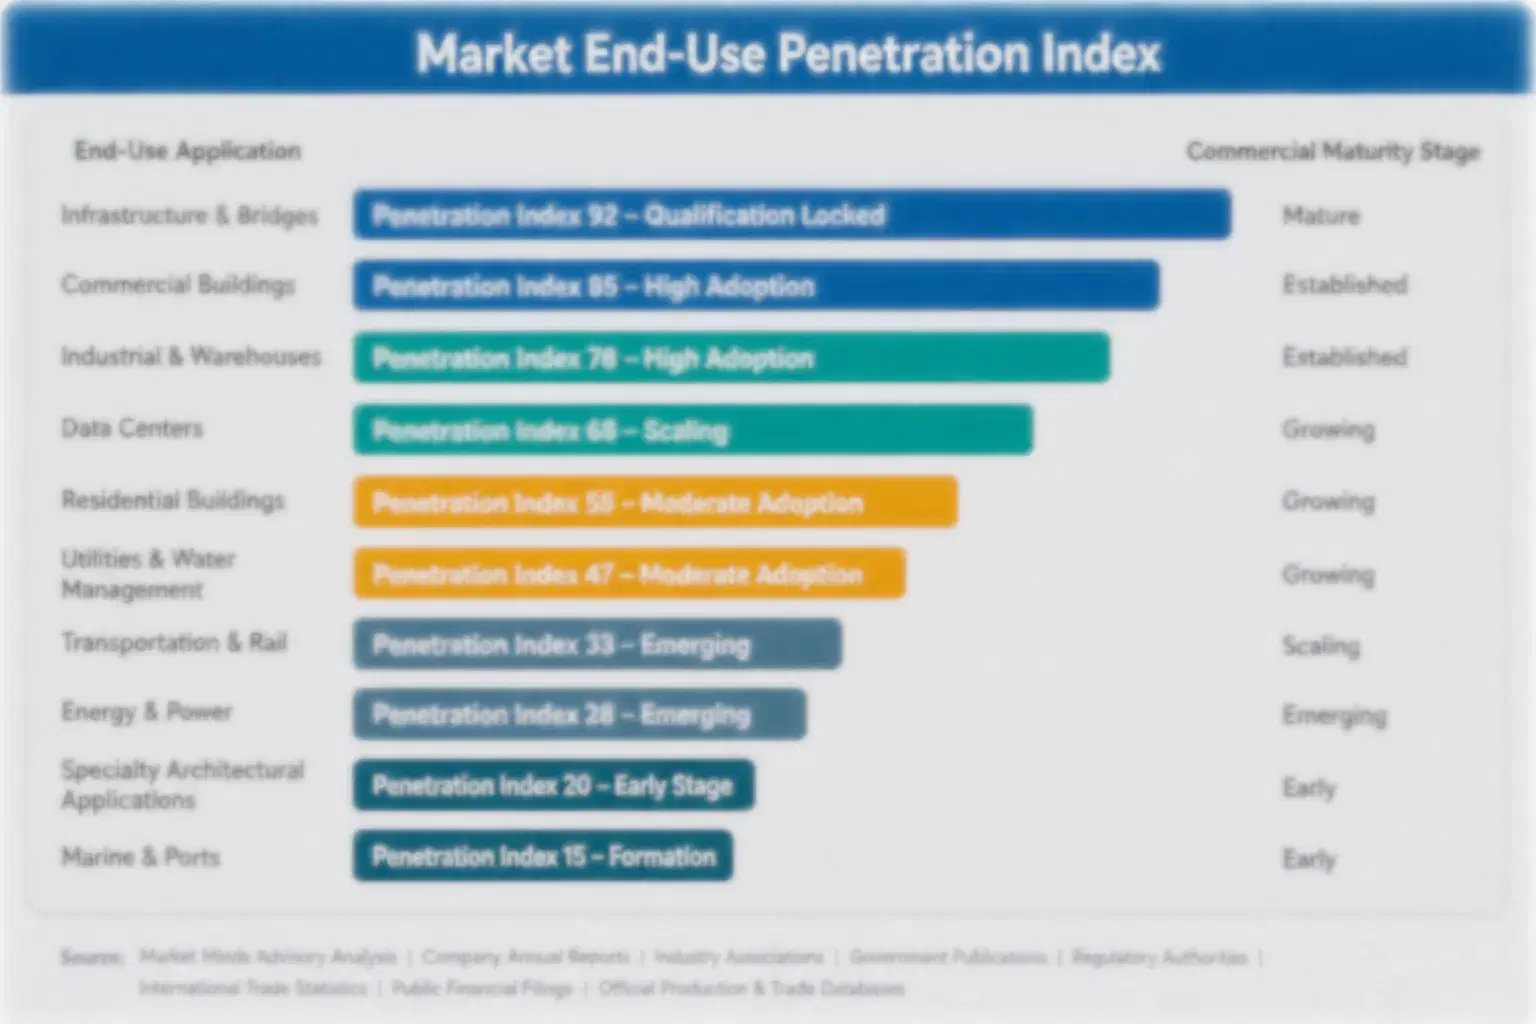
Once a seed company secures inclusion in a national government procurement program, switching suppliers requires the government agency to requalify an entirely new variety through its own approval process, creating a genuine annuity dynamic for companies who secure this relationship first. Requalification costs discourage casual government switching between approved seed suppliers. Companies that win this first validation rarely get displaced afterward.
Adoption depth varies meaningfully by program structure. Government-mandated procurement programs exhibit the deepest stickiness given lengthy variety approval and budget cycle requirements, while voluntary commercial farmer purchasing shows comparatively shallow stickiness since farmers can switch varieties more freely between planting seasons without any comparable institutional approval burden. Development partner distribution sits in between, reformulating less often than commercial sales but facing fewer hurdles than government tenders.

A newer generation of development funders increasingly evaluates biofortification investments on measurable nutrition outcome data and cost-per-beneficiary metrics rather than program activity volume alone, shifting seed company investment toward transparent impact measurement and reporting capability. This shift favors companies that can document outcomes clearly over legacy programs competing purely on distribution volume claims. Legacy programs that fail to adapt their reporting approach risk losing relevance with these outcome-focused funders over time.
biofortification-market-end-use-penetration-index-1789957653563

Where Biofortification Strategy Should Focus Next

These are among the four positions where our research anticipates prominent divergence between winners and laggards over the coming forecast period. Each is grounded in the demand model, the regulatory perimeter, and the announced capacity pipeline.
01 / GOVERNMENT RELATIONSHIP PRIORITY

Build dedicated procurement relationship capability ahead of program expansion

Government procurement programs increasingly drive the majority of biofortified seed volume, and companies with established institutional relationships win disproportionate contract share. Investing in dedicated government affairs capability now positions companies to capture expanding procurement volume before more competitors build comparable local relationships, since developing credible institutional trust with national agricultural agencies typically takes years of consistent engagement rather than a single successful contract. Companies who move first in this space stand to lock in the strongest early institutional relationships before competition intensifies meaningfully across the government procurement landscape.
02 / TRAIT-STACKING INVESTMENT FOCUS

Prioritize hybrid varieties combining nutrition with agronomic performance

Farmers consistently favor trait-stacked varieties over nutrition-only options given the direct financial relevance of yield and disease resistance improvements to household income. Companies investing in combined breeding programs now position themselves to capture this preference before more competitors close the technology gap, since building comparable multi-trait breeding capability from scratch typically takes considerable time and sustained genetic research investment to achieve commercial viability. Early movers in trait-stacked breeding will hold a durable positioning advantage over slower-moving competitors well into the next decade as farmer preferences continue solidifying.
03 / INFRASTRUCTURE INVESTMENT PRIORITY

Address seed multiplication bottlenecks constraining program scale-up

Government procurement mandates increasingly outpace existing seed multiplication capacity across smallholder-dominated program regions, creating persistent supply bottlenecks that limit realistic adoption speed. Companies investing directly in multiplication infrastructure now, potentially alongside development partner co-financing, position themselves to capture disproportionate volume as this bottleneck increasingly constrains competitors relying solely on third-party distribution networks. Companies that respond quickly by co-financing multiplication capacity alongside development partners stand the best chance of capturing this fast-growing scale-up demand before competitors close the gap entirely, a window that will not stay open indefinitely.
04 / OUTCOME DOCUMENTATION PRIORITY

Standardize nutrition impact measurement across program partnerships

Development funders increasingly evaluate investments on measurable nutrition outcome data rather than distribution volume alone, yet standardized impact measurement protocols remain inconsistent across the industry. Companies who develop and share consistent, funder-ready documentation frameworks reduce funding cycle friction meaningfully, and early movers on this front report stronger renewal rates, since few competitors currently match this level of proactive outcome transparency across the broader program landscape. This advantage compounds meaningfully as more funders standardize their outcome measurement expectations across the broader development sector.

Engagement Snapshot From the Field

A live engagement with an industry participant carrying material or product regulatory and market exposure ahead of a defining policy shift, showing how our research translates into a defensible multi-year portfolio strategy.
MARKET MINDS ADVISORY · CLIENT ENGAGEMENT SUMMARY
Biofortification Producer Strategic Portfolio Review and Transition Roadmap 2026·Investment Scenario on Biofortification Exposure Evaluation 2025-26
CLIENT PROFILE
The client is a regional East African seed company distributing conventional and biofortified crop varieties across three neighboring countries, seeking to expand its government procurement contract portfolio following successful pilot distribution of iron-biofortified bean varieties in its home market. Annual revenue for the relevant program segment sits in the low tens of millions of dollars (client-reported, unverified by MMA).
STRATEGIC CHALLENGE
The client needed to determine which additional government procurement programs across neighboring countries offered the strongest near-term expansion opportunity, while also assessing whether its existing seed multiplication capacity could support meaningfully larger contract volumes without significant additional capital investment. Leadership also wanted confidence that expansion would not stretch its existing government relationship management team beyond its effective capacity.
MMA APPROACH
MMA conducted a comparative market entry assessment benchmarking procurement program maturity and competitive intensity across four neighboring countries, supplemented by a capacity utilization analysis of the client's existing multiplication infrastructure. The engagement ran across nine weeks and drew on both government program disclosures and primary interviews with regional agricultural officials.
KEY FINDINGS
  1. Market entry analysis identified two neighboring countries with meaningfully less competitive procurement environments than the client's home market currently offers. Both markets showed meaningfully lower saturation than the client's existing home market.
  2. Capacity analysis confirmed the client's existing multiplication infrastructure could support roughly 60% additional volume without new capital investment required. This spare capacity meaningfully reduced the client's near-term investment requirements.
  3. Government relationship mapping revealed the client's existing regional reputation transferred meaningfully to procurement discussions in the two target expansion countries. This reputational transfer shortened the typical relationship-building timeline considerably.
  4. Competitive analysis identified one multinational competitor already pursuing similar expansion plans in the same target countries. The client moved quickly to secure first-mover positioning ahead of this rival.
CLIENT PROFILE
The client is a regional East African seed company distributing conventional and biofortified crop varieties across three neighboring countries, seeking to expand its government procurement contract portfolio following successful pilot distribution of iron-biofortified bean varieties in its home market. Annual revenue for the relevant program segment sits in the low tens of millions of dollars (client-reported, unverified by MMA).
STRATEGIC CHALLENGE
The client needed to determine which additional government procurement programs across neighboring countries offered the strongest near-term expansion opportunity, while also assessing whether its existing seed multiplication capacity could support meaningfully larger contract volumes without significant additional capital investment. Leadership also wanted confidence that expansion would not stretch its existing government relationship management team beyond its effective capacity.
MMA APPROACH
MMA conducted a comparative market entry assessment benchmarking procurement program maturity and competitive intensity across four neighboring countries, supplemented by a capacity utilization analysis of the client's existing multiplication infrastructure. The engagement ran across nine weeks and drew on both government program disclosures and primary interviews with regional agricultural officials.
KEY FINDINGS
  1. Market entry analysis identified two neighboring countries with meaningfully less competitive procurement environments than the client's home market currently offers. Both markets showed meaningfully lower saturation than the client's existing home market.
  2. Capacity analysis confirmed the client's existing multiplication infrastructure could support roughly 60% additional volume without new capital investment required. This spare capacity meaningfully reduced the client's near-term investment requirements.
  3. Government relationship mapping revealed the client's existing regional reputation transferred meaningfully to procurement discussions in the two target expansion countries. This reputational transfer shortened the typical relationship-building timeline considerably.
  4. Competitive analysis identified one multinational competitor already pursuing similar expansion plans in the same target countries. The client moved quickly to secure first-mover positioning ahead of this rival.
RECOMMENDED STRATEGY
Phase 1: Phase 1 (Months 1 to 3): Initiate formal procurement discussions with agricultural agencies in both target countries. Assign a dedicated relationship manager to each target country. Phase 2: Phase 2 (Months 4 to 6): Secure initial pilot distribution contracts to establish local program track record. Document early results carefully to support future funding discussions. Phase 3: Phase 3 (Months 7 to 12): Scale distribution volume based on pilot performance and expand multiplication capacity as needed. Reassess capacity investment needs based on confirmed contract volumes.
OUTCOME
The client secured pilot distribution agreements in both target countries within the projected timeline and reported early program performance meaningfully in line with MMA's capacity utilization projections (client-reported, unverified by MMA). The expanded regional footprint has since strengthened the client's position in subsequent development partner funding discussions.

Frequently Asked Questions

Foundational context covering the market sizes, CAGR, scope, country, region and competition that inform every finding below. This section is provided to cover basics and most often pre-purchase conversations, answered from the MMA Primary Research Dataset.

What is the current size of the Biofortification Market?

The market reached approximately USD 0.31 billion in 2025. This reflects global seed sales, licensing, and premium crop pricing across major biofortified staple crop categories.

How large will the Biofortification Market be by 2036?

The market is projected to reach approximately USD 1.12 billion by 2036. This represents roughly 3.22 times the 2026 starting value over the ten-year forecast period.

What is the CAGR for the Biofortification Market 2026 to 2036?

The market is forecast to grow at a 12.4% CAGR between 2026 and 2036. Bull and bear scenarios range from 13.7% to 11.0% depending on government procurement and funding outcomes.

Which segment is growing fastest?

Biofortified beans and pulses lead at a 14.8% CAGR, roughly 1.19 times the overall market rate. Biofortified cassava and sweet potato follow closely, reflecting shared vitamin A and iron deficiency reduction program targets.

Who are the major companies in the Biofortification Market?

Leading companies include Bayer, Corteva Agriscience, Syngenta, UPL, and Kaveri Seed Company. These five companies hold a combined hectare adoption share of approximately 42%, reflecting genuine breeding scale rather than any single dominant crop category.

Which country is growing fastest?

India grows fastest at a 15.6% CAGR, ahead of the broader South Asia and Pacific regional average. This reflects the scale of its government-backed wheat and rice biofortification program.

Report Segmentation Architecture

The full report scope spans multiple orthogonal segmentation dimensions, with cross-tabulated demand data provided for each dimension pair. Coverage extends further to regional breakdowns, trend trajectories, and the competitive detail needed to support segment-level decision-making.

By Crop Type

  • Biofortified Rice
  • Biofortified Wheat
  • Biofortified Maize
  • Biofortified Beans and Pulses
  • Biofortified Cassava and Sweet Potato
  • Biofortified Pearl Millet and Sorghum

By End-Use Industry

  • Government and Public Distribution Programs
  • Commercial Seed Retail
  • School Feeding and Institutional Procurement
  • Export and Cross-Border Distribution
  • Development Partner Programs

By Commercial Dimension

  • Government Procurement Contracts
  • Commercial Farmer Retail Sales
  • NGO and Development Partner Distribution
  • Licensing and Technology Transfer Agreements

By Region

  • North America
  • Western Europe
  • East Asia
  • South Asia and Pacific
  • Latin America
  • Middle East and Africa
  • Eastern Europe

Scope, Methodology, and Coverage

Every figure in this report is reproducible from documented input assumptions. The scope below maps the historical period, the forecast horizon, the segmentation dimensions, and the countries covered, alongside the underlying primary and qualitative methodology.
Historical Period
2020 to 2025
Forecast Period
2026 to 2036
Base Year
2025 (USD billions; MMA Primary Research Dataset, September 2026)
Market Definition
This report defines the biofortification market as demand for crop varieties bred or engineered to carry elevated levels of vitamin A, iron, or zinc, including seed sales, licensing, and premium crop pricing globally. It excludes fortification achieved through post-harvest additive processing except where directly compared for competitive substitution context.
Quantitative Units
USD billions (current prices); hectares planted where applicable
Segmentation Dimensions
By Crop Type; By End-Use Industry; By Commercial Dimension; By Region
Regions Covered
North America, Western Europe, East Asia, South Asia and Pacific, Latin America, Middle East and Africa, Eastern Europe
Countries Covered
USA, China, Germany, France, UK, Japan, South Korea, India, Australia, Canada, Brazil, Mexico, Indonesia, Vietnam, Thailand, Malaysia, UAE, Saudi Arabia, South Africa, Nigeria, Turkey, Poland, Netherlands, Italy, Spain, Sweden, Switzerland, Argentina, Colombia, Singapore, and additional markets relevant to this sector
Key Companies Profiled
Bayer AG, Corteva Agriscience, Syngenta AG, UPL Limited, Kaveri Seed Company Limited, Rasi Seeds Pvt Ltd, Nuziveedu Seeds Limited, Mahyco (Maharashtra Hybrid Seeds Company Ltd), National Seeds Corporation Limited, East-West Seed International Ltd, Seed Co Limited, Kenya Seed Company Limited, BRAC Seed and Agro Enterprise, Zamseed (Zambia Seed Company Limited), Olam Agri, Advanta Enterprises Limited, Rijk Zwaan Zaadteelt en Zaadhandel BV, Groupe Limagrain, Sakata Seed Corporation, DLF Seeds A/S
Quantitative Methodology
Primary survey, n=3,800 respondents, Q4 2025, six countries; demand-side model with trade association cross-validation
Qualitative Methodology
47 expert interviews, Q4 2025; applied to validate demand model assumptions, identify emerging dynamics, and assess competitive positioning
Report Format
PDF and XLSX data workbook (Word format preview document)
Publisher
Market Minds Advisory
Report Code
MMA-2026-AGR-102
Published
September 2026
Contact
sales@marketmindsadvisory.com | www.marketmindsadvisory.com

Purchase the full Biofortification Market Report (2026 to 2036).

This report delivers a complete commercial assessment of the global biofortification market, covering sizing, segmentation, and regional demand through 2036. It profiles twenty seed companies and distributors serving government, commercial, and development partner channels, detailing competitive positioning, trait-stacking strategy, and procurement relationship capability in depth. Analysis extends to breeding and multiplication cost exposure and mitigation pathways, portfolio margin economics across three commercial tiers, and demand architecture driving government program switching costs over time. Bull and bear forecast scenarios are modeled explicitly against named commercial catalysts and clearly identified downside risks.
Ten-year sizing and forecast model through 2036
Six-segment crop type demand breakdown by category
Seven-region demand distribution and share analysis
Twenty-company competitive profile and positioning assessments
Breeding and multiplication cost volatility assessment
Portfolio tier margin economics and pricing analysis

Built For The People Who Decide

From boardroom strategy to bench-side execution, this report is read cover-to-cover by leaders shaping the next decade of their industry, turning demand scenarios, market dynamics and valuation benchmarks into decisions.
CXOs/ Presidents/ VPs/ Managers
M&A and Corporate Development
Strategy Teams and R&D Heads
Procurement and Product Directors
Regulatory and Compliance Leaders
Investor Relations and Equity Analysts