Market Minds Advisory
Biocatalysis and Biocatalyst Market

Biocatalysis and Biocatalyst Market: The Enzyme Works, the Process Around It Usually Does Not

Screening finds a working enzyme in months and the plant takes years, because separating an enzyme from a product stream at scale is a chemical engineering problem nobody screened for.

Lead Analyst

Bilal Shaikh

Published

September 2026

Make Smarter Decisions with Customized Research Insights

Request a free sample report and evaluate market opportunities, growth trends, and competitive dynamics relevant to your business needs.

2025 MARKET VALUE$3.1BMarket Size 2025
2036 FORECAST VALUE$9.2BBase Case , 2026 to 2036
CAGR 2026 TO 203610.4 %Bull 11.6% / Bear 9.2%
INCREMENTAL OPPORTUNITY$5.8BNet 10- year value creation
EXPANSION MULTIPLE2.69x2036 value over 2026 base
Strategic Levers
M&A Pipeline
Regional Outlook
Country Rankings
Competitive Intelligence
Segmental Deep-dive
Call-Us : 91 93563 13602

Executive Snapshot and Market Trajectory

Directed evolution now finds a working enzyme for most target reactions within months. Around 71% of biocatalytic routes that reach pilot scale still fail to reach production, and the failures are downstream separation and enzyme recovery rather than anything the screening campaign was measuring. Discovery is not the hard part.
Growth runs at 10.4% and immobilisation carries it. Immobilised and continuous flow biocatalysts grow at 15.6%, exactly 1.50 times the market rate, because fixing the enzyme to a support solves recovery and reuse in one step. East Asia holds the largest share at 31%, on Chinese pharmaceutical intermediate and specialty chemical manufacturing volume. Engineered enzyme development and licensing follows at 13.0% as design capability spreads. Process development capability remains scarcer than screening capacity everywhere.
Concentration is high at 57% across the top five measured on enzyme protein supplied by weight. Fermentation capacity and strain libraries hold it there, and a company that can design an enzyme but cannot produce it at tonne scale is a licensing business rather than a supplier. Contract development organisations are building enzyme capability internally. Chinese producers supply established catalyst classes at costs Western fermentation simply cannot approach at all.
Market Definition
This market covers enzymes and enzyme systems used as catalysts in chemical and pharmaceutical manufacturing, spanning free enzymes supplied in solution or powder, immobilised and continuous flow biocatalysts, whole cell biocatalysis systems, engineered enzyme development and licensing services, and enzyme immobilisation supports and carriers. Enzymes for food processing, detergents, animal feed, and textile treatment, diagnostic and research enzymes, fermentation-derived products where the enzyme is not the catalyst, and conventional chemical catalysts fall outside scope.
Base Year Value
$3.1B in 2025 (MMA Primary Research Dataset, August 2026)
Forecast Period
2026 to 2036, eleven discrete annual values
CAGR
10.4% base case. Bull 11.6%. Bear 9.2%.
Fastest Growth Segment
Immobilised and Continuous Flow Biocatalysts: 15.6% CAGR
Fastest Growth Country
India: 13.2% CAGR
Fastest Growth Region
South Asia and Pacific: 12.4% CAGR
Largest Region
East Asia: 31% of 2025 global value
Market Leaders
Novonesis, BASF, Codexis, Amano Enzyme, Roche Custom Biotech. Source: MMA Analysis based on company annual reports.
Primary Survey
n=3,800 procurement and R&D decision-makers, Q4 2025, six countries
Methodology
Demand-side build-up, cross-validated against public data, 47 expert interviews

Biocatalysis and Biocatalyst Market Forecast Scenarios

biocatalysis-and-biocatalyst-market-size-forecast-scenario-1787302649002
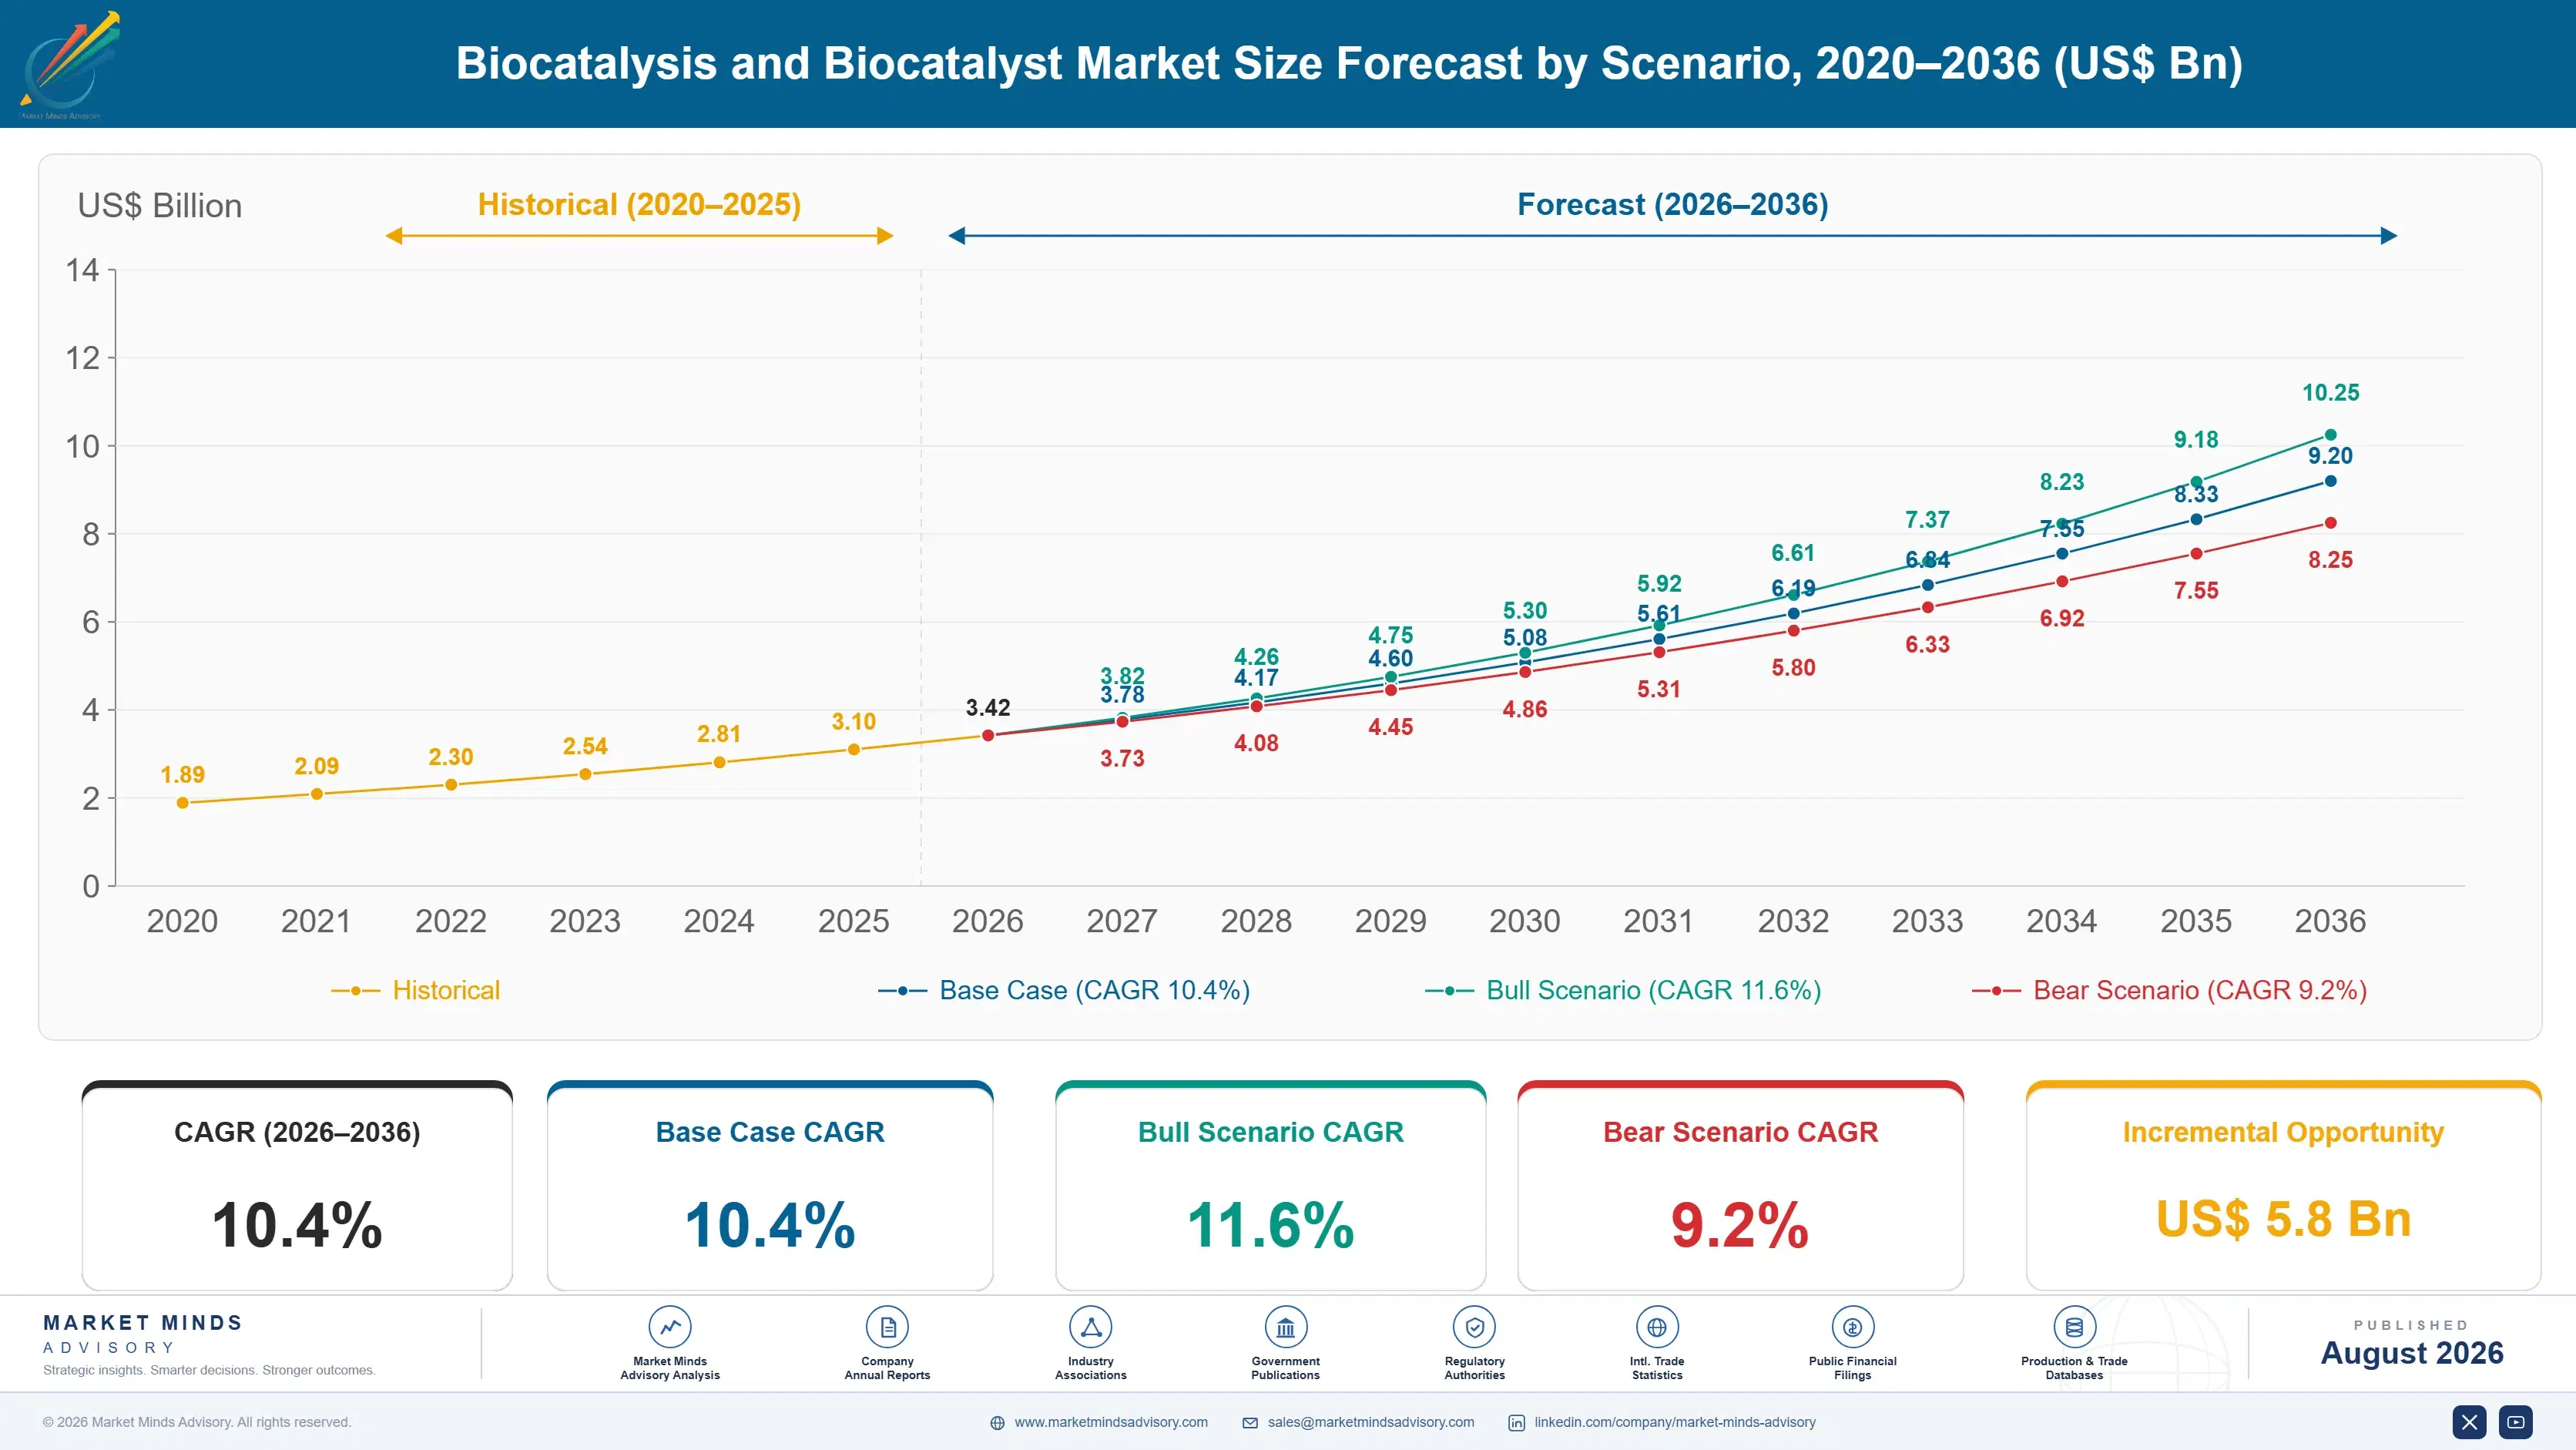
The 2020 to 2025 period ran at 8.9% and pharmaceutical intermediate manufacture carried most of it. Directed evolution capability improved sharply, cutting enzyme discovery timelines from years to months across most reaction classes. Process development capacity did not improve at anything like the same rate, so the bottleneck simply moved downstream rather than disappearing from the sector.
Three mechanisms carry the 10.4% base case. Pharmaceutical route replacement is the largest, since biocatalytic steps remove protecting groups, heavy metal catalysts, and waste streams that regulators and manufacturers both dislike. Immobilisation is the second, which turns a consumable into a reusable asset. And specialty chemical conversion is the third, growing from a smaller base than pharmaceuticals but faster. None of the three depends on any advance in enzyme discovery capability.
The 11.6% bull case rests on continuous flow biocatalysis reaching routine industrial deployment, which would change the economics of enzyme reuse decisively across the whole sector. The 9.2% bear case is process development capacity remaining the constraint it currently is, leaving discovered enzymes stranded at pilot scale while manufacturers default to established chemical routes. Neither case turns on new reaction classes becoming accessible.

Where the Routes Actually Die

Enzyme discovery stopped being the hard part some years ago. Directed evolution and computational design now produce a working candidate for most target reactions in around five months, which would have taken years a decade back. That capability is real, it is widely available, and it has moved the bottleneck rather than removing it. The industry has not fully adjusted to where the bottleneck went.
PILOT TO PRODUCTION FAILURE71%Of biocatalytic routes reaching pilot that never reach production
ENZYME DISCOVERY TIMELINE5 monthsTypical directed evolution campaign to a working candidate enzyme
IMMOBILISED REUSE CYCLES34 cyclesBefore activity falls below the threshold for economic operation
ENZYME SHARE OF COST17%Of total step cost, well below what most people assume
TOP FIVE CONCENTRATION57%High, held by fermentation capacity and strain library depth
WASTE REDUCTION AGAINST CHEMICAL62%Less process waste than the conventional synthetic route replaced
Roughly 71% of biocatalytic routes that reach pilot scale never reach production. The reasons are consistently unglamorous: the enzyme cannot be separated economically from the product stream, activity falls faster in a real reactor than in a screening plate, the aqueous system needs a solvent the enzyme dislikes, or recovering and reusing the enzyme costs more than buying fresh. None of those are enzyme problems.
That is why immobilisation matters more than its share of the market suggests. Fixing an enzyme to a solid support solves separation and reuse simultaneously, delivering around 34 reuse cycles before activity falls below economic threshold, and it turns a consumable into an asset. It also converts a batch process into something that can run continuously, which changes the plant rather than just the chemistry.
"A client had eleven enzymes that worked beautifully at bench scale. Two made it to a plant. The other nine died in downstream processing, and nobody in the discovery group had ever spoken to a separations engineer."
Director, Industrial Biotechnology and Process Chemistry Practice · MMA Chemical

Market Trends

Immobilisation Turns A Consumable Into An Asset

Fixing an enzyme to a solid support solves separation and reuse together, delivering around 34 cycles before activity drops below economic threshold, and it converts what was a per-batch consumable into a reusable asset with a depreciation schedule. Immobilised and continuous flow biocatalysts grow at 15.6% against 10.4% for the market. Carrier chemistry and attachment method matter more to the outcome than the enzyme itself does, which very few discovery groups fully accept. Continuous operation then changes the plant configuration rather than merely the chemistry inside one reactor. Retrofitting immobilisation onto a free enzyme frequently fails on active site conflict.
Market Impact: Cuts process waste by 62%
Discovery Speed Exposes The Process Development Gap

Directed evolution now delivers a working candidate in roughly five months while process development, scale-up, and downstream design still take years, which means enzymes accumulate faster than routes can absorb them. Around 71% of piloted routes never reach production, and the failures are separations and reactor engineering rather than catalysis. Companies with genuine process development capability convert a far higher share of their discoveries, and that capability is scarcer than screening capacity. Process development capability is considerably scarcer than screening capacity across the whole sector. Contract development organisations building internal capability are competing for the same scarce engineers.
Market Impact: Enzymes are 17% of step cost

Market Opportunities and Growth Drivers

Pharmaceutical Routes Remove Steps Rather Than Improve Them

A biocatalytic step frequently eliminates protecting group chemistry, resolution of racemic mixtures, and heavy metal catalysts in a single substitution, which shortens a synthesis rather than merely making one step greener. Process waste falls around 62% against the conventional route replaced, and regulators view removal of metal catalysts favourably in active pharmaceutical ingredient manufacture. The commercial case rests on step count and yield rather than on any environmental argument. Regulators view removal of heavy metal catalysts favourably in active pharmaceutical ingredient manufacture. A shorter synthesis also carries fewer isolation steps and less material loss overall.
Market Impact: About 71% fail after pilot

Enzyme Cost Is Smaller Than Manufacturers Assume

Enzymes carry roughly 17% of total biocatalytic step cost, well below the share most process chemists assume when comparing routes, because fermentation-derived protein is considerably cheaper per kilogram than the precious metal catalysts and chiral auxiliaries it displaces. That misperception blocks evaluations that would otherwise proceed. Suppliers who present total step cost rather than enzyme price per kilogram convert a materially higher share of the conversations they start. Waste treatment, solvent recovery, and yield all belong in that comparison rather than enzyme price alone. Presenting the wrong number blocks evaluations before they even start properly.
Market Impact: Concentration holds at 57%

Market Restraints and Challenges

Downstream Separation Kills Most Piloted Routes

Around 71% of biocatalytic routes reaching pilot never reach production, and the root cause is that screening measures catalytic performance while production requires the enzyme to be separated economically from a product stream nobody optimised for. Commercial impact is discovery investment written off at pilot stage repeatedly. Mitigation runs through immobilisation designed in from the start, separations engineers involved during screening rather than afterward, and route selection weighted toward products where recovery is straightforward. Immobilisation compatibility deserves screening attention equal to catalytic activity itself. Carrier chemistry determines outcomes more than most discovery groups accept.
Market Impact: Immobilised growing at 15.6%

Fermentation Capacity Limits Who Can Actually Supply

Producing enzyme protein at tonne scale requires fermentation capacity, downstream protein recovery, and formulation capability that a design-led company does not necessarily hold, and the root cause is that protein engineering and protein manufacturing are genuinely different businesses. Commercial impact is concentration at 57% and design companies licensing rather than supplying. Mitigation runs through contract fermentation partnerships, capacity investment ahead of demand, and licensing models that accept the manufacturing margin goes elsewhere. Contract fermentation partnerships are the practical alternative to owning capacity outright. Choosing neither route means choosing licensing by default rather than by decision.
Market Impact: Roughly 71% never reach production
3 additional market trends, 4 additional growth drivers, and 2 additional restraints and challenges are covered in the full report. Contact sales@marketmindsadvisory.com to access the complete intelligence.

Segment CAGR and Growth Architecture

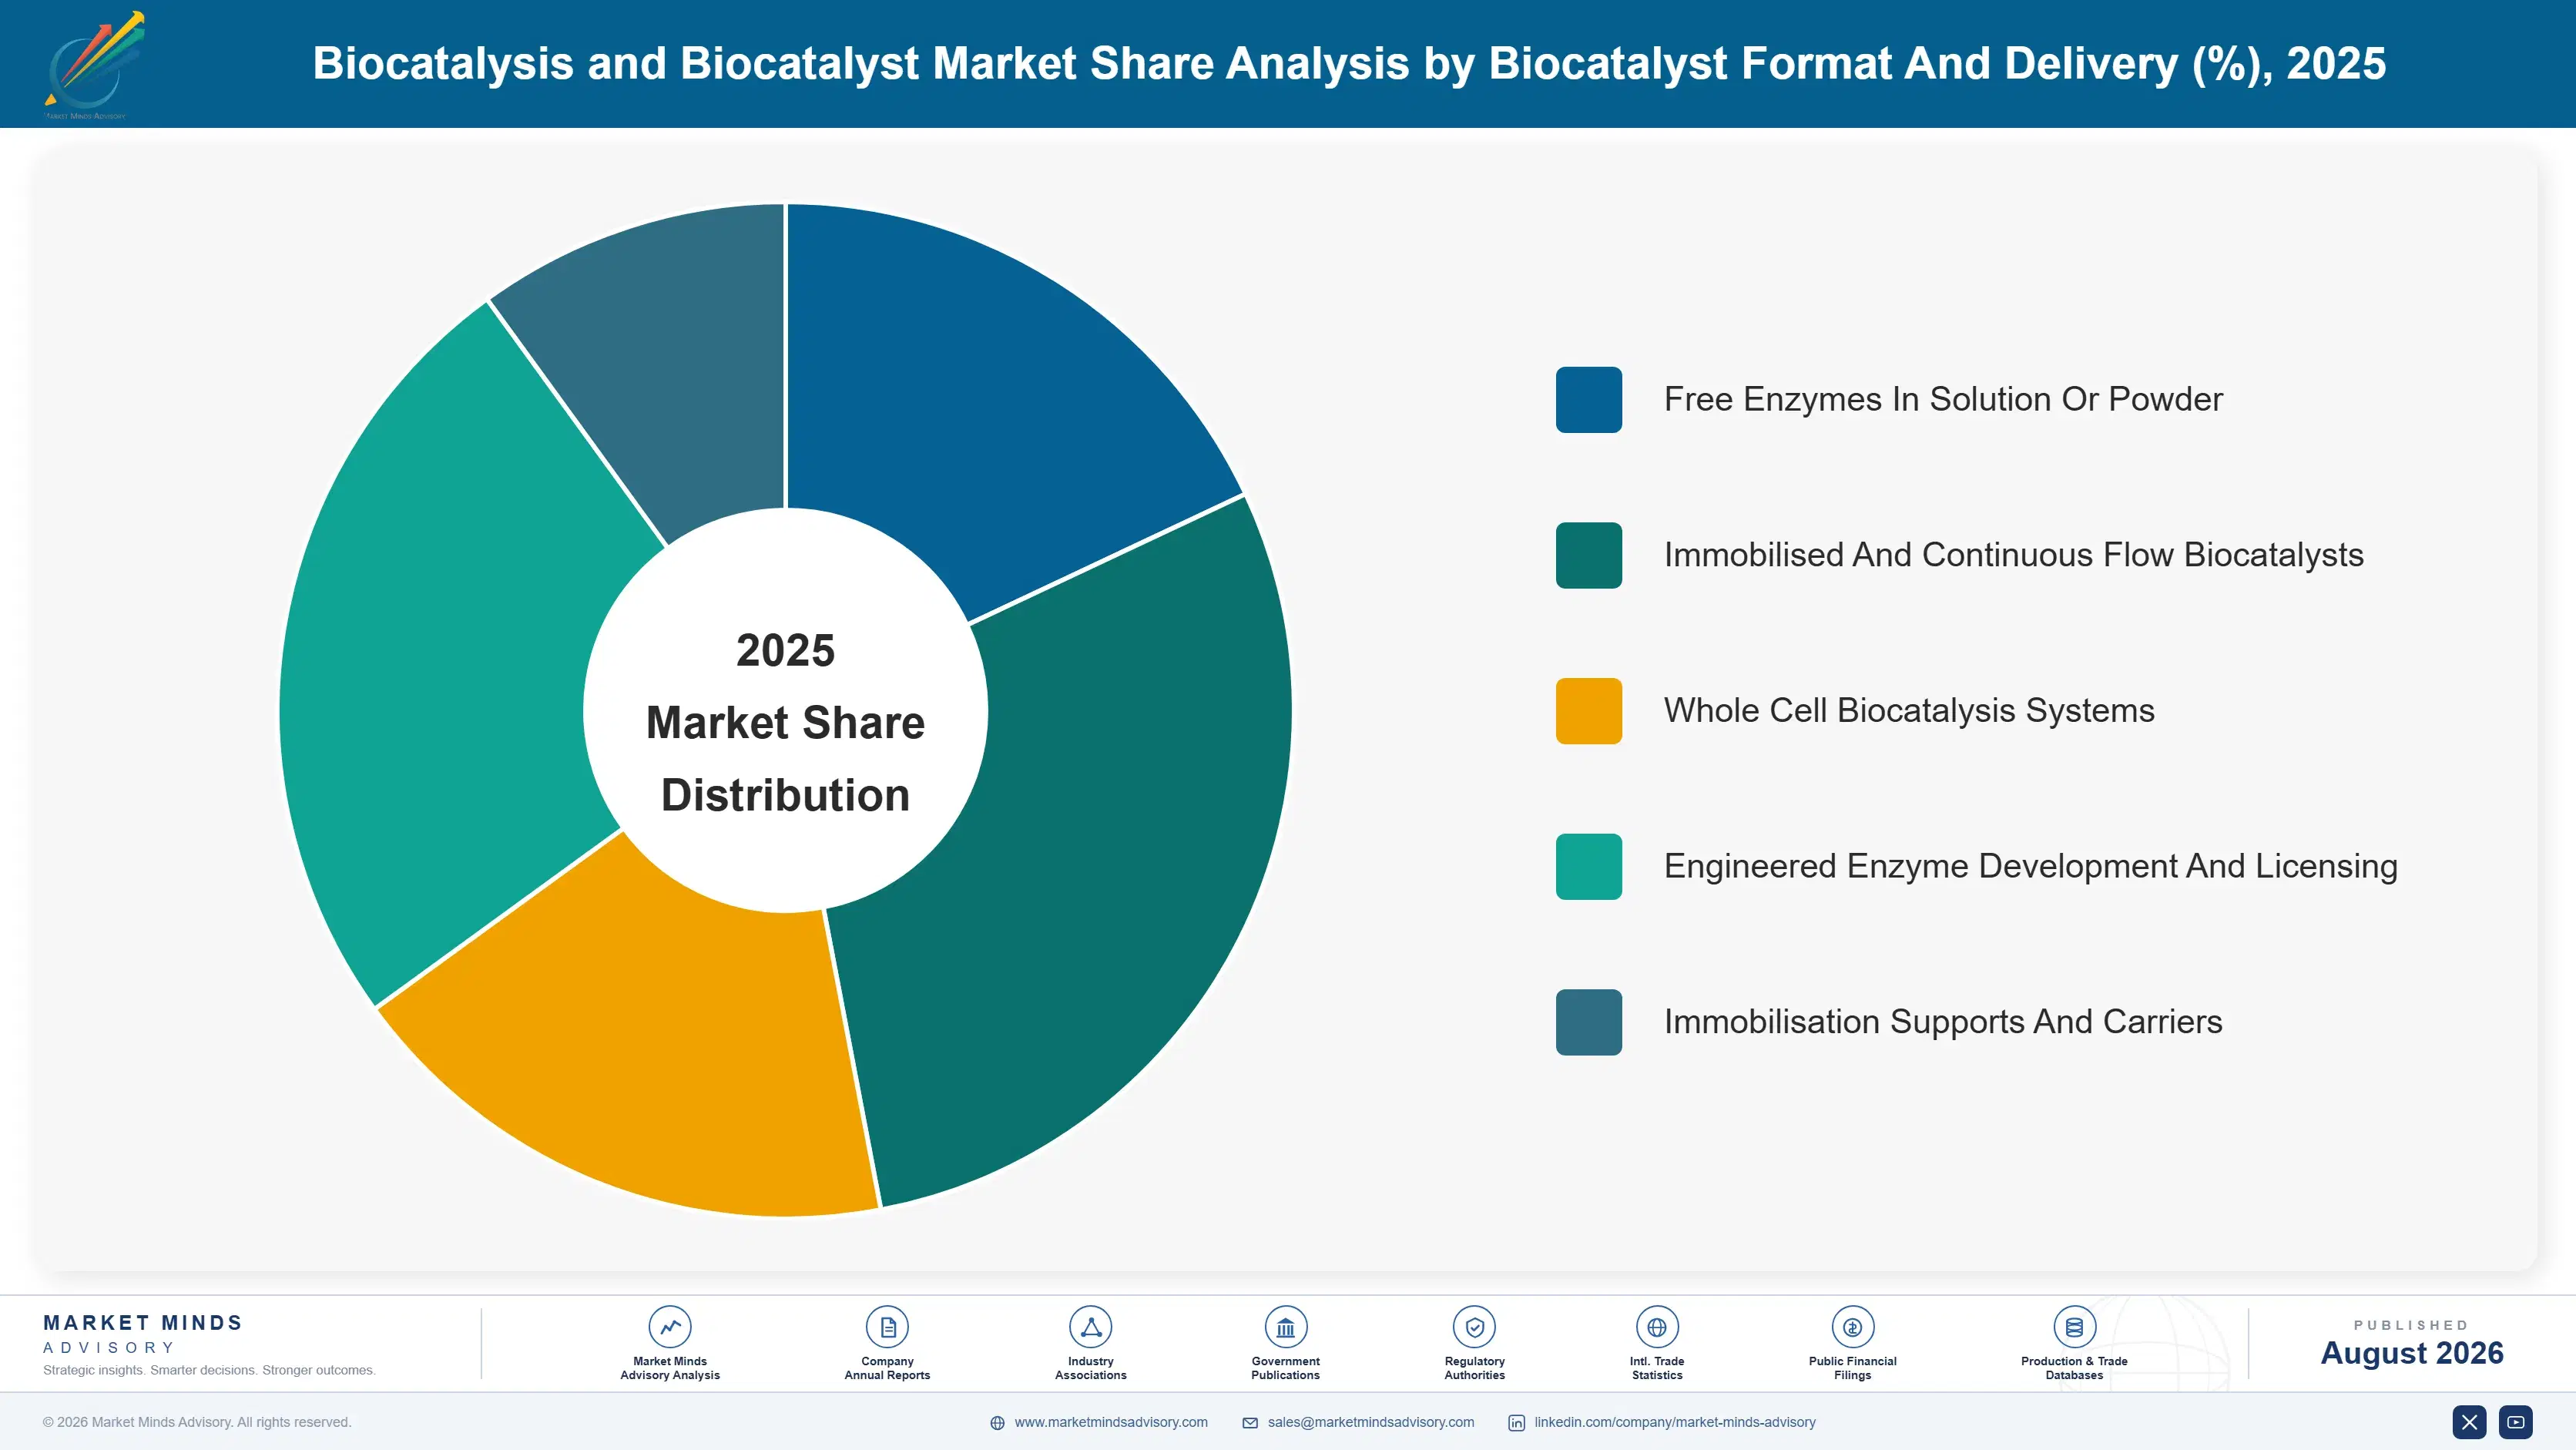
Segmentation follows biocatalyst format and delivery model, because those determine reuse economics, separation requirements, process integration, and whether revenue arrives as product supply or as licensed capability. Reaction class and end-use industry both cut across every format rather than separating them, which makes either a weaker primary dimension here. Delivery model decides whether revenue is product or licence.
biocatalysis-and-biocatalyst-market-market-share-analysis-1787302649558

Immobilised And Continuous Flow Biocatalysts

The fastest format at 15.6%, exactly 1.50 times the market rate, and the one addressing why most routes actually fail. Attaching an enzyme to a solid support solves separation and reuse in a single step, giving around 34 cycles before activity falls below economic threshold and converting a consumable into a depreciating asset. Carrier chemistry and attachment method determine the eventual outcome considerably more than the enzyme itself does. Continuous flow operation then changes the plant configuration rather than merely the chemistry inside one reactor. Selecting candidates that immobilise well from the outset avoids the most common route failure entirely. Retrofitting attachment onto a free enzyme frequently conflicts with the active site.
CAGR 15.6%

Engineered Enzyme Development And Licensing

Second fastest at 13.0%, covering directed evolution and computational design services that deliver a working candidate in roughly five months for most target reactions. The capability is genuine and increasingly available, which is precisely why it no longer differentiates on its own. Companies holding design capability without fermentation capacity license rather than supply, accepting that the manufacturing margin accrues elsewhere. Process development capability alongside design is what converts a discovery into a production route rather than a pilot report. Contract development organisations building internal enzyme capability are eroding this position steadily. Pharmaceutical customers increasingly want a route delivered rather than a candidate handed over. Conversion rate matters more than candidate count.
CAGR 13.0%
Full segment breakdown across 5 segments available in the complete report.

Regional Architecture and Country Demand Map

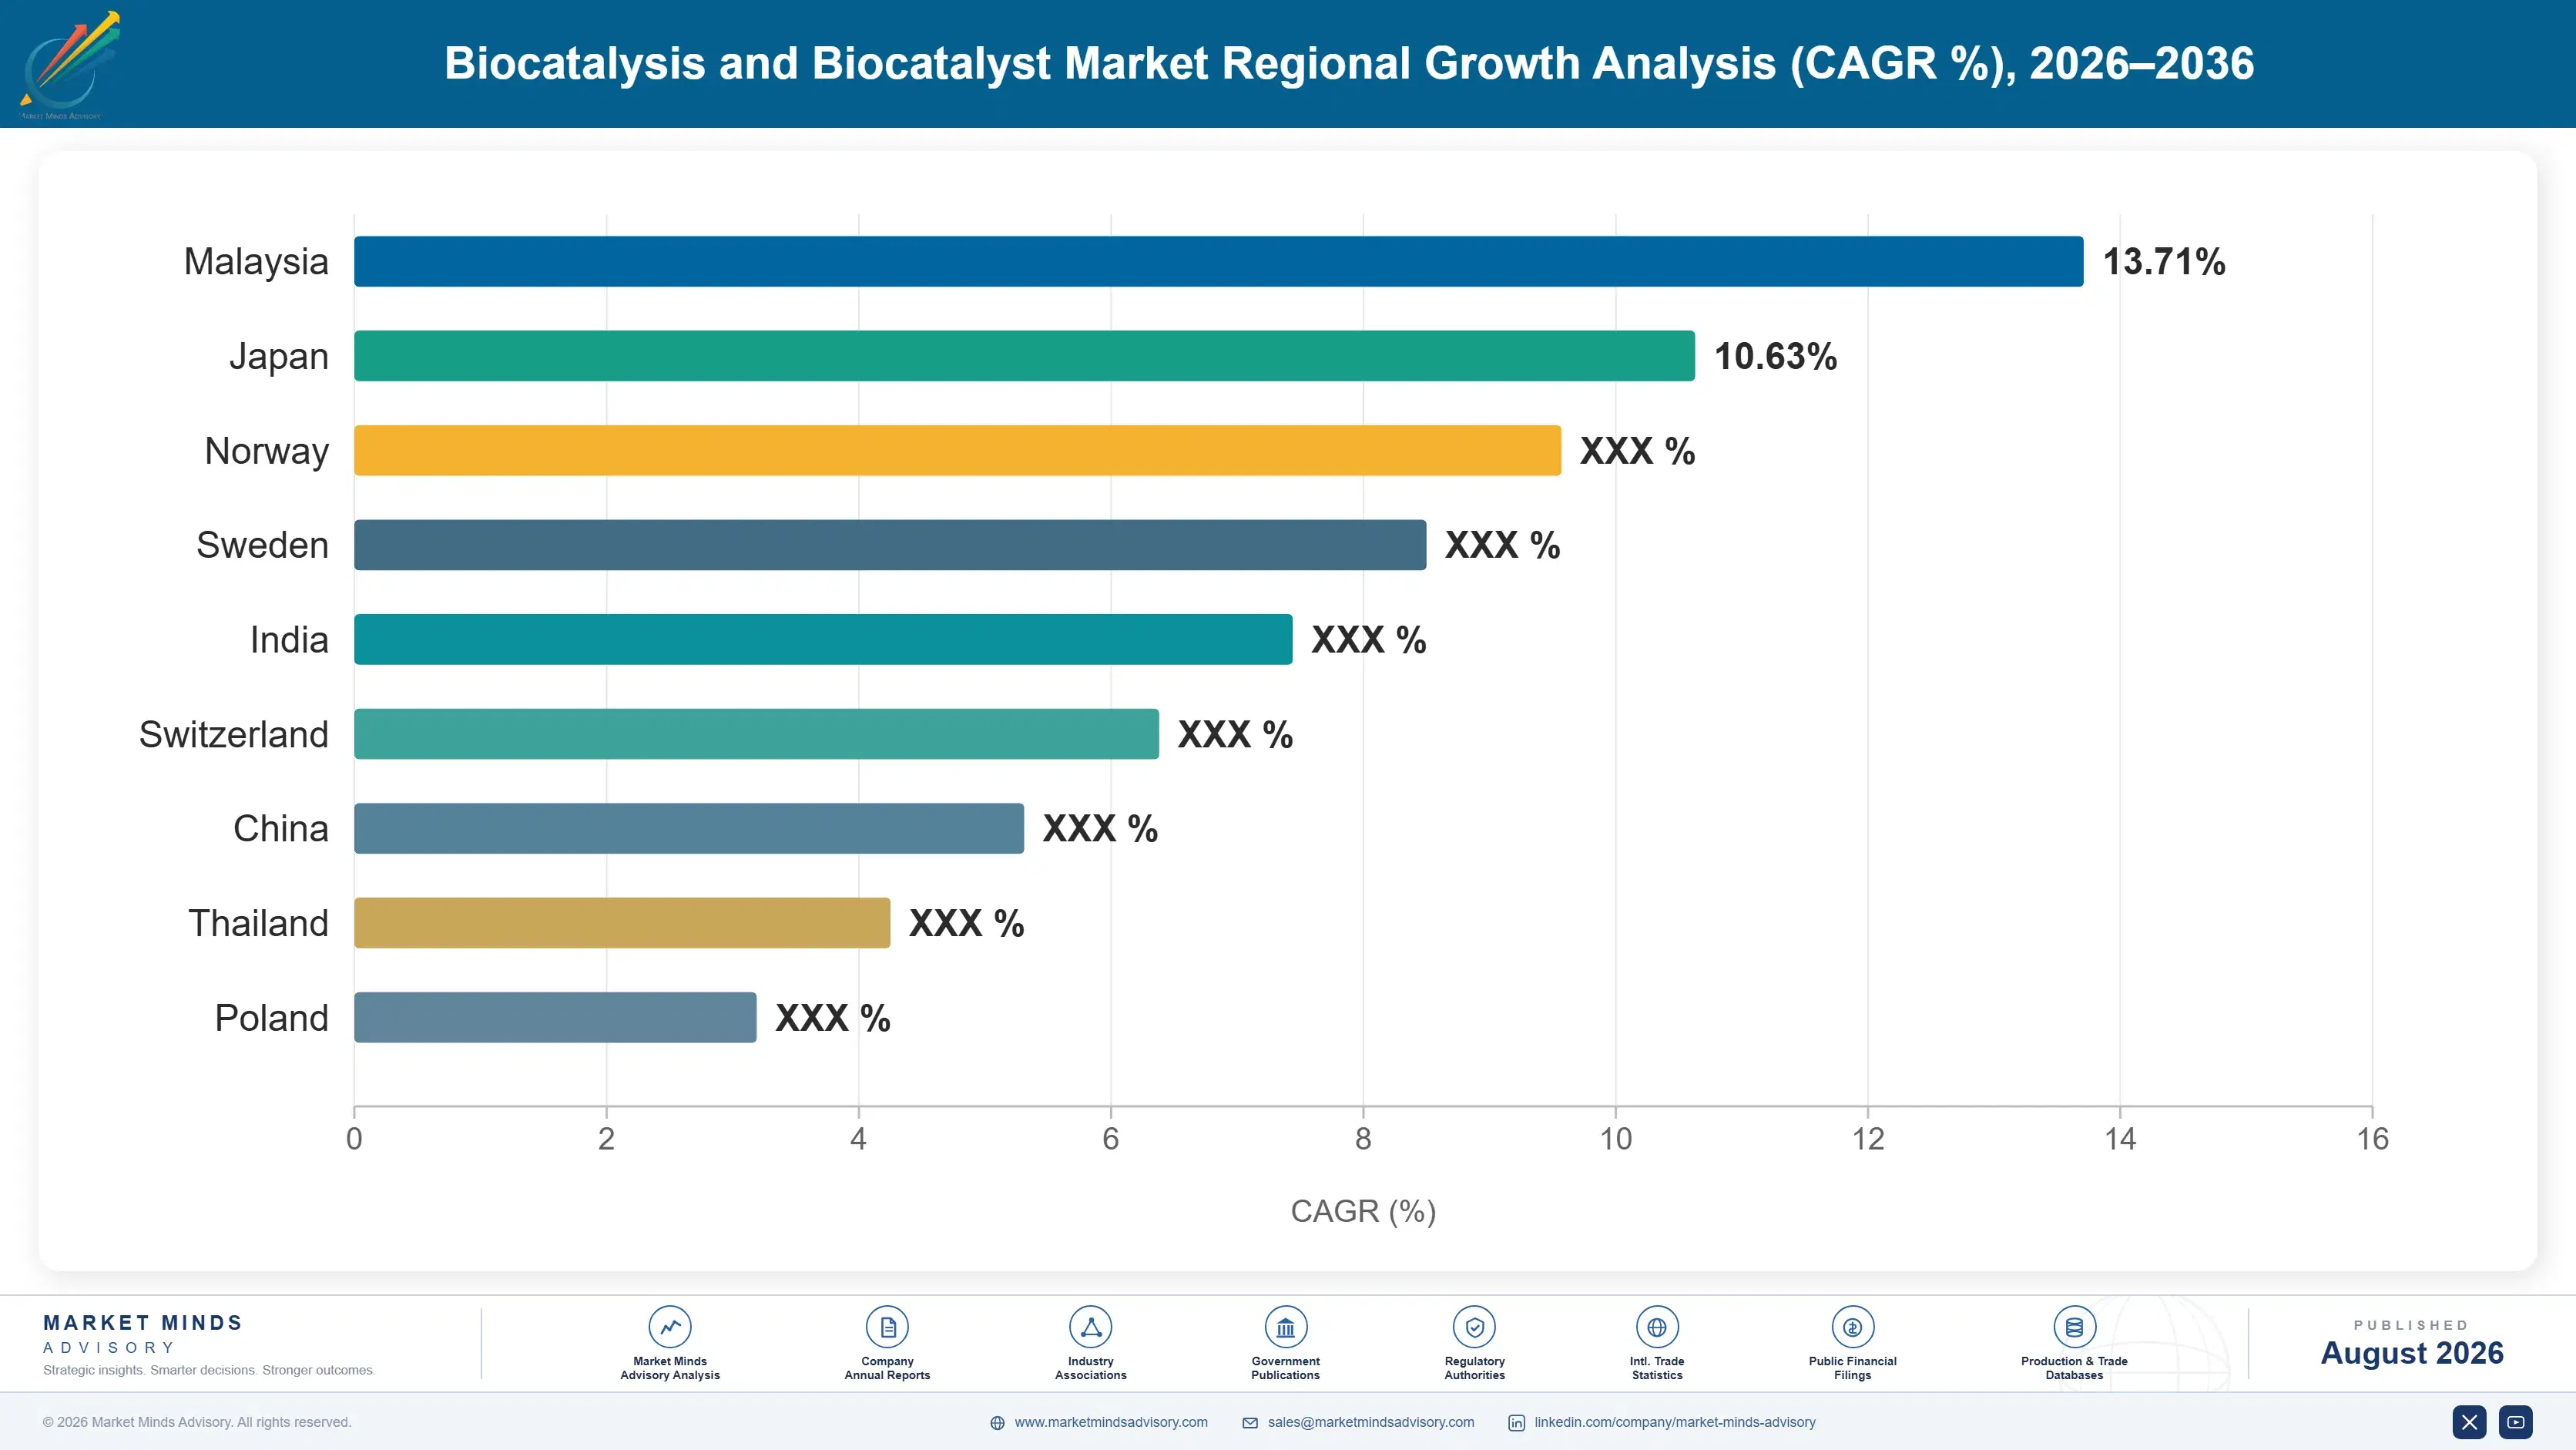
East Asia leads at 31% on Chinese pharmaceutical intermediate and specialty chemical manufacturing volume. Western Europe follows on enzyme engineering and fermentation capability, ahead of North America. South Asia and Pacific grows fastest on Indian pharmaceutical manufacture. Process development capability varies more than discovery does.

East Asia

Thirty-one percent, the largest share, and manufacturing volume rather than enzyme engineering explains it. Chinese pharmaceutical intermediate and specialty chemical production operates at a scale that generates biocatalyst demand no other region matches, and domestic fermentation capacity has expanded considerably to serve it. The 31% sits marginally outside the framework band, justified by a pharmaceutical intermediate manufacturing concentration no other region matches. Japanese enzyme producers hold strong positions in high-specification applications. Growth at 11.4% runs above the market rate on continued intermediate manufacturing expansion. Process development capability lags discovery capacity here as it does everywhere else. Domestic enzyme producers supply established catalyst classes at costs Western fermentation cannot approach, and export volume is growing steadily alongside domestic demand.
Share: 31% | CAGR: 11.4% (2026 to 2036)

Western Europe

Enzyme engineering and fermentation capability rather than manufacturing volume carry this 24%. Danish, Dutch, German, and Swiss companies developed much of the directed evolution and immobilisation technology this sector depends on, and European fermentation capacity is substantial and well established. Pharmaceutical manufacturers here adopt biocatalytic routes readily where waste and metal catalyst removal both matter. Growth at 8.8% is the slowest of any region, reflecting mature adoption rather than any weakness in capability or specification. Fermentation capacity here is the deepest outside China and supports supply rather than licensing. Immobilisation carrier technology developed in the region is used worldwide. Process development capability is genuinely strong. Immobilisation carrier suppliers based here serve manufacturers worldwide.
Share: 24% | CAGR: 8.8% (2026 to 2036)
Regional intelligence for 5 additional markets available in the complete report: North America, South Asia and Pacific, Latin America, Middle East and Africa, Eastern Europe. Contact sales@marketmindsadvisory.com.
biocatalysis-and-biocatalyst-market-country-cagr-analysis-1787302650106

Solving the Downstream, Not the Enzyme

Roughly 71% of piloted routes never reach production, discovery takes about five months, immobilised catalysts give 34 reuse cycles, and enzymes are only 17% of step cost. Value comes from process development capability, from immobilisation, and from selling total step economics. The bottleneck moved downstream and much of the industry has not followed it.

Put Separations Engineers Into The Screening Programme

Around 71% of biocatalytic routes reaching pilot never reach production, and the failures are separation, enzyme recovery, and reactor engineering rather than any shortfall in catalytic performance. Screening campaigns that never involve a separations engineer optimise for entirely the wrong properties, and they produce candidates nobody can use industrially. Involving process engineering during selection rather than after it changes which enzymes get advanced, and it converts a materially higher share of discovery investment into actual routes. Route selection weighted toward products where recovery is straightforward also raises the conversion rate materially.
Market Impact: About 71% of piloted routes still f

Immobilise From The Start Rather Than Afterward

Attaching an enzyme to a support solves separation and reuse together and delivers around 34 cycles before activity drops below economic threshold, but retrofitting immobilisation onto an enzyme selected free in solution frequently fails because attachment chemistry conflicts with the active site. Selecting candidates that immobilise well from the beginning costs screening throughput and avoids the most common route failure. Carrier chemistry deserves as much attention as the enzyme sequence receives. Carrier chemistry and attachment method determine the outcome more than the enzyme sequence does. Selecting a carrier on purchase price rather than cycles delivered is an expensive error.
Market Impact: Immobilised catalysts give around 3

Quote Total Step Cost Not Enzyme Price

Enzymes carry roughly 17% of total biocatalytic step cost, considerably less than most process chemists assume when comparing against a conventional route, because fermentation protein is cheap relative to the precious metal catalysts and chiral auxiliaries it displaces. That misperception blocks evaluations before they start. Suppliers presenting total step economics including waste treatment, solvent, and yield convert far more conversations than those quoting enzyme price per kilogram. A biocatalytic step frequently removes protecting groups and resolution stages alongside the metal catalyst. Step count rather than any environmental argument closes these decisions.
Market Impact: Enzymes are only 17% of total step

Secure Fermentation Capacity Or Accept Licensing

Producing enzyme protein at tonne scale requires fermentation, protein recovery, and formulation capability that protein engineering companies frequently lack, and concentration sits at 57% precisely because those are different businesses. A design company without capacity licenses its enzymes and watches the manufacturing margin accrue elsewhere. Contract fermentation partnerships or owned capacity are the two routes available, and choosing neither means choosing licensing by default rather than by decision. Fermentation utilisation is itself the dominant variable in enzyme production cost. A producer running intermittently carries a per-kilogram penalty no purchasing can offset.
Market Impact: Concentration currently sits at 57%

Who Controls the Margin Pool

Concentration is high at 57% across the top five measured on enzyme protein supplied by weight, and fermentation capacity combined with strain library depth holds it there rather than any advantage in enzyme design. Directed evolution capability has become widely available and no longer differentiates on its own, while the ability to produce a designed enzyme at tonne scale with consistent activity remains genuinely scarce. The leader to challenger gap is wide on supply and narrow on design.
Competitive activity runs on three fronts. Process development capability is the first and by far the most consequential, since it determines what share of discovered enzymes become production routes. Immobilisation and carrier chemistry is the second, which addresses the failure mode that kills most piloted processes. And fermentation capacity is the third, deciding whether a company supplies product or licenses capability.

Pressure arrives from two directions. Contract development organisations are building their own enzyme capability and reducing dependence on external suppliers. And Chinese enzyme producers supply established catalyst classes at costs Western fermentation cannot approach. Both pressures reduce what a design-led company without capacity can actually capture.

Rankings shift on process development wins rather than discovery announcements.
biocatalysis-and-biocatalyst-market-company-positioning-matrix-1787302650634

Competitive Moat and Risk Dimensions

NOVONESIS

Moat: Fermentation scale and strain libraries

Producing enzyme protein at industrial scale with consistent activity requires fermentation capacity, downstream recovery, and formulation capability that design-led competitors do not hold, and accumulated strain libraries shorten development on every new target. That combination determines who can supply rather than merely license. Building equivalent capacity takes years of regulated capital investment.
NOVONESIS

Risk: Design capability commoditising rapidly

Directed evolution and computational design have become widely available, so the differentiation that once accompanied a strong discovery organisation is eroding steadily across the sector. Manufacturing scale defends supply positions and contributes nothing to winning the design work that precedes them. Value is concentrating in process development, which is a different capability from either.
CODEXIS

Moat: Directed evolution platform depth

A mature directed evolution platform with accumulated sequence and performance data delivers candidates faster and with better starting properties than newer entrants achieve, which matters when a pharmaceutical customer needs a route decision quickly. Pharmaceutical relationships built through successful route development compound that advantage across subsequent programmes.
CODEXIS

Risk: Licensing gives away manufacturing margin

Without fermentation capacity at scale, a design company licenses its enzymes and watches the manufacturing margin accrue to whoever produces them, which caps the value captured from each successful programme. Building capacity requires capital and a different operating discipline entirely. The alternative is accepting a permanently smaller share of the economics created.

Players Tracked

Prominent Players

Novonesis
BASF
Codexis
Amano Enzyme
Roche Custom Biotech

Other Key Players

DSM-Firmenich
Enzymaster
Johnson Matthey
Almac Group
Evonik Industries
Sekisui Diagnostics
Nagase ChemteX
Chr Hansen
Advanced Enzyme Technologies
Creative Enzymes
Prozomix
EnzymeWorks
Lonza
Asymchem
WuXi AppTec

Recent Developments

JANUARY 2025

Pharmaceutical manufacturer adds separations review to enzyme screening

A pharmaceutical manufacturer restructured its biocatalysis programme to involve separations and process engineering during enzyme candidate selection rather than after pilot work, following repeated route failures downstream. The change was an internal process revision rather than any joint venture, acquisition, or partnership with an enzyme supplier.
Signal: Screening for catalysis alone produces can
APRIL 2025

Supplier launches immobilisation-first candidate selection service

An enzyme developer began screening candidates for immobilisation compatibility alongside catalytic performance from the outset, rather than attempting to immobilise enzymes selected free in solution. The service launch was organic capability development rather than any acquisition, joint venture, or licensing arrangement with a carrier producer.
Signal: Retrofitting immobilisation onto a free en
AUGUST 2025

Contract manufacturer builds internal enzyme engineering capability

A pharmaceutical contract development and manufacturing organisation established internal enzyme engineering capability, reducing its dependence on external biocatalyst suppliers for route development work. The investment was organic capability building rather than any acquisition, joint venture, or licensing arrangement with an enzyme company. Recruitment focused on process engineers.
Signal: Discovery capability spreading downstream

Fermentation, Recovery and Carriers

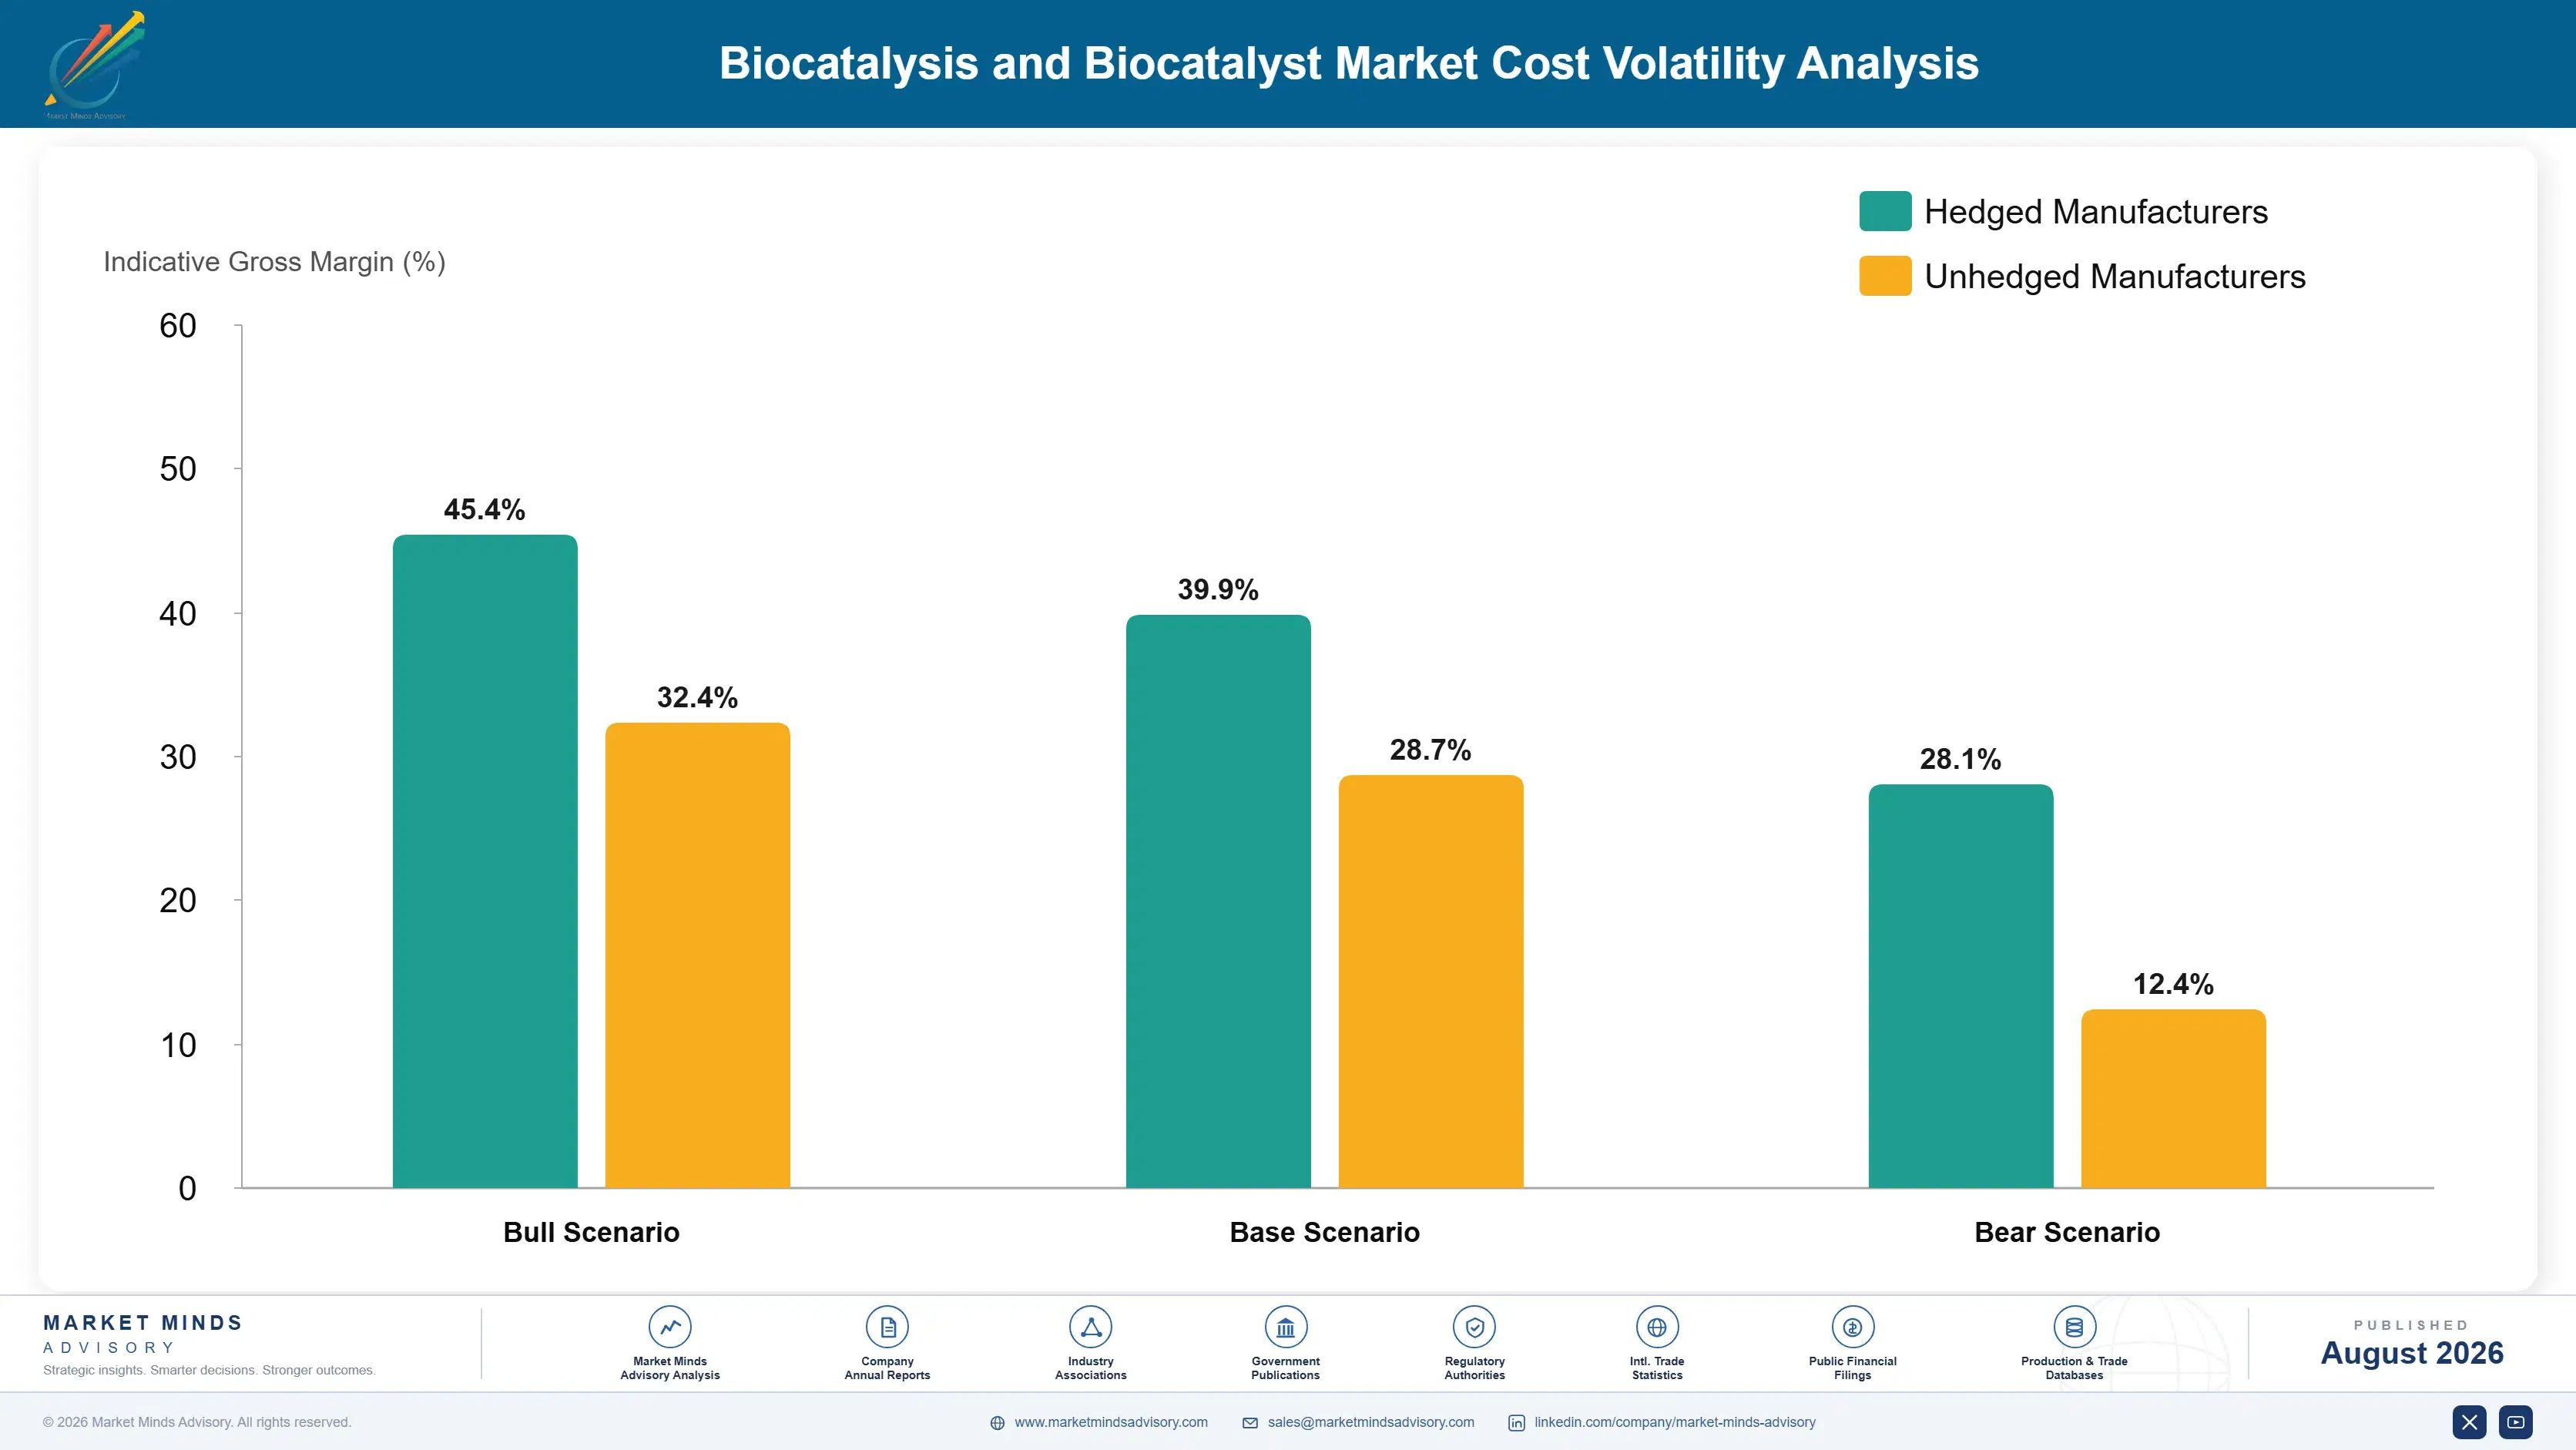
Fermentation media, feedstock, and utilities carry roughly 31% of enzyme production cost, downstream protein recovery and purification about 26%, formulation and stabilisation near 13%, immobilisation carriers and attachment chemistry around 15% where applicable, and quality testing, packaging, and overhead the balance across a typical production campaign. Fermentation capacity utilisation shapes all of those figures considerably. Intermittent campaigns carry a substantial penalty throughout.
Fermentation feedstock and energy pricing moved sharply through 2021 and 2022, and several industrial biotechnology producers disclosed margin compression and utility cost increases in annual filings covering those years. Single-use bioprocess consumables were also allocated during the same period as vaccine manufacture consumed available supply. Availability has normalised while pricing on both inputs has settled above earlier levels permanently. Utility cost in particular has stayed elevated.

The competitive disadvantage mechanism runs through fermentation utilisation rather than through feedstock purchasing. Fixed capacity cost spreads across whatever a campaign produces, so a producer running continuously carries a substantially lower unit cost than one running intermittently against sporadic demand. Feedstock and media cost broadly the same for everyone; capacity loading does not, and it determines who can price competitively against Chinese fermentation.
biocatalysis-and-biocatalyst-market-cost-volatility-analysis-1787302650830

Load fermentation capacity continuously rather than by campaign

Fixed fermentation cost spreads across whatever a campaign actually produces, so intermittent production carries a per-kilogram penalty that no feedstock negotiation offsets. Producers holding enough committed demand to run continuously hold a cost position competitors cannot match through purchasing. Building that demand base requires commercial commitment ahead of capacity rather than the reverse sequence most producers follow.

Select carriers on total cycle economics not unit price

Immobilisation carriers carry around 15% of production cost where they are used, and a cheaper carrier delivering fewer than the roughly 34 reuse cycles a better one achieves costs considerably more across a whole campaign. Carrier selection on purchase price rather than on cycles delivered is a common and expensive error. Attachment chemistry compatibility matters as much as the material.

Design recovery steps alongside the fermentation process

Downstream protein recovery and purification carry about 26% of production cost, and processes designed to maximise fermentation titre without regard to recovery routinely produce broths that are expensive to work up. Optimising titre and recoverability together costs development iterations and produces a materially lower total cost. Very few producers currently sequence that work in the right order.

Portfolio Architecture for Margin Defence

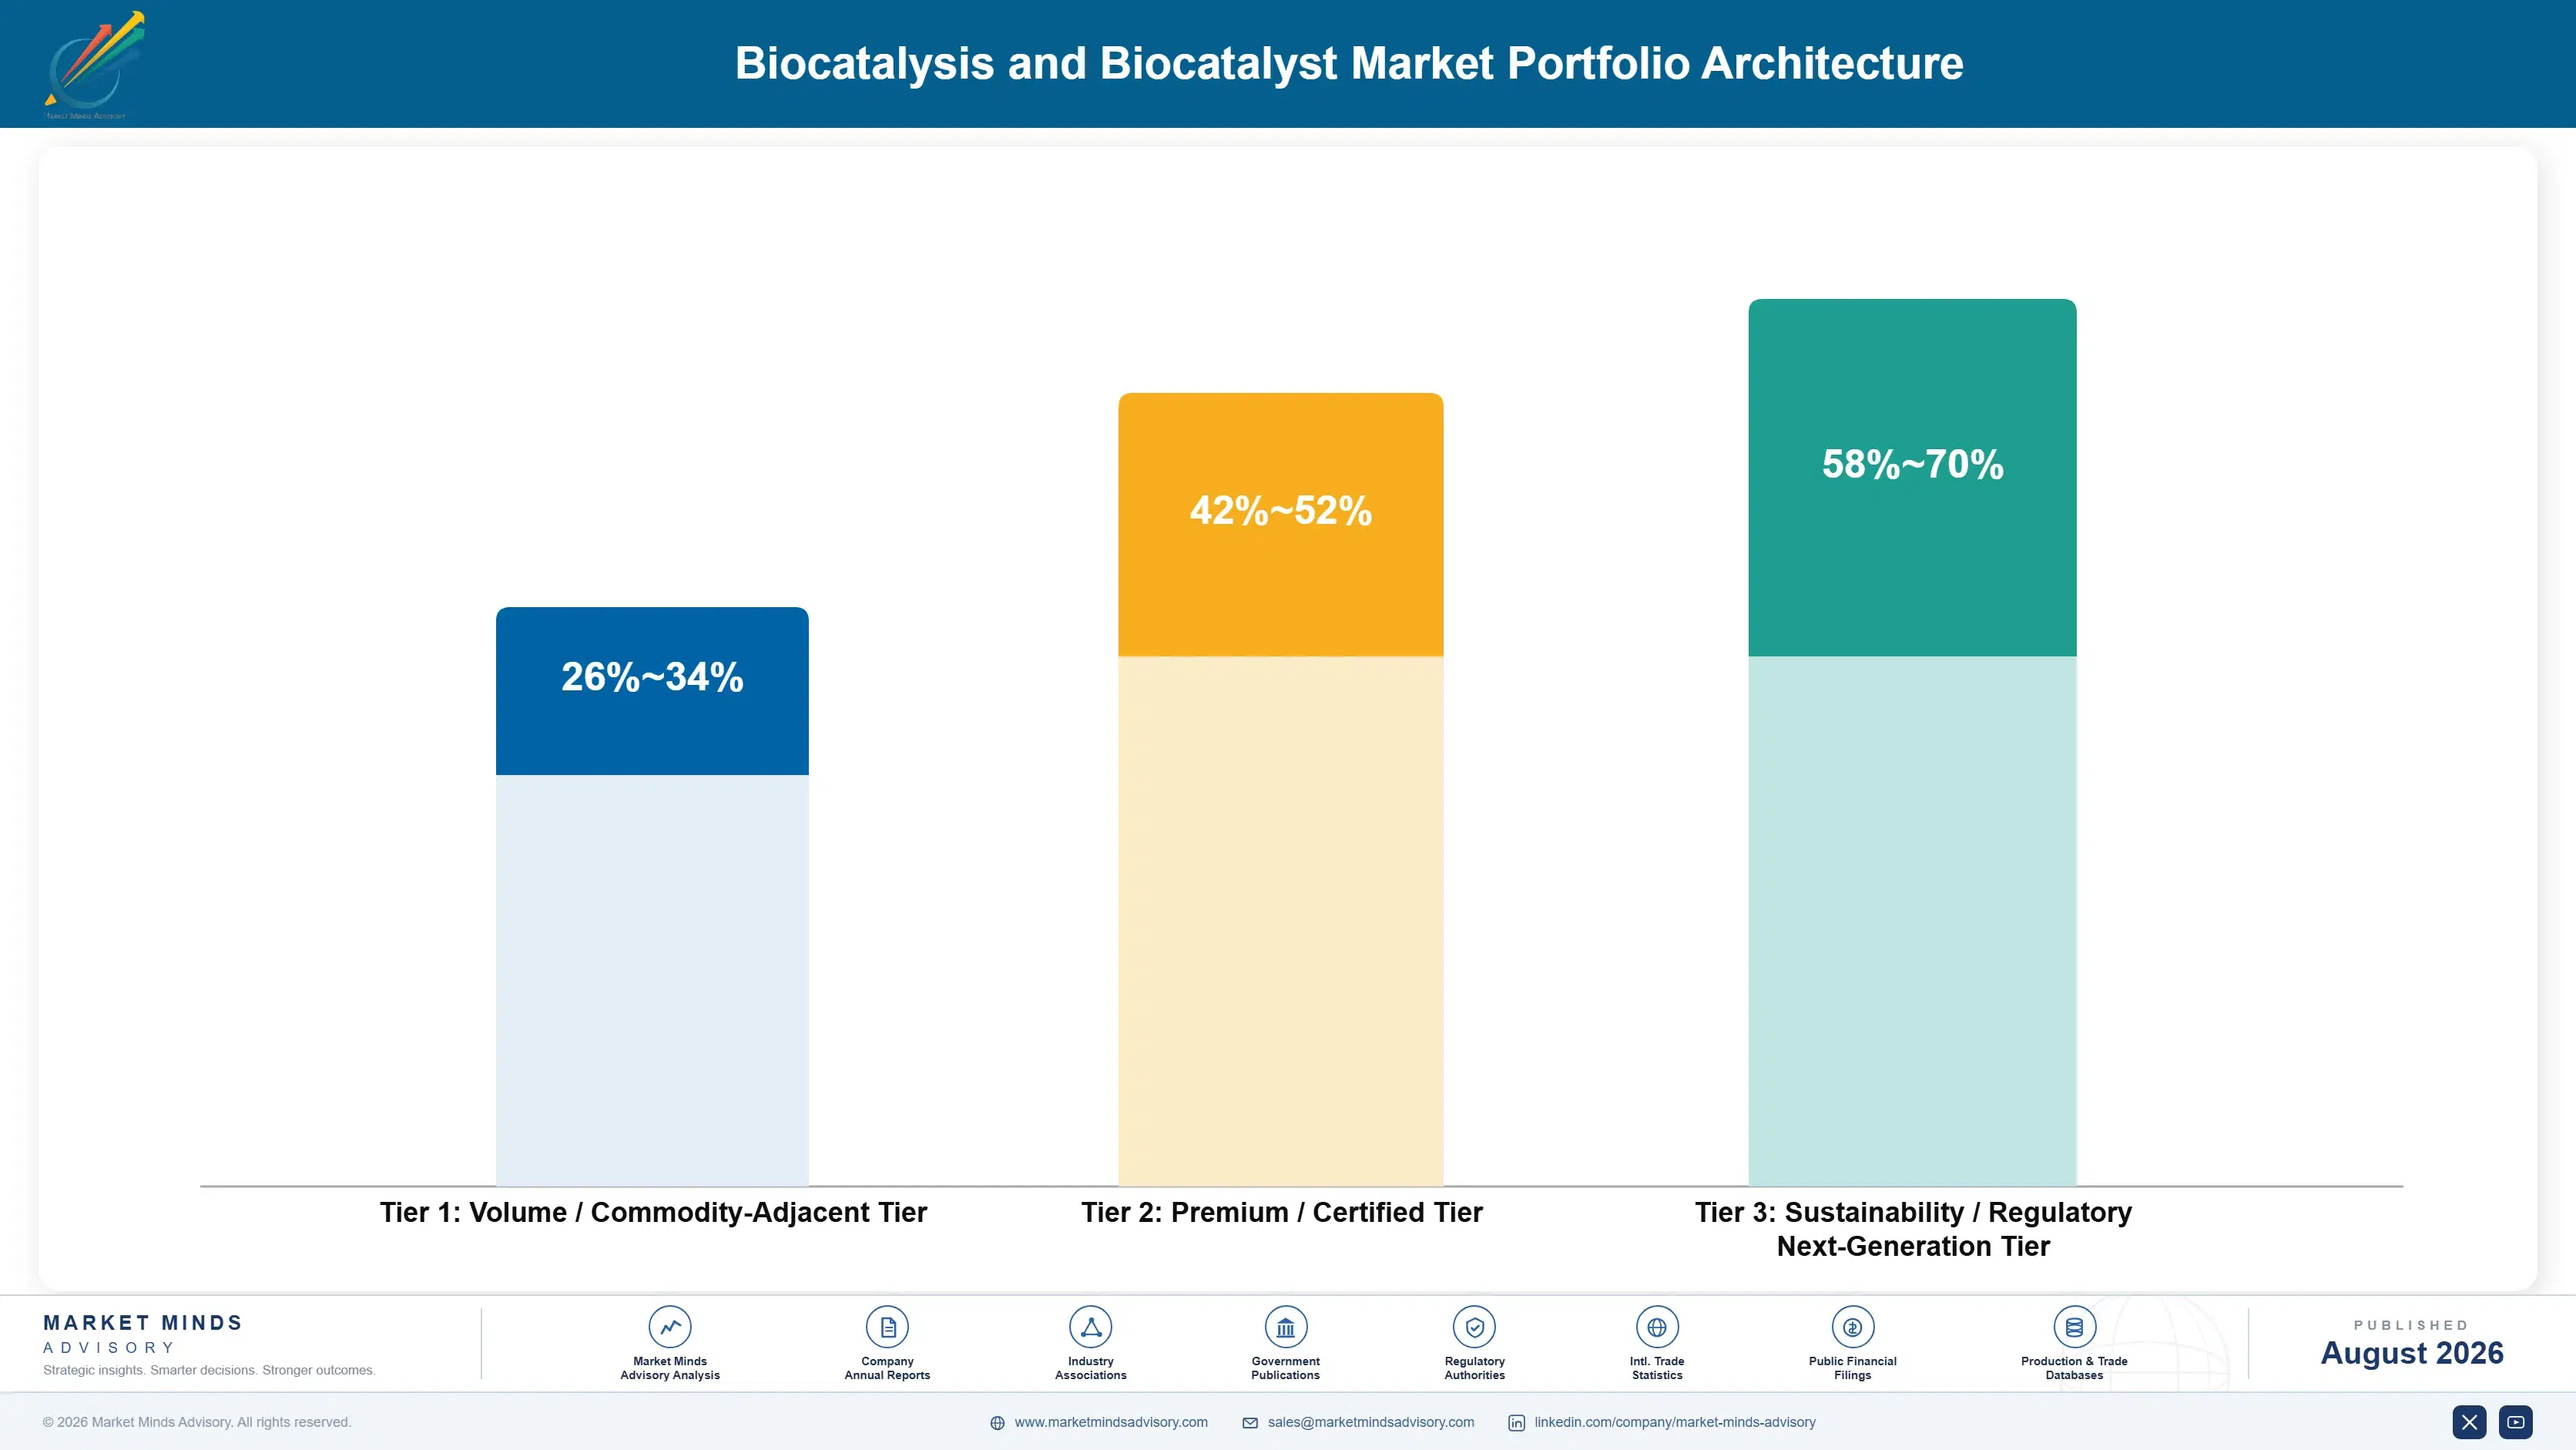
Three tiers describe this business and the spread follows format and integration rather than enzyme sophistication. Free enzymes supplied in solution sit at the bottom, competing on price per unit of activity where Chinese fermentation sets terms. Whole cell systems and standard immobilised products occupy the middle. Custom immobilised catalysts with process development attached sit at the top, priced on the route delivered rather than on protein supplied.
The tension is that the top tier requires process engineering capability that enzyme companies do not naturally develop, while the bottom tier competes against fermentation cost positions Western producers cannot match. A design-led company without process capability licenses. A fermentation-led company without design capability supplies commodity classes. Very few participants hold discovery, production, and process development together properly.

High-value pools concentrate where the customer is buying a working route rather than a catalyst. Pharmaceutical route replacement is the clearest case, since removing protecting groups and metal catalysts changes step count and regulatory position simultaneously. Custom immobilised catalysts pool value similarly, because the customer is buying a working process rather than a protein. Both pools require process capability enzyme companies rarely hold.

Volume / Commodity-Adjacent Tier

Free enzymes supplied in solution or powder for established catalyst classes, competing on price per unit of activity where Chinese fermentation capacity sets the terms. Volume funds capacity utilisation and contributes limited margin on its own.
Gross Margin: 26-34%

Premium / Certified Tier

Whole cell systems and standard immobilised biocatalysts where reuse economics and process integration both matter. Carrier chemistry and attachment method differentiate genuinely, and around 34 reuse cycles changes the cost comparison entirely.
Gross Margin: 42-52%

Sustainability / Regulatory / Next-Generation Tier

Custom immobilised catalysts supplied with process development and continuous flow integration, priced on the route delivered rather than the protein supplied. Best margin by a clear distance, and it requires capability enzyme companies rarely hold.
Gross Margin: 58-70%
biocatalysis-and-biocatalyst-market-portfolio-architecture-1787302651331

Routes, Campaigns and Reuse

Revenue arrives against production campaigns once a route is established, which makes demand predictable across a product life and entirely absent before it. A biocatalytic step qualified into a pharmaceutical process consumes enzyme against manufacturing volume for the product's commercial life, and immobilised systems consume considerably less per batch than free enzyme does across roughly 34 reuse cycles. Immobilised systems consume considerably less protein per batch across their reuse life.
Stickiness runs through regulatory filing rather than through commercial relationship. A biocatalytic step written into a pharmaceutical manufacturing submission cannot be changed without regulatory notification and revalidation, which no manufacturer undertakes for a supply price difference. Specialty chemical routes stick less firmly, and free enzyme supply into established catalyst classes sticks hardly at all and is retendered on activity price.

Buyer profiles shifted as the bottleneck moved from discovery to process. The earlier buyer was a medicinal or process chemist evaluating catalytic performance against a reaction. The current conversation increasingly involves a chemical engineer asking about separation, reuse cycles, and reactor configuration before catalytic activity is even discussed. Those engineers evaluate the whole downstream train before catalytic activity is even discussed.
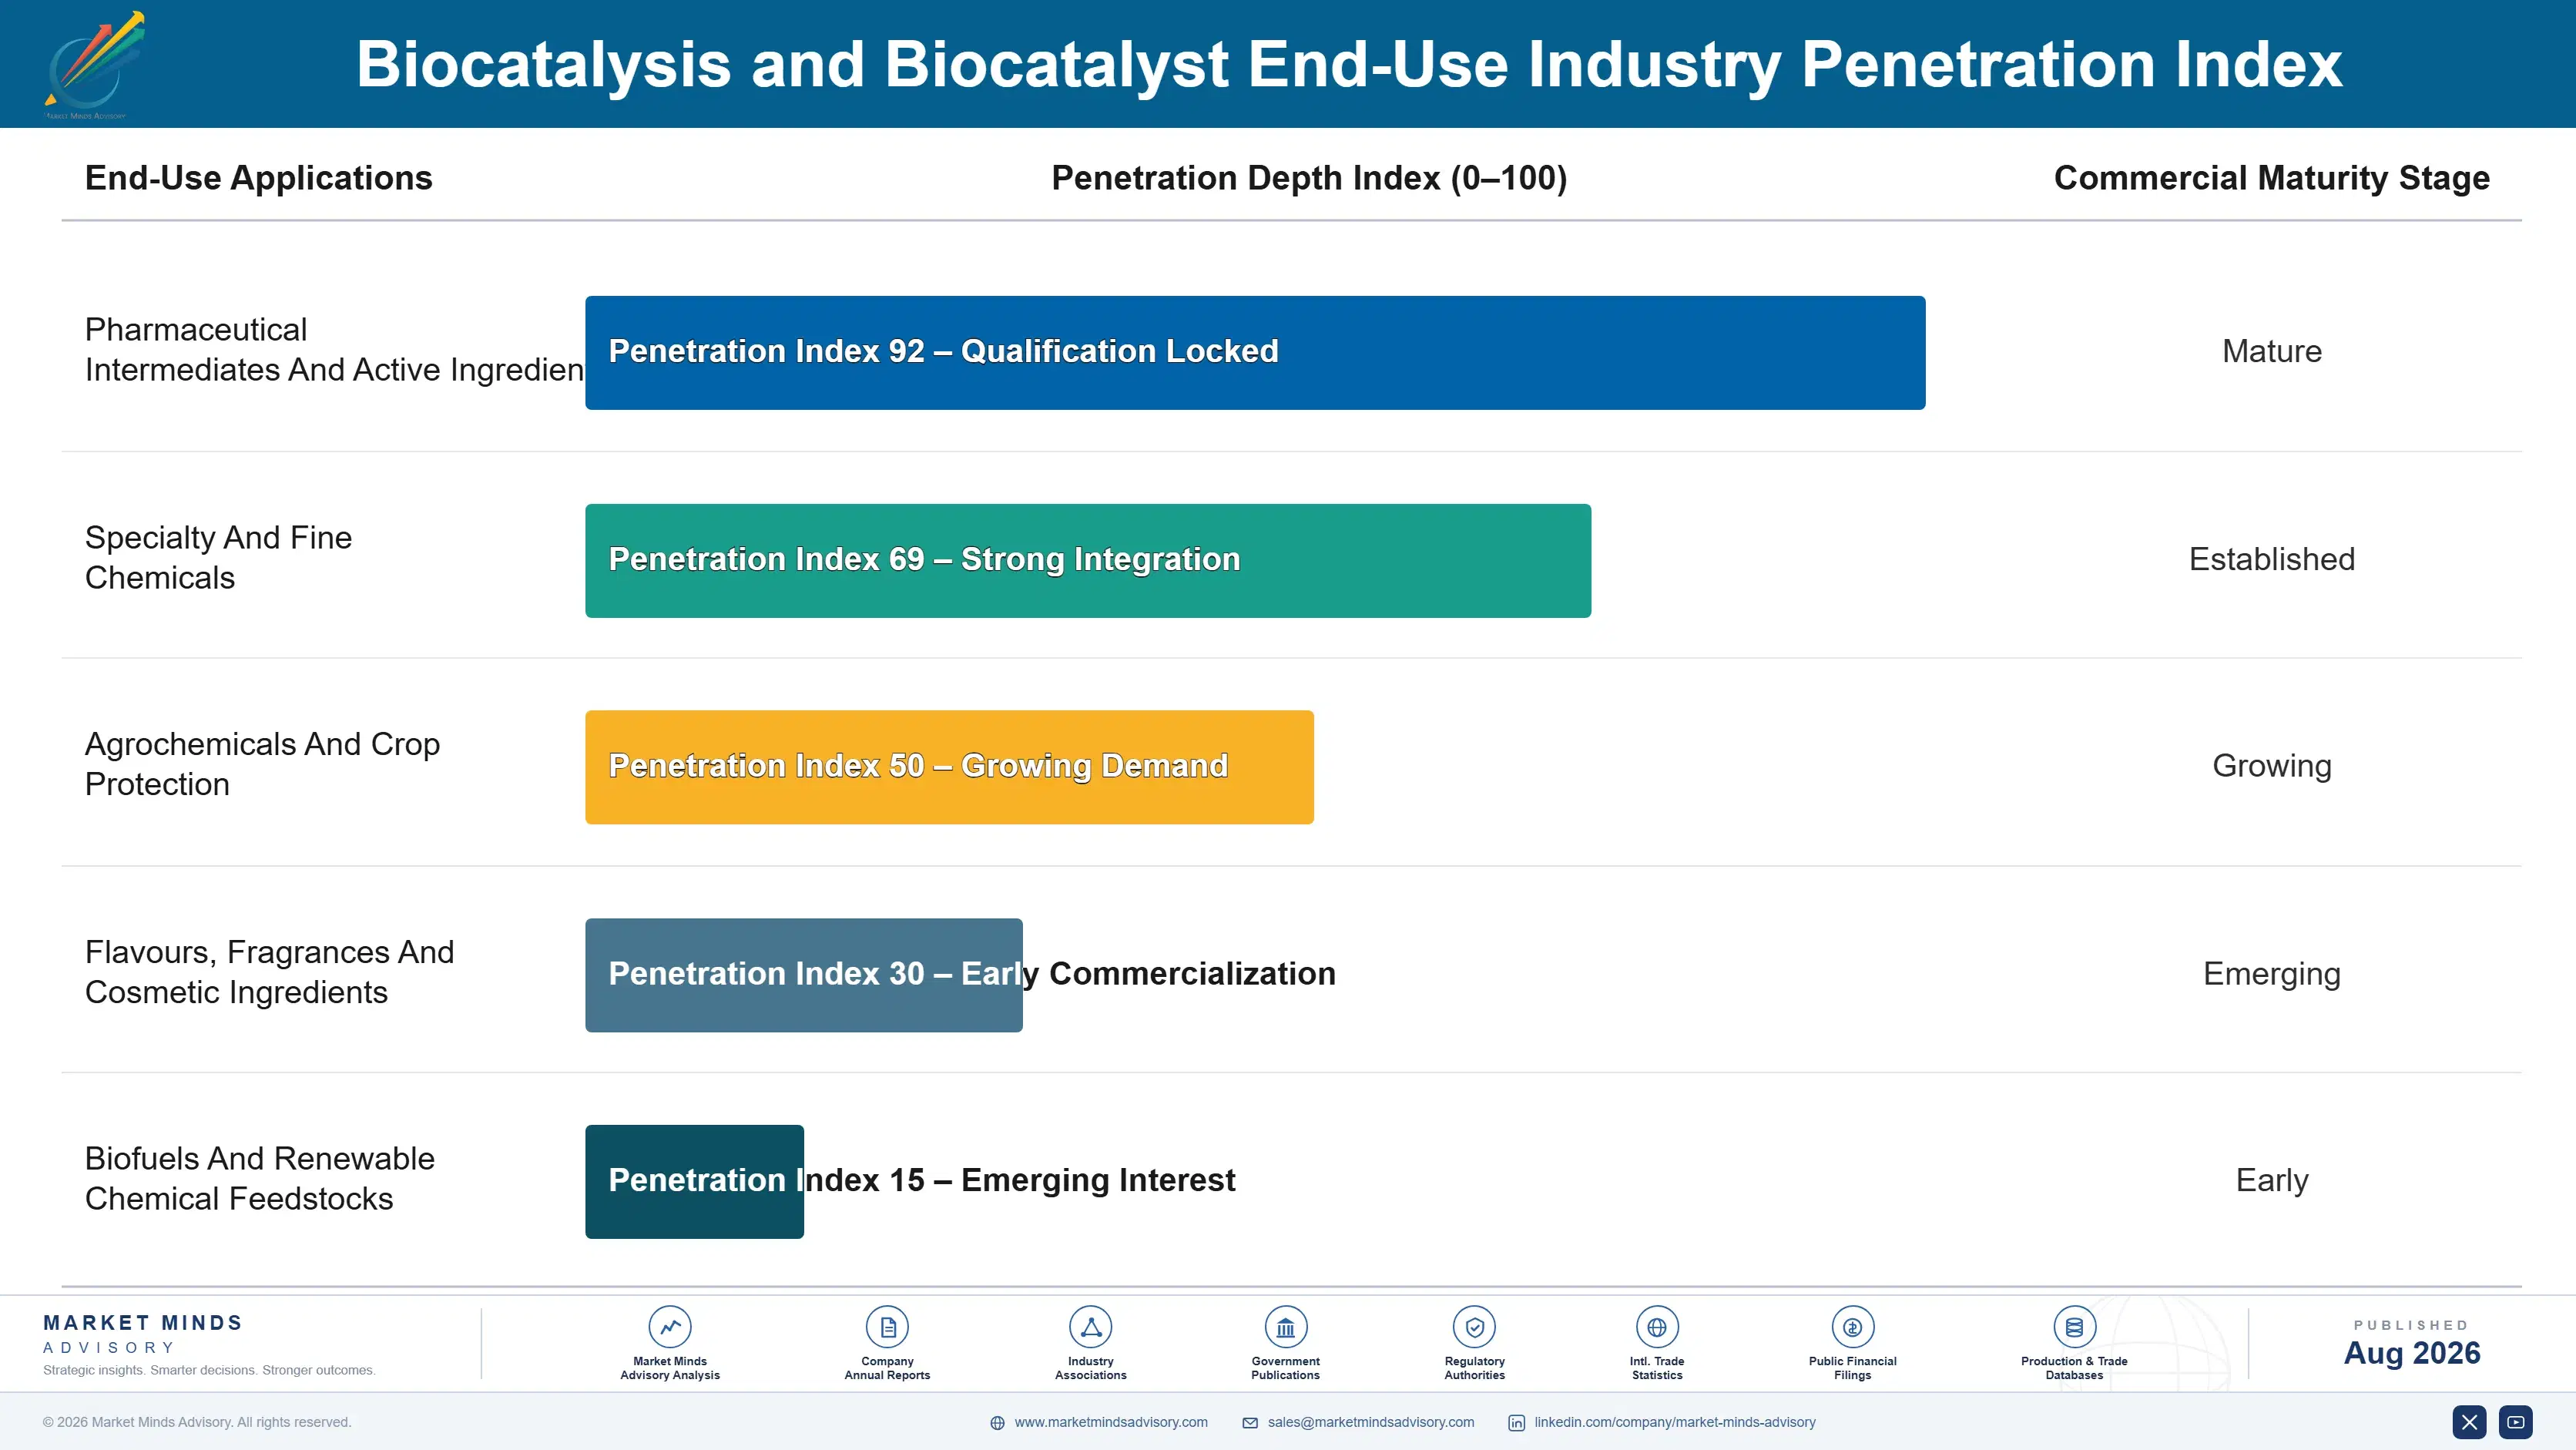
biocatalysis-and-biocatalyst-market-end-use-penetration-index-1787302651821

What We Would Tell a Board

These are among the four positions where our research anticipates prominent divergence between winners and laggards over the coming forecast period. Each is grounded in the demand model, the regulatory perimeter, and the announced capacity pipeline.
01 / PROCESS ENGINEERING INTEGRATION

Screening for catalysis alone wastes most of the budget

Around 71% of biocatalytic routes that reach pilot scale never reach production at all, and the failures are separation, enzyme recovery, and reactor engineering rather than any deficiency in catalytic performance. Screening campaigns that never involve a separations engineer optimise for the wrong properties entirely and produce candidates nobody can use industrially. Involving process engineering during candidate selection rather than after pilot work changes which enzymes get advanced, and it converts a far higher share of discovery spending into actual routes.
02 / IMMOBILISATION SELECTION SEQUENCING

Choose enzymes that immobilise, not ones you immobilise later

Attaching an enzyme to a solid support solves separation and reuse together and delivers around 34 cycles before activity falls below economic threshold, which transforms the cost comparison against a conventional route. Retrofitting immobilisation onto an enzyme selected free in solution frequently fails outright, because the attachment chemistry conflicts with the active site the screening campaign optimised. Selecting for immobilisation compatibility from the very beginning costs some screening throughput and avoids the single most common route failure in this whole sector.
03 / COMMERCIAL FRAMING DISCIPLINE

Enzyme price is not the number that decides it

Enzymes carry roughly 17% of the total biocatalytic step cost, which is considerably less than most process chemists assume when they compare a biocatalytic route against a conventional synthetic one. Fermentation-derived protein is genuinely cheap relative to the precious metal catalysts and the chiral auxiliaries that it displaces from the route entirely. Suppliers presenting total step economics, including waste treatment, solvent recovery, and yield, convert a far higher share of the conversations they start than those quoting an enzyme price per kilogram.
04 / PRODUCTION CAPACITY DECISION

Without fermentation you have chosen licensing already

Producing enzyme protein at tonne scale requires fermentation capacity, downstream protein recovery, and formulation capability that protein engineering companies very frequently do not hold at all. Concentration sits at 57% precisely because designing an enzyme and manufacturing one at scale are genuinely different businesses, requiring different capital and different operating discipline. Contract fermentation partnerships or owned production capacity are the only two available routes, and choosing neither of them means choosing licensing by default rather than by any actual decision.

Engagement Snapshot From the Field

A live engagement with an industry participant carrying material or product regulatory and market exposure ahead of a defining policy shift, showing how our research translates into a defensible multi-year portfolio strategy.
MARKET MINDS ADVISORY · CLIENT ENGAGEMENT SUMMARY
Biocatalysis and Biocatalyst Producer Strategic Portfolio Review and Transition Roadmap 2026·Investment Scenario on Biocatalysis and Biocatalyst Exposure Evaluation 2025-26
CLIENT PROFILE
An industrial biotechnology company with approximately 118 million dollars in annual revenue (client-reported, unverified by MMA), holding a directed evolution platform, modest fermentation capacity, and a portfolio of enzyme candidates across pharmaceutical and specialty chemical targets. Discovery output had grown for four consecutive years while the number of enzymes reaching commercial production had not moved at all.
STRATEGIC CHALLENGE
Management proposed expanding the discovery platform to increase candidate output, on the argument that a larger pipeline would eventually convert more programmes. The board wanted an independent view on why conversion was flat before funding an expansion of the activity that was already outpacing everything downstream of it. Conversion had never been analysed by cause.
MMA APPROACH
We traced every candidate advanced over four years through screening, pilot, and production, identifying precisely where each had stopped and why. Failure causes were classified by technical discipline. Process development headcount and capability were benchmarked against companies achieving higher conversion, and immobilisation was assessed as a design parameter rather than a later step.
KEY FINDINGS
  1. The substantial majority of stalled candidates had failed on downstream separation or enzyme recovery rather than on any catalytic performance shortfall. The pattern was entirely consistent.
  2. No separations or process engineer had participated in candidate selection at any point, and screening criteria contained nothing addressing recoverability. Recoverability went entirely unmeasured.
  3. Immobilisation had been attempted only after free enzyme selection, and attachment chemistry had conflicted with active sites in most of those attempts.
  4. Companies achieving higher conversion carried substantially more process development capability relative to discovery headcount than the client did. The ratio explained the gap. Headcount balance was the difference.
CLIENT PROFILE
An industrial biotechnology company with approximately 118 million dollars in annual revenue (client-reported, unverified by MMA), holding a directed evolution platform, modest fermentation capacity, and a portfolio of enzyme candidates across pharmaceutical and specialty chemical targets. Discovery output had grown for four consecutive years while the number of enzymes reaching commercial production had not moved at all.
STRATEGIC CHALLENGE
Management proposed expanding the discovery platform to increase candidate output, on the argument that a larger pipeline would eventually convert more programmes. The board wanted an independent view on why conversion was flat before funding an expansion of the activity that was already outpacing everything downstream of it. Conversion had never been analysed by cause.
MMA APPROACH
We traced every candidate advanced over four years through screening, pilot, and production, identifying precisely where each had stopped and why. Failure causes were classified by technical discipline. Process development headcount and capability were benchmarked against companies achieving higher conversion, and immobilisation was assessed as a design parameter rather than a later step.
KEY FINDINGS
  1. The substantial majority of stalled candidates had failed on downstream separation or enzyme recovery rather than on any catalytic performance shortfall. The pattern was entirely consistent.
  2. No separations or process engineer had participated in candidate selection at any point, and screening criteria contained nothing addressing recoverability. Recoverability went entirely unmeasured.
  3. Immobilisation had been attempted only after free enzyme selection, and attachment chemistry had conflicted with active sites in most of those attempts.
  4. Companies achieving higher conversion carried substantially more process development capability relative to discovery headcount than the client did. The ratio explained the gap. Headcount balance was the difference.
RECOMMENDED STRATEGY
Phase 1: Phase 1 (months one to nine): freeze discovery expansion, recruit separations and process engineering into candidate selection immediately. across every active programme. Phase 2: Phase 2 (months nine to twenty-four): add immobilisation compatibility to screening criteria and rescreen the stalled candidate portfolio. against the revised criteria. Phase 3: Phase 3 (months twenty-four to forty-two): rebalance headcount toward process development and secure contract fermentation for scale-up. ahead of committed demand.
OUTCOME
The discovery expansion was frozen. Process engineering joined candidate selection within two quarters, immobilisation screening was added to the criteria, and two previously stalled candidates advanced to pilot under the revised approach (client-reported, unverified by MMA). Discovery headcount was redeployed rather than cut. Conversion improved measurably afterward.

Frequently Asked Questions

Foundational context covering the market sizes, CAGR, scope, country, region and competition that inform every finding below. This section is provided to cover basics and most often pre-purchase conversations, answered from the MMA Primary Research Dataset.

What is the current size of the Biocatalysis and Biocatalyst Market?

The market is valued at USD 3.1 billion in 2025, rising to USD 3.42 billion in 2026. Scope covers enzymes used as catalysts in chemical and pharmaceutical manufacture, not food, detergent, feed, or diagnostic enzymes.

How large will the Biocatalysis and Biocatalyst Market be by 2036?

MMA forecasts USD 9.20 billion by 2036, an increase of USD 5.78 billion over the 2026 base. That represents an expansion multiple of 2.69 times across the forecast period.

What is the CAGR for the Biocatalysis and Biocatalyst Market 2026 to 2036?

The base case CAGR is 10.4%, with a bull case of 11.6% and a bear case of 9.2%. The historical rate from 2020 to 2025 was 8.9%, carried by pharmaceutical intermediate manufacture.

Which segment is growing fastest?

Immobilised and continuous flow biocatalysts at 15.6%, exactly 1.50 times the market rate. Fixing an enzyme to a support solves separation and reuse together across roughly 34 cycles.

Who are the major companies in the Biocatalysis and Biocatalyst Market?

Novonesis, BASF, Codexis, Amano Enzyme, and Roche Custom Biotech lead on enzyme protein supplied by weight. The top five hold 57%, held by fermentation capacity and strain library depth.

Which country is growing fastest?

India at 13.2%, where pharmaceutical intermediate and active ingredient manufacture is expanding while adopting biocatalytic routes. Export customers increasingly specify process characteristics rather than product alone.

Report Segmentation Architecture

The full report scope spans multiple orthogonal segmentation dimensions, with cross-tabulated demand data provided for each dimension pair. Coverage extends further to regional breakdowns, trend trajectories, and the competitive detail needed to support segment-level decision-making.

By Biocatalyst Format And Delivery

  • Free Enzymes In Solution Or Powder
  • Immobilised And Continuous Flow Biocatalysts
  • Whole Cell Biocatalysis Systems
  • Engineered Enzyme Development And Licensing
  • Immobilisation Supports And Carriers

By End-Use Industry

  • Pharmaceutical Intermediates And Active Ingredients
  • Specialty And Fine Chemicals
  • Agrochemicals And Crop Protection
  • Flavours, Fragrances And Cosmetic Ingredients
  • Biofuels And Renewable Chemical Feedstocks

By Commercial Model

  • Direct Enzyme Supply To Manufacturers
  • Route Development And Process Licensing
  • Custom Enzyme Engineering Contracts
  • Contract Manufacturing With Biocatalytic Steps
  • Carrier And Immobilisation Material Supply

By Region

  • East Asia
  • Western Europe
  • North America
  • South Asia and Pacific
  • Latin America
  • Middle East and Africa
  • Eastern Europe

Scope, Methodology, and Coverage

Every figure in this report is reproducible from documented input assumptions. The scope below maps the historical period, the forecast horizon, the segmentation dimensions, and the countries covered, alongside the underlying primary and qualitative methodology.
Historical Period
2020 to 2025
Forecast Period
2026 to 2036
Base Year
2025 (USD billions; MMA Primary Research Dataset, August 2026)
Market Definition
This market comprises enzymes and enzyme systems supplied and used as catalysts in chemical, pharmaceutical, and specialty manufacturing processes, measured at supplier revenue across product supply, development contracts, and process licensing. Coverage spans free enzymes supplied in solution or powder form, immobilised and continuous flow biocatalysts, whole cell biocatalysis systems, engineered enzyme development and licensing services, and immobilisation supports and carriers supplied for biocatalytic use. Enzymes supplied for food processing, brewing, detergents, animal feed, textile and leather treatment, diagnostic and research reagent enzymes, fermentation products where the enzyme is not itself the catalyst, and conventional homogeneous and heterogeneous chemical catalysts fall outside scope.
Quantitative Units
USD billions (current prices); enzyme protein supplied by weight; biocatalytic routes in commercial production; reuse cycles by immobilisation format
Segmentation Dimensions
By Biocatalyst Format And Delivery; By End-Use Industry; By Commercial Model; By Region
Regions Covered
East Asia, Western Europe, North America, South Asia and Pacific, Latin America, Middle East and Africa, Eastern Europe
Countries Covered
China, Japan, South Korea, India, Denmark, Netherlands, Germany, Switzerland, United Kingdom, France, United States, Canada, Brazil, Mexico, Australia, Singapore, Israel, Saudi Arabia, South Africa, Poland, Czechia, Hungary, and additional markets relevant to this sector
Key Companies Profiled
Novonesis, BASF, Codexis, Amano Enzyme, Roche Custom Biotech, DSM-Firmenich, Enzymaster, Johnson Matthey, Almac Group, Evonik Industries, Sekisui Diagnostics, Nagase ChemteX, Chr Hansen, Advanced Enzyme Technologies, Creative Enzymes, Prozomix, EnzymeWorks, Lonza, Asymchem, WuXi AppTec
Quantitative Methodology
Primary survey, n=3,800 respondents, Q4 2025, six countries; demand-side model with trade association cross-validation
Qualitative Methodology
47 expert interviews, Q4 2025; applied to validate demand model assumptions, identify emerging dynamics, and assess competitive positioning
Report Format
PDF and XLSX data workbook (Word format preview document)
Publisher
Market Minds Advisory
Report Code
MMA-2026-CHM-721
Published
August 2026
Contact
sales@marketmindsadvisory.com | www.marketmindsadvisory.com

Purchase the full Biocatalysis and Biocatalyst Market Report (2026 to 2036).

The full report sizes biocatalysis across five biocatalyst formats, five end-use industries, five commercial models, and seven regions, with route conversion tracked from screening through pilot to commercial production throughout. Failure causes are classified by technical discipline, since separation and recovery rather than catalytic performance stop most piloted routes. Immobilisation carrier performance is compared on reuse cycles delivered rather than unit price. Competitive profiling covers twenty companies on enzyme protein supplied by weight, process development capability is assessed against route conversion rates, and total step economics are modelled against conventional synthetic alternatives.
Route conversion tracked from screening through pilot to production
Failure causes classified by technical discipline rather than programme
Immobilisation carriers compared on reuse cycles rather than price
Process development capability assessed against route conversion rates
Total step economics modelled against conventional synthetic route alternatives
Fermentation capacity utilisation analysed against unit production cost

Built For The People Who Decide

From boardroom strategy to bench-side execution, this report is read cover-to-cover by leaders shaping the next decade of their industry, turning demand scenarios, market dynamics and valuation benchmarks into decisions.
CXOs/ Presidents/ VPs/ Managers
M&A and Corporate Development
Strategy Teams and R&D Heads
Procurement and Product Directors
Regulatory and Compliance Leaders
Investor Relations and Equity Analysts