Market Minds Advisory
Bioactive Peptide Market

Bioactive Peptide Market: The Claim Substantiation Premium: Why A Dossier, Not A Formula, Sets Peptide Pricing

Bioactive peptides move from dairy byproduct science to a formulated ingredient category, as sports nutrition, clinical nutrition, and skin-health formulators pay premium prices for peptides with documented, dose-specific physiological claims validated in clinical trials.

Lead Analyst

Lisa Gevelber

Published

September 2026

Make Smarter Decisions with Customized Research Insights

Request a free sample report and evaluate market opportunities, growth trends, and competitive dynamics relevant to your business needs.

2025 MARKET VALUE$9.4BMarket Size 2025
2036 FORECAST VALUE$25.8BBase Case , 2026 to 2036
CAGR 2026 TO 20369.6 %Bull 10.8% / Bear 8.4%
INCREMENTAL OPPORTUNITY$15.5BNet 10- year value creation
EXPANSION MULTIPLE2.50x2036 value over 2026 base
Strategic Levers
M&A Pipeline
Regional Outlook
Country Rankings
Competitive Intelligence
Segmental Deep-dive
Call-Us : 91 93563 13602

Executive Snapshot and Market Trajectory

Bioactive peptides have stopped being a dairy processing byproduct and become a formulated ingredient category in their own right, as brands pay for peptides carrying a specific, clinically dosed physiological claim rather than generic protein content, and clinical validation now separates premium suppliers from commodity hydrolysate sellers entirely.
The market stands at USD 9.4 billion in 2025 and reaches USD 25.77 billion by 2036 at a 9.6% CAGR. Marine-derived peptides grow fastest at 13.5%, about 1.41 times the overall rate, as fish and algae protein hydrolysates move from discard streams into cardiovascular and joint-health formulations. East Asia holds 33% of value on Chinese hydrolysate manufacturing scale and Japan's mature functional-food peptide category, while sports nutrition brands drive premium pricing across North America.
Concentration sits at a moderate 34%, reflecting a field split between ingredient majors holding regulatory dossiers and specialist houses built on one clinical claim. Novel food and health-claim approval remains the binding constraint almost everywhere, since a peptide lacking a substantiated physiological effect competes as commodity protein regardless of its amino acid sequence. Personalized nutrition platforms increasingly specify peptides by bioactive fraction rather than source.
Market Definition
The bioactive peptide market covers protein-derived peptide fractions isolated or enzymatically produced for a documented physiological effect, sold as functional ingredients into food, beverage, dietary supplement, clinical nutrition, and topical cosmeceutical formulations. It excludes bulk protein isolates and hydrolysates sold without a substantiated bioactive claim, whole-protein ingredients, amino acid commodity trade, and pharmaceutical peptide drugs requiring regulatory approval as a therapeutic agent.
Base Year Value
$9.4B in 2025 (MMA Primary Research Dataset, August 2026)
Forecast Period
2026 to 2036, eleven discrete annual values
CAGR
9.6% base case. Bull 10.8%. Bear 8.4%.
Fastest Growth Segment
Marine-Derived Peptides: 13.5% CAGR
Fastest Growth Country
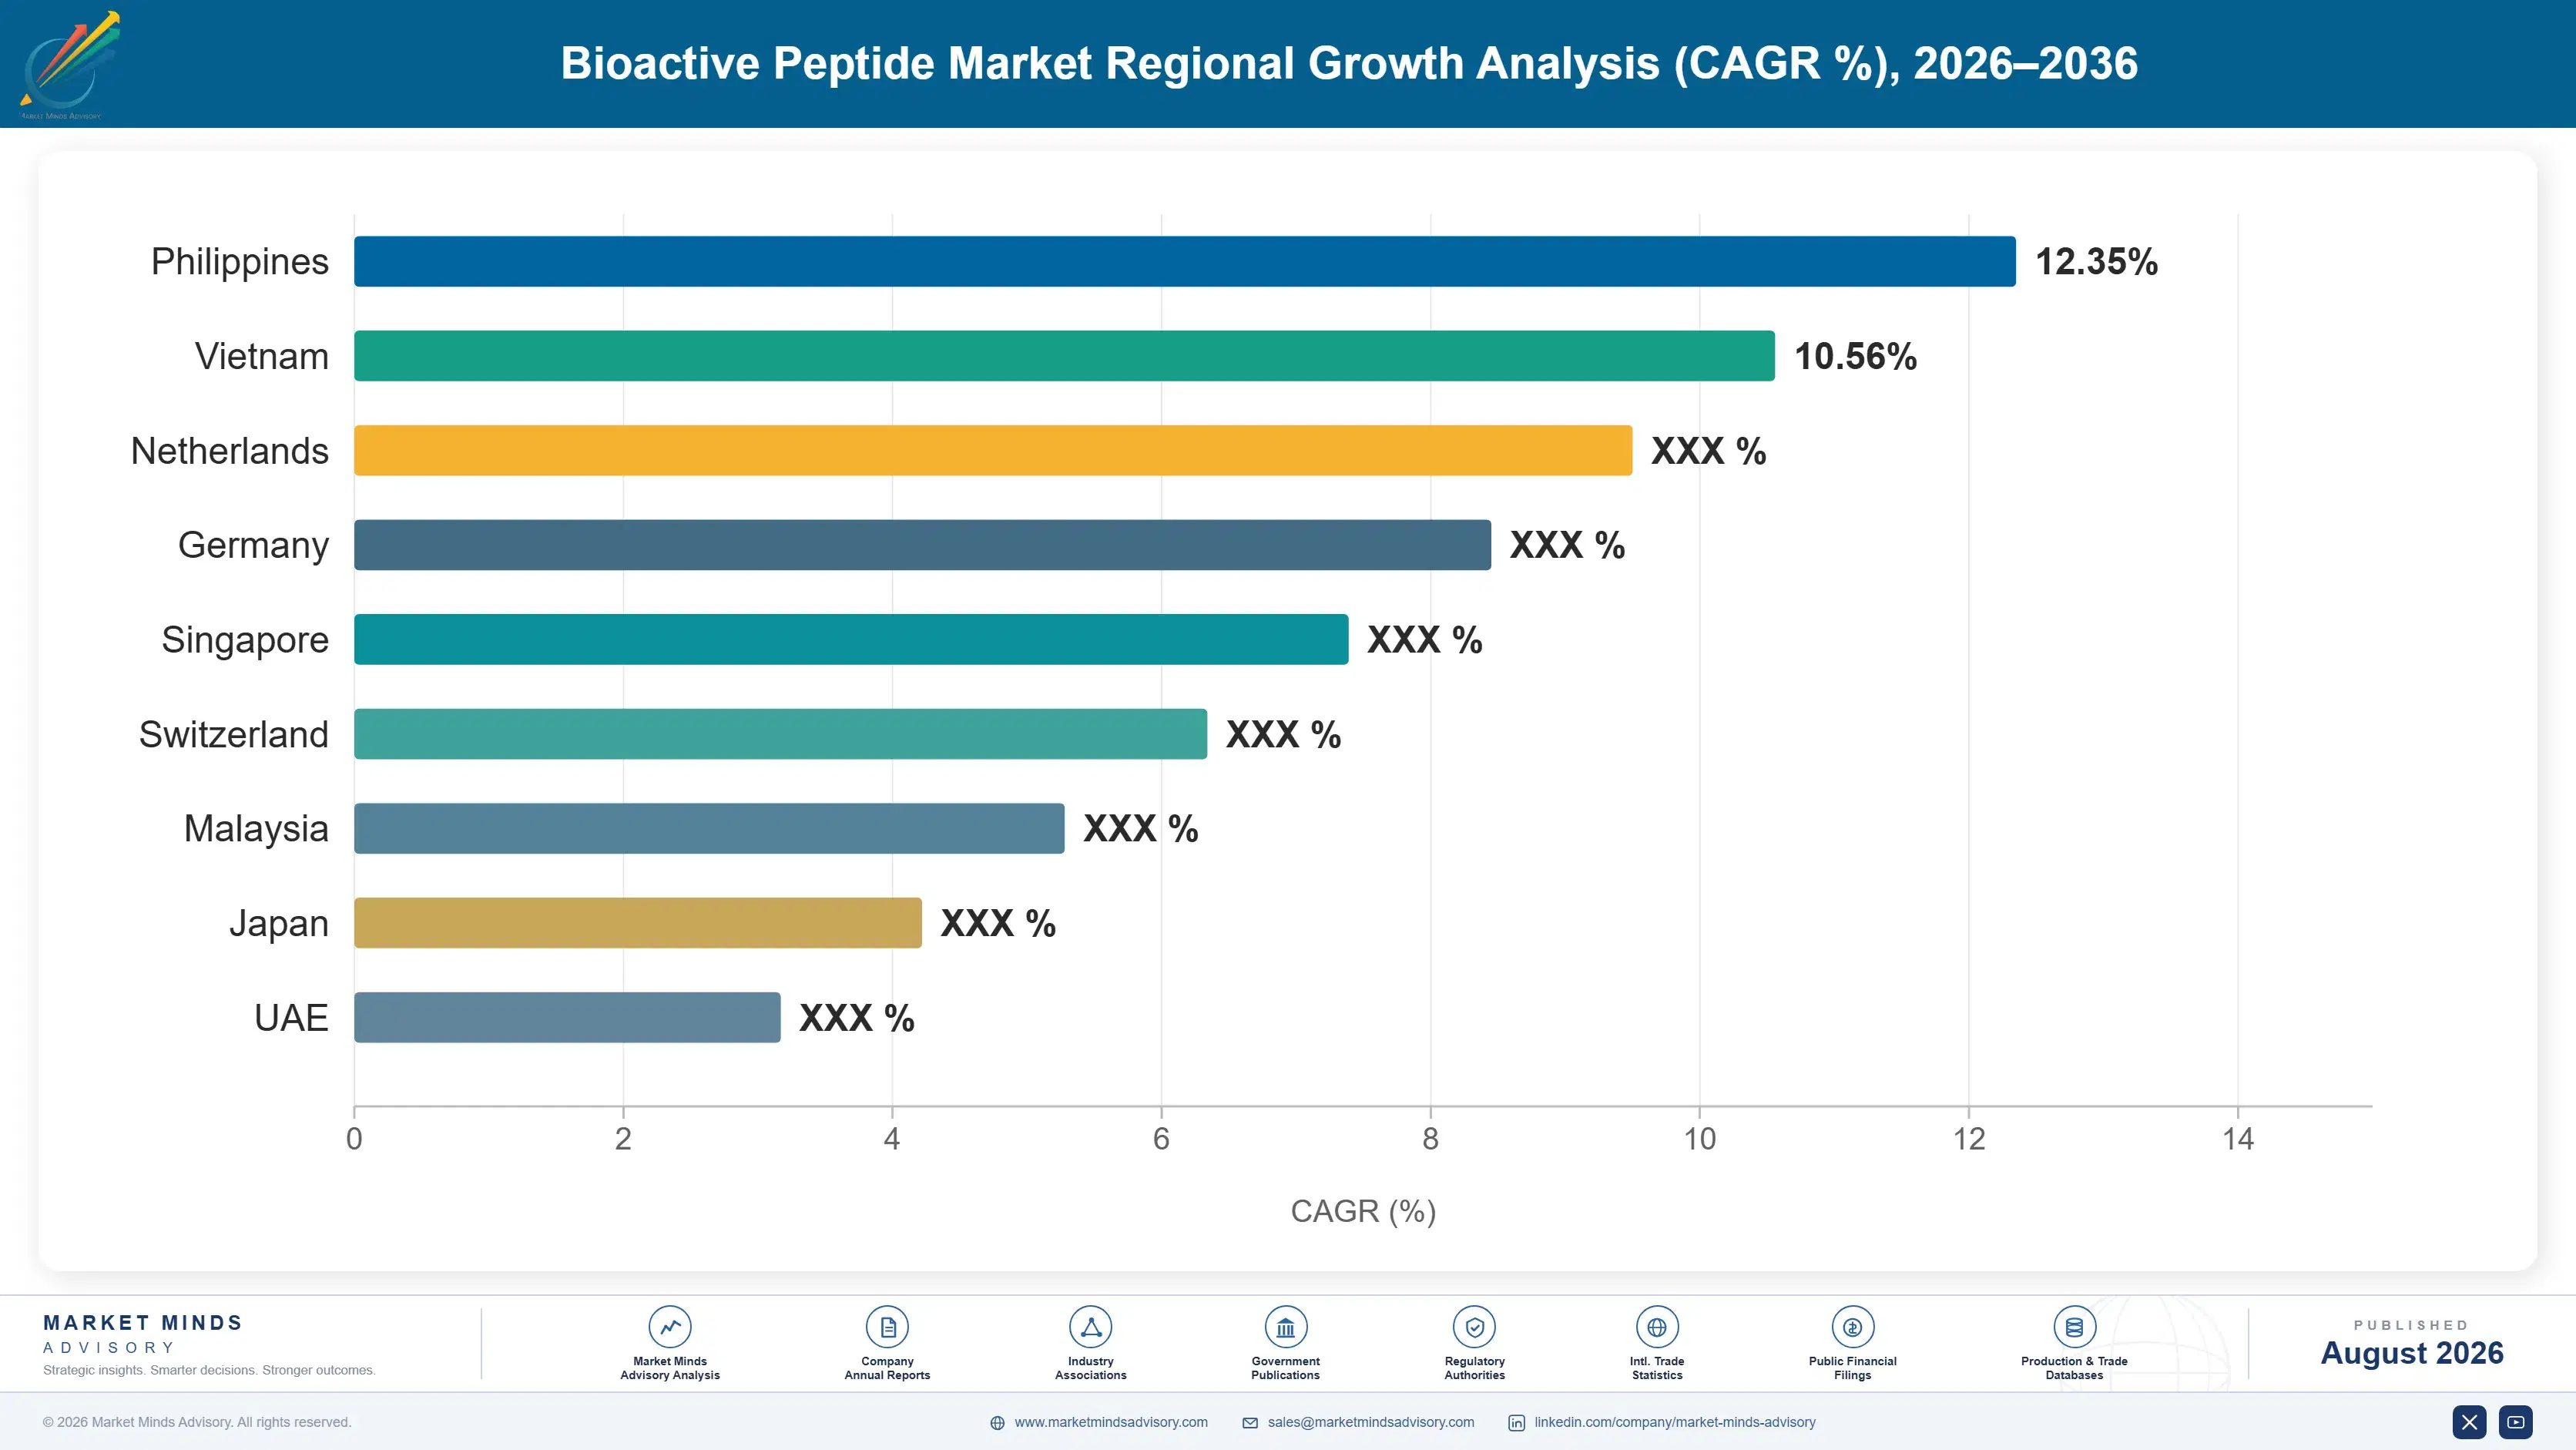
Vietnam: 15.8% CAGR
Fastest Growth Region
South Asia and Pacific: 11.7% CAGR
Largest Region
East Asia: 33% of 2025 global value
Market Leaders
Arla Foods Ingredients, FrieslandCampina DMV, Glanbia Nutritionals, DSM-Firmenich, Novonesis. Source: MMA Analysis based on company annual reports.
Primary Survey
n=3,800 procurement and R&D decision-makers, Q4 2025, six countries
Methodology
Demand-side build-up, cross-validated against public data, 47 expert interviews

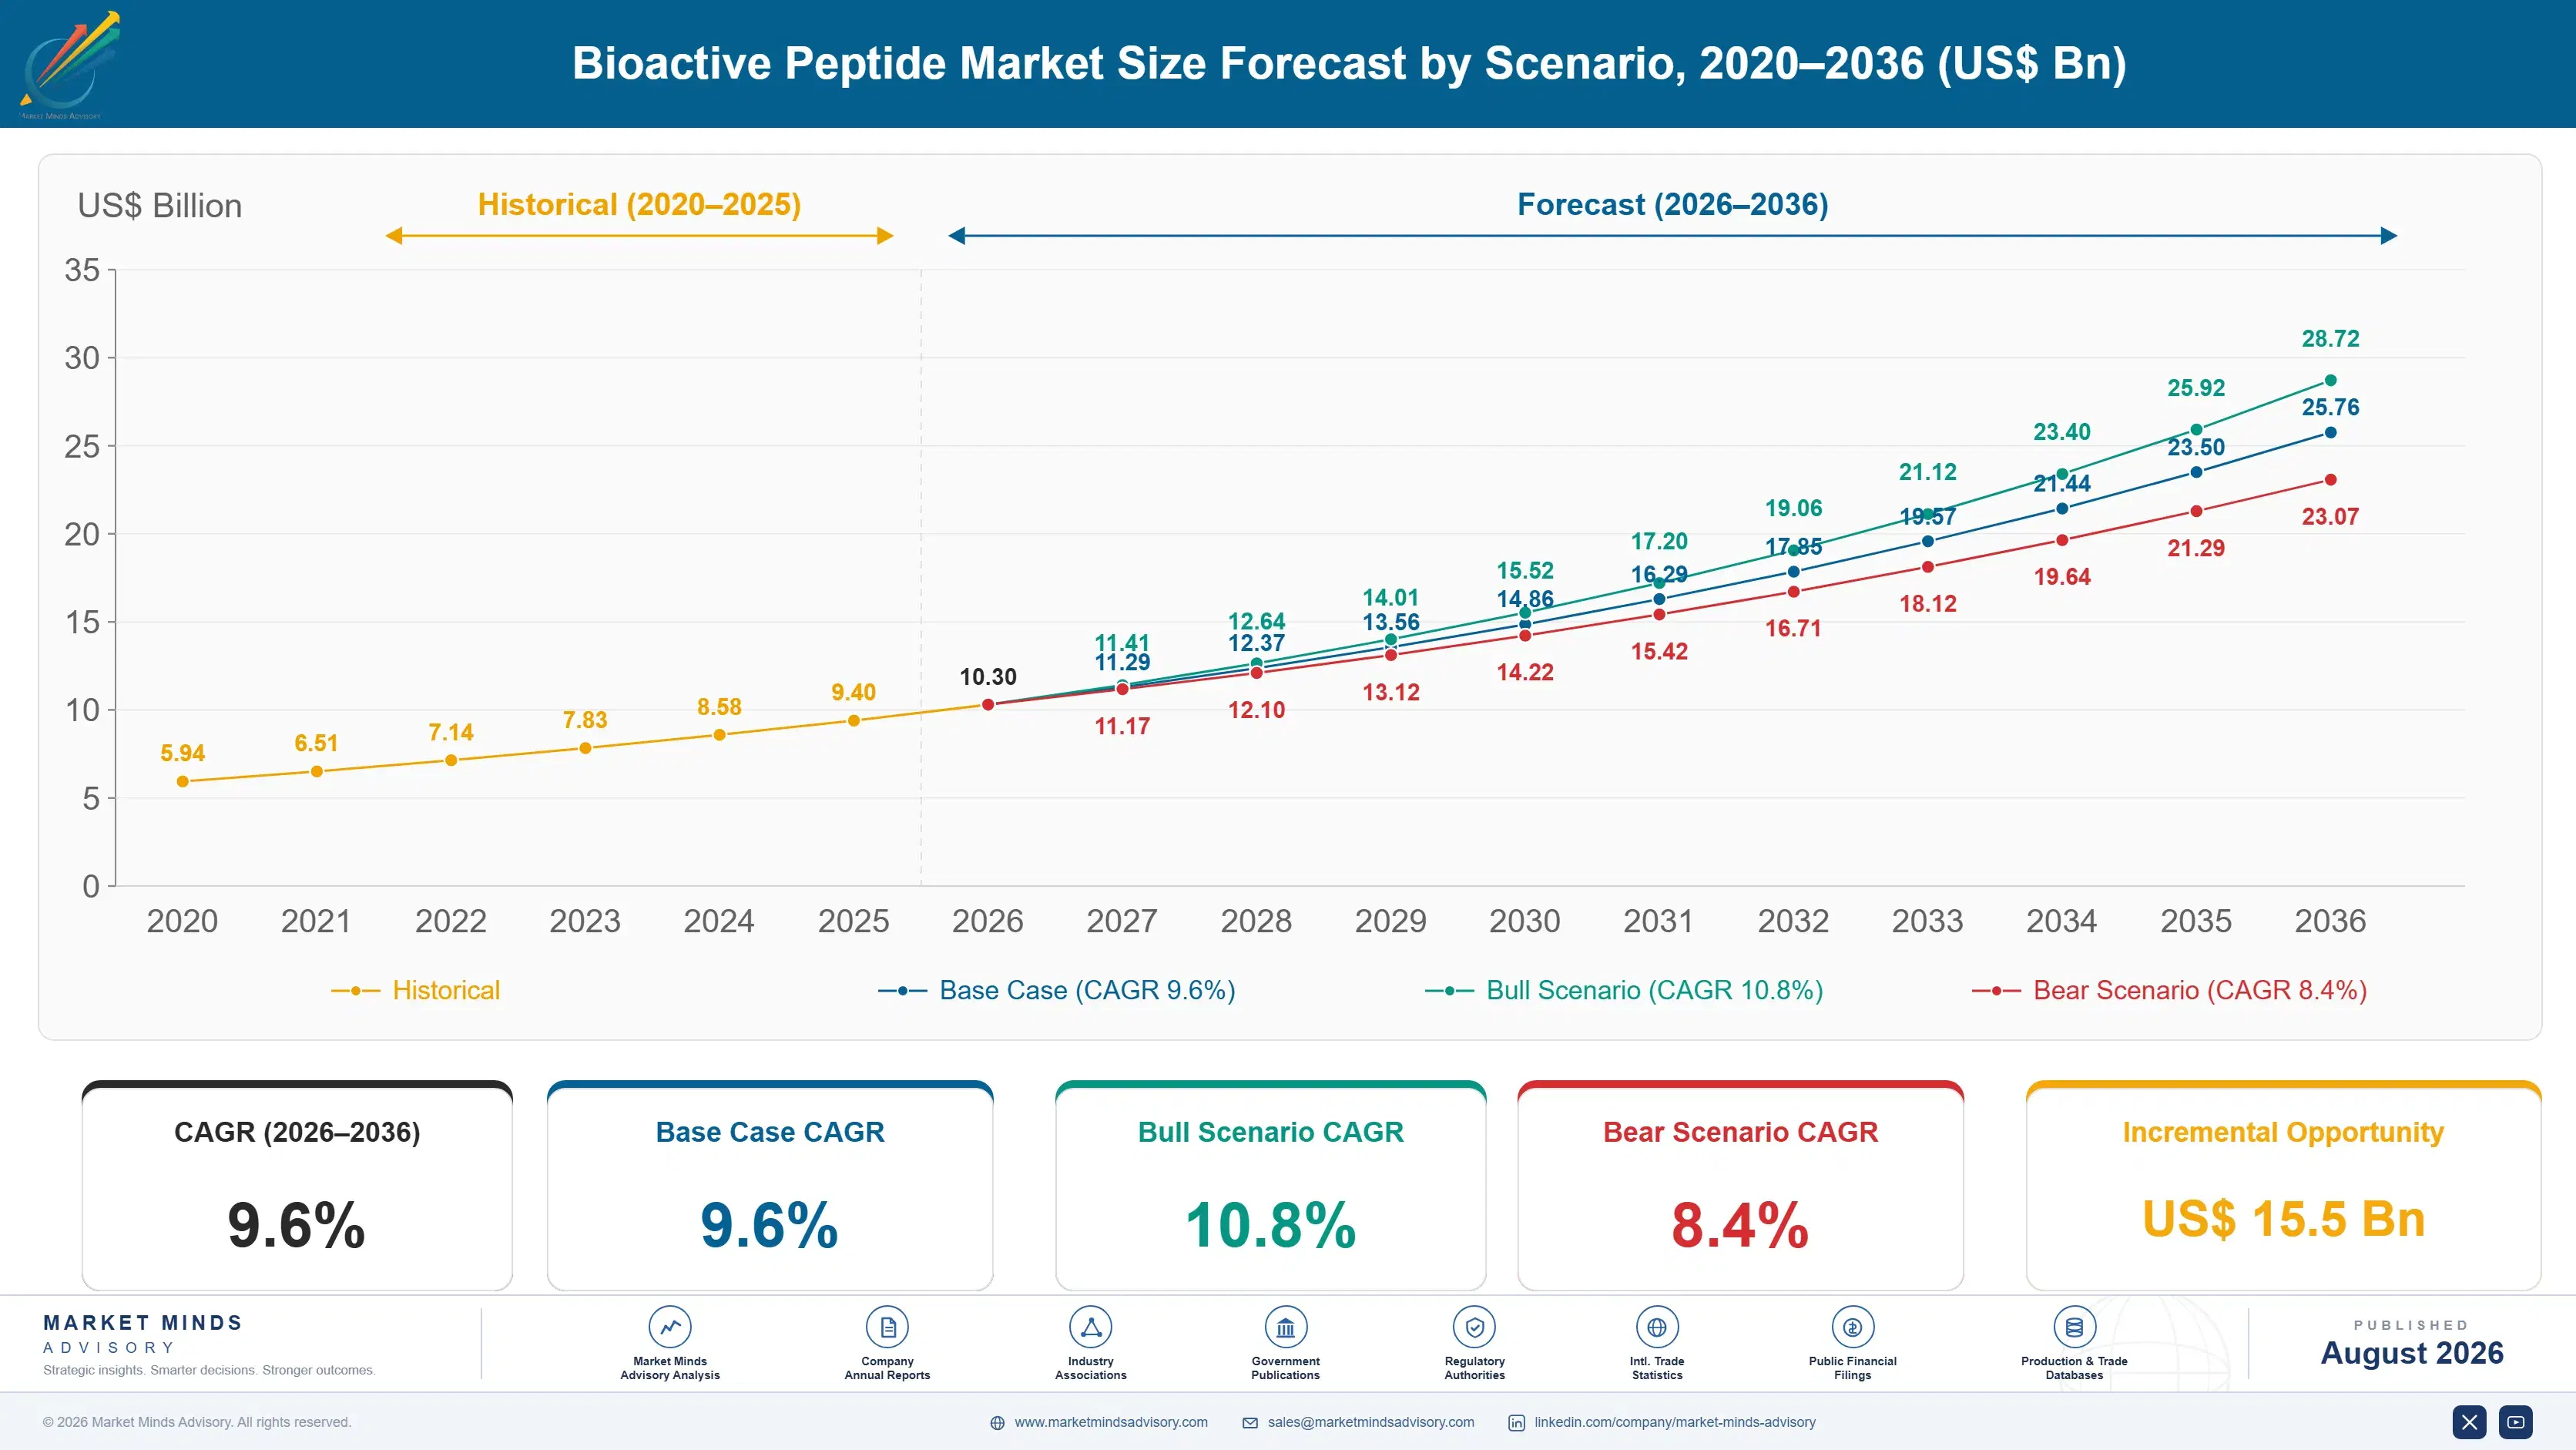
Bioactive Peptide Market Forecast Scenarios

bioactive-peptide-market-trends-growth-size-forecast-scenario-1787463232316
Bioactive peptides compounded near 8.6% from 2020 to 2025, a period dominated by whey- and casein-derived peptides sold into sports nutrition on modest clinical backing. COVID-era immune-health interest pulled marine and plant peptide research into commercial view earlier than expected. Clinical trial investment accelerated after 2022 as brands sought defensible claims ahead of tightening novel food scrutiny in Europe.
Three mechanisms carry the base case to 9.6%. First, sports nutrition brands are reformulating flagship products around clinically dosed peptides rather than generic protein blends, lifting price per kilogram above commodity hydrolysate. Second, clinical nutrition manufacturers are substituting bioactive fractions into enteral and geriatric formulas targeting muscle preservation, needing no new distribution channel. Third, nutricosmetic brands across South Korea and Japan specify marine and collagen peptides by exact bioactive fraction, pulling premium volume into the category.
The bull case at 10.8% assumes the European Food Safety Authority approves a wave of pending peptide health claims stuck in dossier review, releasing marketing language brands currently cannot use. The bear case at 8.4% assumes claim rejections continue at the current pace, holding peptide sales to protein-content pricing and starving the clinical-trial suppliers that depend on premium positioning to fund further dossiers.

Where Claim Substantiation Sets The Price

Three forces converge on bioactive peptides today. Ageing populations in developed markets want muscle-preserving nutrition beyond generic protein powder, active-lifestyle consumers want documented performance claims rather than marketing copy, and food regulators increasingly demand clinical substantiation before any physiological claim reaches a label. Manufacturers able to fund the trials that satisfy the third condition capture pricing the first two conditions are already prepared to pay.
MARKET CONCENTRATIONCR5: 34%Top suppliers hold regulatory dossiers competitors cannot replicate quickly
AVERAGE SELLING PRICE PREMIUM3 to 8x whey proteinClinically dosed peptides command far higher formulation prices
TOP PRODUCING COUNTRY SHAREChina: ~38% of hydrolysate volumeDomestic enzymatic hydrolysis capacity concentrates far from consumption
CAPACITY UTILISATION68% to 78%Enzymatic hydrolysis lines run near continuous batch capacity
FEEDSTOCK SHARE OF COGS45% to 60%Raw dairy, marine, and plant protein dominate input cost
CLINICAL TRIAL INVESTMENT SHARE12% to 18% of R&D spendSubstantiation spending separates premium suppliers from commodity sellers
The commercial character is closer to specialty pharma ingredients than to bulk food additives. A peptide fraction with a registered health claim in the European Union can sell at several multiples of an equivalent hydrolysate without one, and that gap is widening rather than closing as retailers push clean, substantiated labels. Suppliers without dossier capability increasingly sell into private-label commodity channels at protein-content pricing alone.
The next decade turns on personalization. Peptide suppliers with genomic and microbiome data are starting to specify formulations by individual physiological response rather than by generic category, a capability large ingredient houses are acquiring rather than building. Marine and fermentation-derived sourcing will keep gaining share on sustainability grounds, while dairy peptide growth slows toward the pace of the underlying protein market.
"Half this category is still selling protein content by another name. The half that isn't has a clinical dossier behind every gram, and that's the only half worth valuing at more than a whey premium."
Director, Functional Ingredients and Nutraceutical Practice · MMA Agriculture / Functional Food and Nutraceutical Ingredients Practice · August 2026

Market Trends

Health Claim Substantiation Becomes The Category's Real Gatekeeper

European Food Safety Authority review of novel peptide health claims has become the binding constraint on category growth, with dossier preparation now running 18 to 30 months and costing well into seven figures per claim. Suppliers who cleared review for milk-derived antihypertensive peptides in the early 2020s built a defensible marketing position competitors could not copy without repeating the same clinical trials. The FDA's qualified health claim pathway runs on a similarly demanding evidentiary standard. Ingredient houses are now pooling clinical trial costs across consortium structures to spread the expense across multiple applicants filing related dossiers together.
Market Impact: Commands 3x to 8x standard pricing
Seafood Byproduct Valorization Creates New Marine Peptide Supply

Fish and algae processing waste, once discarded or sold as low-value fishmeal, is increasingly diverted into enzymatic hydrolysis lines producing bioactive marine peptides for cardiovascular and joint-health formulations. Norwegian salmon processors and Vietnamese pangasius plants have both added dedicated peptide extraction capacity since 2022, monetizing skin, bone, and viscera streams that previously carried disposal cost rather than revenue. The shift pairs a sustainability narrative food brands want with a genuine cost advantage, since feedstock arrives essentially free relative to purpose-grown protein crops. Supply remains seasonal and geographically scattered, which keeps quality consistency the harder problem to solve.
Market Impact: Clinical nutrition segment grows 11% annually

Market Opportunities and Growth Drivers

Sports Nutrition Brands Reformulate Around Clinically Dosed Peptides

Global sports nutrition sales keep expanding beyond a gym-going niche into general wellness retail, and flagship brands are rebuilding formulas around peptides carrying a specific, published clinical dose rather than generic whey isolate. Glanbia's and Arla's peptide-fortified recovery lines now command retail prices several multiples above standard protein powder, a gap consumers appear willing to pay once a package cites a named clinical trial. Retailers including major American and European chains have begun dedicating shelf space specifically to claims-substantiated peptide products, separating them from bulk protein rather than shelving them together as before.
Market Impact: Trials cost over $2 million

Geriatric And Clinical Nutrition Substitute Peptides For Whole Protein

Enteral and oral nutritional supplement manufacturers serving hospitals, care homes, and post-surgical recovery are substituting bioactive peptide fractions for whole protein isolate specifically to improve digestibility and absorption speed in patients with compromised gut function. Abbott and Nestle Health Science have both expanded peptide-based formula lines targeting sarcopenia and post-operative recovery, segments growing directly alongside ageing populations across North America, Western Europe, and Japan. The substitution needs no new distribution channel since it swaps an ingredient inside an existing product line rather than creating a new category, which is precisely what makes it move faster than novel-format launches.
Market Impact: Runs 3 parallel dossier programmes

Market Restraints and Challenges

Clinical Substantiation Costs Price Out Smaller Suppliers

Generating the randomized controlled trial data a health claim dossier requires costs several million dollars per claim and takes years to complete, a burden that falls hardest on regional and single-ingredient specialist suppliers rather than diversified ingredient majors. The root cause is that peptide bioactivity is dose- and sequence-specific, so a supplier cannot simply cite research on a chemically similar peptide from a competitor. The commercial impact is consolidation: smaller houses either license validated peptide sequences from larger holders or exit into unsubstantiated commodity hydrolysate. Some are pooling trial costs through consortium partnerships to spread the expense across several applicants.
Market Impact: Dossiers cost over $1 million

Health Claim Rules Differ Sharply By Jurisdiction

A peptide claim approved by the FDA carries no standing under European Food Safety Authority review, and Japan's Foods for Specified Health Uses system runs its own separate dossier process, so suppliers fund three parallel substantiation programmes for one ingredient. No mutual recognition framework exists between these regimes, unlike pharmaceutical approval pathways that share some clinical data standards. The impact falls hardest on smaller exporters who can only afford to file in one market, ceding the rest to larger rivals. Some design trials broad enough to satisfy multiple regulators at once, accepting higher upfront cost to avoid repeating the programme.
Market Impact: Marine peptide capacity added since 2022
3 additional market trends, 4 additional growth drivers, and 2 additional restraints and challenges are covered in the full report. Contact sales@marketmindsadvisory.com to access the complete intelligence.

Segment CAGR and Growth Architecture

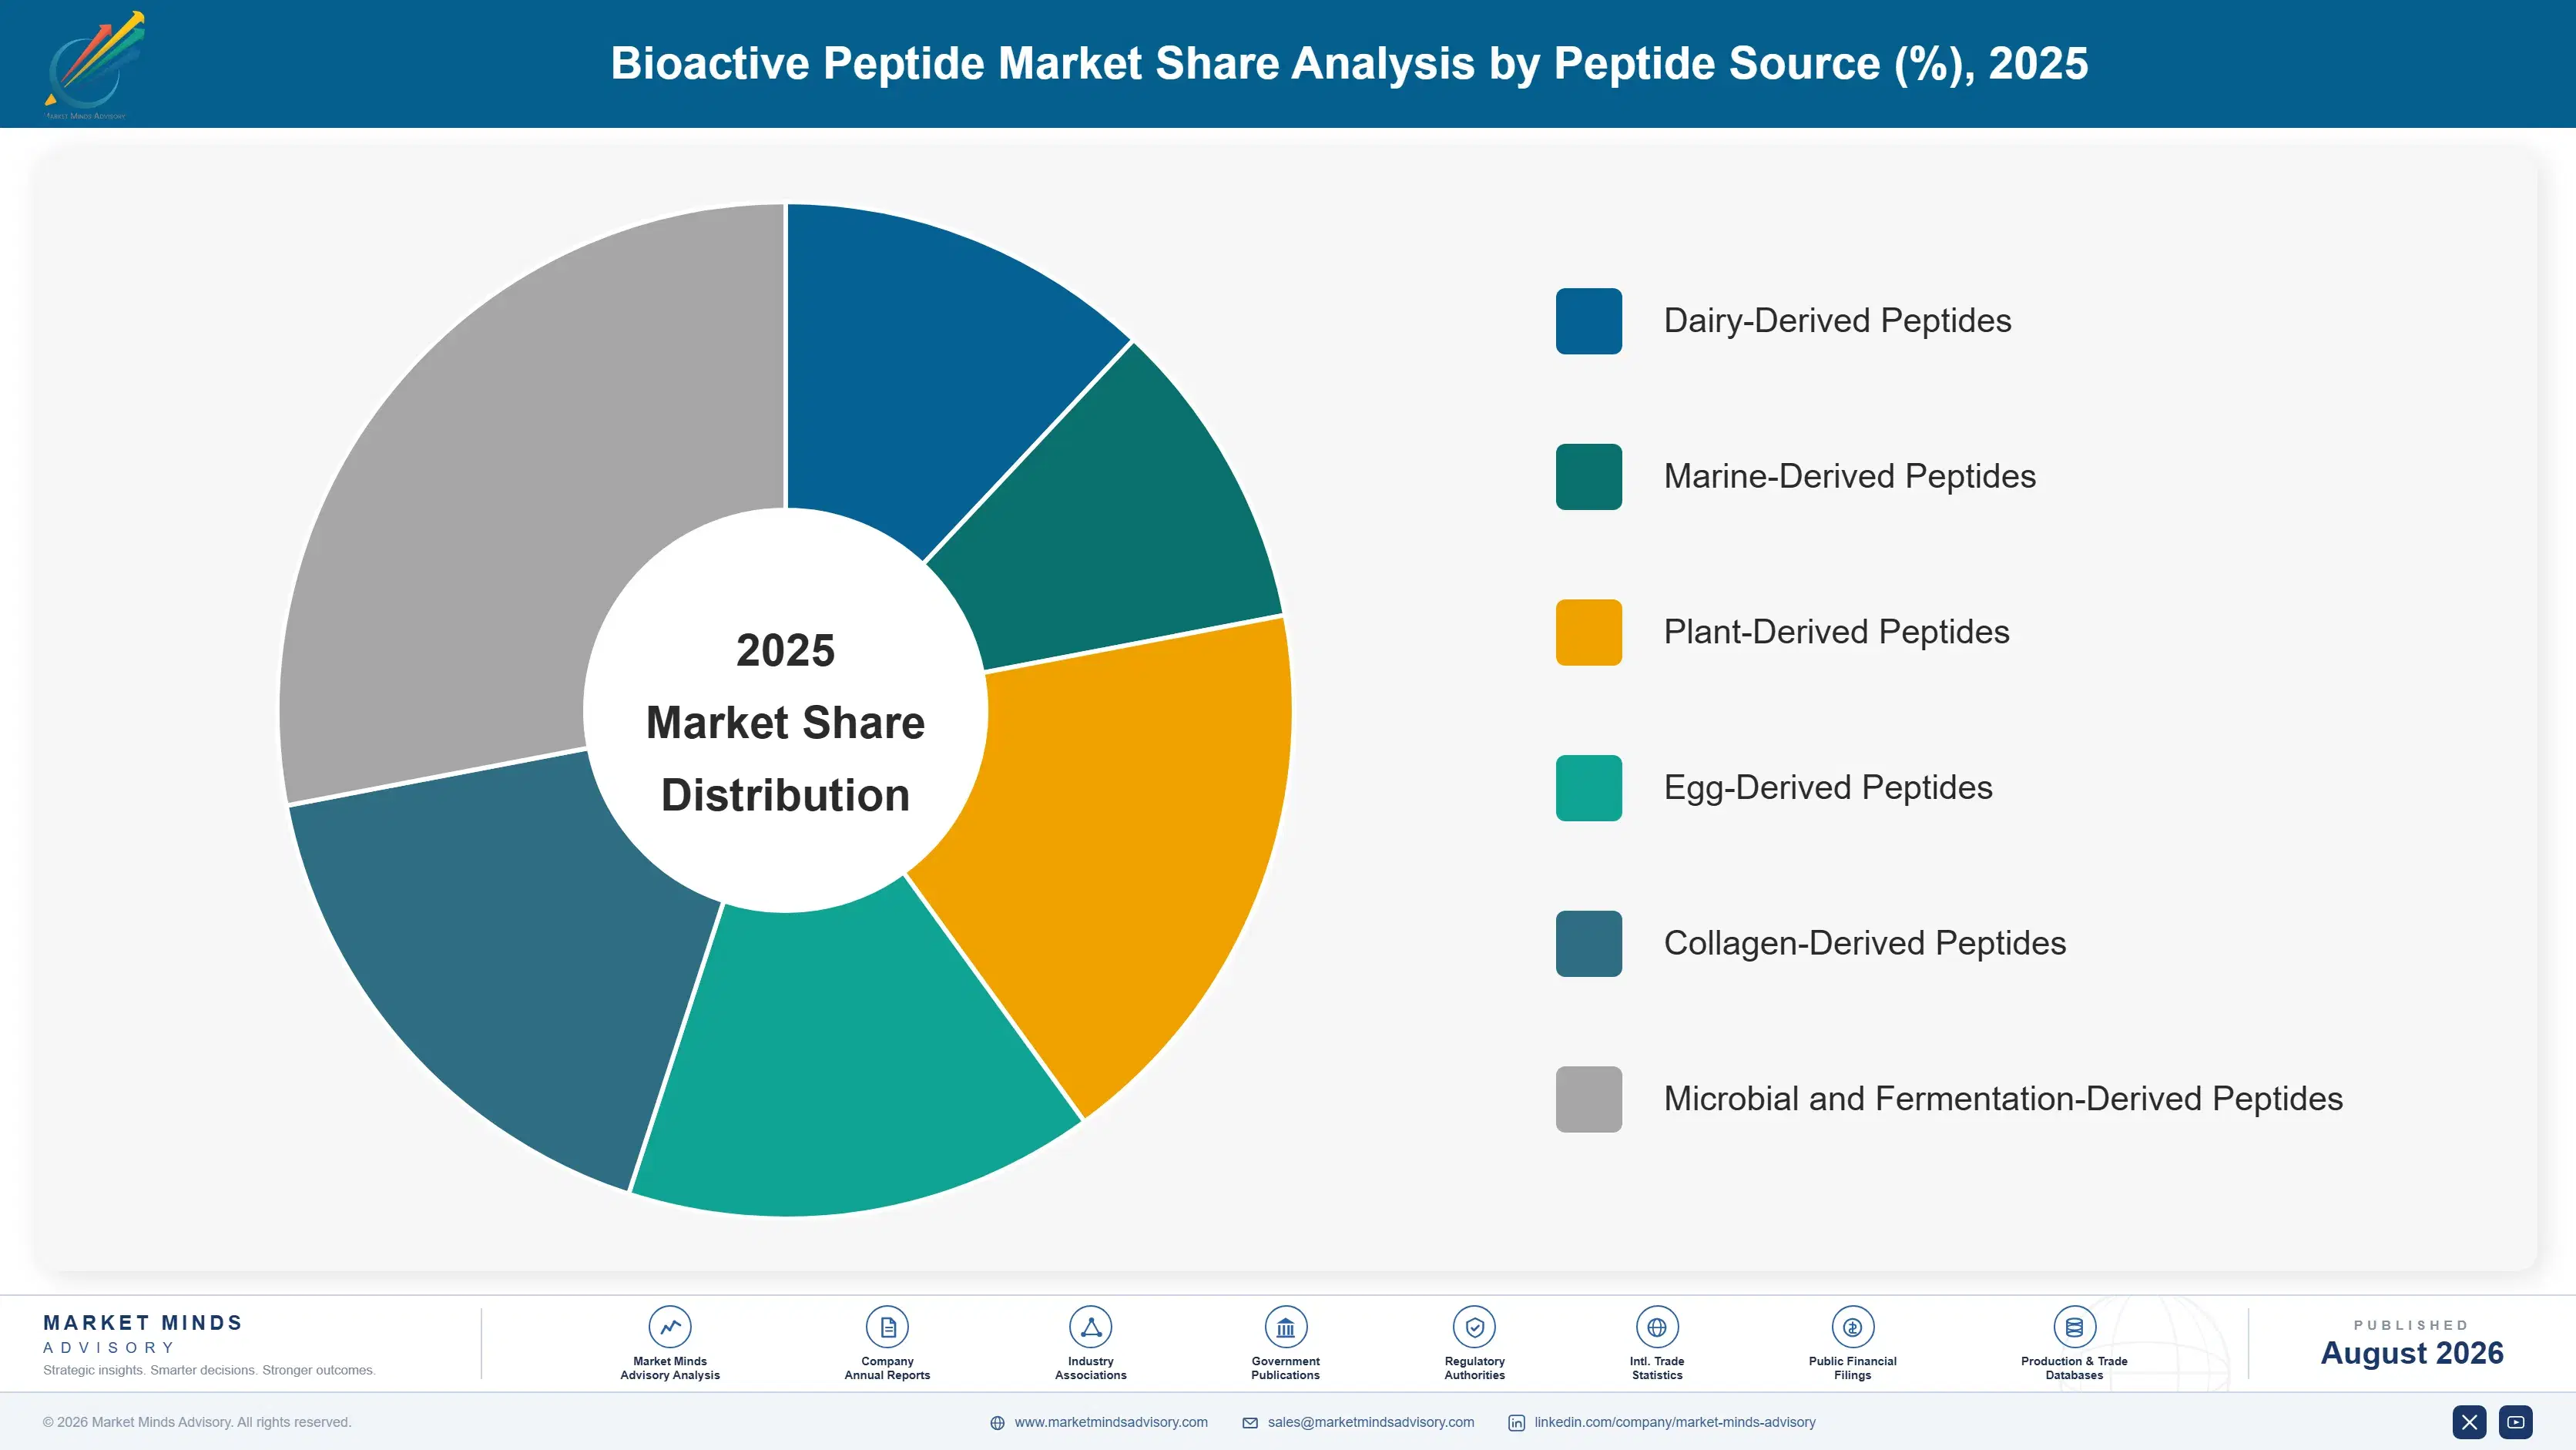
Segmentation follows peptide source, the single classification logic that determines extraction method, cost base, and the clinical claims a supplier can credibly pursue. Dairy, marine, egg, collagen, plant, and microbial fermentation each carry a distinct production process and bioactivity profile. Application and distribution channel are treated separately within the framework rather than folded into this hierarchy.
bioactive-peptide-market-trends-growth-market-share-analysis-1787463232861

Marine-Derived Peptides

Marine-derived peptides grow fastest at 13.5%, about 1.41 times the overall 9.6% rate, extracted through enzymatic hydrolysis of fish, algae, and crustacean processing byproducts that previously carried disposal cost rather than revenue. Norwegian salmon processors and Vietnamese pangasius and shrimp plants have both added dedicated peptide extraction lines since 2022, targeting cardiovascular, joint-health, and anti-inflammatory formulations where marine bioactive fractions carry published clinical support. The category benefits from a genuine sustainability narrative, since it valorizes waste streams rather than requiring purpose-grown feedstock, which matters increasingly to formulators chasing environmental claims alongside physiological ones. Supply remains seasonal and geographically scattered across processing regions, and quality consistency across batches is the harder problem suppliers are still working to solve at commercial scale.
CAGR 13.5%

Plant-Derived Peptides

Plant-derived peptides grow second-fastest at 12.1%, roughly 1.26 times the overall rate, produced by enzymatic or fermentation hydrolysis of pea, soy, rice, and hemp protein isolates for formulators avoiding animal-derived ingredients entirely. Vegan and flexitarian sports nutrition brands have driven most of the recent volume growth, since plant peptides let them match whey-equivalent amino acid profiles without abandoning a plant-based label consumers seek out. Roquette and Ingredion have both expanded dedicated plant peptide capacity since 2023, targeting muscle-recovery and satiety claims previously owned almost entirely by dairy-derived competitors. The constraint is functional performance: plant protein hydrolysates historically carried bitterness and solubility issues that dairy peptides did not, and taste-masking technology determines which suppliers can compete for premium formulation contracts.
CAGR 12.1%
Full segment breakdown across 6 segments available in the complete report.

Regional Architecture and Country Demand Map

East Asia leads on Chinese hydrolysate manufacturing scale and Japan's mature functional-food peptide category, while North America and Western Europe hold premium sports nutrition and clinical nutrition demand. South Asia and Pacific grows fastest behind Vietnamese marine byproduct processing and Australian dairy peptide exports reaching Asian buyers.

North America

Sports nutrition retail density explains North America's 25% share, sitting inside the 22 to 32% band on the strength of a supplement industry that normalized paying a premium for a documented performance claim before most other regions did. Glanbia Nutritionals runs substantial peptide production and formulation capability serving domestic active-lifestyle brands directly, while clinical nutrition manufacturers including Abbott have expanded peptide-based enteral formulas targeting an ageing population and post-surgical recovery markets. The Food and Drug Administration's qualified health claim pathway, while demanding, at least offers suppliers a defined route to substantiated marketing language that several other jurisdictions still lack. Growth of 10.4% reflects continued reformulation around clinically dosed ingredients across both sports and medical nutrition channels.
Share: 25% | CAGR: 10.4% (2026 to 2036)

Western Europe

Regulatory rigor rather than raw volume defines Western Europe's 19% share, positioned within the 18 to 26% band. Arla Foods Ingredients and FrieslandCampina DMV both operate substantial dairy peptide research and production capacity across Denmark and the Netherlands, holding some of the only European Food Safety Authority approved antihypertensive peptide claims, a dossier advantage difficult for challengers to replicate without repeating years of clinical trial work. German and French clinical nutrition manufacturers are substituting peptide fractions into geriatric and hospital formulas as populations age across the region. Growth of 8.3%, the slowest of the seven, reflects a market already mature in dairy peptide adoption and a novel food approval process slower than the American qualified claim pathway.
Share: 19% | CAGR: 8.3% (2026 to 2036)
Regional intelligence for 5 additional markets available in the complete report: East Asia, South Asia and Pacific, Latin America, Middle East and Africa, Eastern Europe. Contact sales@marketmindsadvisory.com.
bioactive-peptide-market-trends-growth-country-cagr-analysis-1787463233383

Where Peptide Suppliers Actually Capture Margin

Extracting a peptide fraction is inexpensive; proving it does something specific is not, and that asymmetry is where margin concentrates. The four moves below focus on what separates suppliers earning specialty pricing from those selling generic hydrolysate: claim substantiation, byproduct sourcing economics, formulation partnership depth, and geographic dossier reuse across jurisdictions with overlapping evidentiary standards most suppliers leave unexploited.

File Health Claims In Multiple Jurisdictions Simultaneously

A dossier built for European Food Safety Authority review shares much of its clinical trial data with an American qualified health claim submission, yet most suppliers file sequentially rather than in parallel, delaying market access in the second jurisdiction by two to three years unnecessarily. Designing the trial protocol from the outset to satisfy both regulators' evidentiary standards costs perhaps 15% more upfront than a single-jurisdiction filing but compresses years of delay into a single approval cycle. Arla Foods Ingredients used this approach for its milk peptide antihypertensive claim, reaching European and select Asian markets faster than single-jurisdiction competitors managed.
Market Impact: Cuts sequential filing delay by 2 to 3 years

Convert Byproduct Streams Into Extraction Feedstock

Fish, algae, and dairy processing waste that once carried genuine disposal cost can instead feed enzymatic hydrolysis lines at close to zero feedstock cost, a durable cost advantage over purpose-grown protein crops that easily runs 30% to 40% on a per-kilogram basis. Norwegian and Vietnamese seafood processors capturing this economics have moved from cost centers to profit centers within a single processing facility. The constraint is consistency: byproduct composition varies by season and species, so suppliers need blending and quality control capability that purpose-grown feedstock never required in the first place.
Market Impact: Cuts extraction feedstock cost by roughly 30% to 40%

Bundle Peptide Supply With Formulation Support Services

Selling raw peptide powder alone competes purely on price against commodity hydrolysate, whereas bundling supply with taste-masking, stability testing, and finished-formula prototyping locks in a customer relationship competitors cannot dislodge with a lower quote alone. DSM-Firmenich and Novonesis both run dedicated application labs that co-develop finished products with brand customers, capturing formulation fees alongside ingredient margin and gaining early visibility into which claims and formats customers plan to launch next. Suppliers offering this bundled model report gross margins running 8 to 12 percentage points above ingredient-only competitors selling comparable peptide fractions at similar volume.
Market Impact: Adds an extra 8 to 12 margin points

License Validated Peptide Sequences To Smaller Formulators

A supplier holding a European Food Safety Authority approved health claim on a specific peptide sequence can license that substantiation to smaller formulators who could never afford the underlying clinical trial programme themselves, converting a sunk research cost into a recurring royalty stream rather than a one-time competitive moat. This mirrors how pharmaceutical ingredient patents monetize, though peptide claim dossiers currently see far less licensing activity than the model supports. Early movers report royalty income adding 4% to 7% on top of direct ingredient sales revenue, a margin stream requiring no additional manufacturing capacity to capture.
Market Impact: Adds royalty income worth 4% to 7% of sales

Who Controls the Margin Pool

Concentration sits at a moderate 34%, with the top five holding regulatory dossiers and production scale smaller specialists cannot match, though the gap to the next tier is narrower than in most ingredient categories, since one successful health claim can lift a mid-sized challenger into premium pricing almost overnight. All participants are assessed on one basis: attributable peptide ingredient revenue, excluding bulk protein sales.
Competition runs along three lines. First, clinical dossier depth, since a supplier holding an approved health claim competes on documented physiology rather than price alone. Second, feedstock access and cost, where byproduct valorization economics increasingly separate marine and dairy specialists from synthetic or commodity competitors. Third, formulation partnership depth, as brand customers increasingly want co-development support rather than a raw ingredient shipped in a drum.

Pressure is building from two directions. Asian nutricosmetic specialists are moving upmarket with genuinely novel marine and fermentation-derived peptides that Western majors have been slower to commercialize, while venture-funded precision fermentation startups threaten to undercut traditional extraction economics within the decade. Rankings should favor participants holding both dossier depth and diversified sourcing over those dependent on a single feedstock stream or a single approval a jurisdictional change could invalidate.
bioactive-peptide-market-trends-growth-company-positioning-matrix-1787463233908

Competitive Moat and Risk Dimensions

ARLA FOODS INGREDIENTS

Moat: Approved antihypertensive peptide claim

Arla Foods Ingredients holds one of the only European Food Safety Authority approved health claims for a milk-derived antihypertensive peptide, built on clinical trial data competitors would need years and several million euros to replicate independently. That approval lets its formulation partners use marketing language rivals selling chemically similar peptides simply cannot use on European packaging.
ARLA FOODS INGREDIENTS

Risk: Single dairy feedstock dependence

Nearly all of Arla's peptide portfolio derives from milk protein, leaving it exposed to dairy commodity price swings and to the broader plant-based substitution trend reshaping protein categories generally. Marine and fermentation-derived competitors offer sustainability narratives dairy-sourced peptides cannot easily match, and diversifying sourcing now would mean competing against specialists with a genuine head start.
DSM-FIRMENICH

Moat: Formulation application lab network

DSM-Firmenich runs application laboratories that co-develop finished peptide formulations directly with brand customers, capturing formulation fees alongside ingredient margin and gaining early visibility into upcoming product launches competitors only learn about after the fact. Its combined nutrition and fragrance heritage gives it cross-category formulation expertise few pure-play peptide suppliers hold.
DSM-FIRMENICH

Risk: Scale creates integration complexity

The 2023 merger integrating DSM and Firmenich created a sprawling portfolio spanning nutrition, fragrance, and cosmetic ingredients, and peptide-specific investment must compete internally against many other business lines for capital and management attention. Smaller, peptide-focused specialists can move faster on a narrow category where DSM-Firmenich must weigh competing priorities.

Players Tracked

Prominent Players

Arla Foods Ingredients
DSM-Firmenich
Novonesis
FrieslandCampina DMV
Glanbia Nutritionals

Other Key Players

Kerry Group
Ingredion
Roquette
Fonterra
Tate & Lyle
AMCO Proteins
Gelita
Rousselot
Sonac
PB Leiner
CJ CheilJedang
Ajinomoto
Nitta Gelatin
Bioseutica
Symrise

Recent Developments

JANUARY 2024

Novozymes and Chr. Hansen complete merger to form Novonesis

Novozymes and Chr. Hansen completed their previously announced merger, combining enzyme and microbial ingredient capability under the new Novonesis name, with bioactive peptide and fermentation-derived ingredient research spanning both legacy businesses. This was a merger of two independent public companies rather than an acquisition, approved by both shareholder bases separately.
Signal: Enzyme and microbial specialists merging positions fermentation-derived peptide production as a genuine growth bet rather than a side project.
SEPTEMBER 2023

DSM and Firmenich complete merger creating DSM-Firmenich

DSM and Firmenich completed their previously announced merger of equals, creating a combined nutrition, health, and beauty group with expanded peptide and bioactive ingredient capability spanning both firms' portfolios. This was a merger of two independent companies, not an acquisition of one by the other, structured as a dual-listed combination.
Signal: Combining nutrition and fragrance houses signals ingredient majors now compete on cross-category formulation science rather than single-category depth.
JUNE 2024

Arla Foods Ingredients expands peptide production capacity in Denmark

Arla Foods Ingredients announced an organic expansion of its bioactive peptide line at its Danish facility, adding capacity to meet demand for its approved antihypertensive peptide across sports and clinical nutrition customers. This was an organic expansion funded from existing operations, not an acquisition or joint venture.
Signal: Capacity investment behind an already-approved health claim shows incumbents defending dossier advantage rather than chasing new categories.

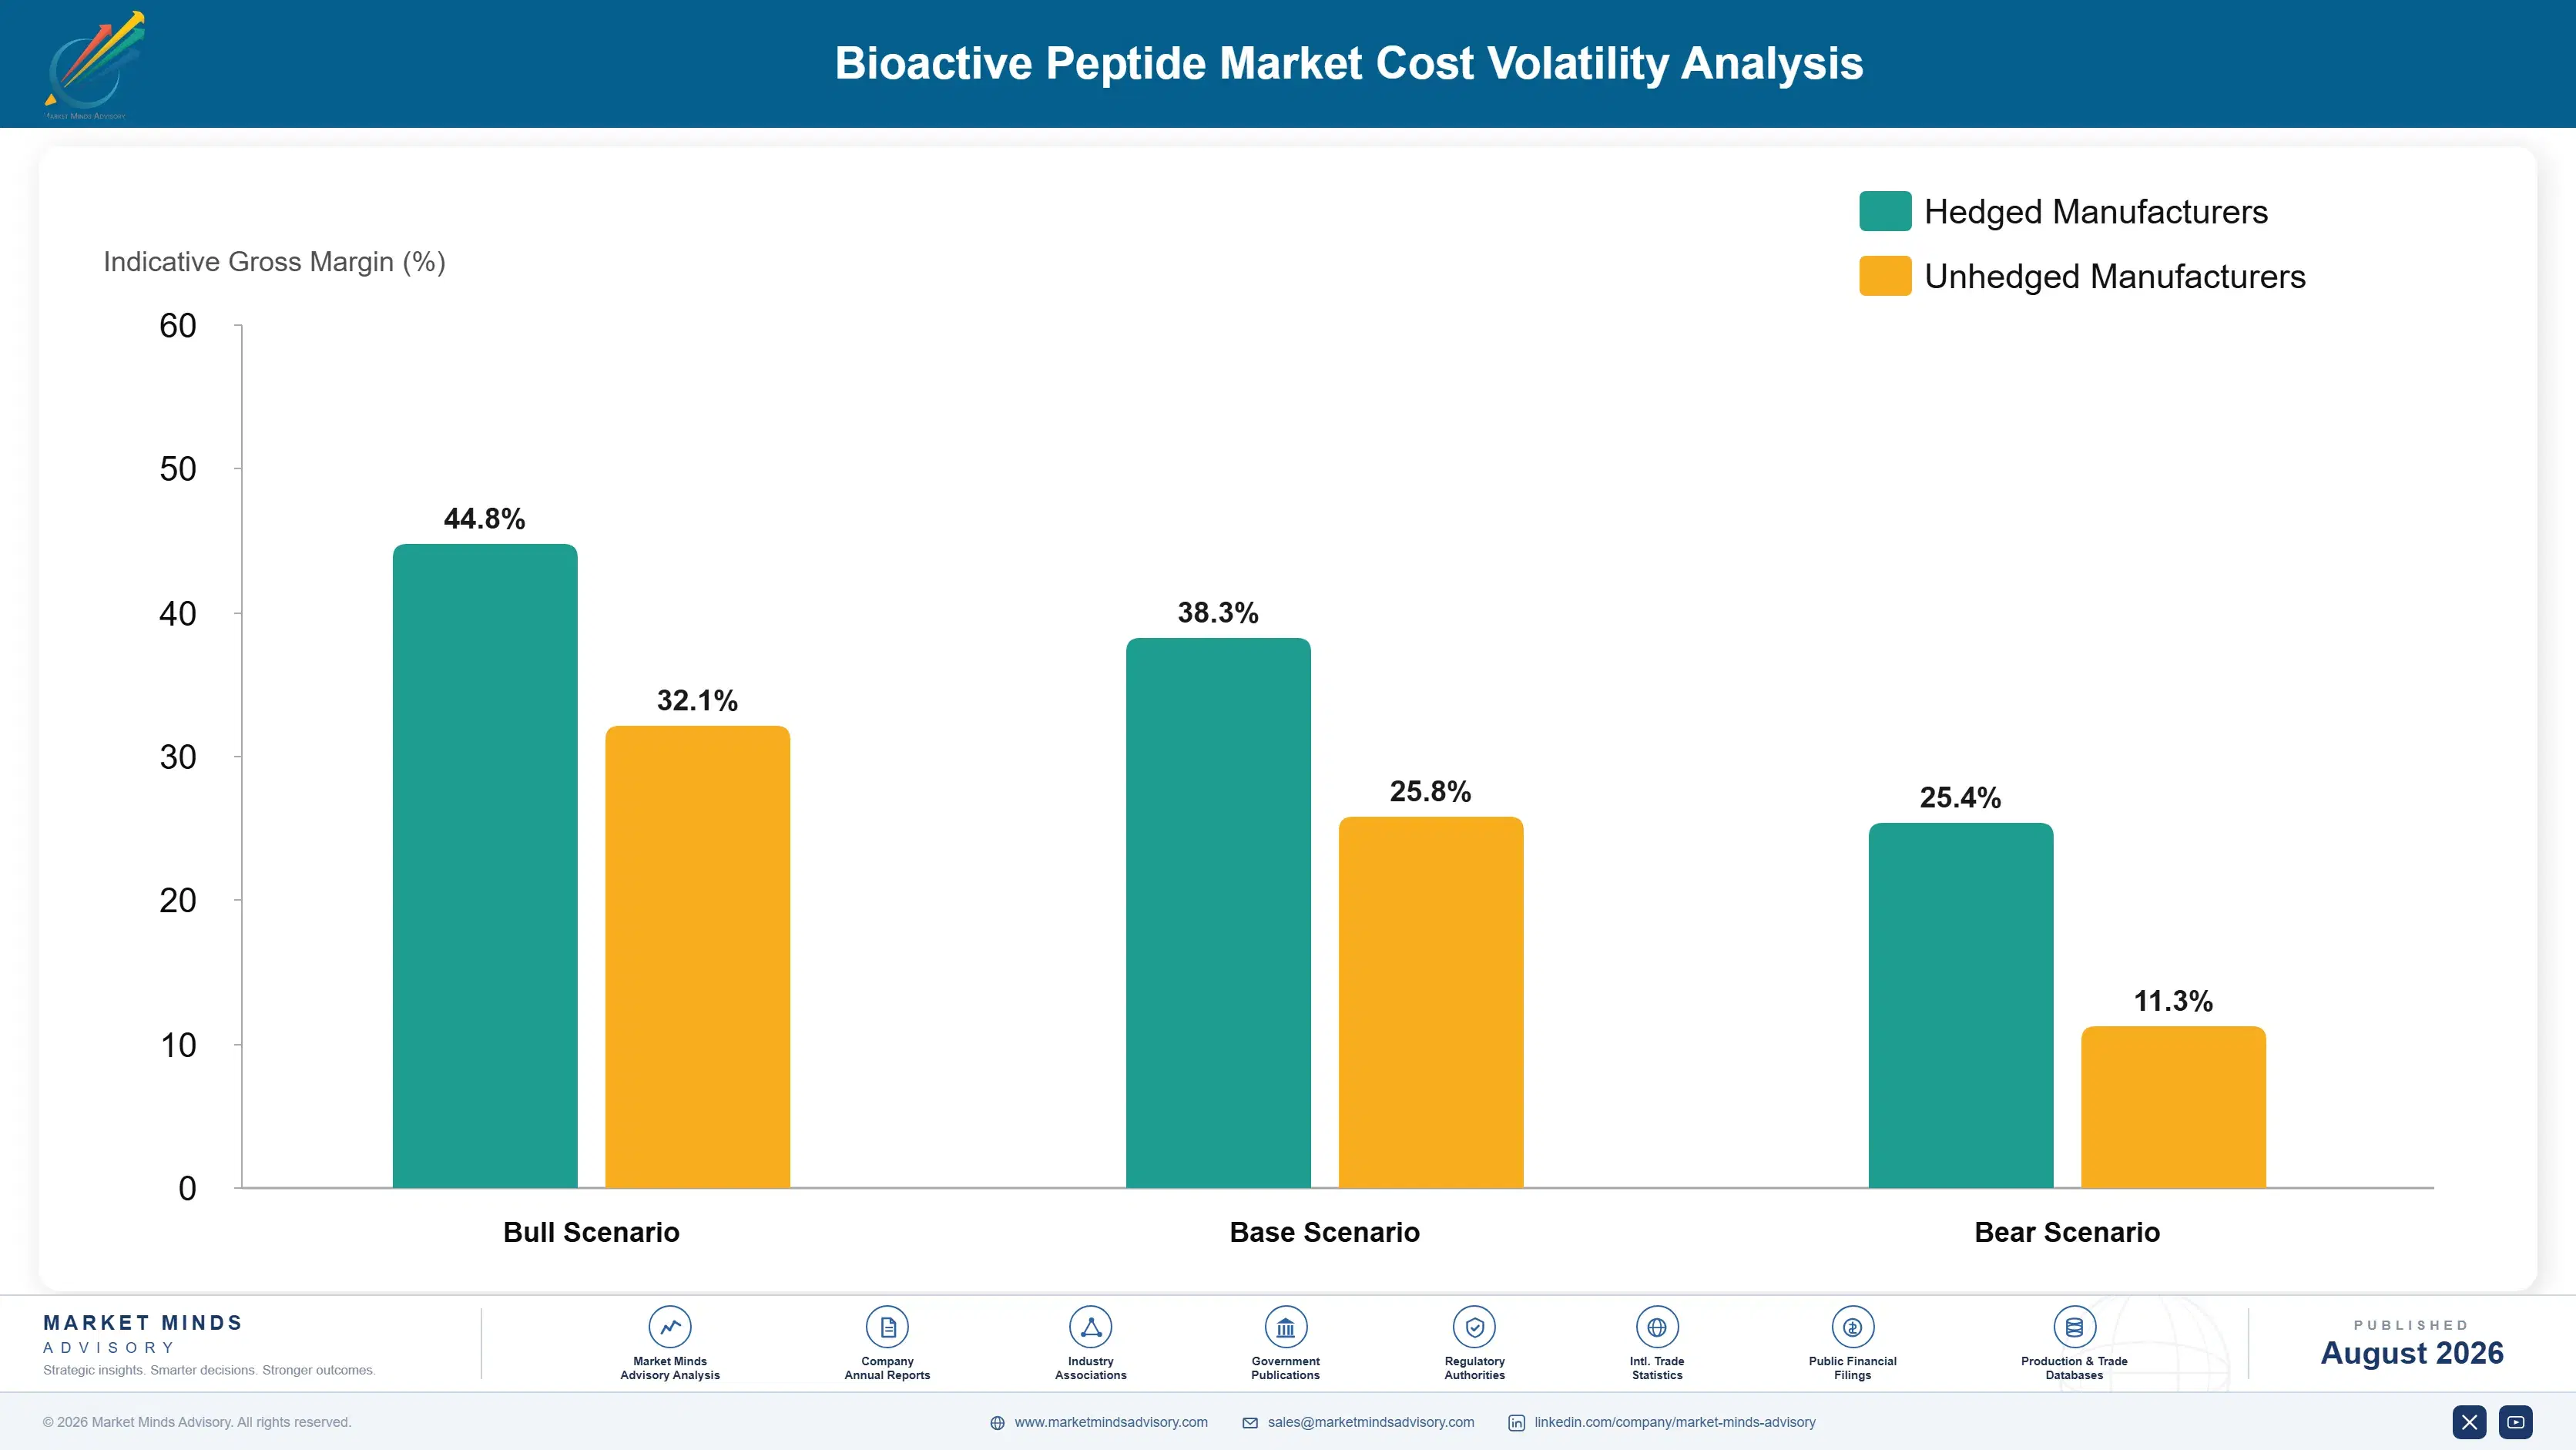
Feedstock Protein And Enzyme Cost Exposure

Raw protein feedstock, whether dairy, marine, egg, or plant-derived, runs 45% to 60% of cost of goods sold, sourced from milk protein concentrate out of Northern Europe, fish and algae byproduct from Norwegian and Southeast Asian processors, and pea or soy isolate from North American crushers. Enzyme cost for hydrolysis adds a further 8% to 12%, supplied by a concentrated group of producers including Novonesis and IFF.
Global dairy prices spiked sharply through 2022, with whole milk powder and whey protein concentrate reaching multi-year highs as feed cost inflation and reduced herd sizes across Oceania and Europe tightened supply at once. Arla Foods' 2022 Annual Report documented raw milk price increases passing through to ingredient customers, compressing margins for producers unable to reprice contracts quickly. Fish protein feedstock saw comparable volatility as El Nino disrupted Peruvian anchovy landings.

Exposure separates players by sourcing diversity more than size. A supplier locked into single-origin dairy feedstock carries the weight of a herd-size shock, while a diversified house sourcing across dairy, marine, and plant streams shifts volume toward whichever feedstock is cheaper. Regional processors closest to feedstock, Norwegian specialists or Dutch cooperatives, hold a landed cost advantage import-dependent Asian competitors cannot replicate.
bioactive-peptide-market-trends-growth-cost-volatility-analysis-1787463234107

Diversify sourcing across dairy, marine, and plant feedstock streams

Suppliers dependent on a single protein source carry the full weight of any feedstock-specific shock, whether a dairy herd contraction or a poor fishing season. Building hydrolysis capability across multiple feedstock types lets a producer shift volume toward whichever input is temporarily cheaper, smoothing cost volatility considerably compared to single-source competitors locked into one supply chain entirely.

Contract feedstock supply on multi-year fixed-volume agreements

Spot-market feedstock purchasing exposed several producers to the sharpest of the 2022 dairy and marine protein price spikes, while competitors holding multi-year supply agreements with processors absorbed the shock more gradually. Locking volume and reference pricing with upstream dairy cooperatives or seafood processors ahead of need converts an unpredictable cost line into a plannable one across budget cycles.

Vertically integrate into byproduct-generating processing operations

The most durable cost position belongs to producers who own or partner directly with the dairy or seafood processing operation generating the feedstock stream, capturing byproduct value at its source rather than purchasing it from an intermediary at a marked-up price. This also secures supply continuity that pure ingredient buyers cannot guarantee themselves during a shortage.

Portfolio Architecture for Margin Defence

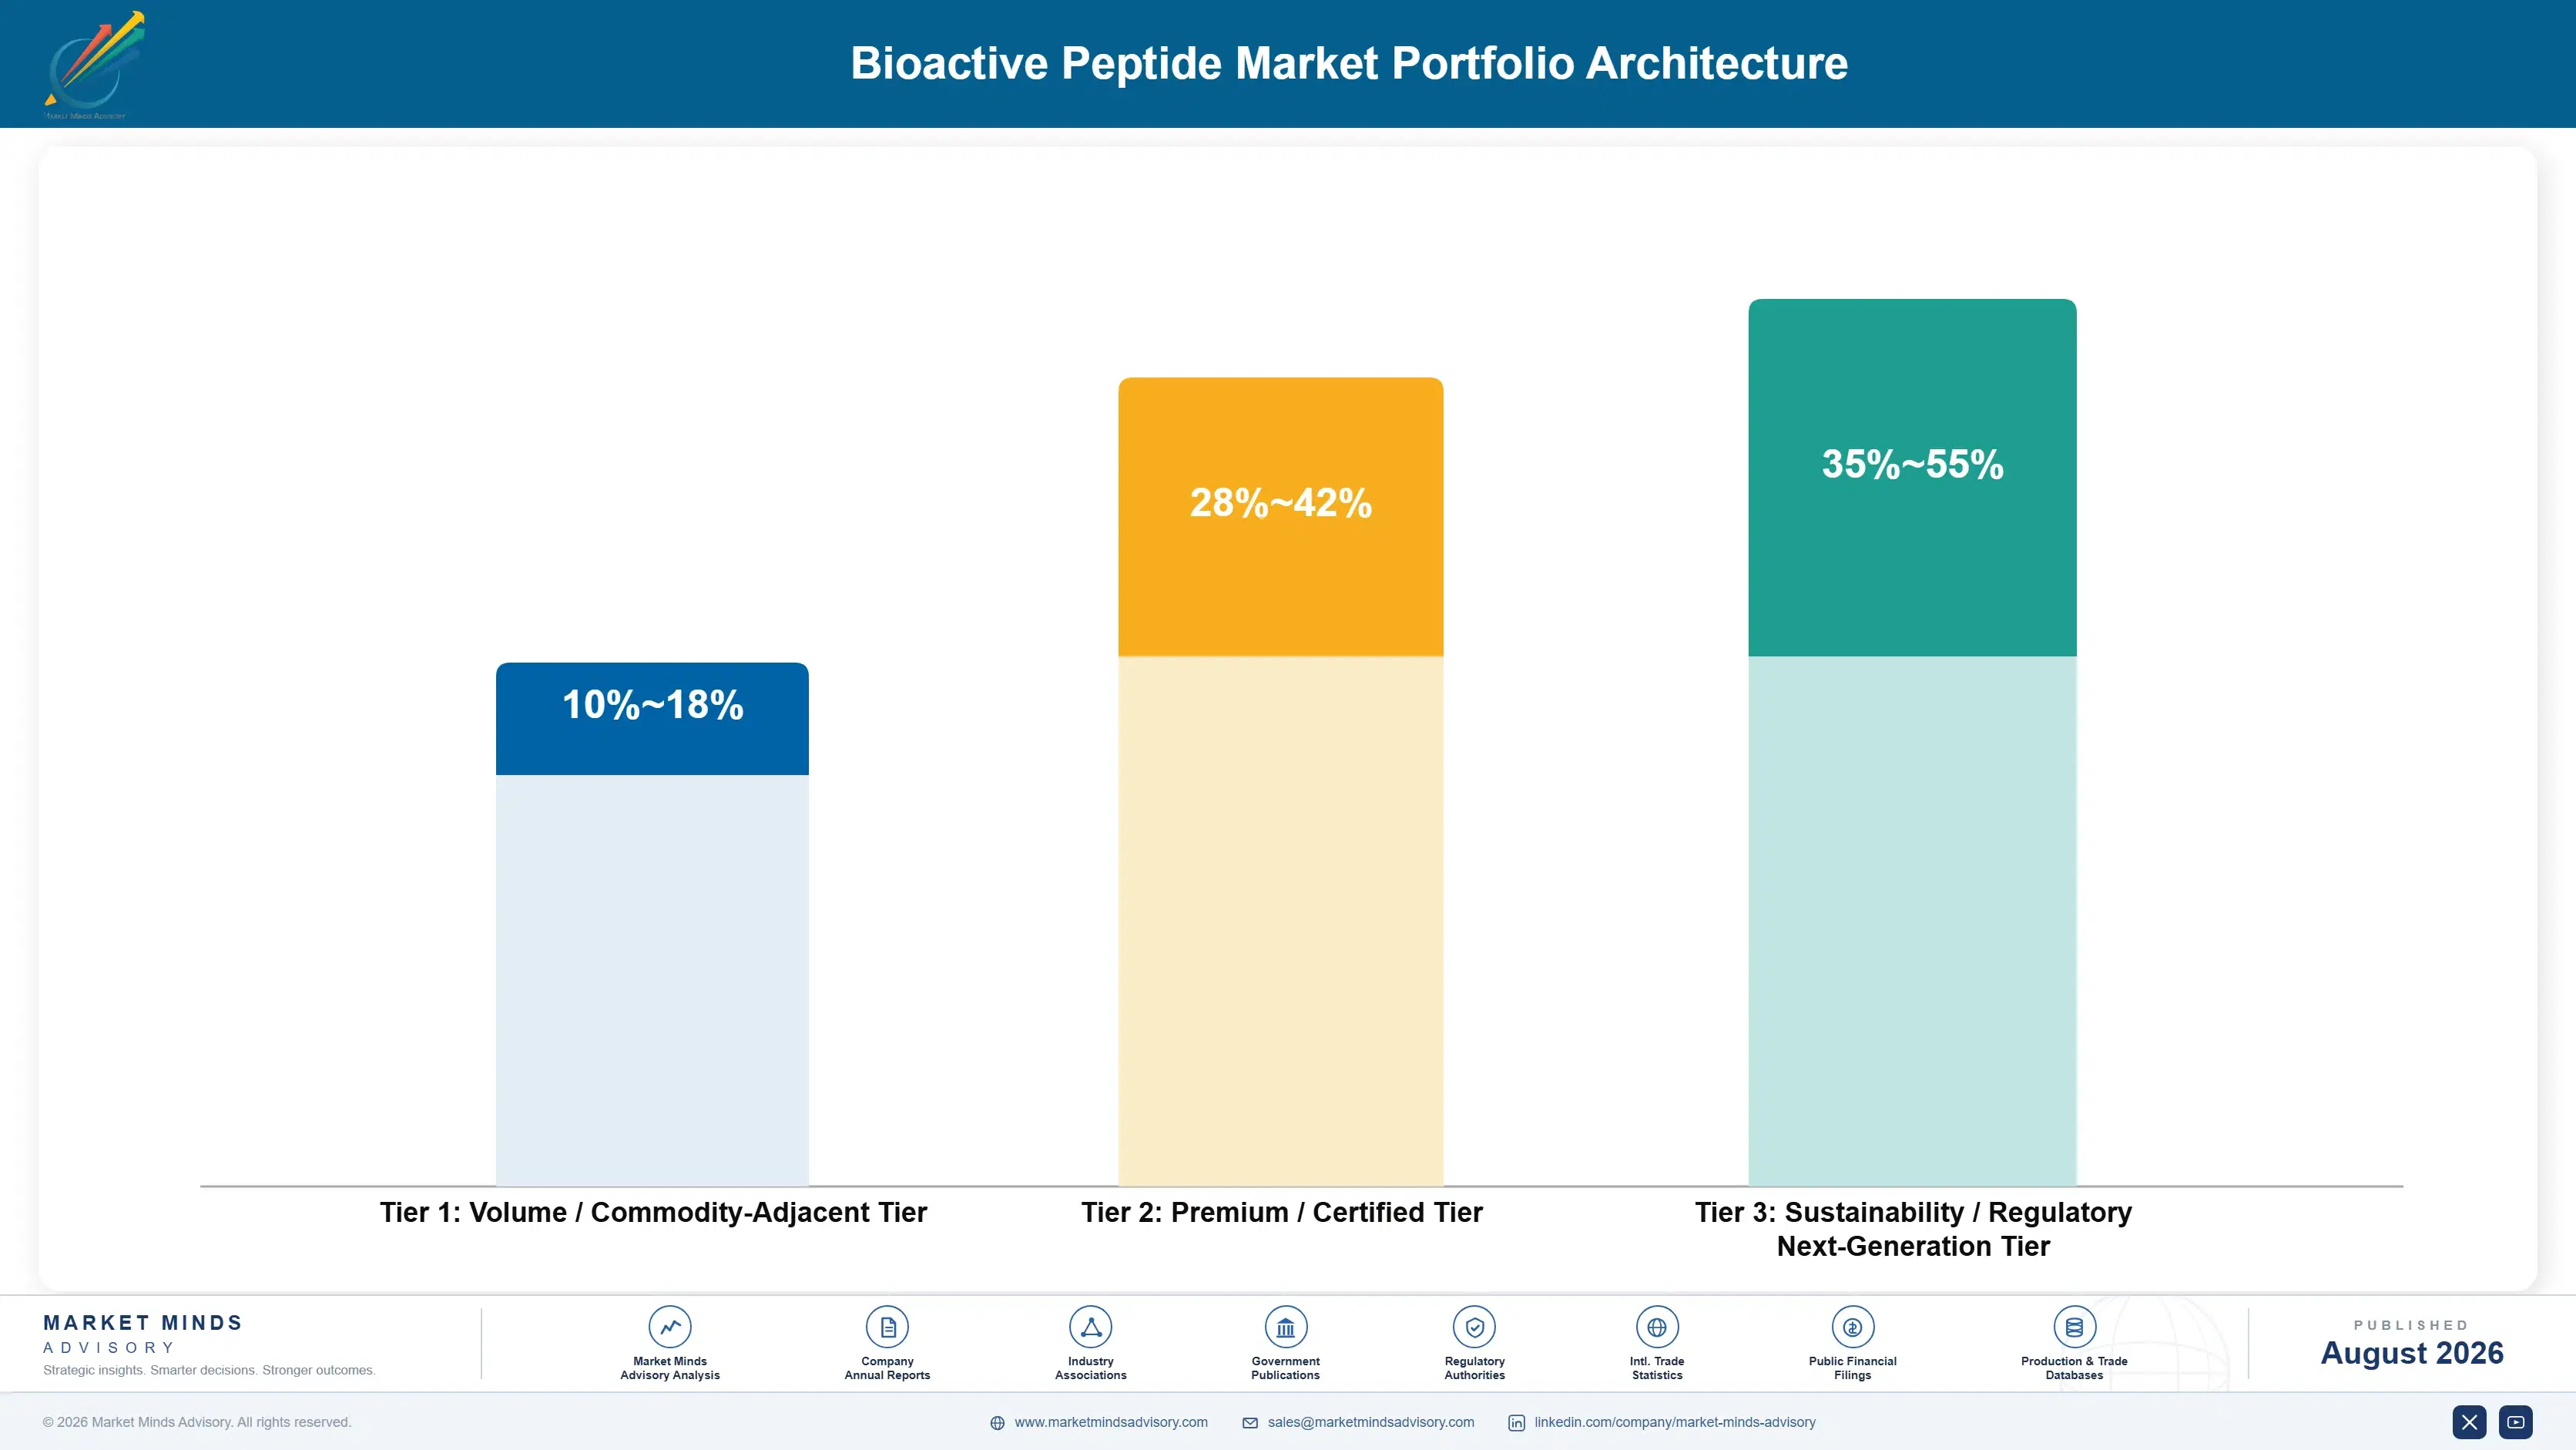
The portfolio splits into three tiers by substantiation depth. Generic protein hydrolysate sold without a specific health claim competes almost entirely on price against commodity protein. Claim-certified peptides sold under an approved health claim earn considerably more, since the dossier rather than the amino acid content carries the value. Novel fermentation-derived and precision-engineered peptide sequences sit at the top, priced against pharmaceutical-adjacent economics rather than food commodity benchmarks.
The tension runs between volume that keeps hydrolysis lines running and margin that justifies the trial spend behind a genuine claim. Generic hydrolysate sales fund plant utilization but earn thin margins that barely cover feedstock and enzyme cost. Claim-certified volume carries the returns yet depends on approval timelines producers cannot control or accelerate. Producers weighting entirely toward either position carry real exposure, either to commodity price competition or to a single dossier's approval risk.

High-value pools concentrate wherever a formulator needs a specific, published clinical claim to justify premium retail pricing: sports nutrition recovery formulas, geriatric and clinical nutrition products, and nutricosmetic skin-health lines all fit this pattern. Generic hydrolysate sold into animal feed or basic protein fortification competes on commodity terms and generally earns the thinnest margin in the category.

Volume / Commodity-Adjacent Tier

Generic protein hydrolysate sold without a substantiated health claim, priced against commodity protein ingredients and animal feed-grade protein. Margins stay thin because amino acid content, not documented bioactivity, sets the price ceiling here.
Gross Margin: 10-18%

Premium / Certified Tier

Peptide fractions sold under an approved regulatory health claim, commanding several multiples of generic hydrolysate pricing because the clinical dossier behind the claim, not the amino acid content, is what customers actually pay for.
Gross Margin: 28-42%

Sustainability / Regulatory / Next-Generation Tier

Novel fermentation-derived and precision-engineered peptide sequences targeting emerging claims, priced closer to specialty pharmaceutical ingredient economics than to food commodity benchmarks given their genuine early-stage scarcity and thin supplier count.
Gross Margin: 35-55%
bioactive-peptide-market-trends-growth-portfolio-architecture-1787463234609

High-value Sub-segments and Strategic Watch-out

Marine-Derived Peptides

High value and the fastest growth at 13.5%, built on byproduct valorization economics that pair a genuine sustainability story with near-free feedstock cost. Norwegian and Vietnamese processors adding dedicated extraction lines since 2022 are converting disposal cost into a meaningful new revenue stream entirely, at real scale.
Gross Margin: 30-48%

Plant-Derived Peptides

High value with strong growth at 12.1%, serving vegan and flexitarian sports nutrition brands that need whey-equivalent amino acid profiles without carrying an animal-derived label at all. Taste-masking and solubility technology, not raw extraction capability, is what actually separates competitive suppliers in this fast-moving segment today.
Gross Margin: 26-40%

Dairy-Derived Peptides

The volume core at 7.6% growth, the slowest of the six segments, built on decades of established whey and casein hydrolysate production capacity and the only segment holding a genuinely mature European health claim. Growth now tracks the broader protein market rather than outpacing it.
Gross Margin: 18-30%

Egg-Derived Peptides

The strategic watch-out at 8.2% growth, constrained by avian influenza outbreaks that periodically disrupt egg supply and by a shrinking pool of processors willing to invest in dedicated peptide extraction given that volatility. Substitution risk from plant and marine alternatives compounds this exposure considerably further.
Gross Margin: 16-26%

Why Peptide Contracts Renew Reliably

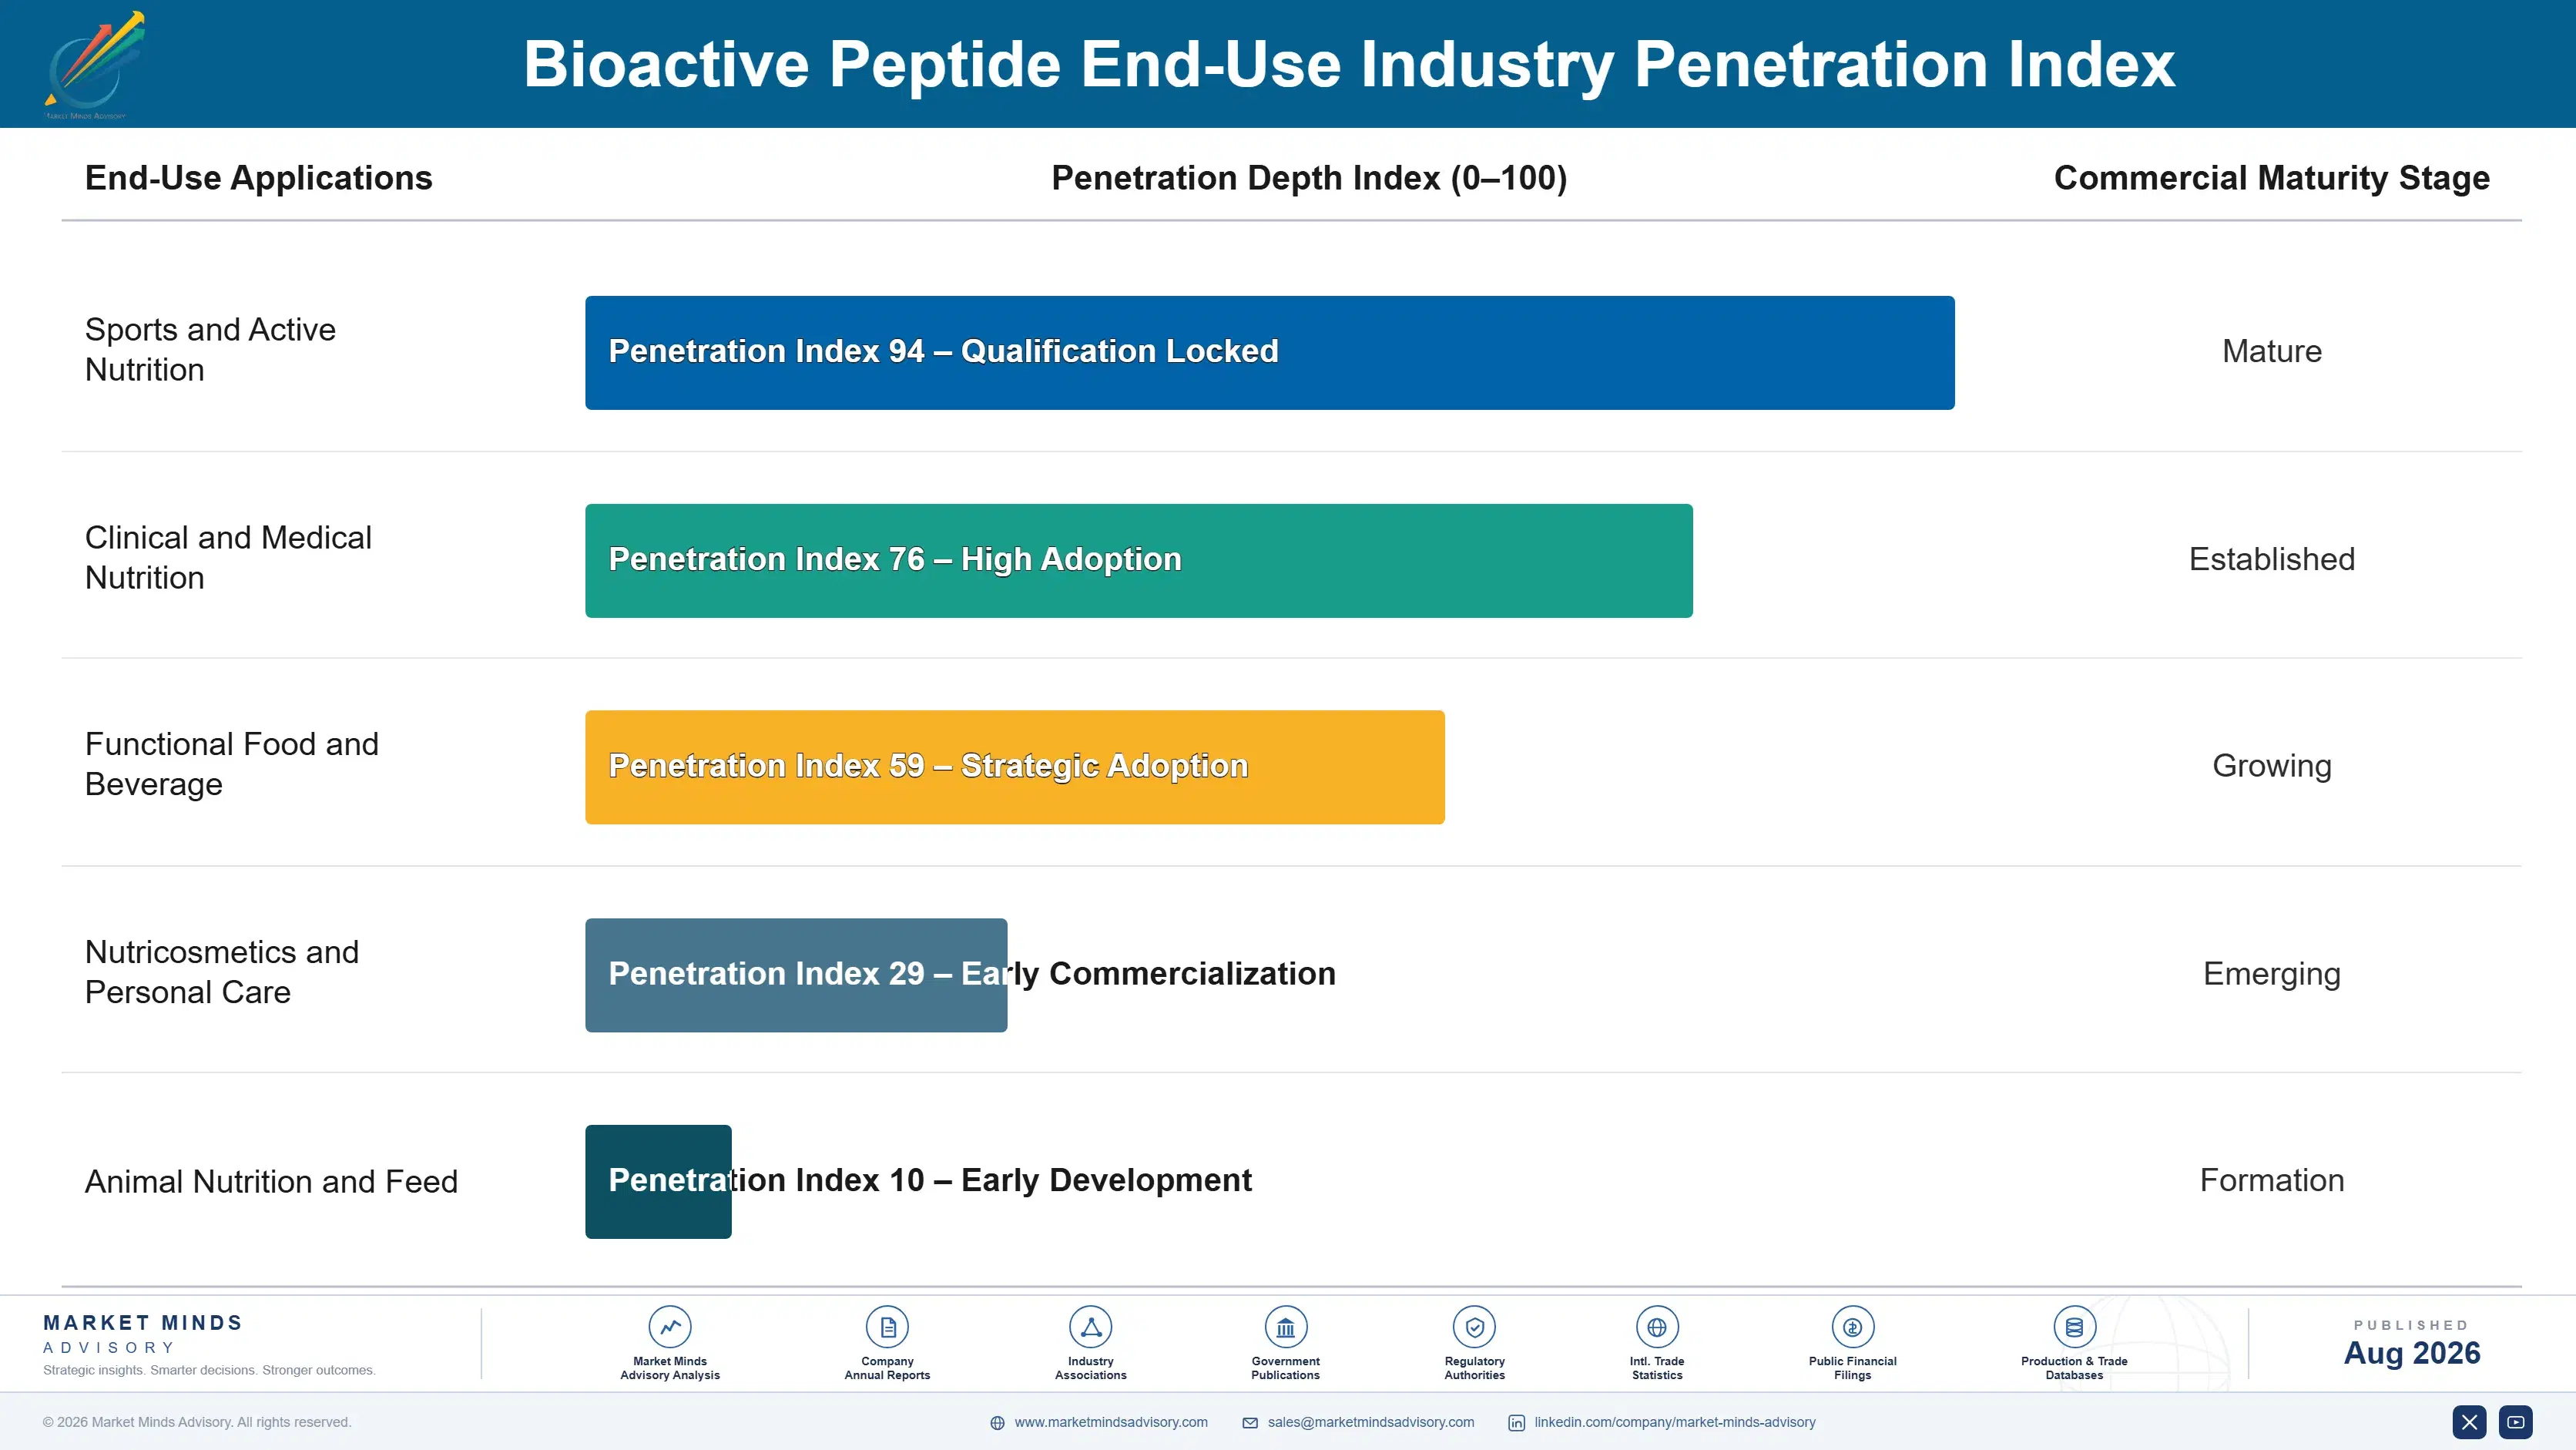
A formulator who reformulates a flagship product around a specific peptide ingredient rarely switches suppliers afterward, since doing so means re-running stability and sensory testing and potentially invalidating the health claim the finished product carries on its label. That switching cost behaves like an annuity for incumbent suppliers, converting a single successful formulation win into years of recurring ingredient revenue rather than a one-time transaction.
Adoption depth varies considerably by vertical. Sports nutrition adopted fastest and deepest, since active-lifestyle consumers already expect ingredient transparency and pay attention to labels. Clinical and geriatric nutrition follows closely, embedding peptides into formulas prescribed or recommended by healthcare providers who rarely revisit ingredient choices once satisfied. Nutricosmetics is earlier-stage but deepening quickly across Asia. Mainstream packaged food adoption remains shallow, held back by cost and by consumers who do not yet associate peptides with everyday products.

Buyer profiles have shifted from R&D scientists exploring novel ingredients toward brand and marketing teams specifying peptides for their label story as much as their physiological effect. Younger formulation teams increasingly research bioactive claims directly through published literature rather than relying solely on supplier-provided dossiers, raising the bar for the quality of clinical evidence suppliers must present upfront.
bioactive-peptide-market-trends-growth-end-use-penetration-index-1787463235133

Our Call On Bioactive Peptides

These are among the four positions where our research anticipates prominent divergence between winners and laggards over the coming forecast period. Each is grounded in the demand model, the regulatory perimeter, and the announced capacity pipeline.
01 / CLAIM SUBSTANTIATION GATES VALUE

A peptide without a dossier is just protein

A peptide fraction with a registered health claim sells at several multiples of an identical hydrolysate lacking one, and that gap is widening rather than narrowing as retailers push substantiated labels over generic protein claims. Suppliers should treat clinical trial investment as the primary capital allocation decision in this category, not a compliance afterthought bolted on after a product already exists. Those without dossier capability will keep sliding into private-label commodity channels regardless of how sophisticated their extraction technology actually is.
02 / BYPRODUCT SOURCING WINS MARGIN

Marine and dairy byproduct feedstock beats purpose-grown protein

Marine and dairy processing byproducts that once carried genuine disposal cost now feed enzymatic hydrolysis lines at close to zero feedstock cost, a durable advantage over purpose-grown plant protein that easily runs 30% to 40% on a per-kilogram basis. Norwegian and Vietnamese processors capturing this economics have converted a cost center into a genuine profit center within existing processing facilities. Suppliers without access to a byproduct stream should partner directly with processors rather than compete on open-market feedstock purchasing alone at prevailing spot prices.
03 / ASIAN MANUFACTURING SCALE LEADS

China's hydrolysate capacity now sets the volume benchmark

China's enzymatic hydrolysis manufacturing scale gives East Asia 33% of category value, well above what production capability alone would suggest for a region historically weaker on clinical substantiation than Europe or America. Japan and South Korea add regulatory precedent and nutricosmetic demand respectively, making the region's leadership multidimensional rather than a single-country volume story. Western suppliers should treat Asian capacity as a genuine cost benchmark rather than dismiss it as a lower-quality alternative, since scale increasingly funds Chinese producers' own clinical trial investment too.
04 / FORMULATION BUNDLING LOCKS CUSTOMERS

Selling application support, not powder, wins repeat business

Suppliers bundling peptide ingredients with taste-masking, stability testing, and finished-formula prototyping report gross margins running 8 to 12 percentage points above ingredient-only competitors, because the relationship becomes genuinely difficult for a brand customer to unwind once a finished, labeled product depends on it. DSM-Firmenich and Novonesis both operate application laboratories that capture this value directly and early. Suppliers still selling raw peptide powder alone should expect continued price pressure from customers who can source identical amino acid content elsewhere for considerably less.

Engagement Snapshot From the Field

A live engagement with an industry participant carrying material or product regulatory and market exposure ahead of a defining policy shift, showing how our research translates into a defensible multi-year portfolio strategy.
MARKET MINDS ADVISORY · CLIENT ENGAGEMENT SUMMARY
Bioactive Peptide Producer Strategic Portfolio Review and Transition Roadmap 2026·Investment Scenario on Bioactive Peptide Exposure Evaluation 2025-26
CLIENT PROFILE
A multinational sports nutrition brand operating across North America and Western Europe engaged MMA while planning a flagship recovery product reformulation. The client reported annual revenue near USD 1.8 billion and sourced whey-derived peptide ingredients from three suppliers, with leadership seeking a documented clinical claim to differentiate the reformulated line from private-label competitors undercutting it on price (client-reported, unverified by MMA).
STRATEGIC CHALLENGE
Management could not agree whether to invest in an in-house clinical trial to substantiate a proprietary peptide blend or license an already-approved claim from an established supplier. The in-house route promised exclusivity but carried years of delay and uncertain regulatory outcome, while licensing offered speed but meant sharing the claim with the supplier's other customers, potentially including direct competitors.
MMA APPROACH
MMA modeled the cost and timeline of an in-house European Food Safety Authority dossier against licensing terms from three suppliers holding existing approved claims. We assessed exclusivity provisions each supplier was willing to offer, benchmarked category pricing achievable under each claim, and screened competitor product launches to estimate how long any licensed claim advantage would remain meaningfully differentiated before rivals matched it.
KEY FINDINGS
  1. An in-house dossier would have cost roughly USD 4 million and taken three years, well beyond the product launch window leadership had already committed to publicly (client-reported, unverified by MMA).
  2. Two of three suppliers offered category exclusivity within sports nutrition specifically, leaving the client free to differentiate against direct competitors while the supplier sold into adjacent categories.
  3. Licensed claim pricing added roughly 22% to ingredient cost, comfortably offset by a 40% retail price premium the reformulated line achieved at launch (client-reported, unverified by MMA).
  4. Competitor products carrying a similar but unlicensed claim faced retailer delisting risk, since two major retail chains had begun requiring substantiation documentation before shelf placement.
CLIENT PROFILE
A multinational sports nutrition brand operating across North America and Western Europe engaged MMA while planning a flagship recovery product reformulation. The client reported annual revenue near USD 1.8 billion and sourced whey-derived peptide ingredients from three suppliers, with leadership seeking a documented clinical claim to differentiate the reformulated line from private-label competitors undercutting it on price (client-reported, unverified by MMA).
STRATEGIC CHALLENGE
Management could not agree whether to invest in an in-house clinical trial to substantiate a proprietary peptide blend or license an already-approved claim from an established supplier. The in-house route promised exclusivity but carried years of delay and uncertain regulatory outcome, while licensing offered speed but meant sharing the claim with the supplier's other customers, potentially including direct competitors.
MMA APPROACH
MMA modeled the cost and timeline of an in-house European Food Safety Authority dossier against licensing terms from three suppliers holding existing approved claims. We assessed exclusivity provisions each supplier was willing to offer, benchmarked category pricing achievable under each claim, and screened competitor product launches to estimate how long any licensed claim advantage would remain meaningfully differentiated before rivals matched it.
KEY FINDINGS
  1. An in-house dossier would have cost roughly USD 4 million and taken three years, well beyond the product launch window leadership had already committed to publicly (client-reported, unverified by MMA).
  2. Two of three suppliers offered category exclusivity within sports nutrition specifically, leaving the client free to differentiate against direct competitors while the supplier sold into adjacent categories.
  3. Licensed claim pricing added roughly 22% to ingredient cost, comfortably offset by a 40% retail price premium the reformulated line achieved at launch (client-reported, unverified by MMA).
  4. Competitor products carrying a similar but unlicensed claim faced retailer delisting risk, since two major retail chains had begun requiring substantiation documentation before shelf placement.
RECOMMENDED STRATEGY
Phase 1: Phase 1 (0 to 4 months): License an approved antihypertensive peptide claim with category exclusivity from the strongest-positioned supplier rather than pursue an in-house dossier. Phase 2: Phase 2 (4 to 10 months): Reformulate the flagship recovery line around the licensed peptide and secure retailer shelf commitments ahead of the public launch date. Phase 3: Phase 3 (10 to 24 months): Begin an in-house dossier for a second, differentiated peptide claim to reduce long-term dependence on a single licensed supplier relationship.
OUTCOME
The reformulated line launched on schedule carrying a licensed, substantiated claim that competitors without dossier access could not replicate. Retail price premium reached roughly 40% above the prior formulation, and the client reported the licensing route saved approximately 18 months against the in-house dossier timeline while avoiding several million dollars of upfront clinical trial risk (client-reported, unverified by MMA).

Frequently Asked Questions

Foundational context covering the market sizes, CAGR, scope, country, region and competition that inform every finding below. This section is provided to cover basics and most often pre-purchase conversations, answered from the MMA Primary Research Dataset.

What is the current size of the Bioactive Peptide Market?

The bioactive peptide market reached USD 9.4 billion in 2025. Growth is driven by sports nutrition, clinical nutrition, and nutricosmetic formulators paying premium prices for peptides carrying documented physiological claims.

How large will the Bioactive Peptide Market be by 2036?

The market is projected to reach USD 25.77 billion by 2036, an increase of USD 15.47 billion over the 2026 base as claim-substantiated peptides displace generic protein hydrolysate across formulated categories.

What is the CAGR for the Bioactive Peptide Market 2026 to 2036?

The market is projected to grow at a 9.6% CAGR between 2026 and 2036, with a bull case of 10.8% and a bear case of 8.4% depending on health claim approval pace.

Which segment is growing fastest?

Marine-derived peptides grow fastest at a 13.5% CAGR, about 1.41 times the overall market rate, as seafood byproduct valorization pulls fish and algae protein into cardiovascular and joint-health formulations.

Who are the major companies in the Bioactive Peptide Market?

Leading suppliers include Arla Foods Ingredients, DSM-Firmenich, Novonesis, FrieslandCampina DMV, and Glanbia Nutritionals, assessed on attributable peptide ingredient revenue across dairy, marine, plant, and fermentation-derived sourcing.

Which country is growing fastest?

Vietnam grows fastest among tracked countries as pangasius and shrimp processors add dedicated peptide extraction lines, converting seafood processing byproduct that previously sold as low-value fishmeal into bioactive ingredient revenue.

Report Segmentation Architecture

The full report scope spans multiple orthogonal segmentation dimensions, with cross-tabulated demand data provided for each dimension pair. Coverage extends further to regional breakdowns, trend trajectories, and the competitive detail needed to support segment-level decision-making.

By Peptide Source

  • Dairy-Derived Peptides
  • Marine-Derived Peptides
  • Plant-Derived Peptides
  • Egg-Derived Peptides
  • Collagen-Derived Peptides
  • Microbial and Fermentation-Derived Peptides

By End-Use Industry

  • Sports and Active Nutrition
  • Clinical and Medical Nutrition
  • Functional Food and Beverage
  • Nutricosmetics and Personal Care
  • Animal Nutrition and Feed

By Application Format

  • Powder and Concentrate Ingredients
  • Ready-to-Mix Formulated Blends
  • Encapsulated and Tablet-Ready Fractions
  • Private-Label Contract Formulation

By Region

  • North America
  • Western Europe
  • East Asia
  • South Asia and Pacific
  • Latin America
  • Middle East and Africa
  • Eastern Europe

Scope, Methodology, and Coverage

Every figure in this report is reproducible from documented input assumptions. The scope below maps the historical period, the forecast horizon, the segmentation dimensions, and the countries covered, alongside the underlying primary and qualitative methodology.
Historical Period
2020 to 2025
Forecast Period
2026 to 2036
Base Year
2025 (USD billions; MMA Primary Research Dataset, August 2026)
Market Definition
The bioactive peptide market comprises protein-derived peptide fractions isolated or enzymatically produced for a documented physiological effect, valued at the point of sale as functional ingredients into food, beverage, dietary supplement, clinical nutrition, and topical cosmeceutical formulations. It excludes bulk protein isolates and hydrolysates sold without a substantiated bioactive claim, whole-protein commodity ingredients, amino acid commodity trade, and pharmaceutical peptide drugs requiring therapeutic regulatory approval.
Quantitative Units
USD billions (current prices); ingredient volume in metric tonnes where applicable
Segmentation Dimensions
By Peptide Source; By End-Use Industry; By Application Format; By Region
Regions Covered
North America, Western Europe, East Asia, South Asia and Pacific, Latin America, Middle East and Africa, Eastern Europe
Countries Covered
USA, China, Germany, France, UK, Japan, South Korea, India, Australia, Canada, Brazil, Mexico, Indonesia, Vietnam, Thailand, Malaysia, UAE, Saudi Arabia, South Africa, Nigeria, Turkey, Poland, Netherlands, Italy, Spain, Sweden, Switzerland, Argentina, Colombia, Singapore, and additional markets relevant to this sector
Key Companies Profiled
Arla Foods Ingredients, DSM-Firmenich, Novonesis, FrieslandCampina DMV, Glanbia Nutritionals, Kerry Group, Ingredion, Roquette, Fonterra, Tate & Lyle, AMCO Proteins, Gelita, Rousselot, Sonac, PB Leiner, CJ CheilJedang, Ajinomoto, Nitta Gelatin, Bioseutica, Symrise
Quantitative Methodology
Primary survey, n=3,800 respondents, Q4 2025, six countries; demand-side model with trade association cross-validation
Qualitative Methodology
47 expert interviews, Q4 2025; applied to validate demand model assumptions, identify emerging dynamics, and assess competitive positioning
Report Format
PDF and XLSX data workbook (Word format preview document)
Publisher
Market Minds Advisory
Report Code
MMA-2026-AGR-101
Published
August 2026
Contact
sales@marketmindsadvisory.com | www.marketmindsadvisory.com

Purchase the full Bioactive Peptide Market Report (2026 to 2036).

The full MMA Bioactive Peptide report sizes the market across six peptide sources, five end-use industries, four application formats, and seven regions through 2036. It profiles 20 participants on a consistent basis of attributable peptide ingredient revenue, scoring each on clinical dossier depth, feedstock sourcing diversity, and formulation partnership capability. Scenario models quantify how health claim approval pace, byproduct valorization economics, and nutricosmetic demand growth move both volume and achievable price. The report also includes a claim-substantiation pipeline screen by jurisdiction, feedstock cost exposure modelling by sourcing region, and a licensing versus in-house dossier decision framework for procurement, R&D, and brand strategy teams.
Six-source and four-format market sizing to 2036
Twenty-participant benchmark on attributable peptide revenue
Claim-substantiation pipeline screen by regulatory jurisdiction
Feedstock cost exposure modelling by sourcing region
Byproduct valorization economics versus purpose-grown protein
Licensing versus in-house dossier decision framework

Built For The People Who Decide

From boardroom strategy to bench-side execution, this report is read cover-to-cover by leaders shaping the next decade of their industry, turning demand scenarios, market dynamics and valuation benchmarks into decisions.
CXOs/ Presidents/ VPs/ Managers
M&A and Corporate Development
Strategy Teams and R&D Heads
Procurement and Product Directors
Regulatory and Compliance Leaders
Investor Relations and Equity Analysts