Market Minds Advisory
Bioactive Ingredient Market

Bioactive Ingredient Market: Functional Nutrition and Precision Formulation Through 2036

Fermentation-derived actives, clinically dosed botanicals and peptide fractions are displacing generic vitamin blends as brand owners chase clean-label claims, personalised dosing formats and traceable supply chains across functional food, beverage and supplement categories worldwide.

Lead Analyst

Lisa Gevelber

Published

September 2026

Make Smarter Decisions with Customized Research Insights

Request a free sample report and evaluate market opportunities, growth trends, and competitive dynamics relevant to your business needs.

2025 MARKET VALUE$18.6BMarket Size 2025
2036 FORECAST VALUE$41.6BBase Case , 2026 to 2036
CAGR 2026 TO 20367.6 %Bull 8.8% / Bear 6.4%
INCREMENTAL OPPORTUNITY$21.6BNet 10- year value creation
EXPANSION MULTIPLE2.08x2036 value over 2026 base
Strategic Levers
M&A Pipeline
Regional Outlook
Country Rankings
Competitive Intelligence
Segmental Deep-dive
Call-Us : 91 93563 13602

Executive Snapshot and Market Trajectory

Formulators are shifting procurement away from synthetic vitamin blends toward fermentation-derived and botanical actives carrying documented clinical dosing, reshaping how brand owners source, verify and defend ingredient claims in front of increasingly skeptical retail buyers, third-party auditors and regulators across every major consumption market worldwide, from grocery to specialty pharmacy.
Functional beverage and medical nutrition brands now drive the fastest incremental purchasing growth in the category, concentrated among contract manufacturers across China, India and the United States that supply multinational supplement and food companies seeking traceable, allergen-declared actives at commercial scale, with progressively shorter reformulation cycles, tighter documentation turnaround demands from major retail partners, distributors and private-label programme managers, and rising audit frequency tied to clean-label enforcement across export markets.
Consolidation among fermentation specialists and flavor houses is narrowing the supplier base even as regulatory scrutiny over health claims tightens noticeably across the European Union and United States, pushing smaller independent ingredient houses toward licensing arrangements or outright acquisition by diversified nutrition conglomerates that already hold the clinical and regulatory dossiers a new entrant would otherwise need years and considerable capital to assemble from scratch.
Market Definition
The bioactive ingredient market covers fermentation-derived, marine, botanical and peptide-based actives sold as functional inputs into food, beverage, supplement and medical nutrition formulations. It excludes finished supplement products, pharmaceutical actives requiring drug approval, and bulk commodity vitamins sold without functional dosing claims.
Base Year Value
$18.6B in 2025 (MMA Primary Research Dataset, August 2026)
Forecast Period
2026 to 2036, eleven discrete annual values
CAGR
7.6% base case. Bull 8.8%. Bear 6.4%.
Fastest Growth Segment
Plant Polyphenols and Botanical Extracts: 9.2% CAGR
Fastest Growth Country
China: 9.4% CAGR
Fastest Growth Region
South Asia and Pacific: 9.6% CAGR
Largest Region
East Asia: 27% of 2025 global value
Market Leaders
DSM-Firmenich, Kerry Group, ADM, Ingredion, Novonesis. Source: MMA Analysis based on company annual reports.
Primary Survey
n=3,800 procurement and R&D decision-makers, Q4 2025, six countries
Methodology
Demand-side build-up, cross-validated against public data, 47 expert interviews

Bioactive Ingredient Market Forecast Scenarios

bioactive-ingredient-market-trends-growth-size-forecast-scenario-1787461900819
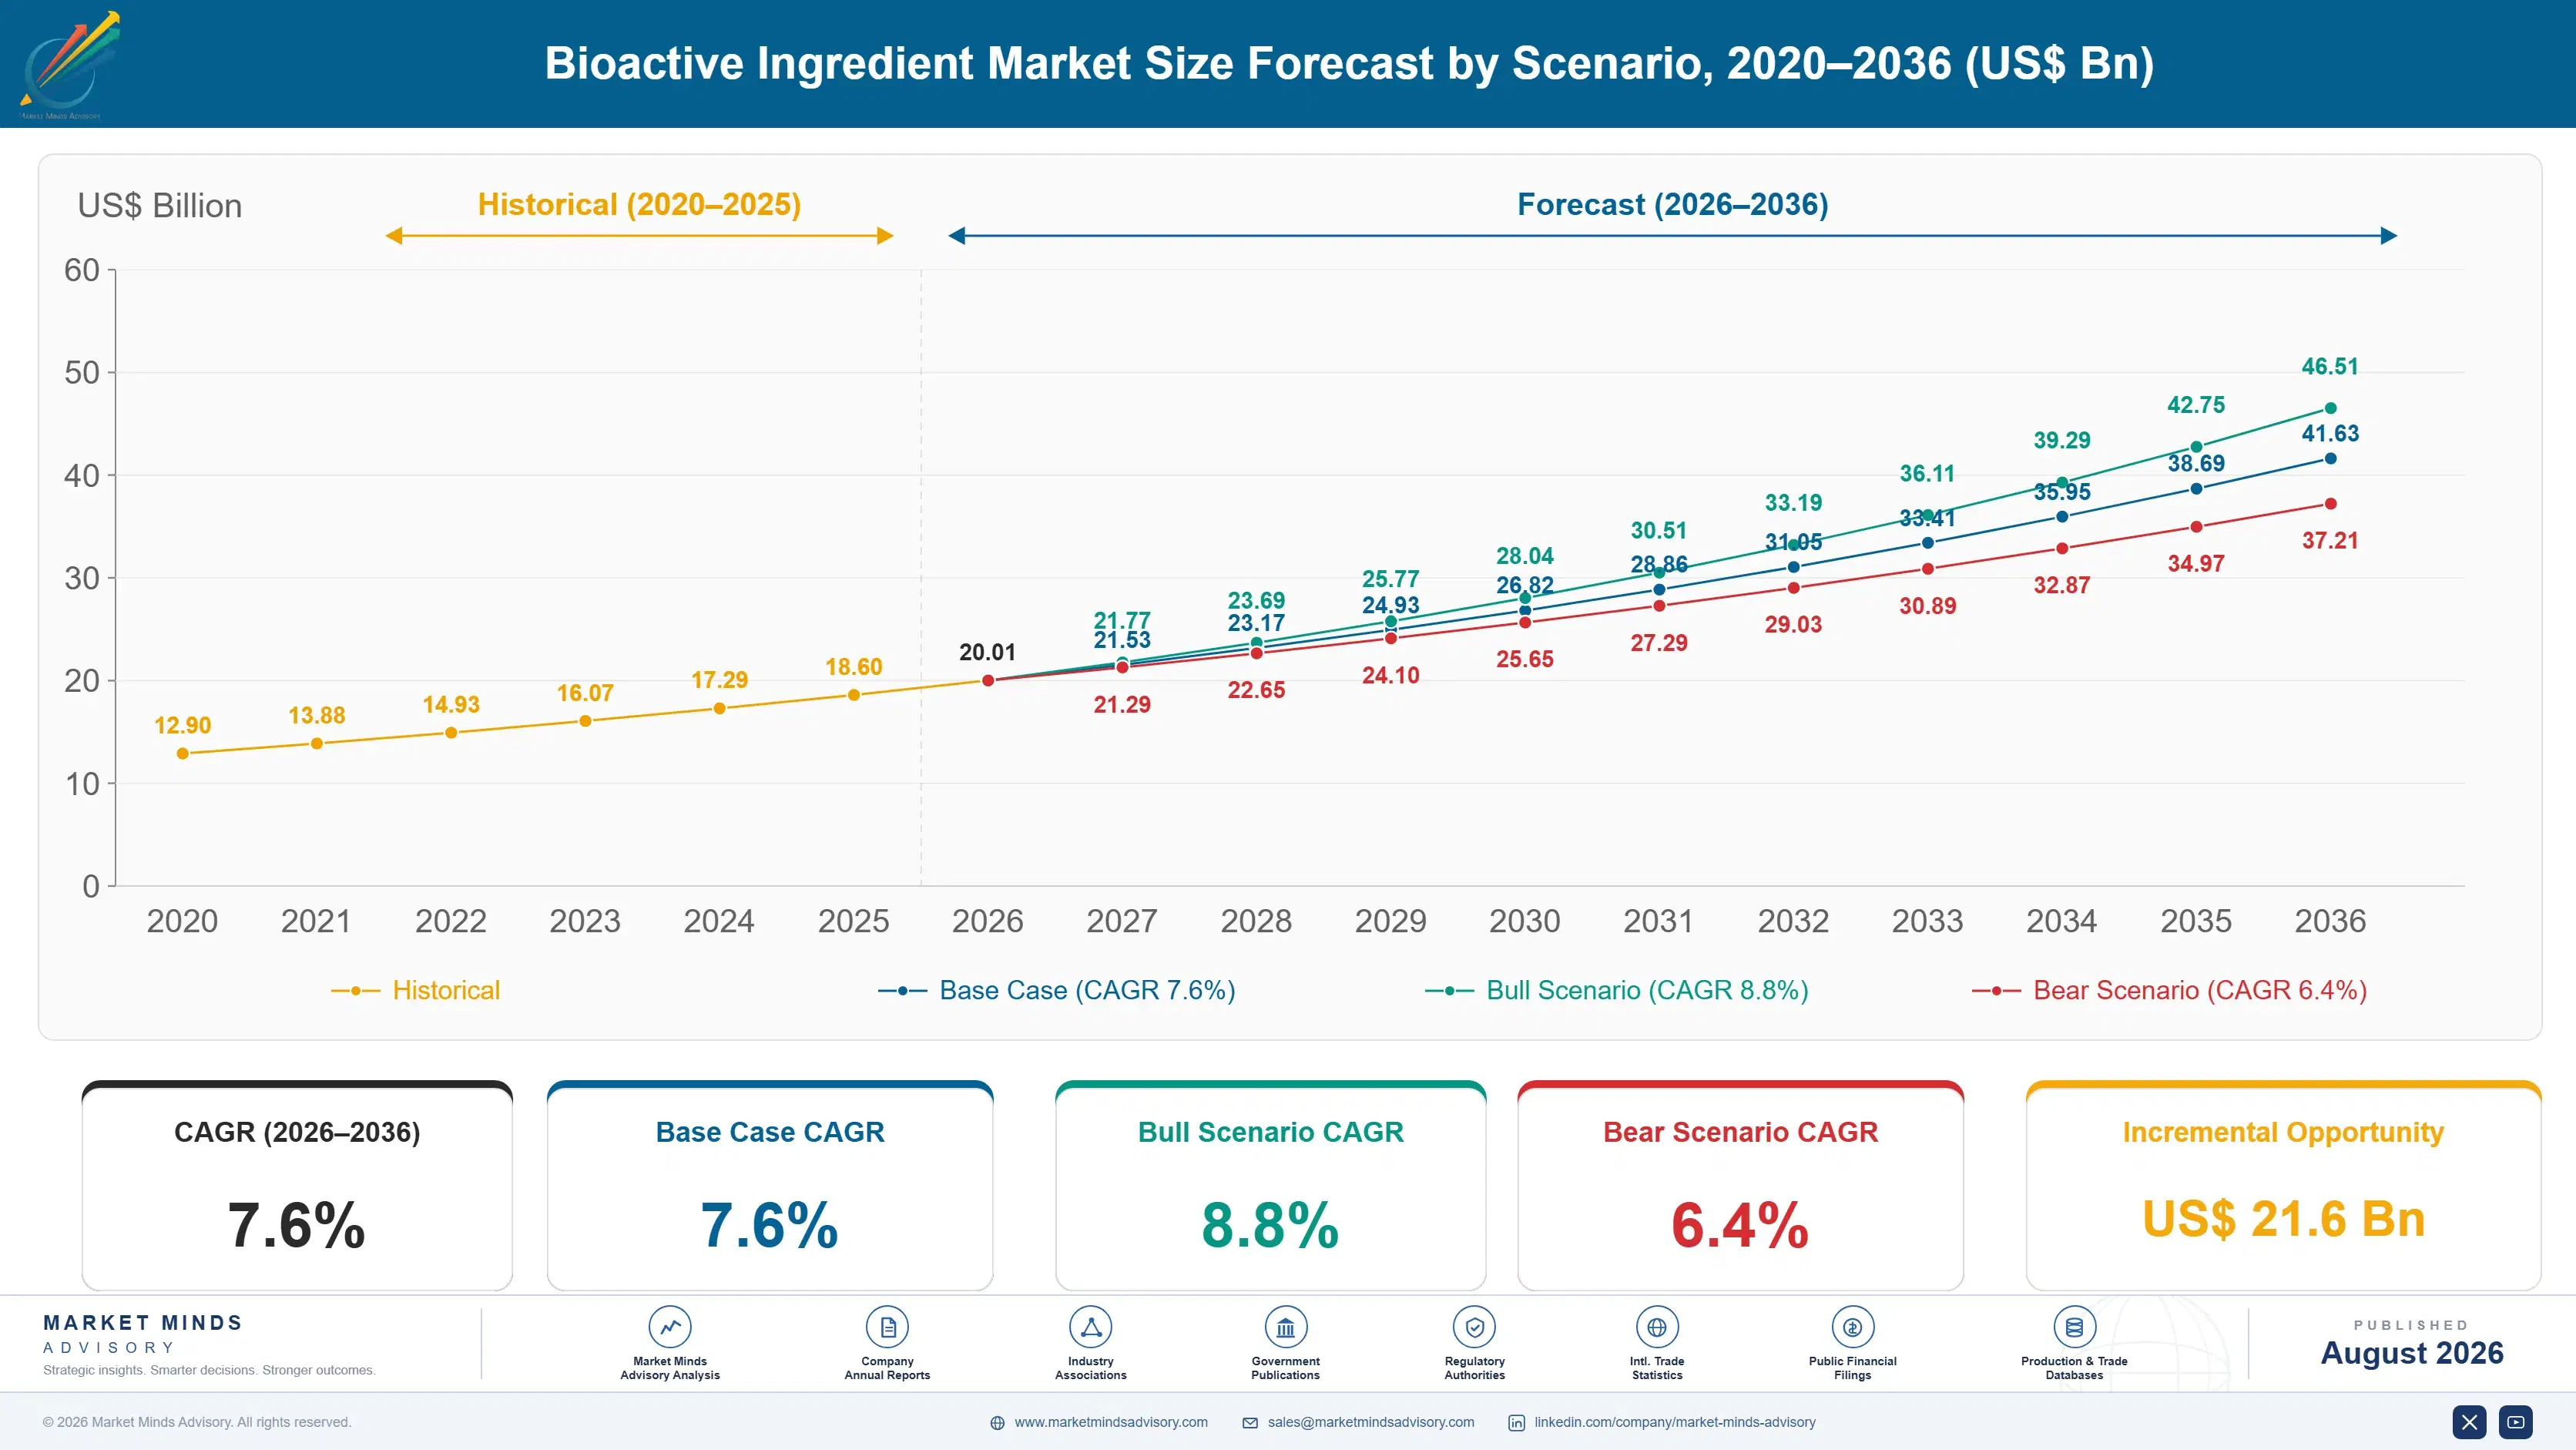
Between 2020 and 2025 the category grew steadily as pandemic-era immunity demand gave way to a broader wellness shift, with fermentation capacity additions across Asia gradually easing the supply constraints that had kept probiotic and postbiotic actives on allocation through much of 2021 and 2022, before pricing normalised into 2024 and 2025 as new capacity came fully online across contract manufacturing hubs.
The base case assumes continued double-digit growth in personalised nutrition formats, expanding clinical substantiation budgets among the top ten ingredient houses, and retailer-driven clean-label reformulation mandates that favor traceable botanical and fermentation-derived actives over synthetic alternatives across mainstream grocery, pharmacy and e-commerce nutrition channels, reinforced by contract manufacturers scaling capacity ahead of confirmed demand and by brand owners locking in multi-year supply agreements with preferred fermentation partners through the forecast decade.
A bull scenario hinges on accelerated GLP-1 adjacent muscle-preservation peptide adoption pulling forward demand well ahead of current projections and drawing new capital into peptide fermentation capacity; the bear case centers on tightening European Union health-claim enforcement raising compliance costs and slowing new product launches across smaller regional brands that lack dedicated regulatory affairs teams.

Formulation Complexity and the Shift to Verified Actives

Demand is converging around three forces at once: retailer clean-label mandates that now extend into private-label tiers and mid-market grocery chains, expanding clinical substantiation budgets among the largest brand owners racing to defend health claims against regulatory challenge, and fermentation capacity that finally caught up with post-pandemic wellness demand after several years of bottlenecked global supply and outright allocation among the largest buyers.
AVERAGE SELLING PRICE$42/kgblended price across major functional ingredient classes sold
TOP PRODUCER SHAREChina 31%share of global fermentation and extraction capacity held
CAPACITY UTILISATION76%average utilisation rate across contract fermentation facilities globally
TRADE INTENSITY58%share of finished output crossing a border before formulation
COGS FEEDSTOCK SHARE47%feedstock cost proportion within total finished ingredient cost
CR5 CONCENTRATION34%combined revenue share held by the five largest suppliers
Commercially, the category increasingly behaves less like a commodity ingredient trade and more like a specialty chemical business, with long customer qualification cycles that can run eighteen months from first sample to purchase order, documented batch-level traceability demanded by every major retailer and auditor, and price premiums tied directly to clinical dosing evidence and third-party certification rather than raw material cost alone.
Over the next decade, precision fermentation and AI-assisted microbial strain development will keep compressing production cost curves while clinical substantiation requirements keep rising in parallel, squeezing out suppliers that lack dedicated research budgets, in-house regulatory affairs capability, or the balance sheet needed to fund multi-year clinical trials against an increasingly crowded and shrinking pool of defensible health claims across major consumption markets.
"The suppliers winning share aren't the cheapest, they're the ones who can hand a retailer a clinical dossier before the retailer even asks for one."
Director, Nutrition and Functional Ingredients Practice · MMA Agriculture Practice · August 2026

Market Trends

Postbiotic and Fermentate Claims Replace Live-Culture Labeling

Brand owners are pivoting toward postbiotic and fermentate ingredients that carry heat-stable, shelf-stable claims instead of live-culture counts that degrade during distribution and long-haul shipping. Retailers including major United States grocery chains now request postbiotic dosing certificates alongside standard specification sheets before granting shelf placement to new functional products. The shift lets brands stabilise formulations across longer supply chains without cold-chain investment, and it is pulling roughly 400 million dollars of reformulation spend into postbiotic-capable suppliers over the next three years as legacy live-culture lines get phased out of ambient-shelf products across grocery and mass retail.
Market Impact: Opens 11 new approved actives

Peptide Fractionation Capacity Expands for Muscle Health Claims

Muscle-preservation and satiety peptide demand tied to GLP-1 adjacent nutrition is pulling new capital into fractionation and enzymatic hydrolysis capacity across Denmark, the United States and South Korea, where existing dairy and marine protein infrastructure can be repurposed relatively quickly. Three announced facility expansions in 2025 add a combined 12,000 tonnes of annual peptide fractionation capacity, aimed squarely at sports nutrition and medical nutrition brands formulating around lean-mass preservation claims. Suppliers without existing fractionation lines are now several years behind on qualifying new capacity with major buyers already locked into multi-year offtake agreements.
Market Impact: Private label listings grow 18%

Market Opportunities and Growth Drivers

EU Novel Food Approvals Widen Addressable Botanical Pipeline

European Commission Novel Food authorisations approved eleven new botanical and fermentation-derived actives between 2023 and 2025, up from four in the prior three-year window, opening formulation pathways that were previously blocked pending safety dossiers and toxicology review. Each approval typically opens the door to between twenty and forty downstream product launches within eighteen months as brand owners move quickly to claim first-mover shelf space ahead of competitors. Ingredient houses that pre-invested in dossier preparation ahead of approval are now capturing disproportionate early licensing revenue from smaller formulators unable to fund their own regulatory submissions.
Market Impact: Costs up to 3 million dollars

Retailer Private Label Programs Mandate Traceable Sourcing

Large United States and European grocery retailers have expanded private-label functional nutrition lines by roughly 18 percent annually since 2023, and each new listing now requires full batch traceability back to the originating fermentation tank or extraction lot rather than a generic certificate of analysis. This is pushing procurement toward suppliers who already run blockchain or serialized batch tracking systems. Mid-tier ingredient houses without digital traceability infrastructure are losing private-label bids even when their pricing is competitive, accelerating consolidation toward suppliers with existing digital systems and dedicated retailer-facing quality teams.
Market Impact: Feedstock prices swing 30 percent

Market Restraints and Challenges

Health Claim Substantiation Costs Squeeze Smaller Formulators

Generating a defensible clinical dossier for a single health claim now costs between 1.5 and 3 million dollars and takes eighteen to thirty months, a burden that falls disproportionately on regional ingredient houses without dedicated clinical affairs staff or existing trial relationships. The root cause is regulatory tightening on both sides of the Atlantic that has raised the evidentiary bar well beyond the observational studies once considered acceptable for a marketing claim. Many smaller suppliers are responding by pooling clinical trial costs through industry consortia or licensing already-substantiated actives from larger houses rather than running independent trials of their own.
Market Impact: Adds 400 million dollars reformulation spend

Feedstock Price Volatility Disrupts Fermentation Margins

Sugar and dextrose feedstock prices, which anchor most microbial fermentation processes, swung by more than 30 percent between 2023 and 2025 on weather-driven crop variability, compressing margins for suppliers who had not locked in multi-year feedstock contracts ahead of the volatility. The underlying cause is fermentation's continued dependence on agricultural commodity inputs rather than synthetic feedstock alternatives that trade on more stable pricing. Leading suppliers are mitigating exposure through longer forward contracts and early-stage investment in alternative carbon feedstocks such as cellulosic sugars, though commercial scale for those alternatives remains several years out.
Market Impact: Adds 12,000 tonnes fractionation capacity
3 additional market trends, 4 additional growth drivers, and 3 additional restraints and challenges are covered in the full report. Contact sales@marketmindsadvisory.com to access the complete intelligence.

Segment CAGR and Growth Architecture

Segmentation follows ingredient technology and functional class rather than end-use application, since sourcing economics, regulatory pathway and production infrastructure differ fundamentally across fermentation, marine, botanical and peptide-derived active categories. This single classification logic keeps upstream production technology separate from downstream formulation choices, avoiding overlap between how an active is made and where it ultimately gets used.
bioactive-ingredient-market-trends-growth-market-share-analysis-1787461901353

Plant Polyphenols and Botanical Extracts

Polyphenol and botanical extract demand is accelerating as brand owners seek plant-based alternatives to synthetic antioxidants and as Novel Food approvals widen the pool of usable botanicals across the European Union. Extraction technology has matured enough that standardized, clinically dosed extracts now carry consistent potency across batches, addressing a long-standing formulation complaint from brand chemists working across multiple product lines. China and India supply the majority of raw botanical feedstock, while extraction and standardisation increasingly happen closer to end markets in the United States and Western Europe to shorten qualification cycles and reduce documentation lag. Premiumisation around organic and regeneratively farmed botanical inputs is adding a further pricing tier above conventional extract grades sold into mainstream formulations.
CAGR 9.2%

Peptides and Bioactive Proteins

Bioactive peptide demand is being pulled forward by muscle-preservation and satiety formulations linked to broader metabolic health trends, with sports nutrition and medical nutrition brands both competing for the same limited fractionation capacity. Marine and dairy-derived peptide fractions carry the strongest clinical substantiation currently available, giving early movers a durable claims advantage over newer plant-protein peptide entrants still building trial data of their own. Capacity remains concentrated among a handful of specialized fractionation facilities in Europe, the United States and South Korea, creating qualification bottlenecks for brand owners trying to secure supply, and contract manufacturers are now requiring multi-year offtake commitments before allocating new capacity to unproven formulators entering the category.
CAGR 8.9%
Full segment breakdown across 6 segments available in the complete report.

Regional Architecture and Country Demand Map

Production and formulation activity concentrate in East Asia and North America, while Western Europe anchors regulatory-grade clinical substantiation other regions lean on. South Asia and Pacific consumption is rising fastest as middle-income diets shift toward packaged functional nutrition, with China holding the single largest share of global fermentation capacity.

North America

North America leads global consumption on the strength of an entrenched dietary supplement retail channel and a fast-growing medical nutrition segment tied to metabolic health and GLP-1 adjacent muscle-preservation products. United States brand owners run the most demanding clinical substantiation requirements of any market, pushing suppliers to maintain dedicated regulatory affairs teams serving this region specifically and to fund trials most competitors would defer. Canada contributes a smaller but steadily growing natural health products channel with its own distinct labeling regime and faster novel ingredient review timelines. Contract manufacturing capacity within the region has expanded to reduce dependence on Asian fermentation imports for time-sensitive postbiotic and peptide formulations, particularly among sports nutrition brands requiring rapid reformulation turnaround.
Share: 26% | CAGR: 8.8% (2026 to 2036)

Western Europe

Western Europe anchors global clinical substantiation and regulatory dossier development even though its manufacturing base is smaller than East Asia's, with Germany, France and the Netherlands hosting the concentrated cluster of contract research organizations that ingredient houses worldwide rely on for trial design and peer-reviewed publication support before launch. The European Union's Novel Food framework, while slow, produces the most defensible approvals globally, and ingredients cleared there frequently become the reference standard other regulators use when evaluating comparable submissions from elsewhere. Nordic fermentation specialists supply a disproportionate share of premium postbiotic and peptide actives, trading on reputation for documentation quality over raw price competitiveness against Asian producers competing mainly on cost.
Share: 21% | CAGR: 6.1% (2026 to 2036)
Regional intelligence for 5 additional markets available in the complete report: East Asia, South Asia and Pacific, Latin America, Middle East and Africa, Eastern Europe. Contact sales@marketmindsadvisory.com.
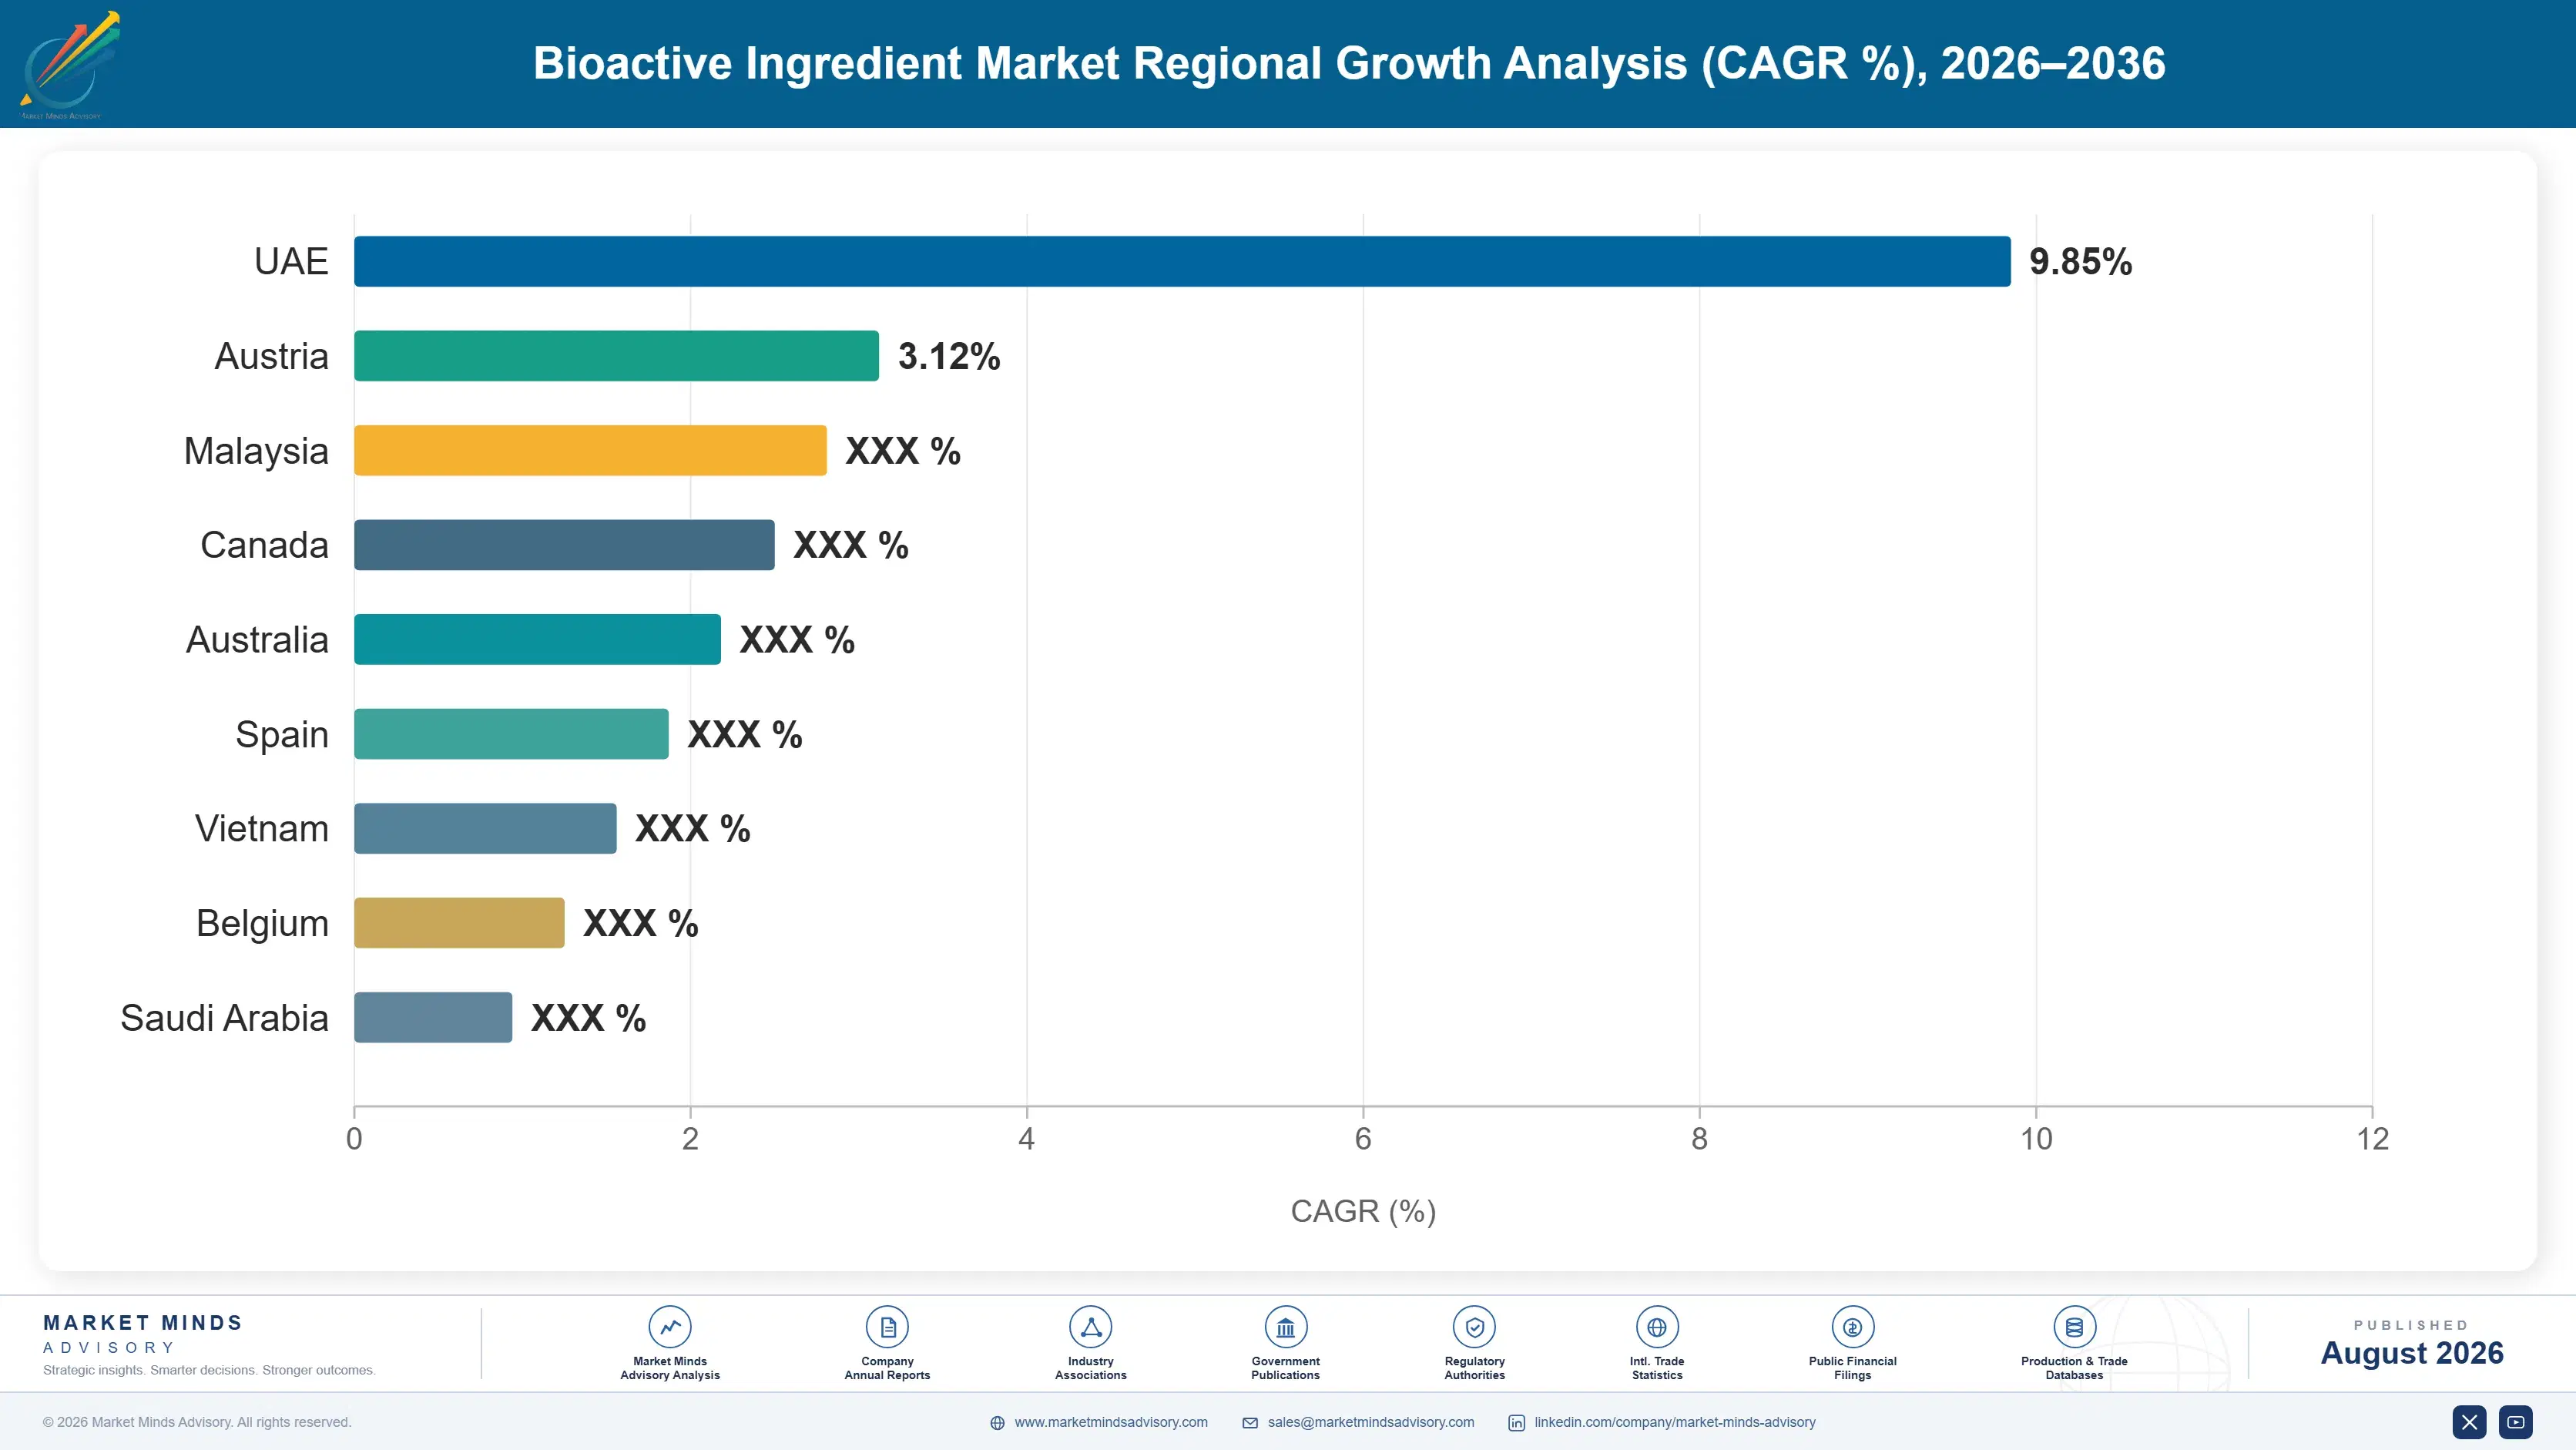
bioactive-ingredient-market-trends-growth-country-cagr-analysis-1787461901877

Where Ingredient Houses Can Defend Margin

Margin defense in bioactive ingredients increasingly depends on owning clinical evidence, digital traceability and formulation services rather than competing purely on fermentation or extraction cost, since buyers now pay premiums for documentation as much as for the active itself, and that shift clearly rewards suppliers who invested early in dossier libraries and traceability infrastructure.

Bundle Clinical Dossiers With Ingredient Supply

Suppliers that package a completed clinical substantiation dossier alongside the physical ingredient are commanding price premiums of 15 to 25 percent over suppliers selling the same active without documentation. Brand owners increasingly treat dossier cost as a line item they would rather outsource than fund internally, particularly smaller formulators lacking regulatory affairs staff of their own. Ingredient houses that built dossier libraries early are now licensing the same clinical package across dozens of customers, turning a sunk research cost into a recurring high-margin revenue stream that scales far better than raw ingredient sales alone across multiple product categories.
Market Impact: Adds a 15 to 25 percent price premium

Offer Serialized Batch Traceability as a Service

Retailers now require batch-level traceability back to fermentation tank or extraction lot before granting shelf placement, and suppliers who built serialized tracking systems ahead of the mandate are charging a traceability service fee layered on top of ingredient pricing, typically 2 to 4 percent of contract value. This converts a compliance cost into a differentiated revenue line, since mid-tier competitors without existing digital infrastructure cannot easily replicate it within a single procurement cycle or budget year. Several leading suppliers now report traceability services growing faster than core ingredient volume across their retail accounts.
Market Impact: Adds a 2 to 4 percent service fee

Move Fractionation Capacity Closer to End Markets

Locating peptide fractionation and enzymatic hydrolysis capacity closer to North American and European brand owners cuts lead times from 12 weeks to under 4, letting suppliers charge a responsiveness premium for rapid reformulation support during product launches and seasonal demand spikes. This regionalisation strategy has already pulled roughly 12,000 tonnes of new fractionation capacity into Denmark and the United States since 2024. Suppliers still relying solely on Asian fractionation capacity are losing time-sensitive sports nutrition contracts to regionally positioned competitors able to turn samples around within days rather than weeks.
Market Impact: Cuts fractionation lead times from 12 to 4 weeks

License Proprietary Strains to Regional Manufacturers

Rather than exporting finished actives, several fermentation specialists are now licensing proprietary microbial strains and production know-how to regional contract manufacturers in India and Latin America, collecting royalty income of roughly 8 to 12 percent of resulting sales without carrying the capital cost of building new fermentation capacity themselves in each market. This model lets a strain developer capture growth in fast-expanding regional markets while avoiding tariff exposure and long shipping lead times on finished goods. Licensing revenue at several major houses has grown to represent a meaningful share of total ingredient segment profit.
Market Impact: Earns roughly 8 to 12 percent royalty income

Who Controls the Margin Pool

Concentration remains moderate on a revenue basis, with the top five suppliers holding a combined 34 percent of revenue across the category, leaving room for challengers with strong clinical dossiers to take share from diversified conglomerates spread thin across many ingredient lines. The gap between the largest supplier and the fifth-ranked challenger is narrower than in most specialty chemical categories, reflecting how recently clinical substantiation became the primary competitive weapon.
Current competitive activity centers on three fronts: dossier acquisition through licensing deals with smaller research-stage biotechs, fractionation capacity buildout across Europe and the United States to shorten lead times, and digital traceability rollouts aimed at winning private-label contracts ahead of documentation mandates taking effect across major grocery chains. Several suppliers have also begun bundling formulation support directly into ingredient contracts to deepen switching costs.

Emerging pressure comes from vertically integrated food conglomerates building in-house fermentation capability to reduce reliance on outside suppliers, a shift that could reshuffle rankings within five years if two or three brand owners succeed in internalising active production at meaningful scale. Smaller specialist suppliers focused on a single active class remain acquisition targets for exactly this reason, since buying proven technology is faster than building it.
bioactive-ingredient-market-trends-growth-company-positioning-matrix-1787461902399

Competitive Moat and Risk Dimensions

DSM-FIRMENICH

Moat: Merged Clinical Dossier Library

DSM-Firmenich holds the deepest clinical substantiation library in the category after merging two research-heavy nutrition portfolios in 2023, giving it dossiers covering dozens of actives that smaller competitors would need years and tens of millions of dollars to replicate independently, and it licenses portions of that library to smaller formulators for recurring fee income.
DSM-FIRMENICH

Risk: Post-Merger Talent Attrition

Integration friction from the 2023 merger has slowed product launch cadence noticeably, and several key research scientists have since departed for smaller, more nimble fermentation specialists offering faster decision-making and clearer equity upside, thinning the very research bench the merger was originally meant to strengthen.
KERRY GROUP

Moat: Bundled Distribution Network Access

Kerry Group's global taste and nutrition distribution network lets it bundle bioactive actives directly into flavor and functional systems already sold to thousands of food and beverage manufacturers worldwide, collapsing what would otherwise be a separate ingredient sales cycle into an existing customer relationship and account team.
KERRY GROUP

Risk: Diluted Research Focus

Kerry's breadth across many ingredient categories means bioactive actives receive less dedicated research investment than at focused specialists, risking share loss on the most technically demanding clinical claims over time as narrower, more focused competitors outspend Kerry on a per-active basis within their chosen niche.

Players Tracked

Prominent Players

DSM-Firmenich
Kerry Group
ADM
Ingredion
Novonesis

Other Key Players

Cargill
Tate & Lyle
BASF
Lonza
Givaudan
Symrise
Kemin Industries
Sensient Technologies
IFF
Glanbia
FMC Corporation
Nexira
AAK AB
Roquette
BENEO

Recent Developments

MARCH 2025

DSM-Firmenich Opens Postbiotic Fermentation Facility in Singapore

DSM-Firmenich commissioned a dedicated postbiotic fermentation facility in Singapore adding 3,500 tonnes of annual capacity aimed at serving Southeast Asian and broader export functional nutrition demand, marking its first major standalone postbiotic investment since the 2023 merger completed integration of prior legacy facilities and product lines.
Signal: Signals the newly merged company is prioritising heat-stable postbiotic formats over legacy live-culture production lines going forward.
SEPTEMBER 2024

Kerry Group Acquires Botanical Extraction Specialist in Brazil

Kerry Group acquired a Brazilian botanical extraction company specializing in adaptogen and antioxidant actives for an undisclosed sum, gaining direct access to South American biodiversity feedstock and an established regional regulatory approval track record that it had previously lacked entirely within the antioxidant extract category.
Signal: Signals Kerry is building direct feedstock access rather than continuing to rely solely on third-party botanical brokers.
JUNE 2025

Novonesis Signs Multi-Year Peptide Supply Agreement With Sports Brand

Novonesis signed a five-year peptide fractionation supply agreement with a major global sports nutrition brand, committing dedicated production capacity at its Danish facility in exchange for guaranteed minimum volume purchases each year, an arrangement neither party had previously disclosed publicly at this financial scale or duration.
Signal: Signals long-term offtake agreements are steadily replacing spot-market peptide fractionation purchasing patterns across this fast-growing category.

Feedstock and Fermentation Input Exposure

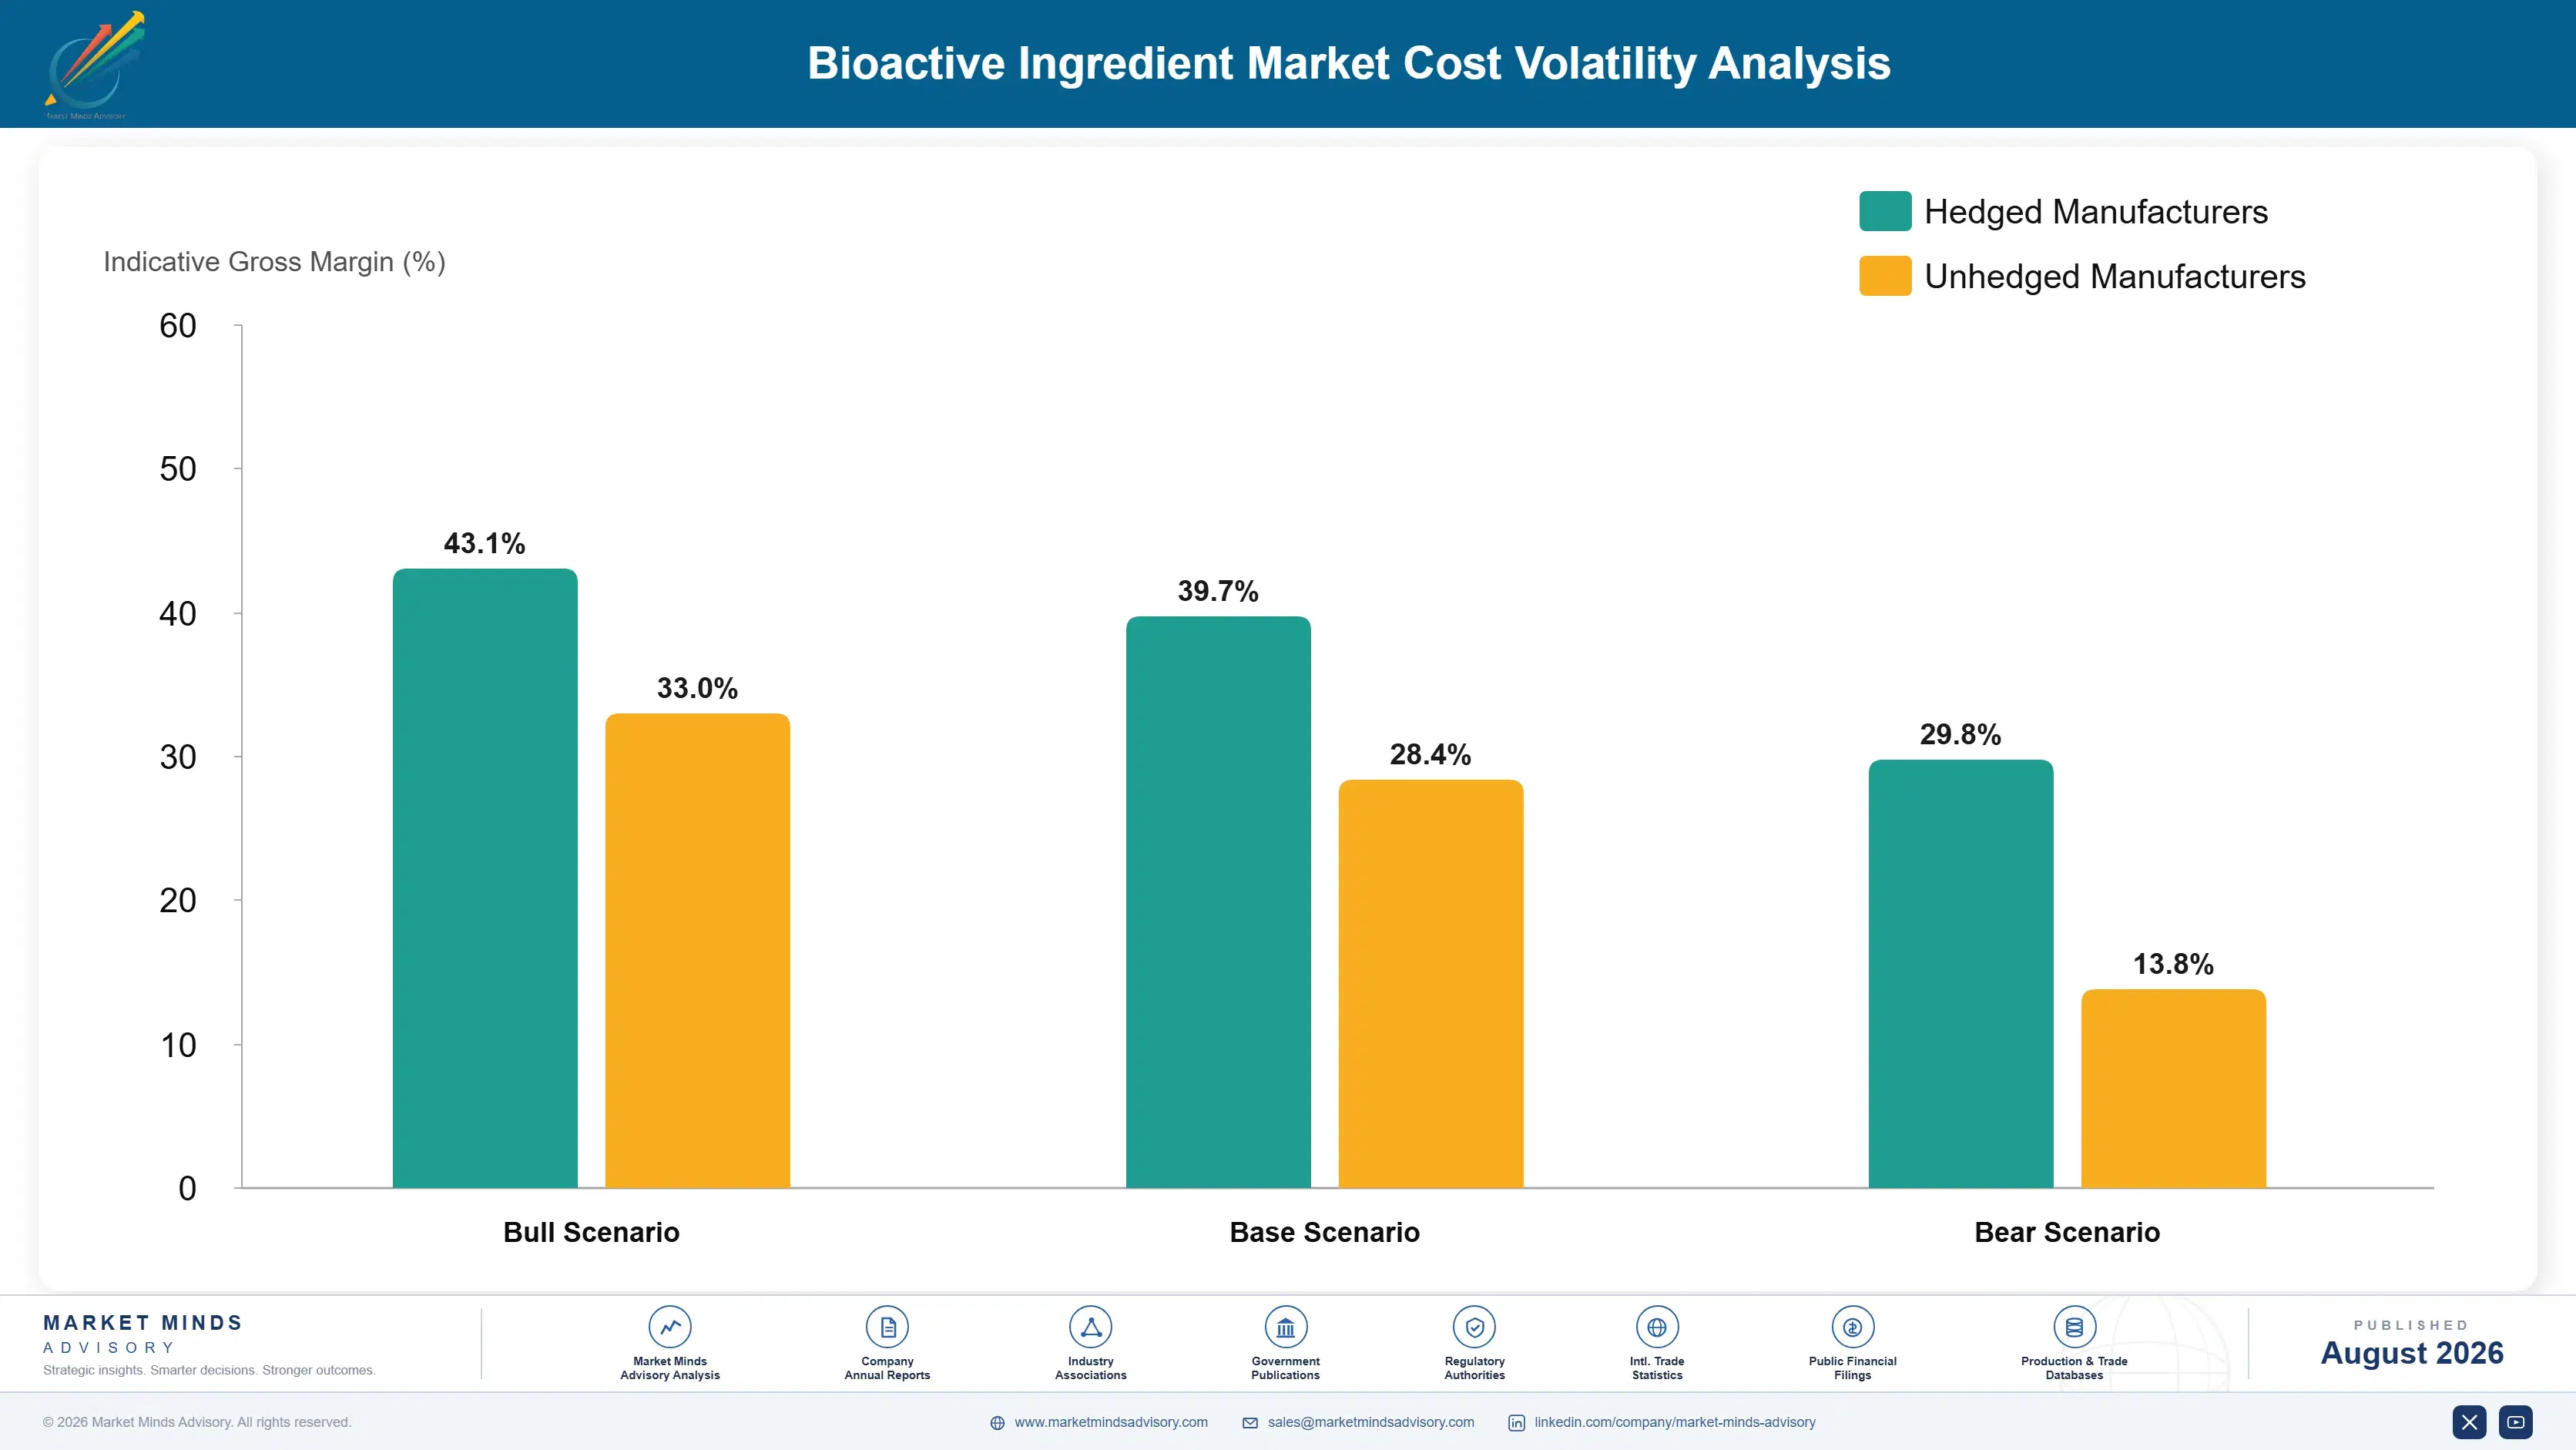
Fermentation feedstock, primarily sugar and dextrose, represents roughly 47 percent of finished ingredient cost of goods sold, sourced predominantly from Brazilian, Indian and Southeast Asian sugarcane and corn wet-mill operations that supply the majority of global fermentation capacity. Marine and botanical raw materials add a further meaningful share, with extraction yield and seasonal harvest timing driving additional cost variability across supplier regions.
Sugar prices swung more than 30 percent between 2023 and 2025 according to USDA sugar and sweeteners reporting, driven by Brazilian crop variability and shifting ethanol allocation decisions that pulled cane supply away from sugar production during periods of high domestic fuel demand, squeezing fermentation margins industry-wide during the affected quarters and forcing several mid-sized suppliers to pass costs through to brand-owner customers mid-contract, straining longstanding pricing relationships.

Suppliers without multi-year feedstock contracts, typically smaller regional houses, absorb volatility directly into margin, while the largest fermentation specialists hedge exposure through forward purchasing and geographically diversified sourcing across Brazil, India and Thailand simultaneously, giving them a durable cost advantage smaller, single-region competitors cannot easily replicate without comparable purchasing scale, balance sheet strength or hedging expertise.
bioactive-ingredient-market-trends-growth-cost-volatility-analysis-1787461902594

Multi-Year Forward Feedstock Purchasing Agreements

Leading suppliers are locking in two to three year sugar and dextrose purchase agreements at fixed or capped pricing directly with Brazilian and Indian mills, insulating margin from spot-market swings that hit smaller competitors hardest during 2023 and 2024. This requires meaningful working capital commitment upfront but has proven worth the cost for suppliers with sufficient balance sheet capacity.

Geographic Feedstock Source Diversification

Sourcing sugar and starch feedstock across Brazil, India and Thailand simultaneously reduces exposure to any single country's harvest failure, currency swing or export policy shift, a strategy the largest fermentation specialists have pursued aggressively since 2022 while smaller suppliers remain concentrated in just one region and correspondingly exposed to localized supply shocks and pricing spikes.

Alternative Carbon Feedstock Development Programs

Several suppliers are piloting cellulosic sugar and other non-food carbon feedstocks to reduce dependence on agricultural commodity swings entirely, though commercial-scale cost parity with conventional sugar feedstock remains several years away according to current pilot program economics, yield data and the available processing infrastructure across the small handful of facilities running active trials today.

Portfolio Architecture for Margin Defence

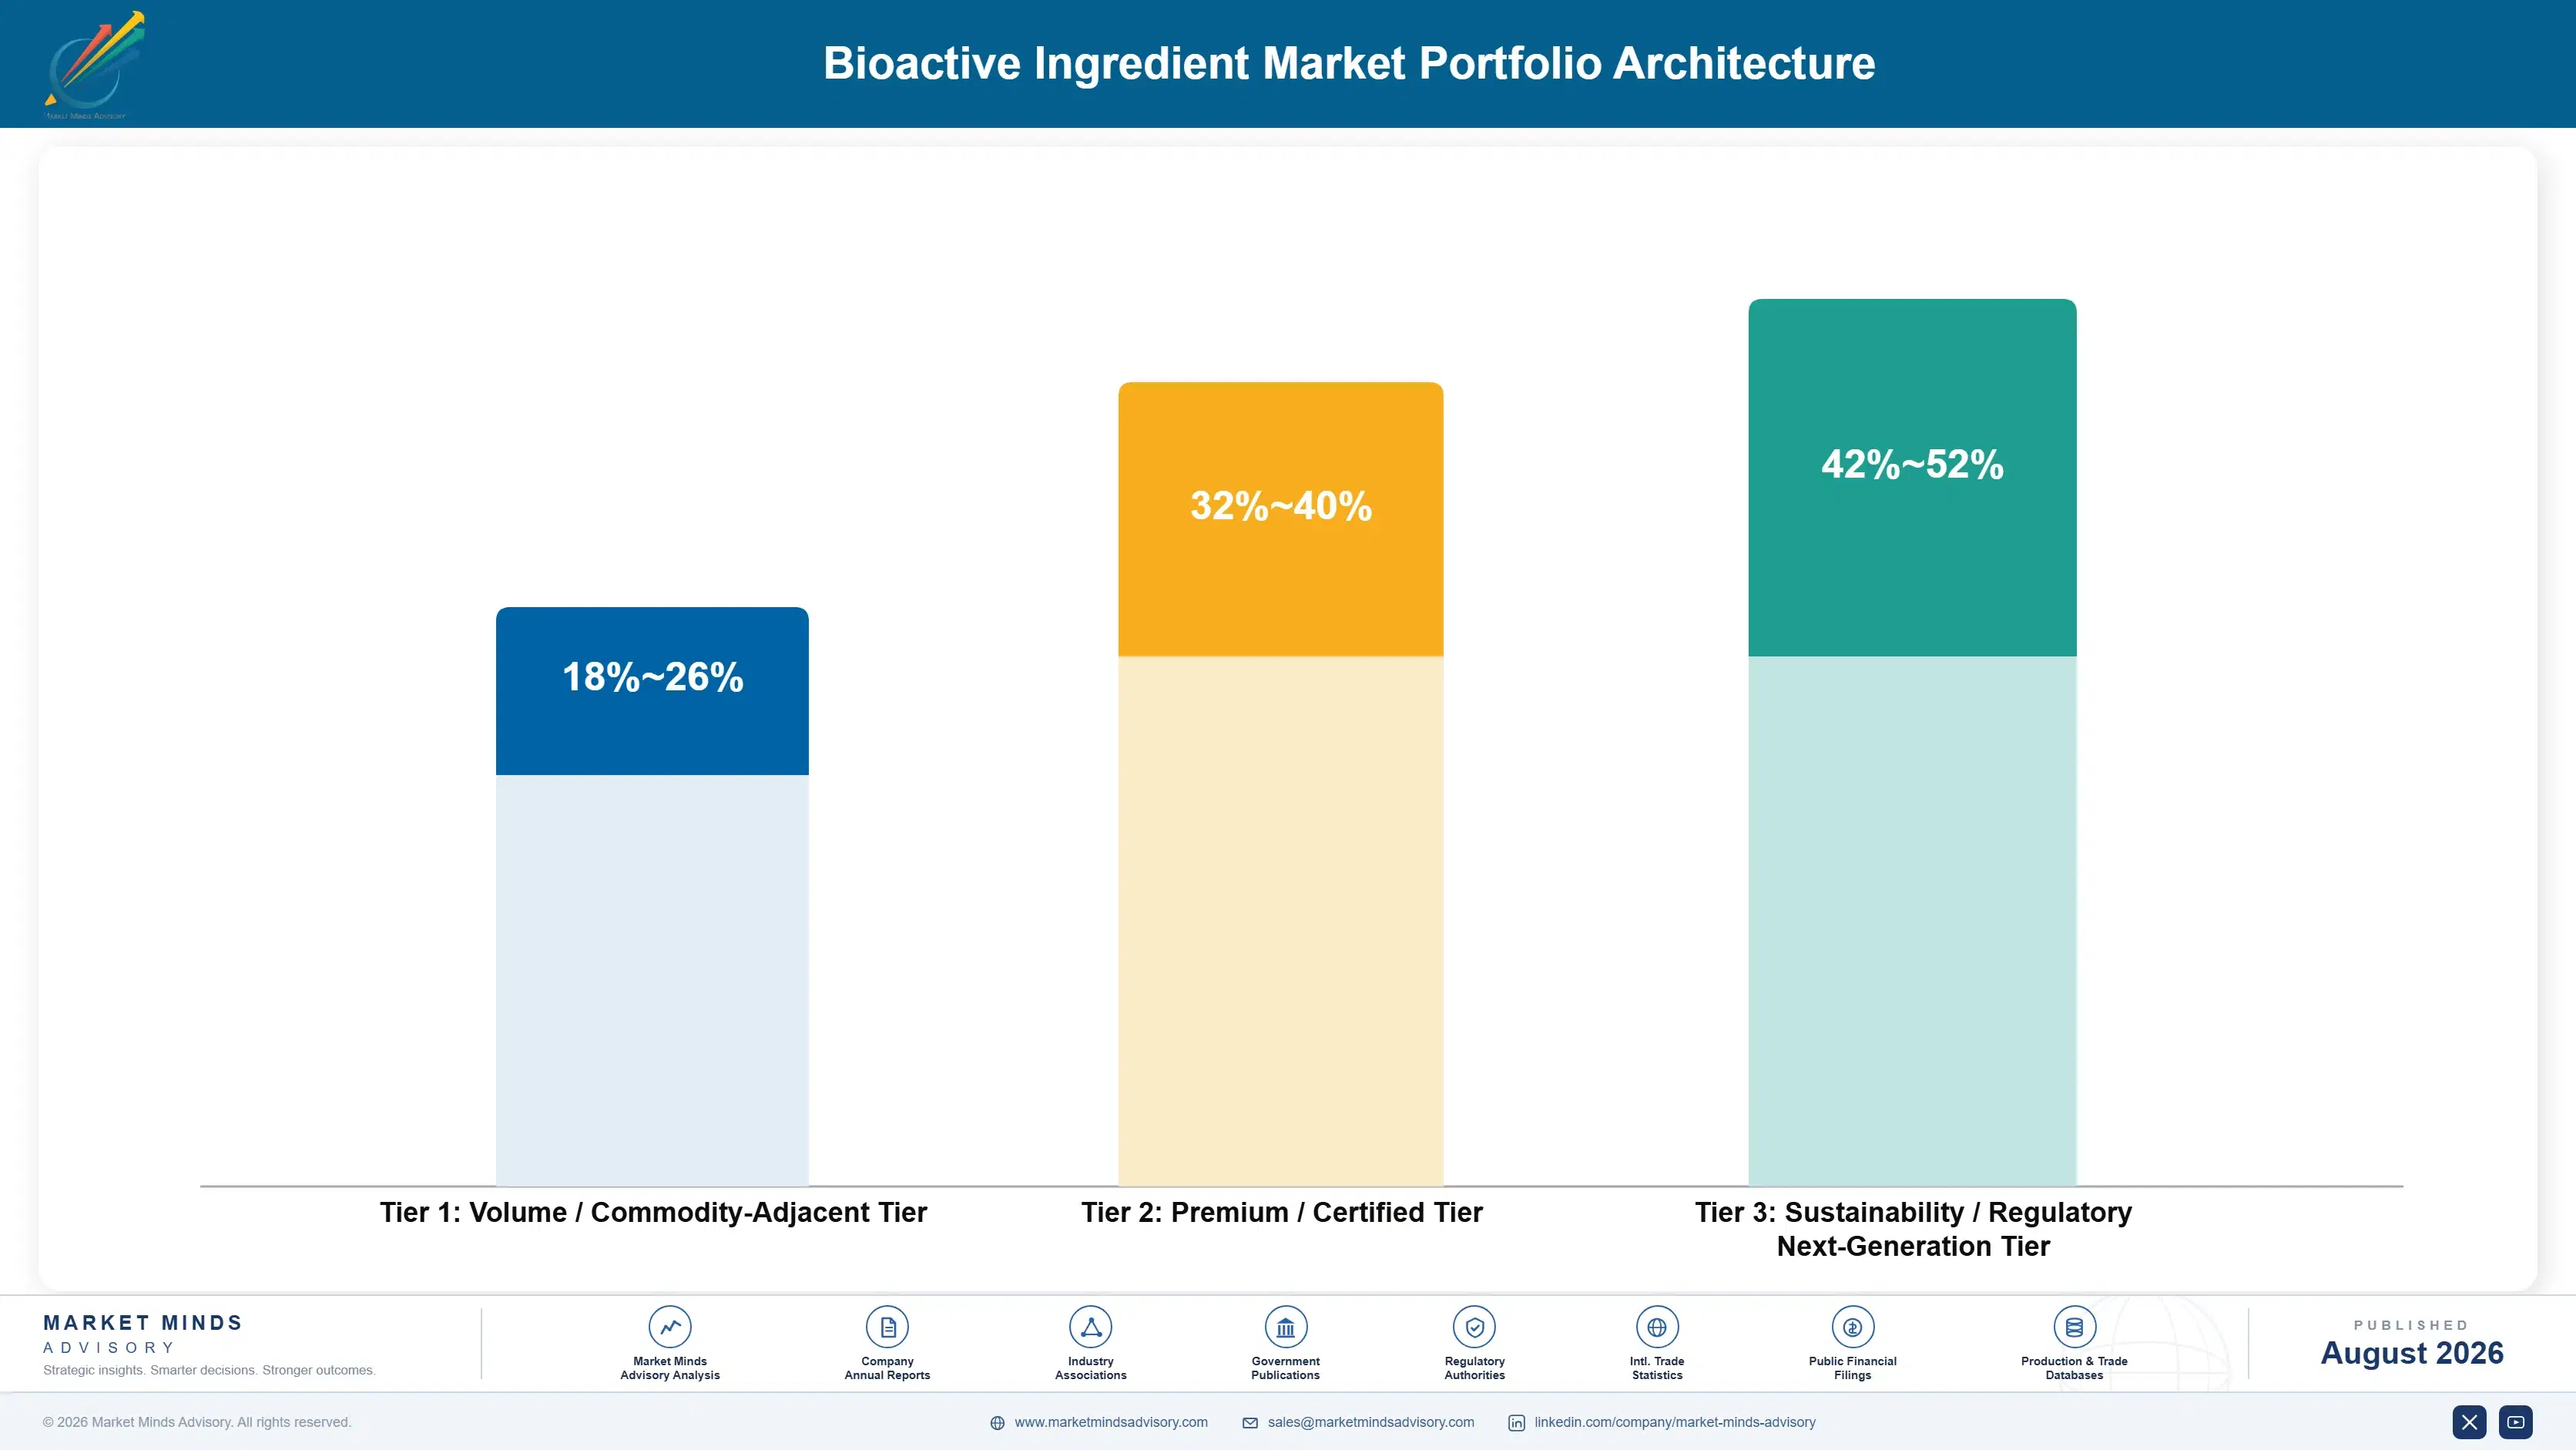
Portfolio economics split into three tiers with materially different gross margin profiles: commodity-adjacent vitamin and mineral blends compete almost entirely on price and delivery reliability, certified and clinically dosed actives command a meaningful premium tied directly to documentation quality, and next-generation fermentation-derived actives built on proprietary strains carry the highest margins in the category, reflecting genuine technical differentiation rather than simple branding or packaging.
The tension between volume and premium tiers is intensifying as retailers push private-label programs further into the certified tier, previously the near-exclusive territory of branded ingredient houses, compressing what had been a comfortable margin gap and forcing established suppliers to defend premium positioning through faster clinical substantiation, deeper formulation support and tighter retailer relationships rather than relying on brand reputation alone to hold shelf space.

High-value margin pools concentrate overwhelmingly in peptide fractions and proprietary fermentation strains carrying exclusive clinical data, where competitors cannot simply match formulation on cost alone without years of trial investment behind them, giving early movers a durable pricing advantage that persists even as commodity-tier margins continue to compress steadily under sustained retailer and private-label pricing pressure.

Volume / Commodity-Adjacent Tier

Generic vitamin, mineral and basic botanical blends sold largely on price and delivery reliability into mass-market supplement and fortified food applications, with minimal formulation differentiation between competing suppliers across the segment.
Gross Margin: 18-26%

Premium / Certified Tier

Clinically dosed, certified actives carrying documented substantiation and third-party quality marks, sold into premium supplement, functional beverage and medical nutrition brands willing to pay a defensible price premium for verified claims.
Gross Margin: 32-40%

Sustainability / Regulatory / Next-Generation Tier

Proprietary fermentation strains, novel peptide fractions and next-generation actives cleared under Novel Food or equivalent regulatory pathways, representing the newest and most technically defensible portion of the category and commanding correspondingly higher margins.
Gross Margin: 42-52%
bioactive-ingredient-market-trends-growth-portfolio-architecture-1787461903098

High-value Sub-segments and Strategic Watch-out

Peptide Fractions for Muscle Health

Peptide fractions for muscle-preservation and satiety claims, growing fastest and commanding the highest margins in the category as GLP-1 adjacent nutrition demand pulls fresh capital into fractionation capacity across Europe, the United States and South Korea simultaneously, with demand still meaningfully outpacing available qualified capacity industry-wide.
Gross Margin: 44-52%

Postbiotic and Fermentate Actives

Postbiotic and fermentate actives carrying heat-stable claims, expanding steadily as brand owners reformulate away from live-culture products that struggle across long, uncontrolled retail supply chains and ambient shelf conditions in warmer export markets, particularly across Southeast Asia, the Middle East and parts of Latin America.
Gross Margin: 34-42%

Commodity Vitamin and Mineral Blends

Commodity vitamin and mineral blends sold into mass fortification applications, providing steady but low-margin volume that underwrites supplier fixed costs even as growth and pricing power both remain limited across the segment relative to certified and next-generation tiers gaining share across most global consumption regions today.
Gross Margin: 16-22%

Synthetic Single-Molecule Actives

Synthetic single-molecule actives facing substitution risk from fermentation-derived and botanical alternatives as clean-label mandates spread across major retail channels; suppliers concentrated here without a credible transition plan risk meaningful share loss within the coming decade as reformulation accelerates across mainstream grocery and pharmacy categories alike.
Gross Margin: 14-20%

Reformulation Cycles and Buyer Retention

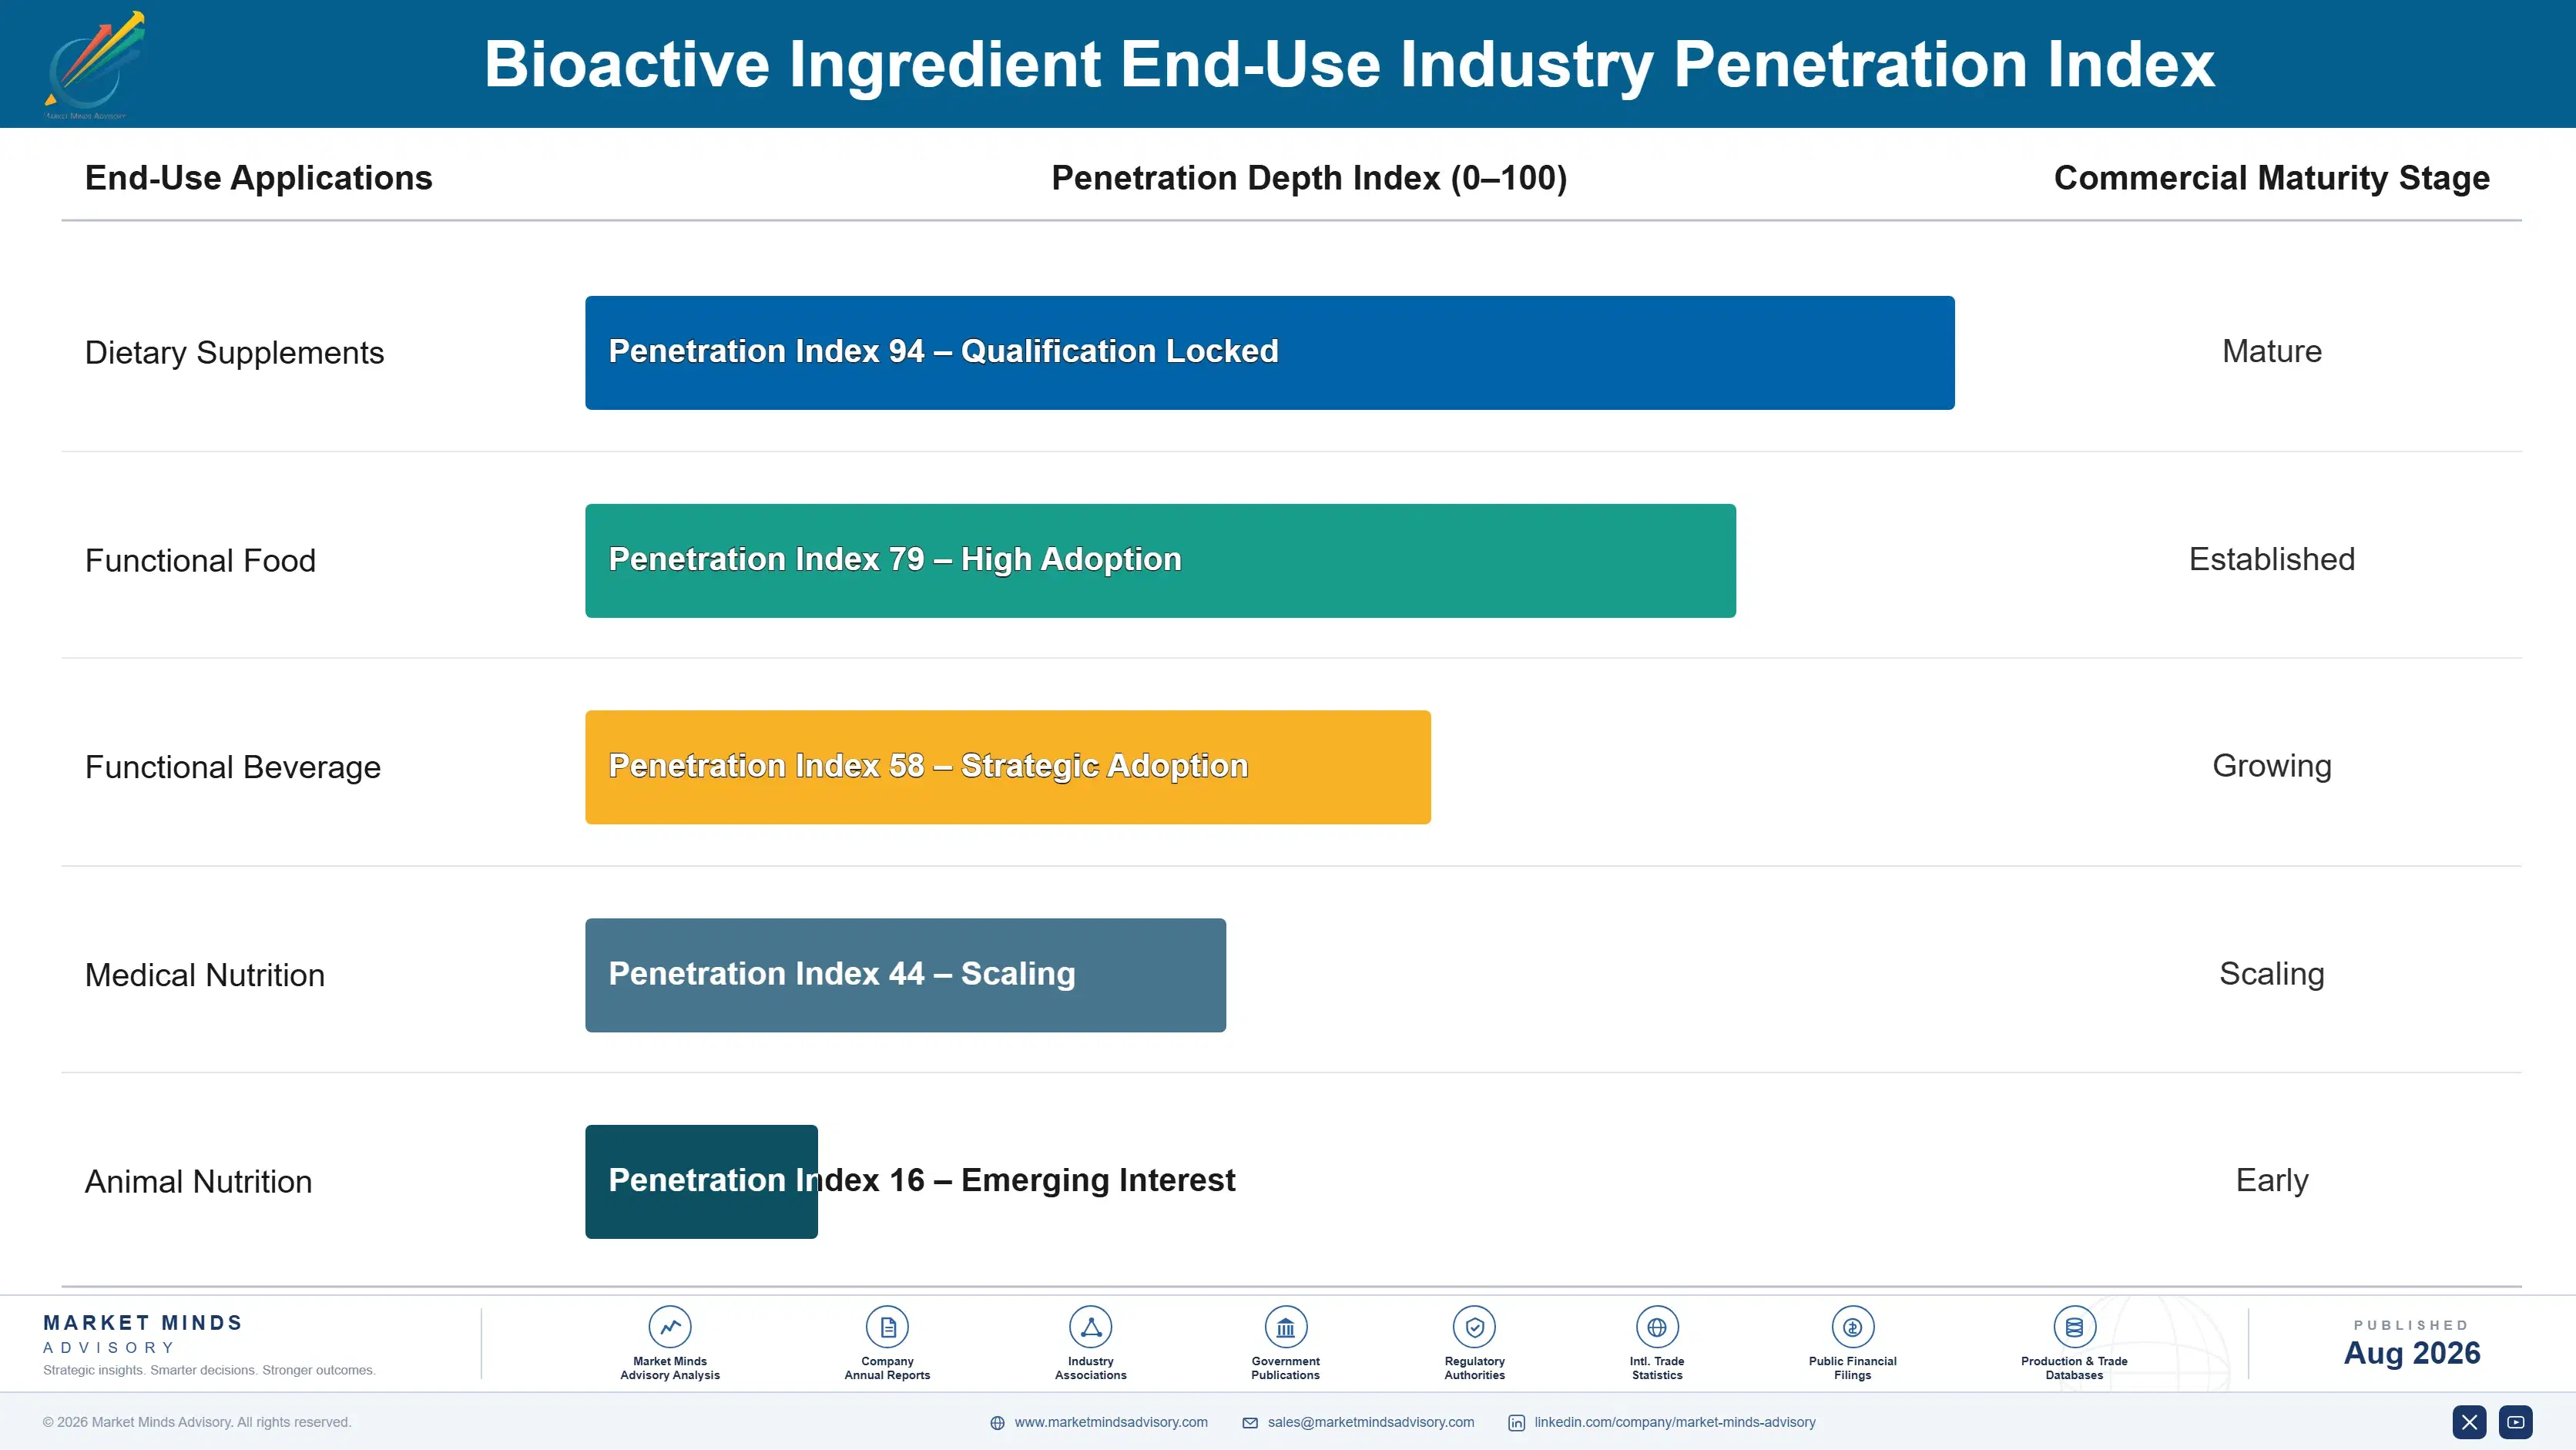
Once a brand qualifies a bioactive supplier through clinical dossier review and batch traceability audit, switching cost runs high enough that reformulation cycles typically extend three to five years before a brand revisits sourcing decisions, giving incumbent suppliers annuity-like revenue predictability once a qualification is won and locked into a commercial formulation that a competitor would need equivalent clinical evidence and lead time to displace.
Adoption depth varies sharply by end-use vertical: sports and medical nutrition brands reformulate aggressively as new clinical data emerges, chasing incremental efficacy claims ahead of competitors and customers, while mainstream packaged food and beverage companies move far more cautiously, often waiting for a full category reformulation cycle rather than swapping a single ingredient mid-product-life and risking consumer-facing label changes and retailer resubmission.

A generational shift in buyer profiles is underway as younger procurement and research and development leads at brand owners increasingly demand digital traceability and direct clinical data access before qualification, replacing an older generation of buyers who accepted supplier relationships built primarily on price and delivery history alone rather than documented scientific substantiation and continuous clinical monitoring going forward.
bioactive-ingredient-market-trends-growth-end-use-penetration-index-1787461903586

Where to Compete Over the Decade

These are among the four positions where our research anticipates prominent divergence between winners and laggards over the coming forecast period. Each is grounded in the demand model, the regulatory perimeter, and the announced capacity pipeline.
01 / CLINICAL EVIDENCE INVESTMENT

Fund Dossiers Before Competitors Close the Gap

Suppliers still competing on raw ingredient price without a clinical substantiation dossier are ceding share to houses that bundle documented evidence with the active itself, and the price gap keeps widening each year. The gap is closing fast as retailer clean-label audits become routine rather than exceptional across major grocery accounts worldwide. Building a dossier library now, even for a narrower set of actives, is cheaper and faster than catching up once competitors have locked in reference-standard clinical data that regulators and retailers already trust.
02 / TRACEABILITY INFRASTRUCTURE INVESTMENT

Digitise Batch Tracking Before Retailer Mandates Bite

Serialized, batch-level traceability is moving from competitive differentiator to baseline requirement across major retail accounts within the next two to three years, and the transition is happening faster than most mid-tier suppliers currently expect. Suppliers who delay digital traceability investment risk losing private-label contracts to competitors who can already produce full chain-of-custody documentation on demand at the point of audit. The capital outlay required is modest relative to the private-label revenue now effectively gated behind it across most major retail accounts.
03 / FRACTIONATION CAPACITY PLACEMENT

Regionalise Peptide Capacity Near Demand Centers

Peptide fractionation capacity concentrated in a single region creates lead-time risk that costs suppliers time-sensitive sports nutrition contracts to more responsive regional rivals able to turn samples around within days rather than weeks. Building or licensing fractionation capacity in North America and Western Europe, closer to the fastest-reformulating brand owners, shortens sample-to-shelf timelines meaningfully and reduces shipping and customs friction on time-sensitive orders. This positioning advantage compounds as GLP-1 adjacent demand keeps pulling capacity utilisation higher across the category worldwide.
04 / FEEDSTOCK HEDGING DISCIPLINE

Lock Multi-Year Feedstock Contracts Now

Feedstock volatility has already squeezed margins at suppliers without forward purchasing agreements in place, and the pattern is likely to repeat as weather variability continues affecting sugarcane and corn harvests across major producing regions each season. Suppliers that lock in geographically diversified, multi-year feedstock contracts protect margin predictability that matters increasingly to brand-owner customers. Those same brand owners are now signing multi-year supply deals of their own and expect suppliers to demonstrate comparable sourcing discipline before committing to a long-term relationship.

Engagement Snapshot From the Field

A live engagement with an industry participant carrying material or product regulatory and market exposure ahead of a defining policy shift, showing how our research translates into a defensible multi-year portfolio strategy.
MARKET MINDS ADVISORY · CLIENT ENGAGEMENT SUMMARY
Bioactive Ingredient Producer Strategic Portfolio Review and Transition Roadmap 2026·Investment Scenario on Bioactive Ingredient Exposure Evaluation 2025-26
CLIENT PROFILE
The client is a mid-sized European supplement and functional beverage brand generating approximately 180 million dollars in annual revenue (client-reported, unverified by MMA), competing primarily in the premium sports nutrition and everyday wellness segments across Germany, France and the Netherlands through both retail and direct-to-consumer channels, with a growing private-label supply arrangement for two national grocery chains.
STRATEGIC CHALLENGE
The client faced rising retailer demands for batch-level traceability documentation it could not obtain from its existing ingredient suppliers, several of whom lacked digital tracking systems entirely, threatening shelf placement renewals at two major grocery accounts representing roughly a third of retail revenue within the coming twelve-month renewal cycle and putting the private-label arrangement at risk.
MMA APPROACH
MMA conducted a supplier capability audit across the client's twelve primary ingredient vendors, benchmarking digital traceability infrastructure, clinical dossier completeness and feedstock hedging practices against category leaders, then modeled the switching cost and margin impact of consolidating volume toward a smaller set of better-documented suppliers with proven retail audit track records.
KEY FINDINGS
  1. Only four of twelve existing suppliers could provide serialized batch traceability on demand, versus a category-leading benchmark of full documentation within 48 hours.
  2. Consolidating volume toward the four traceability-capable suppliers would raise blended ingredient cost by roughly 6 percent but secure both at-risk retail accounts.
  3. Three secondary suppliers lacked any clinical substantiation dossier at all, exposing the client to future health-claim challenge risk on five active product lines.
  4. Peptide ingredient lead times from the client's sole Asian supplier averaged eleven weeks, double the regional benchmark achievable through European fractionation capacity.
CLIENT PROFILE
The client is a mid-sized European supplement and functional beverage brand generating approximately 180 million dollars in annual revenue (client-reported, unverified by MMA), competing primarily in the premium sports nutrition and everyday wellness segments across Germany, France and the Netherlands through both retail and direct-to-consumer channels, with a growing private-label supply arrangement for two national grocery chains.
STRATEGIC CHALLENGE
The client faced rising retailer demands for batch-level traceability documentation it could not obtain from its existing ingredient suppliers, several of whom lacked digital tracking systems entirely, threatening shelf placement renewals at two major grocery accounts representing roughly a third of retail revenue within the coming twelve-month renewal cycle and putting the private-label arrangement at risk.
MMA APPROACH
MMA conducted a supplier capability audit across the client's twelve primary ingredient vendors, benchmarking digital traceability infrastructure, clinical dossier completeness and feedstock hedging practices against category leaders, then modeled the switching cost and margin impact of consolidating volume toward a smaller set of better-documented suppliers with proven retail audit track records.
KEY FINDINGS
  1. Only four of twelve existing suppliers could provide serialized batch traceability on demand, versus a category-leading benchmark of full documentation within 48 hours.
  2. Consolidating volume toward the four traceability-capable suppliers would raise blended ingredient cost by roughly 6 percent but secure both at-risk retail accounts.
  3. Three secondary suppliers lacked any clinical substantiation dossier at all, exposing the client to future health-claim challenge risk on five active product lines.
  4. Peptide ingredient lead times from the client's sole Asian supplier averaged eleven weeks, double the regional benchmark achievable through European fractionation capacity.
RECOMMENDED STRATEGY
Phase 1: Phase 1 (Months 1 to 3): Complete a full supplier capability audit and prioritise consolidation toward the most documented, traceable vendors. Phase 2: Phase 2 (Months 4 to 9): Renegotiate volume contracts with retained suppliers and onboard a regional peptide fractionation partner in Europe. Phase 3: Phase 3 (Months 10 to 18): Build internal dossier review capability and formalise annual supplier traceability audits across the vendor base.
OUTCOME
Within eighteen months the client retained both at-risk retail accounts and reported a 6 percent reduction in average peptide ingredient lead time after onboarding a regional supplier (client-reported, unverified by MMA). Blended ingredient cost rose modestly but retail revenue exposure fell to under 10 percent of total revenue.

Frequently Asked Questions

Foundational context covering the market sizes, CAGR, scope, country, region and competition that inform every finding below. This section is provided to cover basics and most often pre-purchase conversations, answered from the MMA Primary Research Dataset.

What is the current size of the Bioactive Ingredient Market?

The global bioactive ingredient market reached an estimated 18.6 billion dollars in 2025. Growth is being led by fermentation-derived and botanical actives displacing synthetic vitamin blends across supplement and functional food formulations.

How large will the Bioactive Ingredient Market be by 2036?

MMA projects the market will reach approximately 41.6 billion dollars by 2036, more than doubling from its 2026 base. Peptide fractions and botanical extracts are expected to drive the largest share of that incremental growth.

What is the CAGR for the Bioactive Ingredient Market 2026 to 2036?

The market is forecast to grow at a 7.6 percent compound annual rate between 2026 and 2036. Bull-case scenarios reach 8.8 percent if peptide adoption accelerates faster than currently projected.

Which segment is growing fastest?

Plant polyphenols and botanical extracts lead at a 9.2 percent CAGR, roughly 1.2 times the overall market rate. Rising Novel Food approvals and clean-label reformulation are the primary drivers behind that lead.

Who are the major companies in the Bioactive Ingredient Market?

Leading suppliers include DSM-Firmenich, Kerry Group, ADM, Ingredion and Novonesis. Together they hold roughly 34 percent of category revenue, competing primarily on clinical substantiation depth and traceability infrastructure.

Which country is growing fastest?

China leads country-level growth at a 9.4 percent CAGR, driven by expanding fermentation capacity and rising domestic functional food consumption. India follows closely as its extraction base scales with government incentive support.

Report Segmentation Architecture

The full report scope spans multiple orthogonal segmentation dimensions, with cross-tabulated demand data provided for each dimension pair. Coverage extends further to regional breakdowns, trend trajectories, and the competitive detail needed to support segment-level decision-making.

By Ingredient Technology Type

  • Fermentation-Derived Actives
  • Marine and Lipid-Derived Actives
  • Plant Polyphenols and Botanical Extracts
  • Peptides and Bioactive Proteins
  • Prebiotic Fibers
  • Carotenoids and Antioxidant Pigments

By End-Use Industry

  • Dietary Supplements
  • Functional Food
  • Functional Beverage
  • Medical Nutrition
  • Animal Nutrition

By Commercial Dimension

  • Branded Retail
  • Private Label
  • Contract Manufacturing
  • Direct-to-Consumer

By Region

  • North America
  • Western Europe
  • East Asia
  • South Asia and Pacific
  • Latin America
  • Middle East and Africa
  • Eastern Europe

Scope, Methodology, and Coverage

Every figure in this report is reproducible from documented input assumptions. The scope below maps the historical period, the forecast horizon, the segmentation dimensions, and the countries covered, alongside the underlying primary and qualitative methodology.
Historical Period
2020 to 2025
Forecast Period
2026 to 2036
Base Year
2025 (USD billions; MMA Primary Research Dataset, August 2026)
Market Definition
The bioactive ingredient market comprises fermentation-derived, marine, botanical and peptide-based functional actives sold as inputs into food, beverage, supplement and medical nutrition formulations. It excludes finished consumer products, drug-approved pharmaceutical actives, and bulk vitamins sold without functional dosing claims.
Quantitative Units
USD billions (current prices); metric tonnes for volume-referenced segments
Segmentation Dimensions
By Ingredient Technology Type; By End-Use Industry; By Commercial Dimension; By Region
Regions Covered
North America, Western Europe, East Asia, South Asia and Pacific, Latin America, Middle East and Africa, Eastern Europe
Countries Covered
USA, China, Germany, France, UK, Japan, South Korea, India, Australia, Canada, Brazil, Mexico, Indonesia, Vietnam, Thailand, Malaysia, UAE, Saudi Arabia, South Africa, Nigeria, Turkey, Poland, Netherlands, Italy, Spain, Sweden, Switzerland, Argentina, Colombia, Singapore, and additional markets relevant to this sector
Key Companies Profiled
DSM-Firmenich, Kerry Group, ADM, Ingredion, Novonesis, Cargill, Tate & Lyle, BASF, Lonza, Givaudan, Symrise, Kemin Industries, Sensient Technologies, IFF, Glanbia, FMC Corporation, Nexira, AAK AB, Roquette, BENEO
Quantitative Methodology
Primary survey, n=3,800 respondents, Q4 2025, six countries; demand-side model with trade association cross-validation
Qualitative Methodology
47 expert interviews, Q4 2025; applied to validate demand model assumptions, identify emerging dynamics, and assess competitive positioning
Report Format
PDF and XLSX data workbook (Word format preview document)
Publisher
Market Minds Advisory
Report Code
MMA-2026-AGR-101
Published
August 2026
Contact
sales@marketmindsadvisory.com | www.marketmindsadvisory.com

Purchase the full Bioactive Ingredient Market Report (2026 to 2036).

The full report delivers detailed segment-level sizing across all six ingredient technology classes, country-level forecasts for thirty markets, and a competitive benchmarking module covering all twenty profiled suppliers on a single consistent revenue basis. It includes primary survey data from 3,800 respondents across six countries alongside 47 qualitative expert interviews conducted in the fourth quarter of 2025. Analysts provide a standalone regulatory tracker covering Novel Food and equivalent approval pathways across major consumption markets. Clients also receive quarterly update briefings through the twelve months following publication.
Segment-level sizing across six ingredient technology classes
Country-level forecasts spanning thirty individual markets
Competitive benchmarking across twenty profiled suppliers
Standalone regulatory approval pathway tracker module
Quarterly post-publication analyst update briefings included
Primary survey and expert interview datasets

Built For The People Who Decide

From boardroom strategy to bench-side execution, this report is read cover-to-cover by leaders shaping the next decade of their industry, turning demand scenarios, market dynamics and valuation benchmarks into decisions.
CXOs/ Presidents/ VPs/ Managers
M&A and Corporate Development
Strategy Teams and R&D Heads
Procurement and Product Directors
Regulatory and Compliance Leaders
Investor Relations and Equity Analysts