Market Minds Advisory
Bio Hazards Bag Market

Bio Hazards Bag Market: A Commodity Film Product Sold On Regulatory Liability

A commercial reading of medical waste containment, where a printed film sack costing pennies carries the regulatory exposure of everything sealed inside it, and one failed seam becomes an inspection finding.

Lead Analyst

Alice Ballenger

Published

September 2026

Make Smarter Decisions with Customized Research Insights

Request a free sample report and evaluate market opportunities, growth trends, and competitive dynamics relevant to your business needs.

2025 MARKET VALUE$1.1BMarket Size 2025
2036 FORECAST VALUE$2.3BBase Case , 2026 to 2036
CAGR 2026 TO 20366.8 %Bull 8.0% / Bear 5.6%
INCREMENTAL OPPORTUNITY$1.1BNet 10- year value creation
EXPANSION MULTIPLE1.93x2036 value over 2026 base
Strategic Levers
M&A Pipeline
Regional Outlook
Country Rankings
Competitive Intelligence
Segmental Deep-dive
Call-Us : 91 93563 13602

Executive Snapshot and Market Trajectory

This is a film sack costing a few pennies that carries the legal exposure of whatever a hospital seals inside it. Nobody buys it on price alone once they have failed an inspection. Colour coding, seam strength, and documented compliance are what actually get specified.
The market stands at USD 1.1 billion in 2025 and reaches USD 2.26 billion by 2036 at a 6.8% CAGR. Cytotoxic and chemotherapy waste bags grow fastest at 9.6%, about 1.41 times the overall rate, as oncology treatment volumes rise and handling rules tighten around them. North America holds 28% of value on healthcare activity and enforcement intensity, while India posts the quickest national growth at 11.4%.
Fragmentation is extreme, with the top five holding roughly 24% of biohazard bag revenue across healthcare distributors, film converters, and laboratory suppliers who barely compete on the same terms. Two forces pull in different directions. Waste segregation rules keep multiplying the number of certified bag types a facility must stock, while procurement consolidation pushes hospital groups toward fewer suppliers and standardised specifications across every site they operate. Certified breadth is what actually wins the contract.
Market Definition
The bio hazards bag market covers flexible bags and liners manufactured to contain, transport, and treat biohazardous and regulated medical waste, spanning infectious and clinical waste bags, autoclavable sterilisation bags, cytotoxic and chemotherapy waste bags, anatomical and pathological waste bags, and specimen and diagnostic transport bags. Rigid sharps containers, reusable waste carts and bins, autoclaves and waste treatment equipment, medical waste collection and disposal services, general municipal refuse sacks, and thermal shipping systems for temperature-controlled specimen transport are excluded.
Base Year Value
$1.1B in 2025 (MMA Primary Research Dataset, August 2026)
Forecast Period
2026 to 2036, eleven discrete annual values
CAGR
6.8% base case. Bull 8.0%. Bear 5.6%.
Fastest Growth Segment
Cytotoxic and Chemotherapy Waste Bags: 9.6% CAGR
Fastest Growth Country
India: 11.4% CAGR
Fastest Growth Region
South Asia and Pacific: 9.0% CAGR
Largest Region
North America: 28% of 2025 global value
Market Leaders
Medline Industries, Cardinal Health, Inteplast Group, Novolex, Daniels Health. Source: MMA Analysis based on company annual reports.
Primary Survey
n=3,800 procurement and R&D decision-makers, Q4 2025, six countries
Methodology
Demand-side build-up, cross-validated against public data, 47 expert interviews

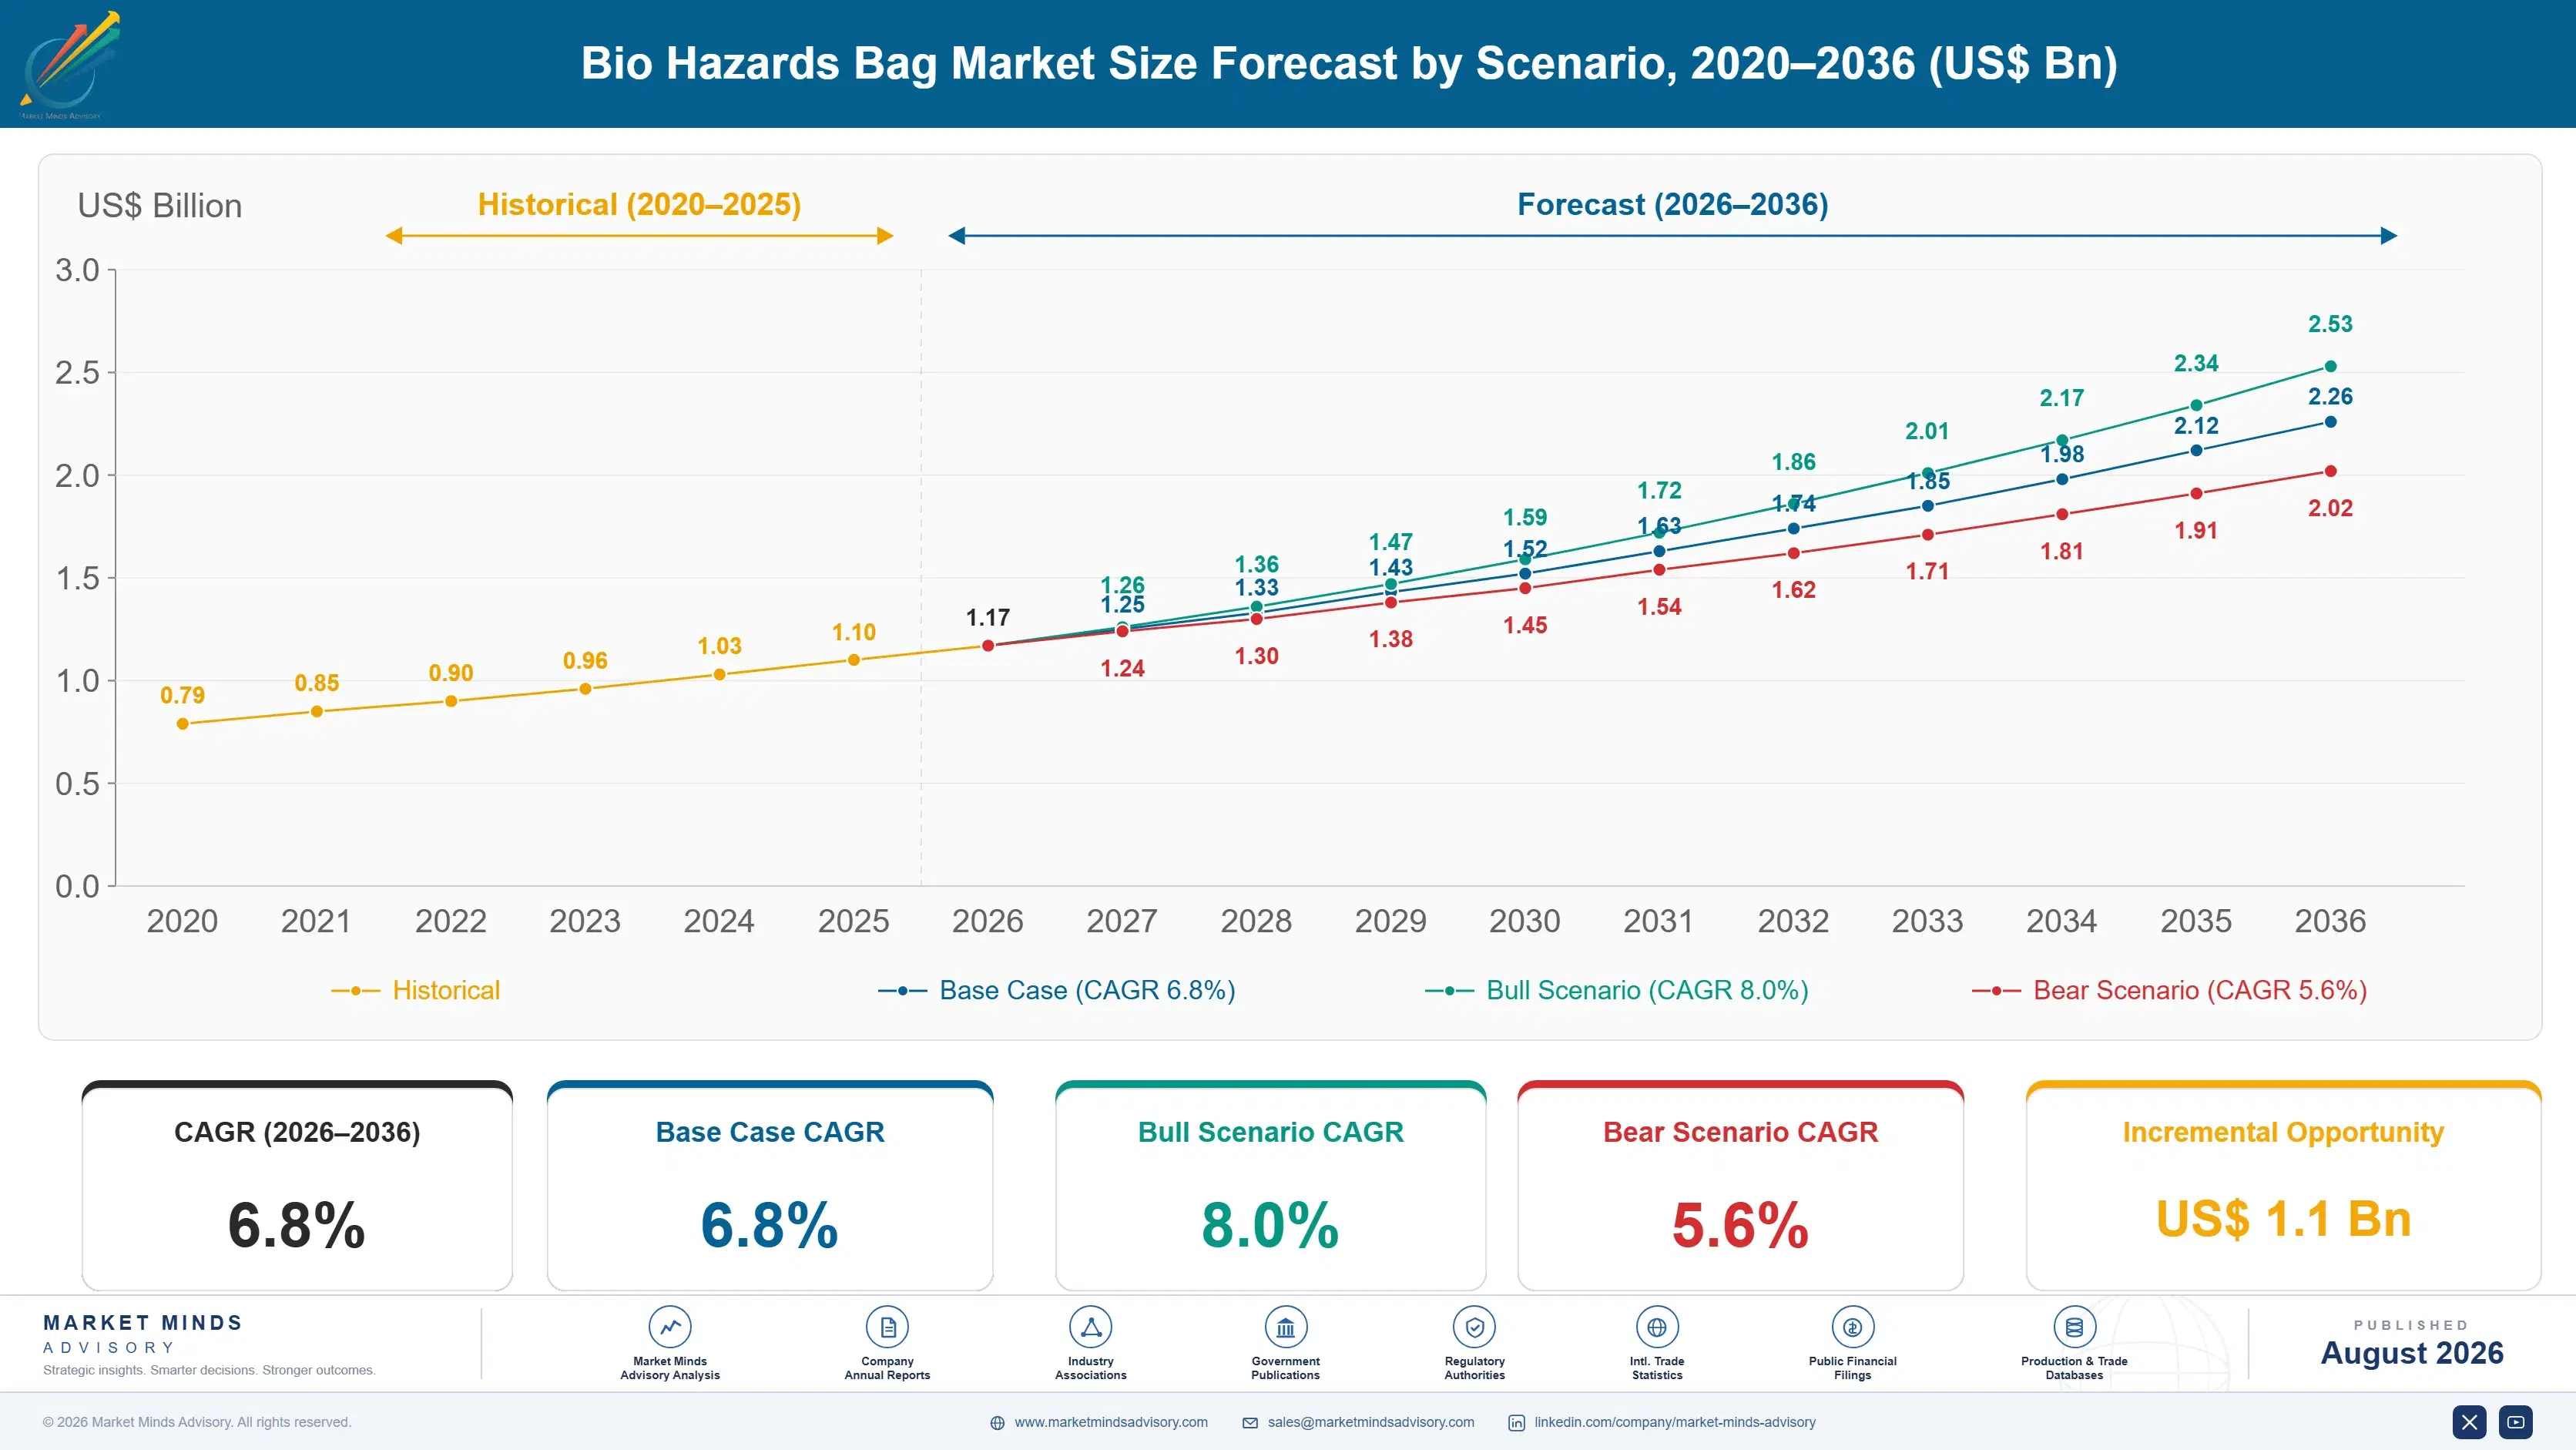
Bio Hazards Bag Market Forecast Scenarios

bio-hazards-bag-market-size-forecast-scenario-1787332000014
Growth from 2020 to 2025 compounded near 5.9%, and the pandemic distorted both ends of it. Clinical waste volumes surged through 2020 and 2021 as personal protective equipment entered the infectious stream in enormous quantity, then fell back as protocols normalised. Resin pricing swung hard across the same window and converters passed it on late. Underneath both, waste segregation regulation kept widening.
Three mechanisms carry the base case to 6.8%. First, healthcare activity volume, since regulated waste tonnage tracks procedures, admissions, and diagnostic testing almost mechanically. Second, segregation rule expansion, where each new waste category a regulator defines creates a separate certified bag a facility must stock and staff must learn. Third, oncology treatment growth, which drives cytotoxic waste handling that carries the strictest requirements and the highest specification in the category.
The bull case at 8.0% assumes segregation rules extend further into pharmaceutical and cytotoxic streams across more jurisdictions, which raises specification and value per bag. The bear case at 5.6% assumes hospital procurement consolidation compresses pricing toward commodity film levels, reusable rigid container systems take share from single-use bags in more waste streams, and resin cost pass-through remains as slow as it has historically been.

Pennies Per Bag, Everything Riding On The Seam

Demand rests on three foundations. Healthcare activity provides the volume, since regulated waste tonnage follows admissions, procedures, and testing without much variation. Regulation provides the specification, because colour coding, labelling, and performance ratings are set by rule rather than by preference. And liability provides the pricing floor, since a facility that has failed a waste inspection stops treating the bag as a commodity and starts treating it as a control.
MARKET CONCENTRATIONCR5: 24%Among the most fragmented supply bases in healthcare consumables
BAG TYPES STOCKED8 to 20Separate certified variants a large hospital must hold
RESIN COST SHAREAbout 58%Polymer as a portion of converted bag cost
WASTE COST SHARE0.4% to 1.2%Bag spend against total regulated waste handling cost
CONTRACT REVIEW CYCLE24 to 36 monthsInterval at which hospital groups retender consumable supply
SEAM STRENGTH REQUIREMENTClass 1 ratedDrop and puncture performance specified for infectious streams
Commercially the interesting feature is how small the bag is against what it governs. Bag spend runs 0.4% to 1.2% of total regulated waste handling cost, and the treatment and haulage around it dwarfs the container entirely. That asymmetry should support specification selling, yet most tenders still run on price per thousand, because procurement rarely owns the compliance consequence.
The decade ahead turns on segregation and reusables. Every new waste category a regulator defines adds a certified bag type, and large hospitals already stock eight to twenty variants with the training burden that implies. Pulling the other way, reusable rigid containers are taking share in sharps and some clinical streams on total cost arguments. Cytotoxic handling at 9.6% growth is where specification value is genuinely rising.
"Ask a procurement lead about biohazard bags and you get a price per thousand. Ask the infection control nurse who found waste on a corridor floor and you get a specification. The suppliers that grow are the ones who work out how to reach the second conversation."
Director, Healthcare Consumables and Waste Packaging Practice · MMA Packaging /

Market Trends

Segregation Rules Multiply The Certified Bag Count

Regulators keep subdividing the regulated waste stream, and each new category arrives with its own colour, label, performance rating, and treatment route. A large hospital now stocks eight to twenty separate certified bag variants, each needing storage space, staff training, and a purchasing line. The commercial effect cuts both ways for suppliers: breadth of certified range becomes a real advantage against single-product converters, while the administrative burden pushes hospital groups toward whoever can supply the whole set from one contract. Misuse of the wrong bag remains the most common inspection finding.
Market Impact: Cytotoxic bags grow at 9.6%
Reusable Rigid Containers Take Share From Bags

Reusable rigid containers with documented cleaning cycles are displacing single-use bags and liners in sharps handling and parts of the clinical stream, sold on total waste cost rather than container price. The argument works where a facility generates enough volume to justify collection logistics and where a service provider already visits regularly. It fails in smaller clinics, dental practices, and anywhere the return route does not exist. Bag suppliers competing on unit price alone are losing these conversations before they start, since the comparison is being made on handling cost.
Market Impact: Testing adds 4 billion specimens

Market Opportunities and Growth Drivers

Oncology Volumes Drive Cytotoxic Waste Handling

Chemotherapy and other cytotoxic treatments generate waste that regulators handle more strictly than infectious material, because the hazard is chemical and persistent rather than biological and treatable. Bags for this stream carry heavier gauge, specific violet or purple coding, defined puncture resistance, and labelling that survives incineration handling. Oncology treatment volumes rise with diagnosis rates and ageing populations in every developed market. That combination makes this the fastest-growing part of the category at 9.6% and the part where specification genuinely commands price. The certified supplier list for this stream is considerably shorter.
Market Impact: Groups contract across 40 sites

Diagnostic Testing Volume Multiplies Specimen Transport Bags

Every specimen moving between a collection point and a laboratory travels in a sealed transport bag with an absorbent layer and a documentation pocket, and testing volumes have risen steadily with decentralised collection networks and screening programmes. Private diagnostic chains operating hundreds of collection points generate enormous bag volume from very small individual purchases. Regulation on transport of biological substances sets the specification, which means the product cannot be substituted with a generic sealable bag however similar it looks on a shelf. Distribution reach matters far more here than converting scale ever does.
Market Impact: Resin is 58% of bag cost

Market Restraints and Challenges

Procurement Consolidation Compresses Pricing Toward Commodity Film

Hospital groups and purchasing organisations contract consumables across dozens of sites on a price per thousand basis, and biohazard bags sit in a basket alongside gloves and liners where nobody defends specification. The root cause is that procurement holds the budget while infection control holds the consequence, and those two functions rarely negotiate together. Commercially this drags pricing toward converted film economics regardless of certification. Suppliers mitigate by reaching infection control and waste managers directly, bundling certified ranges into single contracts, and documenting failure cost rather than unit cost. Nobody in the tender room owns the failure.
Market Impact: Facilities stock 8 to 20 variants

Resin Pricing Passes Through Slowly And Painfully

Polymer represents roughly 58% of converted bag cost and moves on petrochemical markets no converter influences, while healthcare supply contracts typically reprice annually at best. The root cause is a fragmented converting base with no pricing power against consolidated hospital purchasing. Commercially this means margin compresses whenever resin rises and recovers slowly at best. Converters mitigate through indexation clauses where buyers will accept them, resin purchasing scale, shifting mix toward certified specialty streams where price sensitivity is lower, and gauge optimisation that cuts polymer per bag. Recovery is slow at best when resin falls back.
Market Impact: Reusables hold about 22% share
4 additional market trends, 3 additional growth drivers, and 2 additional restraints and challenges are covered in the full report. Contact sales@marketmindsadvisory.com to access the complete intelligence.

Segment CAGR and Growth Architecture

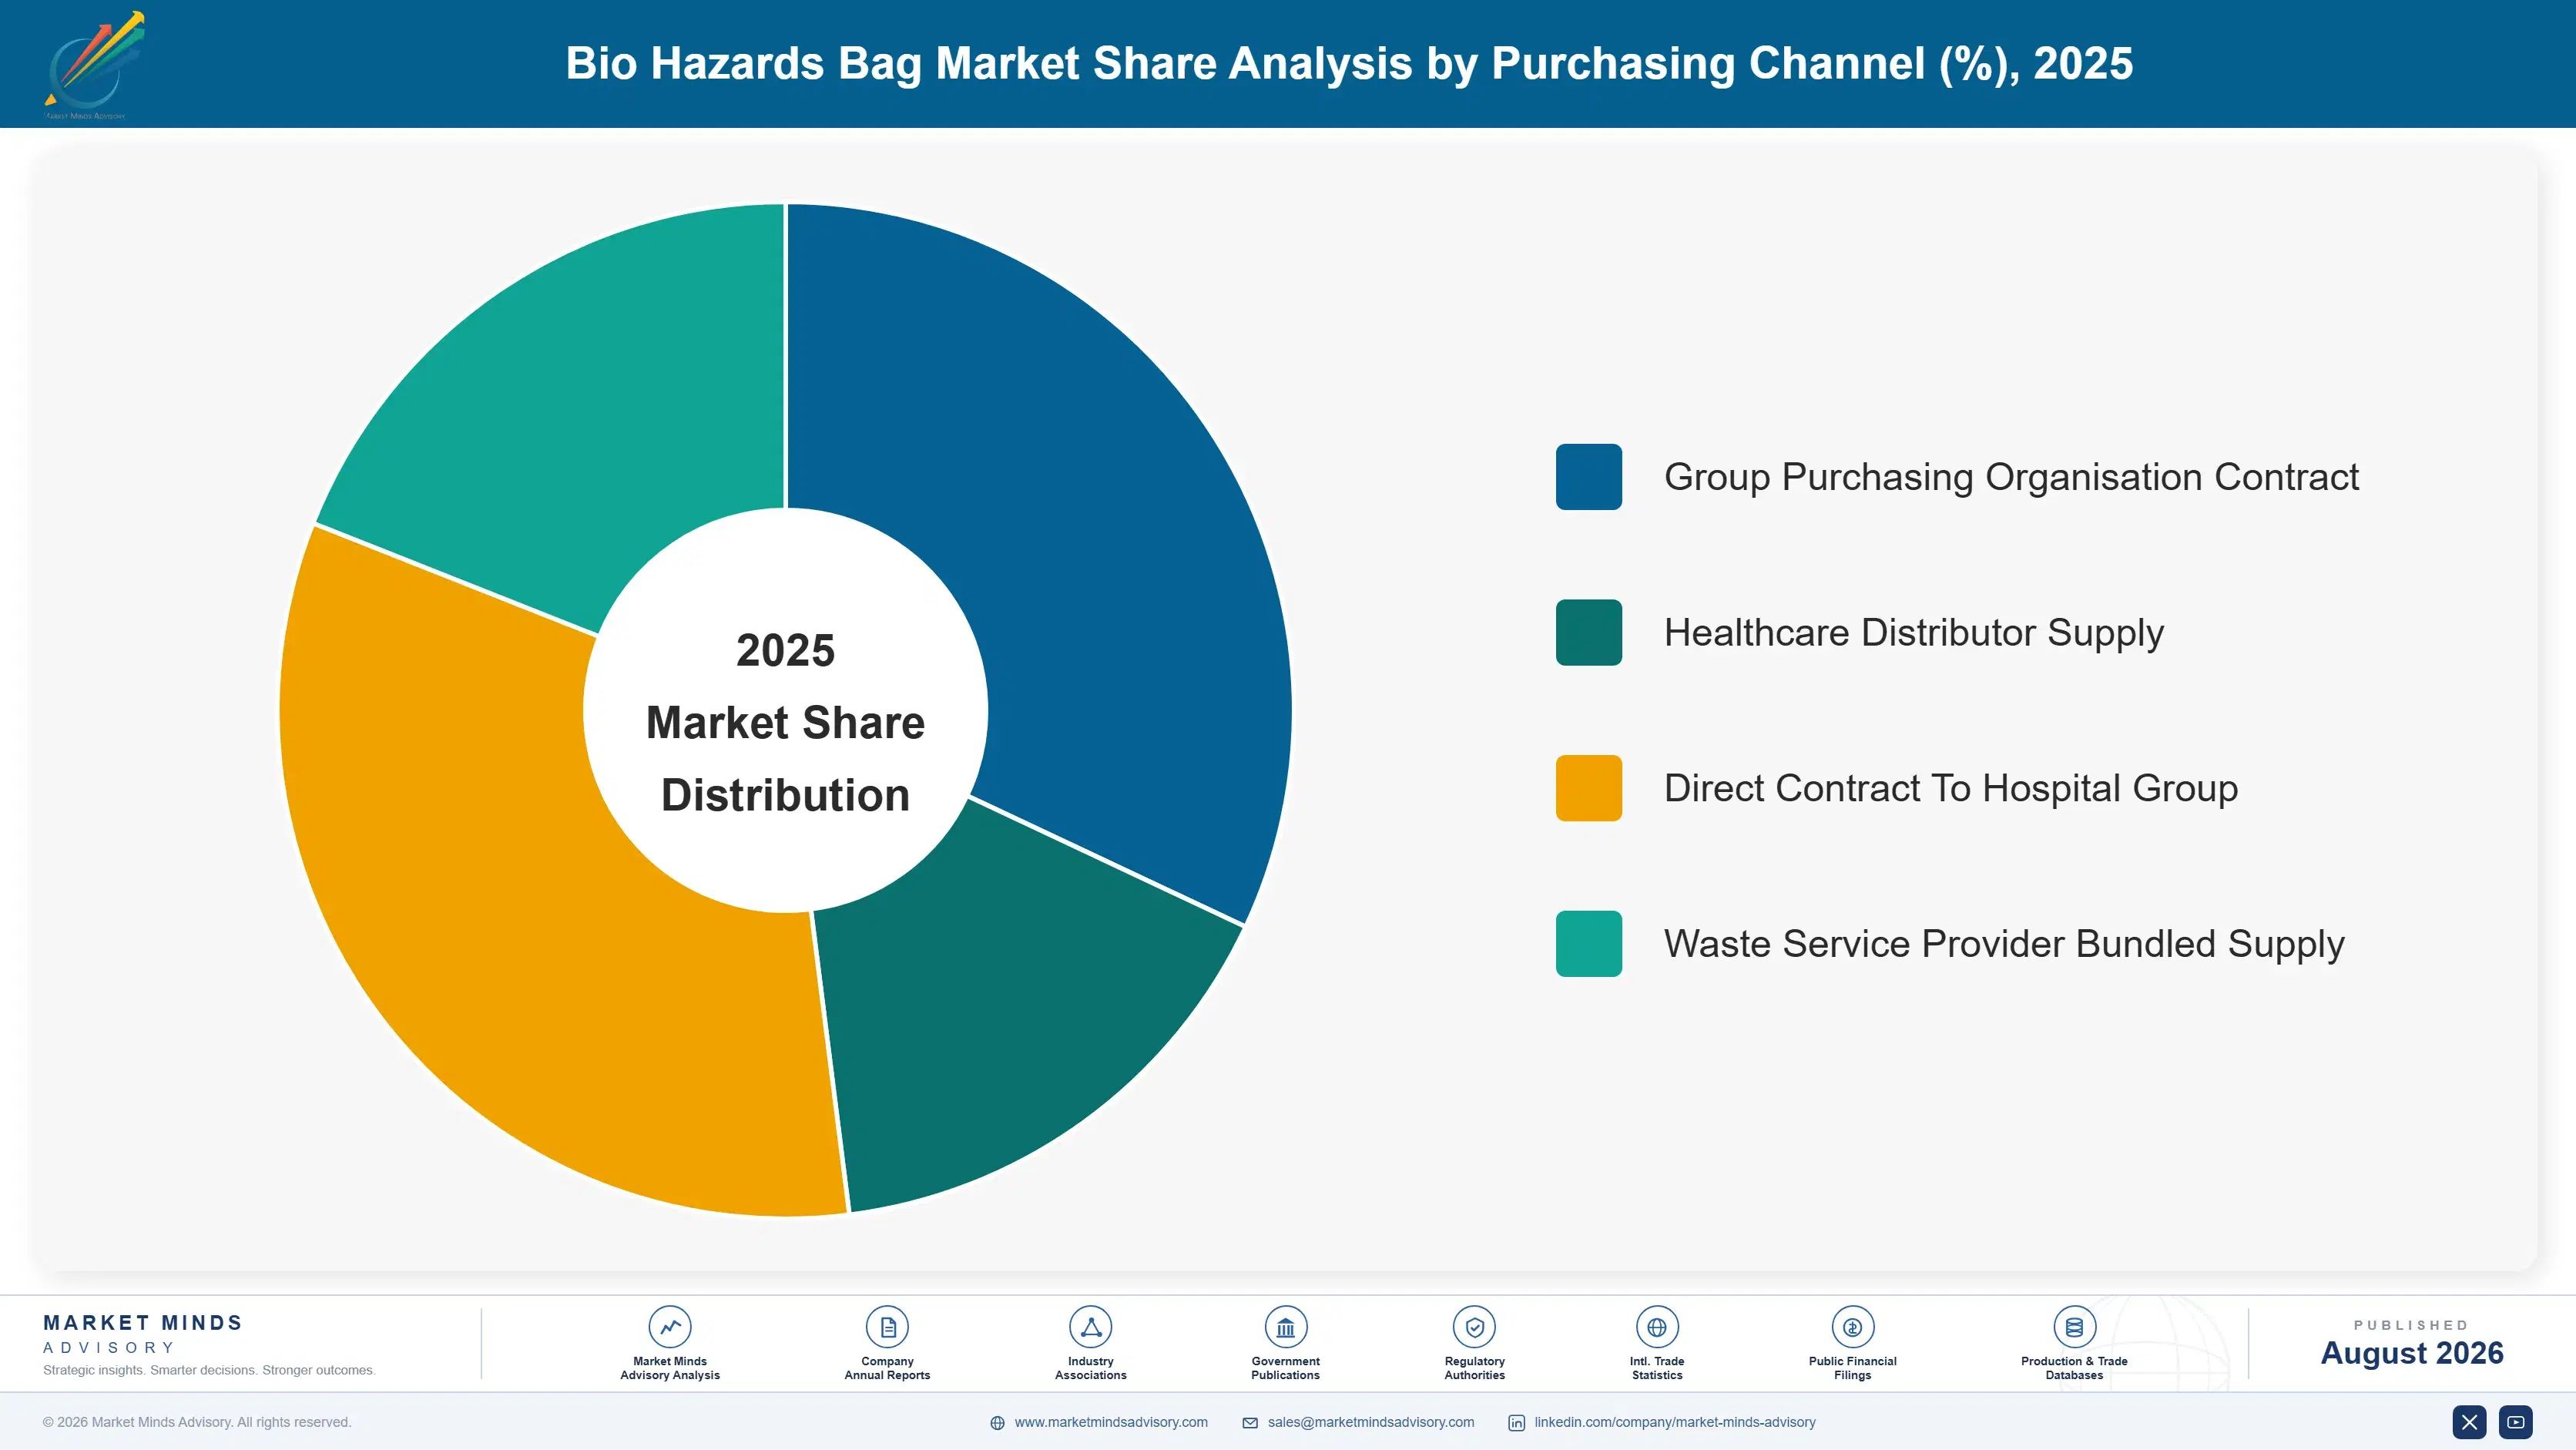
Segmentation follows regulated waste stream class, a single classification describing the waste category a bag is certified to contain. Each class carries its own colour coding, gauge, labelling requirement, and treatment route, so position tracks the certification rather than the facility using it. End-use setting and purchasing channel appear separately within the framework as their own distinct dimensions.
bio-hazards-bag-market-market-share-analysis-1787332000574

Cytotoxic and Chemotherapy Waste Bags

Cytotoxic and chemotherapy waste bags grow fastest at 9.6%, about 1.41 times the overall 6.8% rate, and regulatory severity rather than volume explains the premium. The hazard is chemical and persistent rather than biological and treatable, so regulators require incineration rather than autoclaving and specify heavier gauge, defined puncture resistance, distinct violet or purple coding, and labelling that survives handling. Oncology treatment volumes rise with diagnosis rates and ageing populations across every developed market. Specification here genuinely commands price in a category that otherwise resists it, and the certified supplier list is considerably shorter than for infectious waste. Oncology treatment growth alone would sustain this stream even without any further regulatory tightening.
CAGR 9.6%

Specimen and Diagnostic Transport Bags

Specimen and diagnostic transport bags grow at 8.6%, the second-fastest class, and decentralised collection rather than hospital activity drives it. Every sample moving from a collection point to a laboratory travels in a sealed bag with an absorbent layer and a separate documentation pocket, specified by rules on transporting biological substances rather than by the buyer. Private diagnostic chains running hundreds of collection points generate very large volumes from small individual orders, which favours suppliers with distribution reach over those with converting scale. The product cannot be substituted with a generic sealable bag, however similar it appears. Order sizes are small and reorder frequency is very high, which suits distributors better.
CAGR 8.6%
Full segment breakdown across 5 segments available in the complete report.

Regional Architecture and Country Demand Map

Healthcare activity and enforcement intensity together set this distribution rather than population. North America leads on procedure volume and inspection rigour, while South Asia and Pacific grows quickest as waste segregation rules reach facilities that previously had none. Enforcement, not affluence, sets specification. Breadth matters more than converting scale.

North America

North America holds 28% of value, and enforcement intensity rather than population explains the gap between its share and its share of hospital beds. Regulated medical waste rules are enforced at state level with real inspection consequence, which keeps specification discipline higher than anywhere. Purchasing organisations contract consumables across dozens of sites, which compresses pricing hard against that same specification requirement. Reusable rigid container services have taken meaningful share in sharps handling, particularly where a service provider already visits weekly. Growth of 6.2% reflects steady healthcare activity against procurement pressure and reusable substitution together. Cytotoxic handling is the part genuinely expanding here. Group contracting decides access to most of the volume.
Share: 28% | CAGR: 6.2% (2026 to 2036)

Western Europe

Colour coding standards rather than enforcement variation define this market. Western Europe holds 24% of value, with national waste codes that specify bag colour, labelling, and treatment route in considerable detail and vary enough between countries that a multinational supplier maintains separate specifications for each. Autoclave treatment is more common than incineration in several markets, which shifts demand toward autoclavable film rather than incineration-grade liner. Reusable container systems are well established, particularly in Germany and the Nordics. Growth of 5.4% is the slowest of the seven regions, reflecting flat healthcare volumes and mature segregation practice already fully in place. Colour conventions differ enough between countries to prevent a single specification.
Share: 24% | CAGR: 5.4% (2026 to 2036)
Regional intelligence for 5 additional markets available in the complete report: East Asia, South Asia and Pacific, Latin America, Middle East and Africa, Eastern Europe. Contact sales@marketmindsadvisory.com.
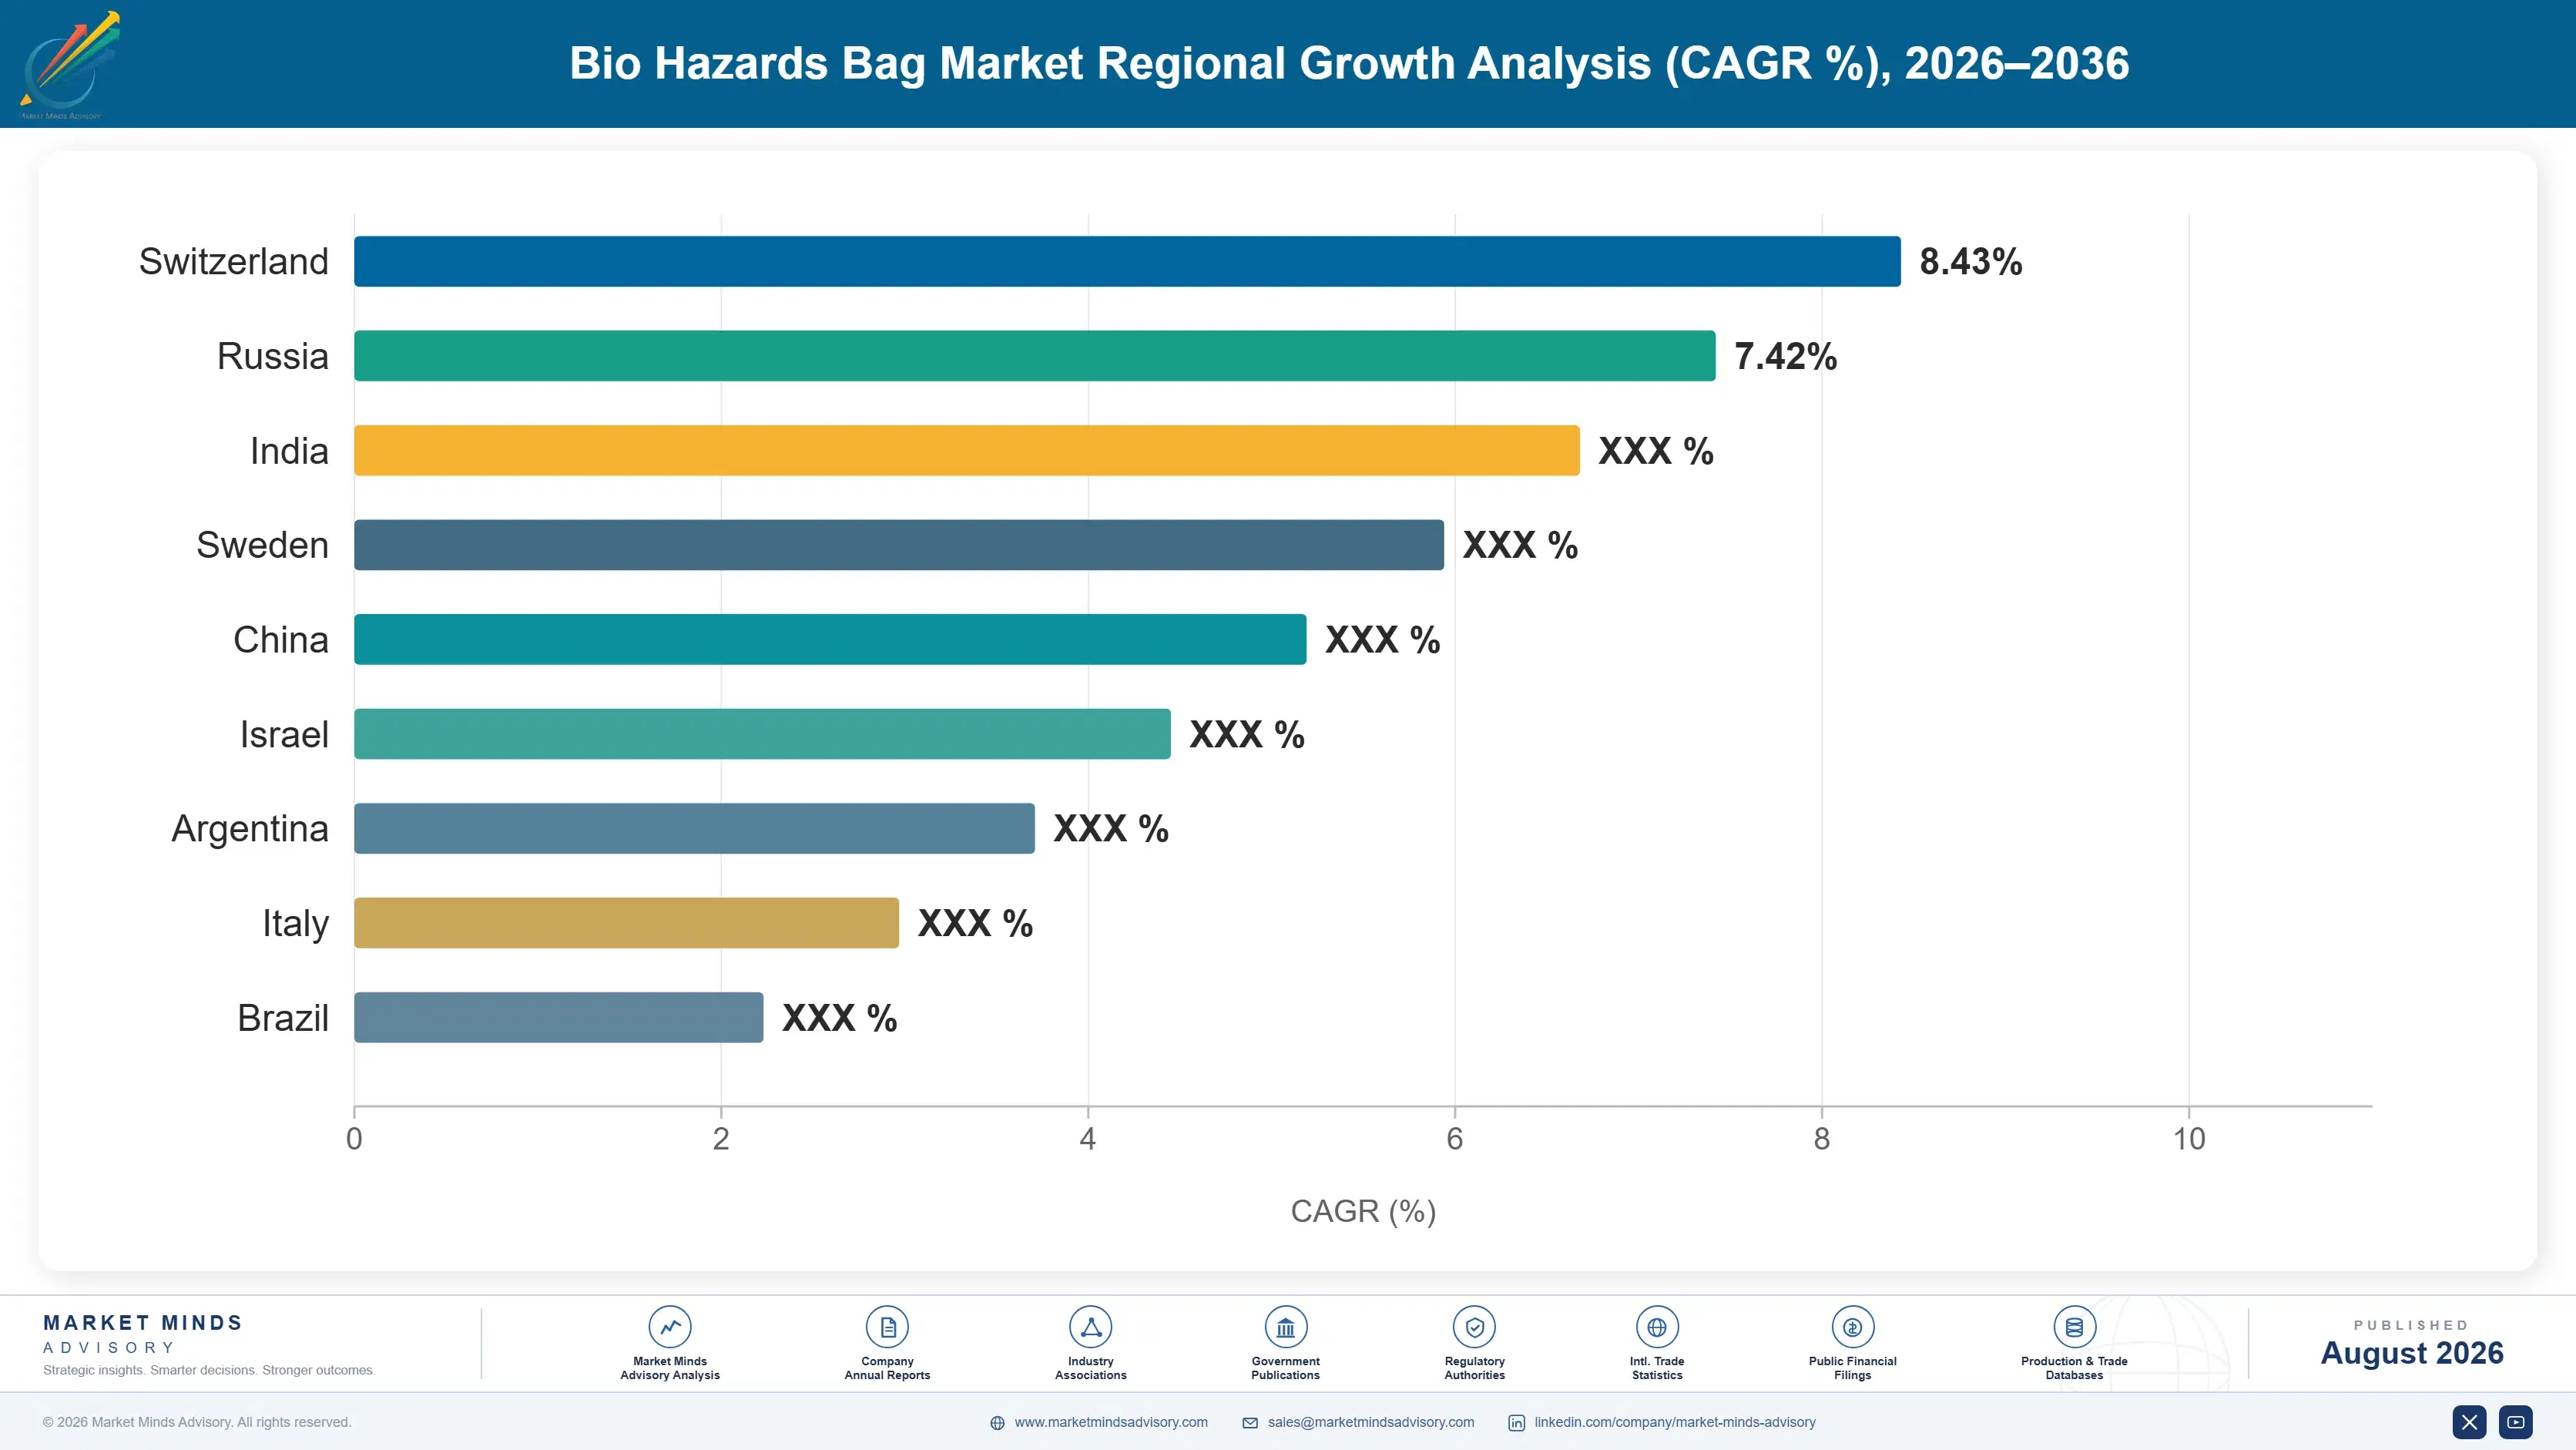
bio-hazards-bag-market-country-cagr-analysis-1787332001078

Where Biohazard Bag Margin Actually Sits

Quoting price per thousand against a hundred regional converters is how this category commoditised. The four moves below reach ground price cannot: certifying the whole segregated range, selling to infection control rather than procurement, holding cytotoxic and specimen specification, and cutting polymer per bag. None of them is a discount. Every one of them takes real work.

Certify The Whole Segregated Range, Not One Bag

A large hospital stocks 8 to 20 separate certified variants, and the administrative burden of managing that across a group pushes buyers toward whoever can supply the complete set under one contract. A converter holding certification on only infectious waste competes for a fraction of the basket and gets displaced whenever the group consolidates. Range certification costs testing and documentation once per variant and then compounds, because breadth is what converts a product supplier into a contracted one. Single-product converters are steadily losing shelf space this way. Breadth compounds where a single product does not.
Market Impact: Facilities stock 8 to 20 certified

Reach Infection Control Before Procurement Retenders

Procurement holds the budget and infection control holds the consequence, and those functions rarely negotiate together, which is precisely why this category prices like commodity film. A supplier who documents failure cost with the waste manager and infection control lead arrives at the retender with a specification written around its product rather than a price to beat. Contract cycles run 24 to 36 months, so the work has to be done well before the tender opens. Suppliers appearing only at tender are quoting into somebody else's specification. That is where the specification actually gets written.
Market Impact: Contracts retender only every 24 to

Hold Cytotoxic And Specimen Certification Deliberately

Cytotoxic bags grow at 9.6% and specimen transport at 8.6%, both well ahead of the 6.8% category, and both carry certification requirements that shorten the qualified supplier list considerably. Heavier gauge, defined puncture resistance, absorbent layers, and documentation pockets are all things a commodity converter cannot simply run on existing tooling. That is the point. Mix shift toward these two streams raises blended margin without requiring any pricing argument on the infectious waste volume that fills the line. Blended margin improves without touching the standard liner price at all, which is the point.
Market Impact: Both specialty streams grow above 8

Cut Polymer Per Bag Rather Than Cut Price

Resin is roughly 58% of converted cost and moves on markets no converter influences, so the only cost lever a supplier genuinely controls is how much polymer goes into each bag. Downgauging with higher-strength resin blends, optimised gusset geometry, and tighter extrusion control can remove real material weight while holding certified drop and puncture performance. Recertification is required and takes time. The saving is permanent and invisible to the customer, which is exactly what makes it better than a price concession. Certification testing is the only real cost of doing it.
Market Impact: Downgauging can remove up to 12% of

Who Controls the Margin Pool

Fragmentation is extreme: the top five hold roughly 24% of biohazard bag revenue, split between healthcare distributors, film converters, and laboratory suppliers whose routes to market barely overlap. The gap between leaders and challengers is certified range breadth and contract position rather than film quality, which is widely held. All participants here are assessed on one basis, revenue from biohazard and regulated medical waste bags and liners, excluding rigid sharps containers, waste tre
Competition runs along four lines. First, certified range breadth, since groups increasingly contract the whole segregated set at once. Second, contract position with purchasing organisations, which decides access to multi-site volume. Third, resin purchasing scale, given polymer is most of converted cost. Fourth, distribution reach into clinics, laboratories, and collection networks that order small quantities frequently.

Pressure is building from two directions. Reusable rigid container services are taking share in sharps and parts of the clinical stream on total handling cost rather than container price. Meanwhile Asian converters supply standard infectious waste bags at costs Western producers cannot approach. Rankings should favour suppliers with full certified ranges and specialty stream capability over those defending commodity liner volume on price.
bio-hazards-bag-market-company-positioning-matrix-1787332001595

Competitive Moat and Risk Dimensions

MEDLINE INDUSTRIES

Moat: Contract position and range breadth

Medline holds contracted supply positions across large hospital groups and purchasing organisations, and biohazard bags travel inside a consumables basket that spans thousands of items. That bundling makes displacement by a single-product converter very difficult regardless of price. Its distribution infrastructure also reaches clinics and smaller facilities that order in quantities converters cannot serve economically.
MEDLINE INDUSTRIES

Risk: Commodity basket and margin dilution

Bags sit inside a basket procured on aggregate price, which suppresses the specification argument that would otherwise support margin on certified variants. Asian converters supply standard infectious waste product at costs no domestic manufacturer can match. Reusable container services also erode single-use volume in exactly the sharps and clinical streams that carry the steadiest reorder patterns.
INTEPLAST GROUP

Moat: Converting scale and resin purchasing

Inteplast operates converting scale that sets a genuine cost floor on polymer purchasing and extrusion, which matters when resin is roughly 58% of converted bag cost. Vertical integration from resin through film to finished bag removes margin layers competitors carry. Manufacturing footprint close to major healthcare markets also supports the freight economics on a bulky, low-value product.
INTEPLAST GROUP

Risk: Distributor dependence and specification reach

Much of the volume reaches hospitals through distributors who own the customer relationship and the specification conversation, which limits how much of the certified premium the converter captures. Specialty streams including cytotoxic and specimen transport require capability and documentation beyond standard converting. Reusable substitution also pressures the highest-volume liner formats most directly.

Players Tracked

Prominent Players

Medline Industries
Cardinal Health
Inteplast Group
Novolex
Daniels Health

Other Key Players

Berry Global
Poly-America
Sarstedt
Corning Life Sciences
Thermo Fisher Scientific
Heathrow Scientific
Dynalon
Bel-Art Products
Elkay Plastics
Revolution Bag
Trinity Plastics
Sekisui Chemical
Greiner Bio-One
Deltalab
Simport Scientific

Recent Developments

FEBRUARY 2025

Indian biomedical waste rules extend to smaller healthcare facilities

Regulatory attention widened to nursing homes, diagnostic centres, and small clinics that had previously operated outside enforced segregation requirements, obliging them to hold certified bags for each defined waste stream. This was regulatory extension rather than a commercial transaction, and it added a very large number of small purchasing points.
Signal: Rule extension into small facilities adds
AUGUST 2024

Reusable sharps container services expand across hospital groups

Waste service providers extended reusable rigid container programmes across additional hospital group contracts, sold on total handling cost rather than container price. These were service contract awards rather than acquisitions or joint ventures, and they displaced single-use liner volume in the streams with the most predictable reorder patterns.
Signal: Total handling cost beats container price
APRIL 2024

Cytotoxic waste handling requirements tighten in several jurisdictions

Additional jurisdictions specified stricter gauge, puncture resistance, and labelling requirements for cytotoxic and chemotherapy waste containment, alongside mandatory incineration routing. These were regulatory changes rather than corporate events, and they shortened the list of converters able to supply the stream at all. Several regional converters exited the stream entirely.
Signal: Every tightening of the cytotoxic specific

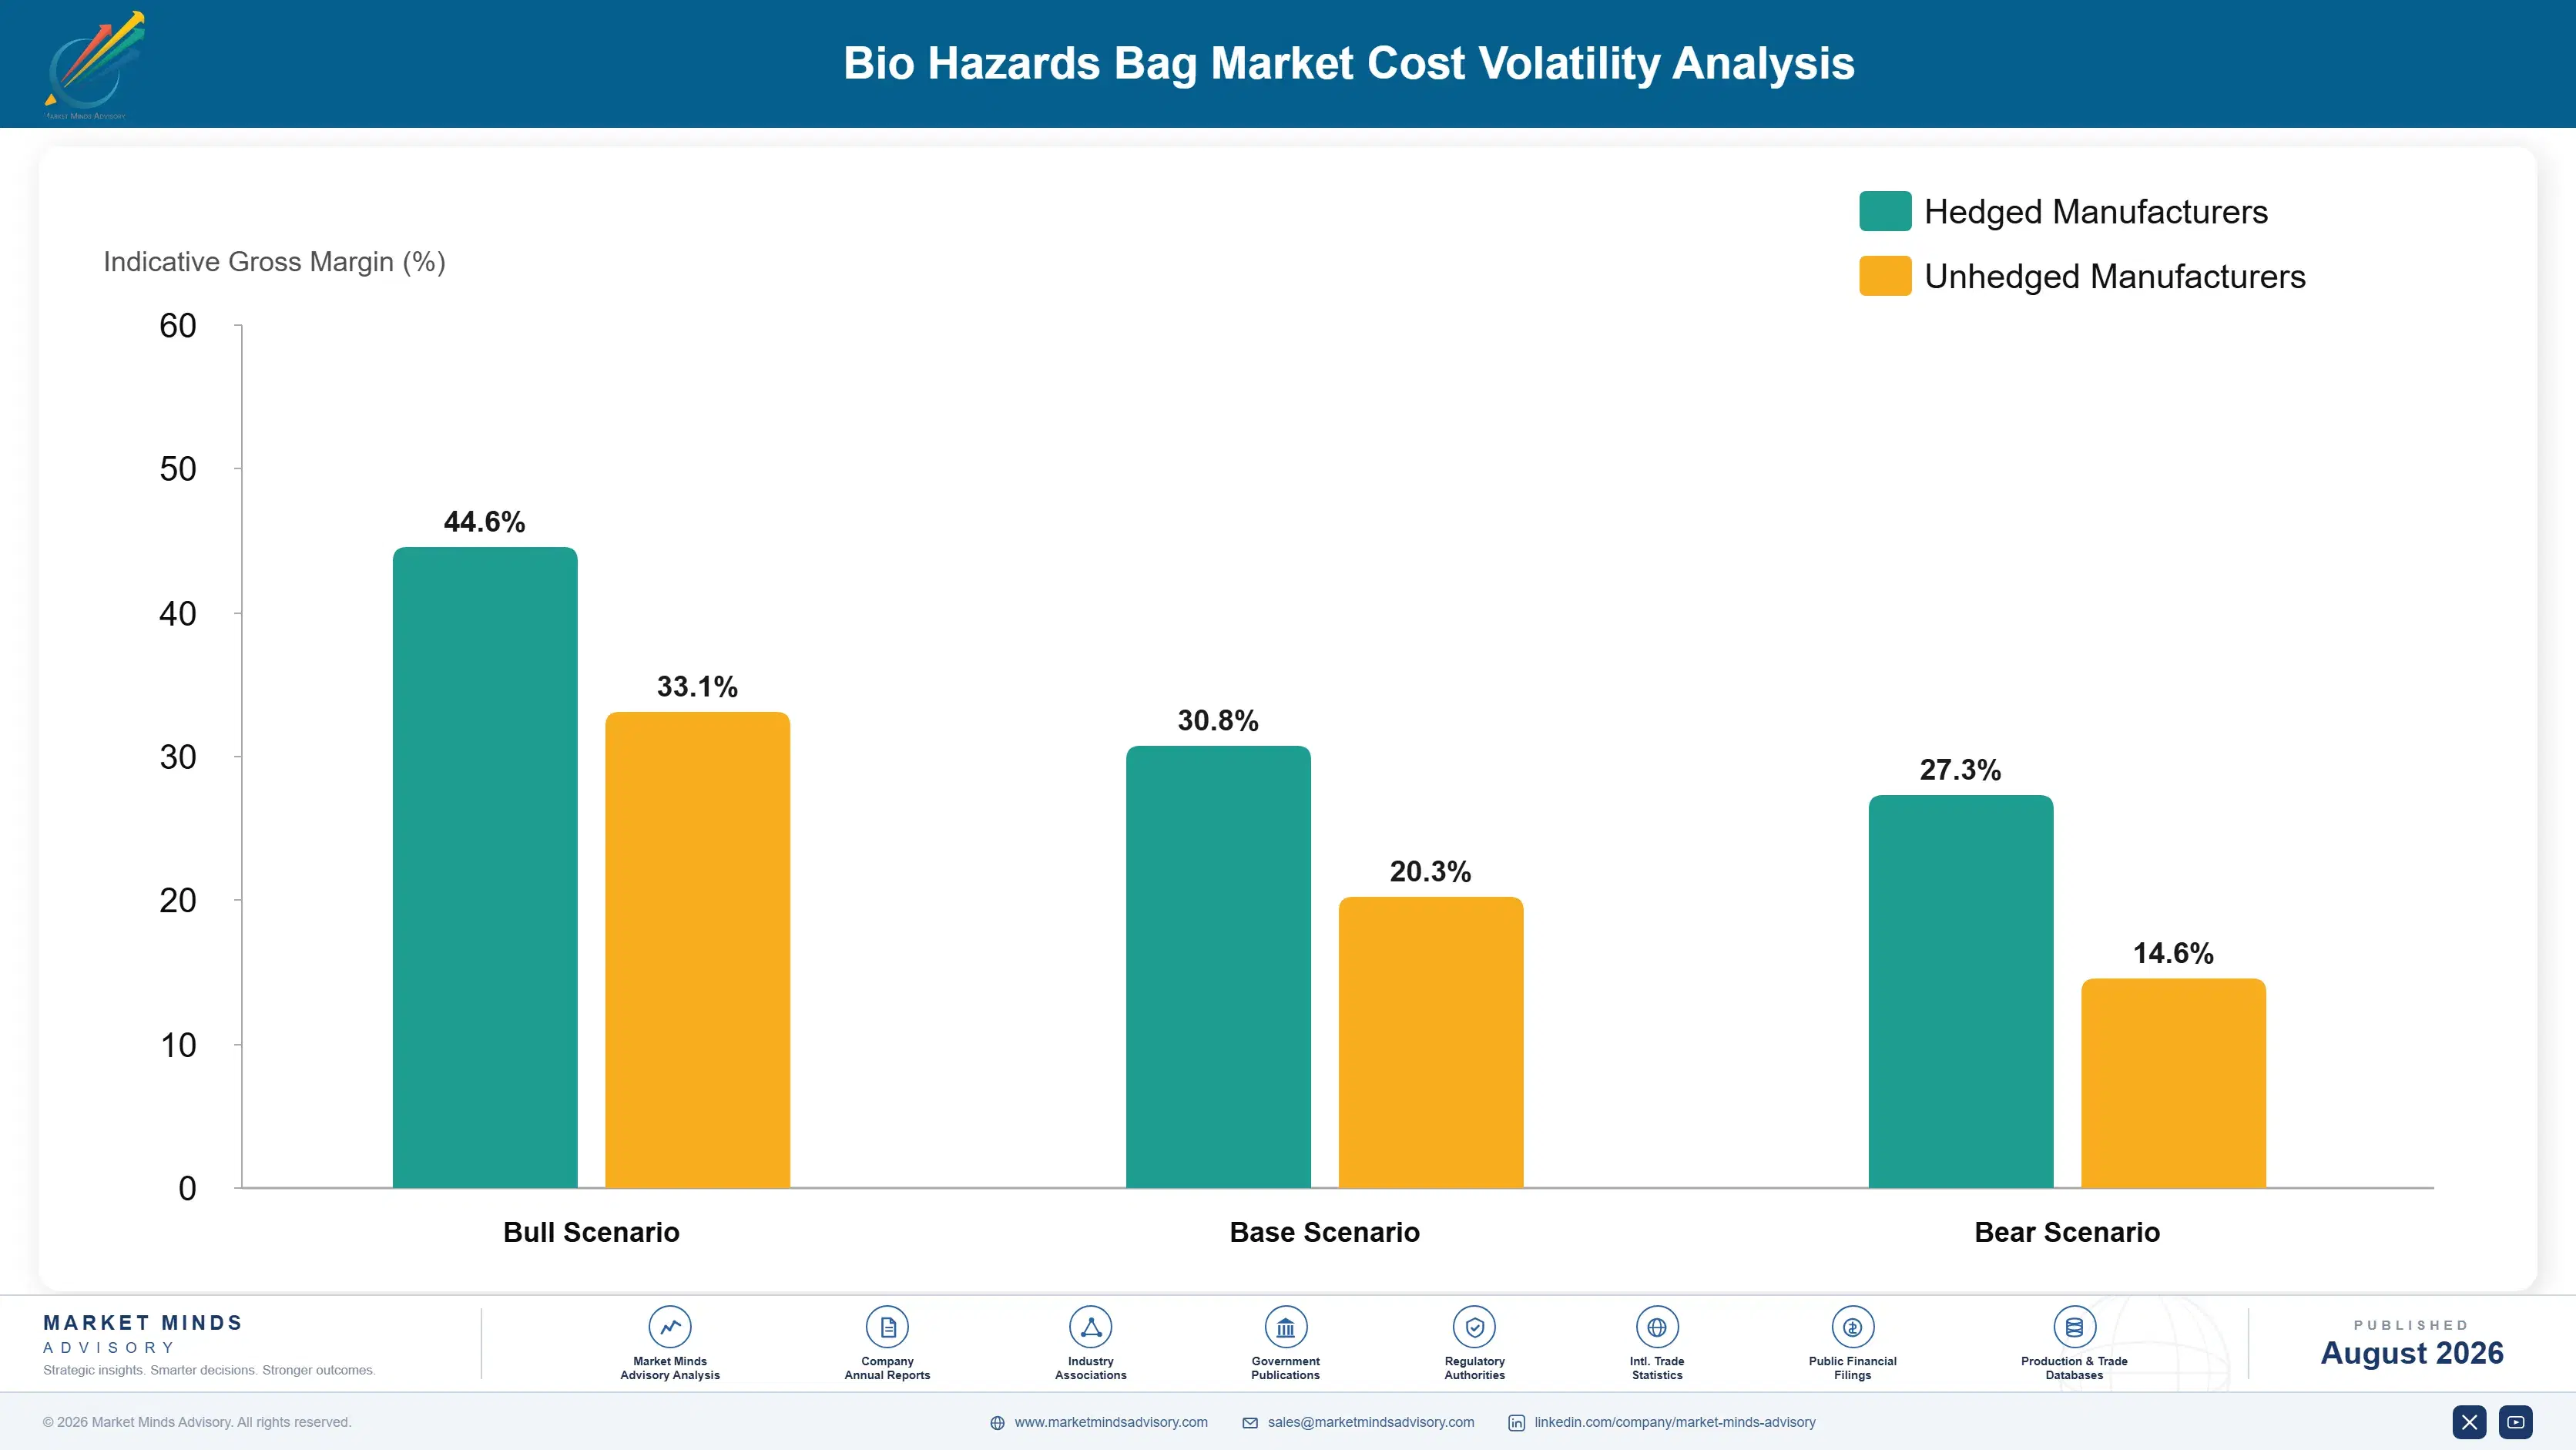
Polyethylene Resin, Pigment, Energy, Freight

Polymer dominates this cost sheet almost completely. Polyethylene resin runs roughly 58% of converted bag cost, purchased on contracts indexed to ethane or naphtha depending on region. Pigment and additive masterbatch for the mandated colour coding adds 6% to 10%, extrusion and conversion energy 9% to 14%, and outbound freight a further 7% to 12% because bags are bulky against their value and ship badly over distance.
The 2021 resin cycle hit this category hard, with North American polyethylene contract prices rising through consecutive months after winter storm outages closed cracker capacity and allocation replaced normal ordering. Berry Global and Novolex both disclosed resin cost pressure across that period. Healthcare supply agreements repricing annually meant converters absorbed most of it, since hospital groups declined mid-term escalation on volumes already committed. Indexation was rare then.

Exposure separates by contract structure and integration rather than by size. A converter with resin indexation passes the largest cost element through mechanically, while one quoting fixed annual prices carries the full swing. Integration back into film extrusion removes a margin layer and improves gauge control at the same time. Geography compounds it, since American converters buy ethane-based polyethylene at costs European production cannot approach.
bio-hazards-bag-market-cost-volatility-analysis-1787332001791

Index healthcare supply contracts to published resin benchmarks

Polymer is nearly three fifths of converted cost and moves on markets no converter influences, so a fixed annual price is a margin gamble rather than a commercial position. Indexation clauses agreed at award convert that into a mechanical adjustment. Hospital groups resist them, though they concede more readily on certified specialty variants than on standard liner.

Downgauge with stronger resin blends and recertify

The only cost lever a converter genuinely controls is polymer weight per bag. Higher-strength resin blends, optimised gusset geometry, and tighter extrusion control can remove real material while holding certified drop and puncture performance. Recertification takes testing time and documentation for every affected variant. The saving is permanent, invisible to the customer, and considerably better than conceding on price.

Manufacture close to the healthcare markets served

Bags are mostly air by volume, so outbound freight runs 7% to 12% of cost and shipping them far destroys the economics. Converting close to major hospital clusters cuts that materially and shortens lead times that group contracts increasingly specify. The trade-off is fragmented scale and higher fixed cost per site above a regional volume threshold.

Portfolio Architecture for Margin Defence

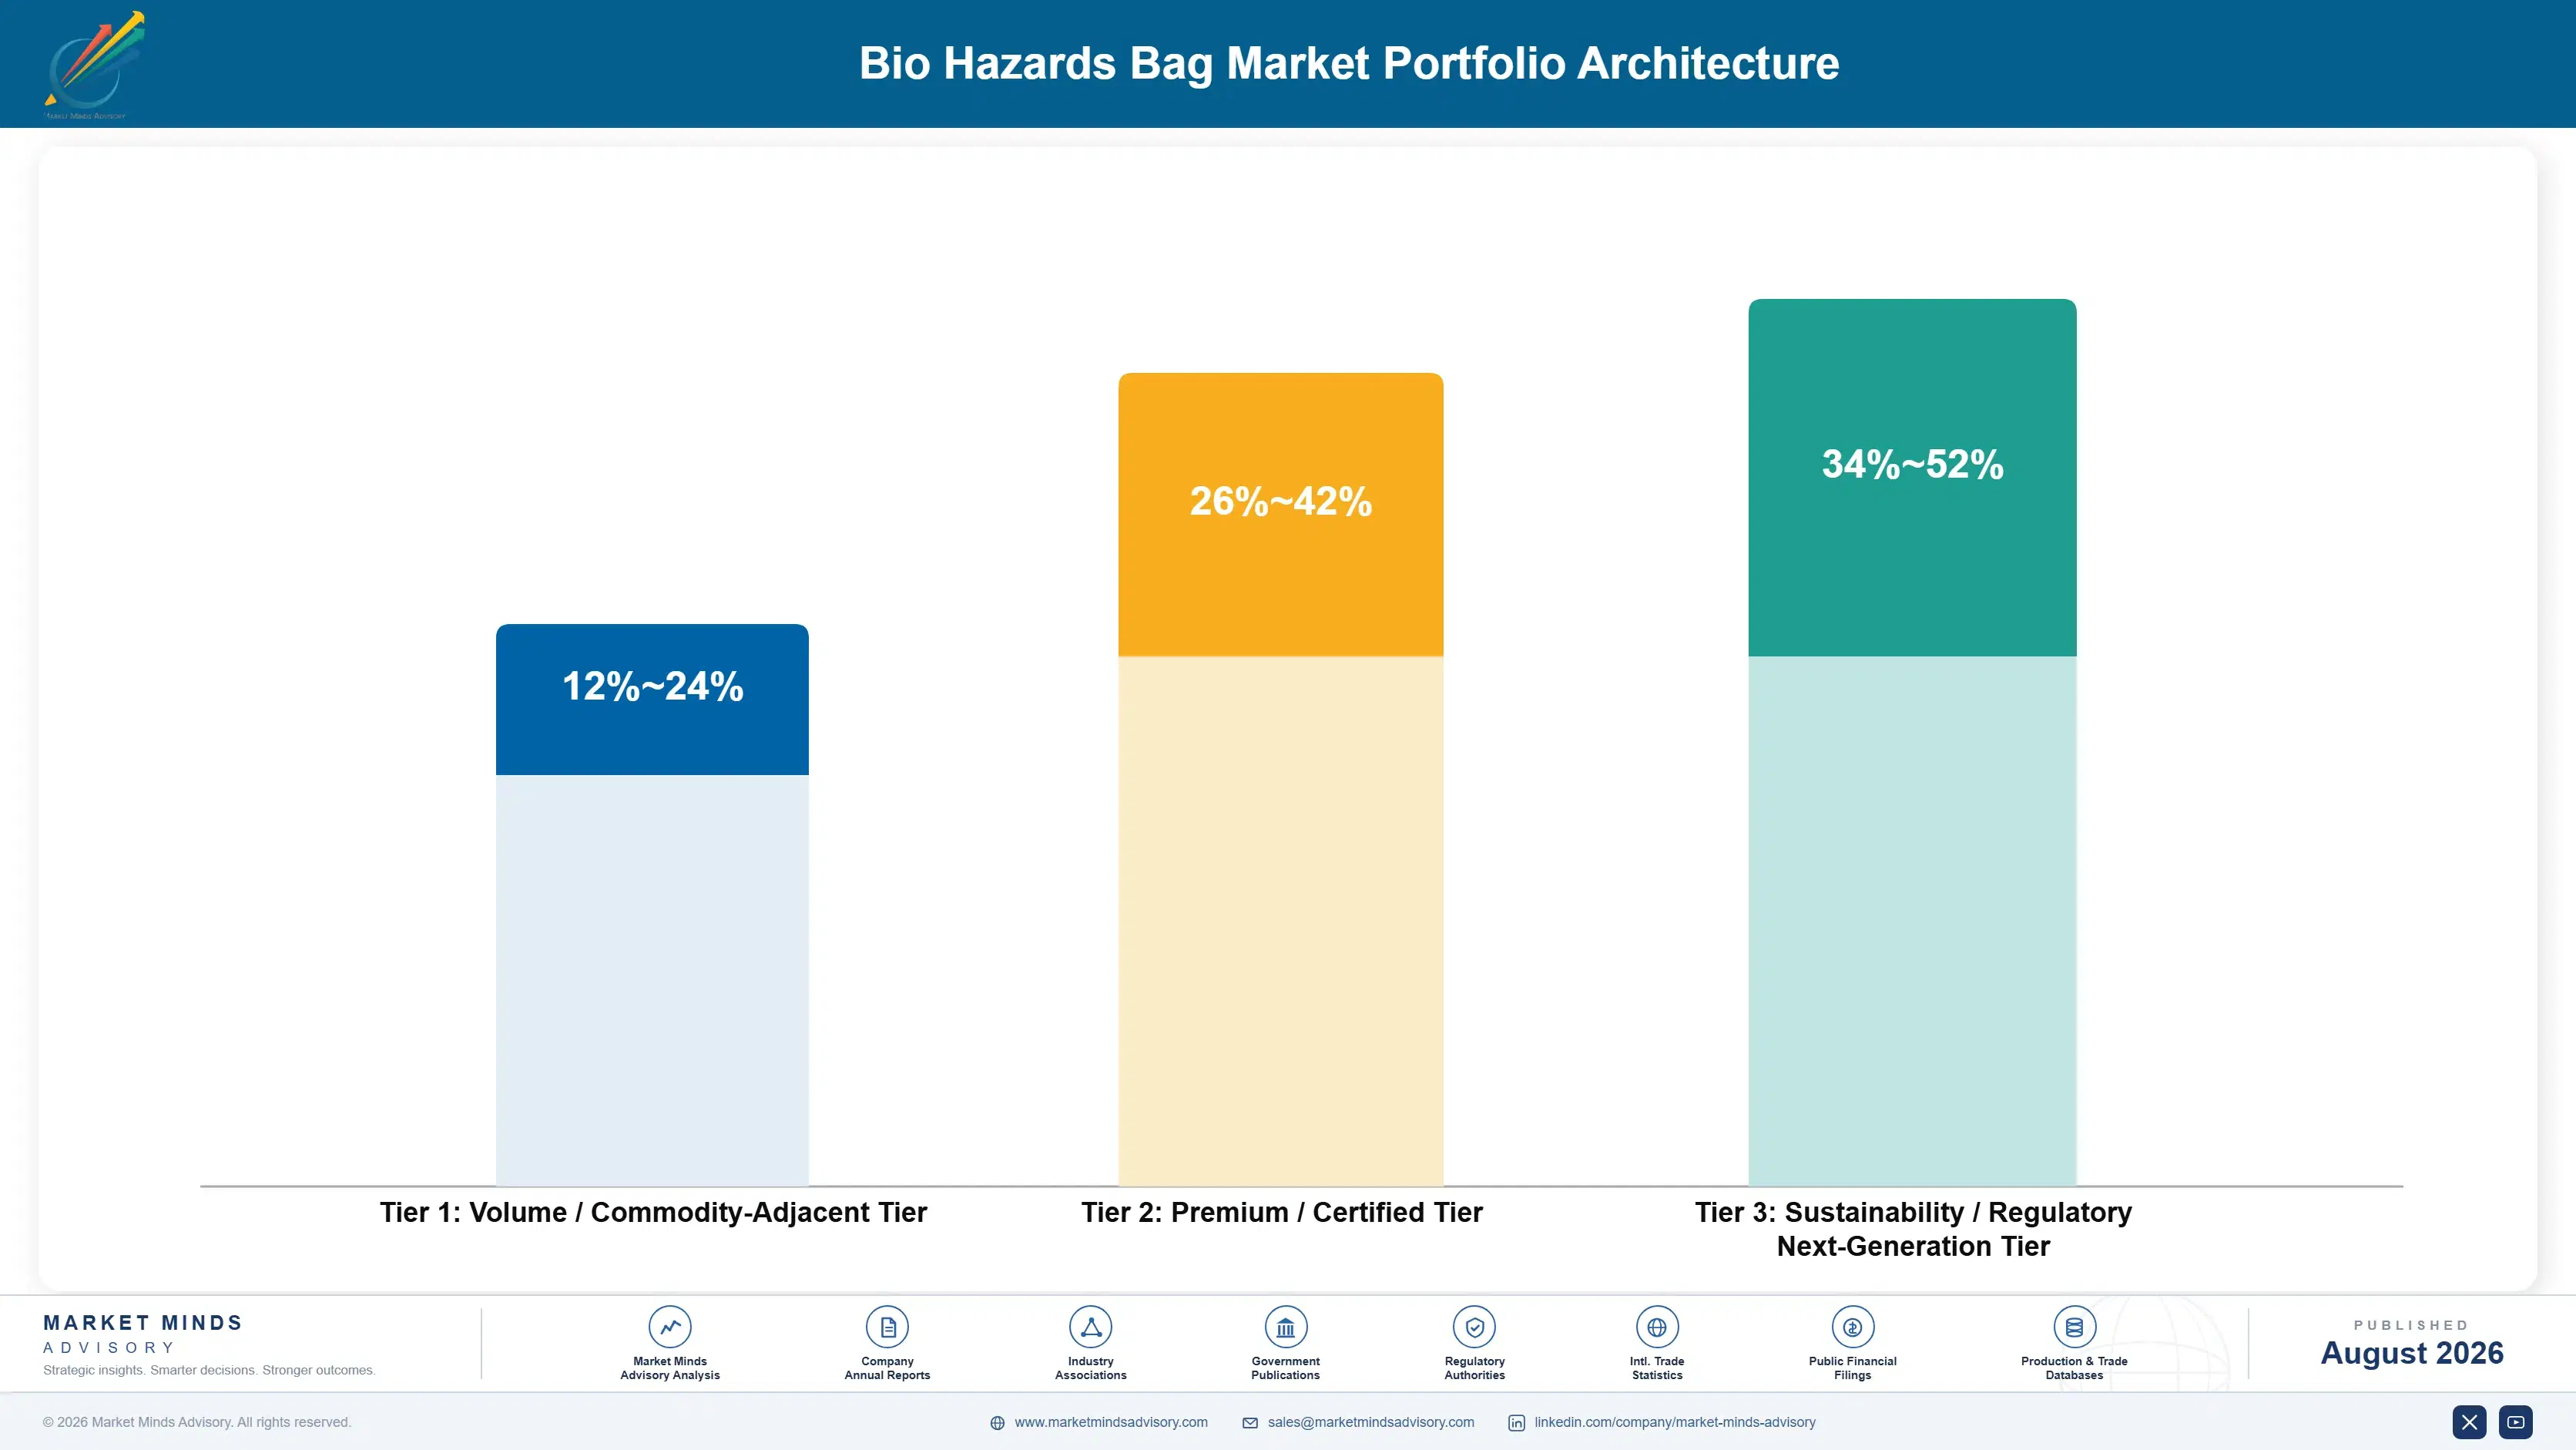
The portfolio splits into three tiers with different economics. Standard infectious waste liners form the volume tier, where a hundred converters can meet the specification and price per thousand decides everything. Autoclavable film and anatomical waste bags earn more because performance ratings and treatment routing narrow the field. Cytotoxic bags and specimen transport formats price against certification scarcity rather than a competing quotation.
The tension runs between commodity liners that fill the extrusion line and certified variants that earn the return. Standard infectious bags keep film and conversion capacity loaded, cover fixed cost on expensive extrusion assets, and hold the group contract through which certified variants sell. Yet they compete against every regional converter and increasingly against Asian supply. Converters handling this well accept thin liner margin for utilisation while directing certification spend toward cytotoxic and specimen formats.

High-value pools concentrate where certification limits competition: cytotoxic bags requiring documented gauge and puncture performance, specimen transport formats with absorbent layers and documentation pockets, autoclavable film validated against sterilisation cycles, and complete certified ranges supplied under one group contract. All four escape the price per thousand comparison. Standard infectious liner sits at the other end, where the tender resets pricing every cycle.

Volume / Commodity-Adjacent Tier

Standard infectious and clinical waste liners sold on price per thousand against many qualified converters. The range is wide because resin indexation position and regional freight economics separate converters considerably at identical selling prices.
Gross Margin: 12-24%

Premium / Certified Tier

Autoclavable sterilisation film, anatomical waste bags, and heavier gauge clinical formats carrying documented performance ratings. The range is wide because certification requirements vary by national waste code and treatment route differs between autoclave and incineration markets.
Gross Margin: 26-42%

Sustainability / Regulatory / Next-Generation Tier

Cytotoxic and chemotherapy bags, specimen transport formats, and recycled-content or thin-gauge certified films. The range is wide because cytotoxic certification is scarce while recycled-content variants still carry unrecovered qualification cost.
Gross Margin: 34-52%
bio-hazards-bag-market-portfolio-architecture-1787332002289

High-value Sub-segments and Strategic Watch-out

Cytotoxic and Chemotherapy Waste Bags

High value and high growth at 9.6%, the fastest class, on oncology volumes and handling rules stricter than anything applied to infectious waste. Heavier gauge, defined puncture resistance, and incineration routing shorten the certified supplier list considerably, which is why specification commands price here. Volumes remain modest overall.
Gross Margin: 34-52%

Specimen and Diagnostic Transport Bags

High value with strong growth at 8.6%, driven by decentralised collection networks rather than hospital activity. Absorbent layers and documentation pockets are specified by transport rules, so a generic sealable bag cannot substitute however similar it looks on the shelf. Reorder frequency is high and order sizes small.
Gross Margin: 30-46%

Infectious and Clinical Waste Bags

The volume core by a wide margin, growing at 6.4% with healthcare activity and squeezed by procurement consolidation and Asian supply together. Tonnage is entirely dependable, but pricing resets downward at every group retender and reusable containers keep taking share. Nobody in the tender defends specification here.
Gross Margin: 12-24%

Autoclavable Sterilisation Bags

The strategic watch-out, growing at 7.8% wherever autoclave treatment displaces incineration on cost and emissions grounds. Film must survive the sterilisation cycle without failing, which is a genuine performance requirement, though treatment route choice varies sharply by national policy. Policy choice rather than performance decides the volume.
Gross Margin: 26-42%

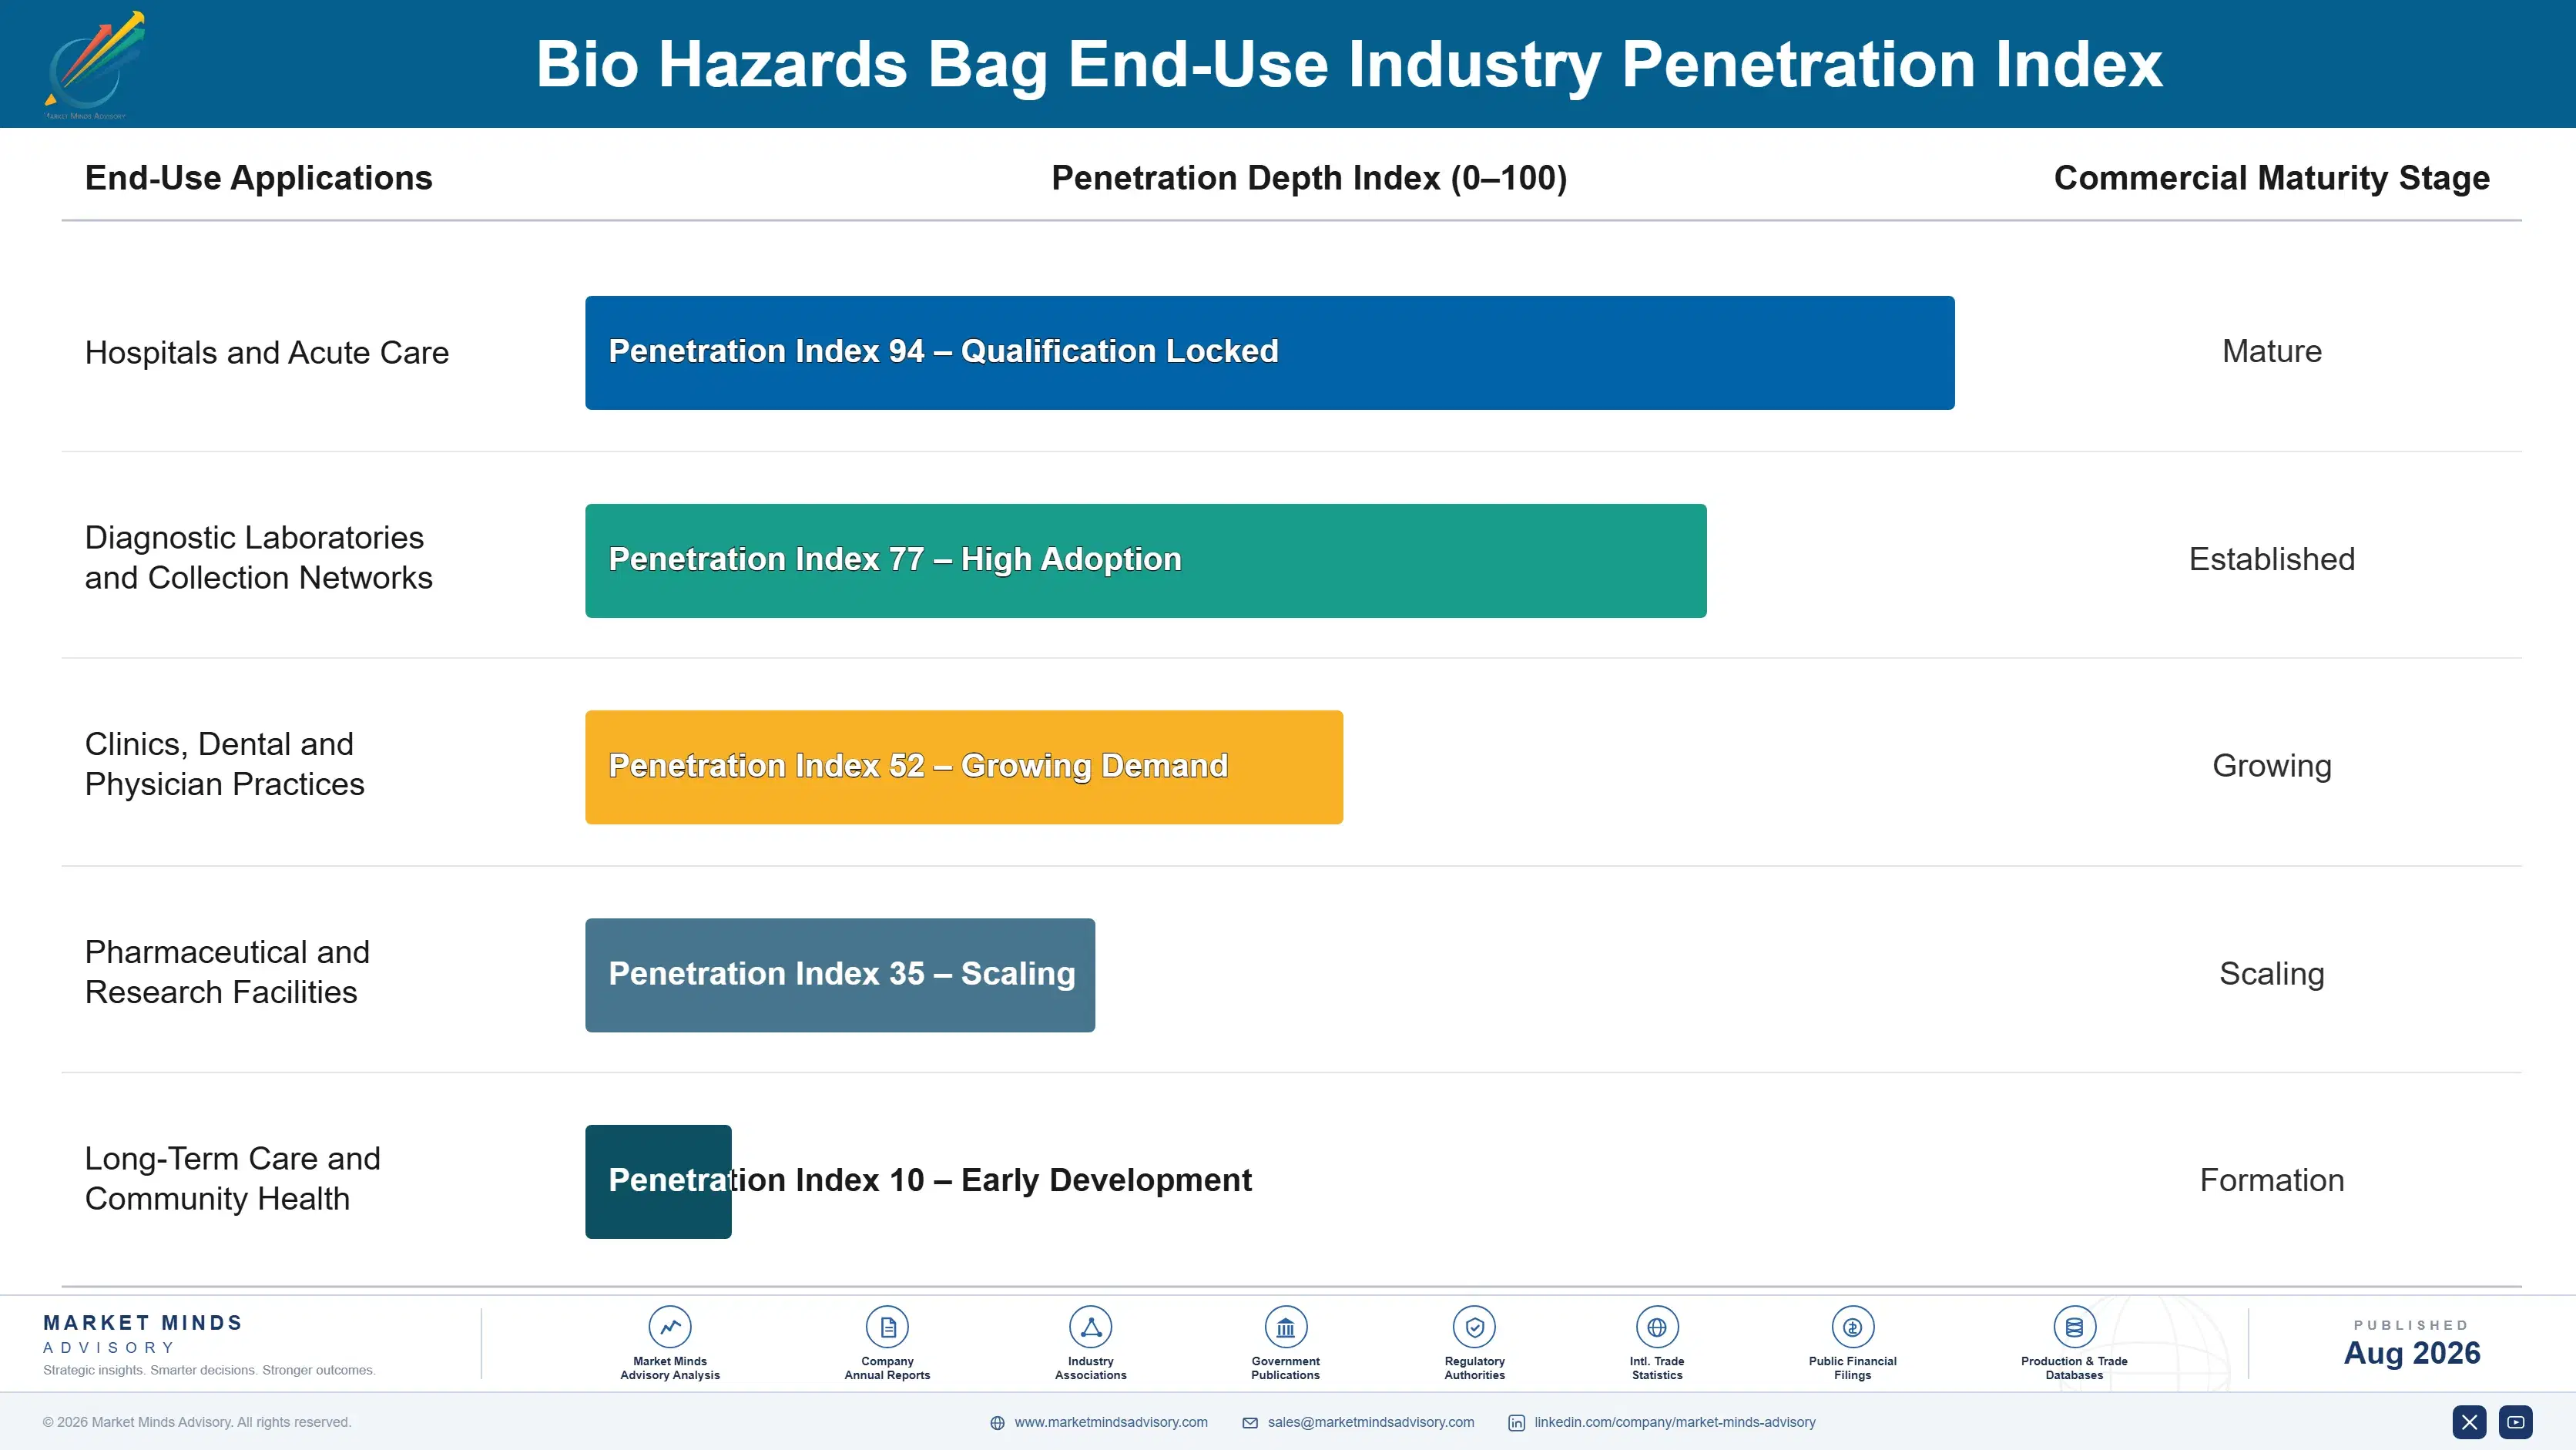
How Waste Contracts Actually Hold

Demand commits at group contract award and repeats as reorders across every site under it. A certified bag written into a consumables agreement has been through specification review, colour code verification, and often a live ward trial, and changing it means retraining staff who select bags under time pressure. That protects incumbents reasonably well. The genuine competitive moments are group retenders and any new waste category a regulator defines.
Stickiness varies by certification depth and error consequence. Cytotoxic bags stick hardest, since documentation ties the product to a treatment route and a failure is a reportable event. Specimen transport formats stick through transport rule compliance. Autoclavable film sticks through validated sterilisation performance. Standard infectious liner sticks least, moving on price at every retender because a hundred converters meet the same specification.

Buyer profiles have shifted from ward managers ordering locally toward group procurement teams contracting across dozens of sites, with infection control holding a veto it rarely uses. Sustainability functions have added a third voice asking about recycled content and gauge. That change rewards suppliers bringing certified breadth, documented failure cost, and material data alongside a price, and penalises those still selling film specification to a purchasing clerk.
bio-hazards-bag-market-end-use-penetration-index-1787332002776

Our Call On Biohazard Bags

These are among the four positions where our research anticipates prominent divergence between winners and laggards over the coming forecast period. Each is grounded in the demand model, the regulatory perimeter, and the announced capacity pipeline.
01 / CERTIFIED RANGE BREADTH

Supply the whole segregated set or lose the contract

A large hospital stocks eight to twenty separate certified variants, and managing that across a group pushes buyers toward whoever can supply the complete set under one agreement. A converter certified only on infectious waste competes for a fraction of the basket and gets displaced whenever the group consolidates its consumables contracts. Certification costs testing and documentation once per variant and then compounds permanently, because breadth is what converts a product supplier into a contracted one that nobody bothers to replace.
02 / INFECTION CONTROL ACCESS

Procurement holds budget, infection control holds consequence

This category prices like commodity film precisely because the function paying for bags is not the function that answers for a waste failure, and those two rarely negotiate together. A supplier who documents failure cost with the waste manager and infection control lead arrives at retender with a specification written around its own product. Contract cycles run 24 to 36 months, so that work must happen long before the tender opens, and suppliers appearing only at tender are quoting into somebody else's specification.
03 / SPECIALTY STREAM MIX

Cytotoxic and specimen formats carry the margin

Cytotoxic bags grow at 9.6% and specimen transport at 8.6% against a whole category growing at 6.8%, and both carry certification requirements that a commodity converter simply cannot meet on its existing tooling. Heavier gauge, defined puncture resistance, absorbent layers, and documentation pockets are commercial barriers rather than product features. Shifting portfolio mix toward these two streams lifts blended margin without requiring any pricing argument on the standard infectious liner volume that keeps the extrusion line loaded through the year.
04 / POLYMER WEIGHT DISCIPLINE

Downgauging beats discounting on every measure

Resin is roughly 58% of converted cost and moves on petrochemical markets no converter influences, which leaves polymer weight per bag as the only real cost lever a supplier genuinely controls. Higher-strength blends, optimised gusset geometry, and tighter extrusion control all remove real material while holding certified drop and puncture performance intact. Recertification takes testing time on every affected variant, but the saving is permanent and entirely invisible to the customer, which no price concession has ever managed to be.

Engagement Snapshot From the Field

A live engagement with an industry participant carrying material or product regulatory and market exposure ahead of a defining policy shift, showing how our research translates into a defensible multi-year portfolio strategy.
MARKET MINDS ADVISORY · CLIENT ENGAGEMENT SUMMARY
Bio Hazards Bag Producer Strategic Portfolio Review and Transition Roadmap 2026·Investment Scenario on Bio Hazards Bag Exposure Evaluation 2025-26
CLIENT PROFILE
A regional hospital group operating 46 sites engaged MMA after an inspection finding on waste segregation at two hospitals. The client reported buying biohazard bags from eleven suppliers across the group with no standard specification, annual bag spend of about USD 3.4 million, and no record of which sites used which certified variant (client-reported, unverified by MMA).
STRATEGIC CHALLENGE
Standardising specification across 46 sites meant retraining staff who select bags under time pressure, and the eleven incumbent suppliers each argued their own colour and gauge conventions. Procurement wanted consolidation for price leverage while infection control wanted it for error reduction, and the two had never agreed a single specification. The board needed one answer before the next inspection cycle.
MMA APPROACH
MMA mapped which certified variants each site actually used against what the national waste code required, which nobody had documented. We costed segregation errors at the two cited hospitals rather than treating the inspection as a compliance event alone. We then tested whether any single supplier could certify the complete range the group needed, since consolidation is worthless if it leaves gaps.
KEY FINDINGS
  1. Sites were using 27 distinct bag specifications where the waste code required only nine, which explained the selection errors better than staff training gaps did (client-reported, unverified by MMA).
  2. Only three of the eleven incumbent suppliers could certify the full nine-variant range, and two of those had never been asked to quote for it.
  3. Segregation errors were concentrated in cytotoxic and anatomical streams, where colour conventions differed between the suppliers serving adjacent wards on the same corridor.
  4. Consolidating to two suppliers rather than one preserved competitive tension at the next retender while capturing most of the available price leverage (client-reported, unverified by MMA).
CLIENT PROFILE
A regional hospital group operating 46 sites engaged MMA after an inspection finding on waste segregation at two hospitals. The client reported buying biohazard bags from eleven suppliers across the group with no standard specification, annual bag spend of about USD 3.4 million, and no record of which sites used which certified variant (client-reported, unverified by MMA).
STRATEGIC CHALLENGE
Standardising specification across 46 sites meant retraining staff who select bags under time pressure, and the eleven incumbent suppliers each argued their own colour and gauge conventions. Procurement wanted consolidation for price leverage while infection control wanted it for error reduction, and the two had never agreed a single specification. The board needed one answer before the next inspection cycle.
MMA APPROACH
MMA mapped which certified variants each site actually used against what the national waste code required, which nobody had documented. We costed segregation errors at the two cited hospitals rather than treating the inspection as a compliance event alone. We then tested whether any single supplier could certify the complete range the group needed, since consolidation is worthless if it leaves gaps.
KEY FINDINGS
  1. Sites were using 27 distinct bag specifications where the waste code required only nine, which explained the selection errors better than staff training gaps did (client-reported, unverified by MMA).
  2. Only three of the eleven incumbent suppliers could certify the full nine-variant range, and two of those had never been asked to quote for it.
  3. Segregation errors were concentrated in cytotoxic and anatomical streams, where colour conventions differed between the suppliers serving adjacent wards on the same corridor.
  4. Consolidating to two suppliers rather than one preserved competitive tension at the next retender while capturing most of the available price leverage (client-reported, unverified by MMA).
RECOMMENDED STRATEGY
Phase 1: Phase 1 (0 to 5 months): Reduce the group to the nine specifications the waste code requires and retire the eighteen variants nobody needed. Phase 2: Phase 2 (5 to 14 months): Award to two suppliers able to certify the complete range, rather than one, preserving tension at the following retender. Phase 3: Phase 3 (14 to 24 months): Standardise colour and labelling conventions group-wide and retrain against the reduced variant set only.
OUTCOME
The client cut bag spend by roughly 19% while reducing specifications from 27 to nine and reported no repeat segregation finding at the following inspection. Standardising colour conventions across adjacent wards removed the confusion driving most cytotoxic errors, and retaining two suppliers preserved negotiating position for the next cycle (client-reported, unverified by MMA).

Frequently Asked Questions

Foundational context covering the market sizes, CAGR, scope, country, region and competition that inform every finding below. This section is provided to cover basics and most often pre-purchase conversations, answered from the MMA Primary Research Dataset.

What is the current size of the Bio Hazards Bag Market?

The global bio hazards bag market is valued at USD 1.1 billion in 2025, covering infectious, autoclavable, cytotoxic, anatomical, and specimen transport bags. Rigid sharps containers and waste disposal services are excluded.

How large will the Bio Hazards Bag Market be by 2036?

The market is forecast to reach USD 2.26 billion by 2036 in the base case, about 1.93 times the 2026 level. That represents incremental value of roughly USD 1.09 billion across the decade.

What is the CAGR for the Bio Hazards Bag Market 2026 to 2036?

The market grows at a 6.8% CAGR in the base case, with bull and bear scenarios at 8.0% and 5.6%. The spread turns mainly on segregation rule extension and reusable container substitution.

Which segment is growing fastest?

Cytotoxic and chemotherapy waste bags grow fastest at 9.6%, about 1.41 times the overall rate, on oncology volumes and stricter handling rules. Specimen transport bags follow at 8.6%.

Who are the major companies in the Bio Hazards Bag Market?

Leading suppliers include Medline Industries, Cardinal Health, Inteplast Group, Novolex, and Daniels Health. Fragmentation is extreme, with the top five holding roughly 24% of biohazard bag revenue.

Which country is growing fastest?

India grows fastest at an 11.4% CAGR, as biomedical waste rules reach smaller clinics and diagnostic centres for the first time. China and Indonesia follow on healthcare capacity expansion.

Report Segmentation Architecture

The full report scope spans multiple orthogonal segmentation dimensions, with cross-tabulated demand data provided for each dimension pair. Coverage extends further to regional breakdowns, trend trajectories, and the competitive detail needed to support segment-level decision-making.

By Regulated Waste Stream Class

  • Infectious and Clinical Waste Bags
  • Autoclavable Sterilisation Bags
  • Cytotoxic and Chemotherapy Waste Bags
  • Anatomical and Pathological Waste Bags
  • Specimen and Diagnostic Transport Bags

By End-Use Industry

  • Hospitals and Acute Care
  • Diagnostic Laboratories and Collection Networks
  • Clinics, Dental and Physician Practices
  • Pharmaceutical and Research Facilities
  • Long-Term Care and Community Health

By Purchasing Channel

  • Group Purchasing Organisation Contract
  • Healthcare Distributor Supply
  • Direct Contract To Hospital Group
  • Waste Service Provider Bundled Supply

By Region

  • North America
  • Western Europe
  • East Asia
  • South Asia and Pacific
  • Latin America
  • Middle East and Africa
  • Eastern Europe

Scope, Methodology, and Coverage

Every figure in this report is reproducible from documented input assumptions. The scope below maps the historical period, the forecast horizon, the segmentation dimensions, and the countries covered, alongside the underlying primary and qualitative methodology.
Historical Period
2020 to 2025
Forecast Period
2026 to 2036
Base Year
2025 (USD billions; MMA Primary Research Dataset, August 2026)
Market Definition
The bio hazards bag market comprises the manufacture and sale of flexible bags, liners, and sealed pouches produced to contain, transport, and withstand treatment of biohazardous and regulated medical waste, valued at manufacturer and converter selling prices to hospitals, laboratories, distributors, and waste service providers. It spans infectious and clinical waste bags, autoclavable sterilisation bags, cytotoxic and chemotherapy waste bags, anatomical and pathological waste bags, and specimen and diagnostic transport bags, together with the colour coding, labelling, and performance certification supplied with them. Rigid sharps containers and rigid clinical waste bins, reusable waste carts and containers, autoclaves and other waste treatment equipment, medical waste collection, haulage and disposal services, general municipal refuse sacks, laboratory consumables not used for waste containment, and thermal shipping systems for temperature-controlled specimen transport are excluded.
Quantitative Units
USD billions (current prices); volume in billions of units and thousand tonnes of converted film
Segmentation Dimensions
By Regulated Waste Stream Class; By End-Use Industry; By Purchasing Channel; By Region
Regions Covered
North America, Western Europe, East Asia, South Asia and Pacific, Latin America, Middle East and Africa, Eastern Europe
Countries Covered
USA, China, Germany, France, UK, Japan, South Korea, India, Australia, Canada, Brazil, Mexico, Indonesia, Vietnam, Thailand, Philippines, UAE, Saudi Arabia, South Africa, Nigeria, Kenya, Turkey, Poland, Netherlands, Italy, Spain, Sweden, Argentina, Colombia, Singapore, and additional markets relevant to this sector
Key Companies Profiled
Medline Industries, Cardinal Health, Inteplast Group, Novolex, Daniels Health, Berry Global, Poly-America, Sarstedt, Corning Life Sciences, Thermo Fisher Scientific, Heathrow Scientific, Dynalon, Bel-Art Products, Elkay Plastics, Revolution Bag, Trinity Plastics, Sekisui Chemical, Greiner Bio-One, Deltalab, Simport Scientific
Quantitative Methodology
Primary survey, n=3,800 respondents, Q4 2025, six countries; demand-side model with trade association cross-validation
Qualitative Methodology
47 expert interviews, Q4 2025; applied to validate demand model assumptions, identify emerging dynamics, and assess competitive positioning
Report Format
PDF and XLSX data workbook (Word format preview document)
Publisher
Market Minds Advisory
Report Code
MMA-2026-PAC-302
Published
August 2026
Contact
sales@marketmindsadvisory.com | www.marketmindsadvisory.com

Purchase the full Bio Hazards Bag Market Report (2026 to 2036).

The full MMA Bio Hazards Bag report sizes the market across five regulated waste stream classes, five end-use settings, four purchasing channels, and seven regions through 2036. It profiles 20 suppliers on a consistent basis of biohazard and regulated medical waste bag revenue, scoring each on certified range breadth, group contract position, resin purchasing scale, and distribution reach. Scenario models quantify how segregation rule extension, procurement consolidation, and reusable container substitution move both volume and achievable margin by stream. The report also includes certified variant mapping against national waste codes, segregation error cost benchmarking, resin indexation contract comparison, and reusable substitution tracking by waste stream.
Five-stream and four-channel market sizing to 2036
Twenty-supplier benchmark on regulated medical waste bag revenue
Certified variant mapping against major national waste codes
Segregation error cost benchmarking across hospital settings
Resin indexation contract comparison against fixed annual pricing
Reusable container substitution tracking by regulated waste stream

Built For The People Who Decide

From boardroom strategy to bench-side execution, this report is read cover-to-cover by leaders shaping the next decade of their industry, turning demand scenarios, market dynamics and valuation benchmarks into decisions.
CXOs/ Presidents/ VPs/ Managers
M&A and Corporate Development
Strategy Teams and R&D Heads
Procurement and Product Directors
Regulatory and Compliance Leaders
Investor Relations and Equity Analysts