Market Minds Advisory
Beverage Premix Market

Beverage Premix Market: Beverage Premix Market. Single-Serve Sticks, Functional Blends, and Milk Tea Formats Reshape Instant Drinks.

Beverage premixes turn coffee, tea, and cocoa into a single-serve stick, but sugar and creamer costs, coffee prices, health scrutiny, and convenience competition decide which brands defend share as buyers switch.

Lead Analyst

Published

September 2026

Make Smarter Decisions with Customized Research Insights

Request a free sample report and evaluate market opportunities, growth trends, and competitive dynamics relevant to your business needs.

2025 MARKET VALUE$22.0BMarket Size 2025
2036 FORECAST VALUE$43.5BBase Case , 2026 to 2036
CAGR 2026 TO 20366.4 %Bull 7.7% / Bear 5.1%
INCREMENTAL OPPORTUNITY$20.1BNet 10- year value creation
EXPANSION MULTIPLE1.86x2036 value over 2026 base
Strategic Levers
M&A Pipeline
Regional Outlook
Country Rankings
Competitive Intelligence
Segmental Deep-dive
Call-Us : 91 93563 13602

Executive Snapshot and Market Trajectory.

Beverage premixes are the invisible workhorse of the drinks industry. A paper stick of coffee, creamer, and sugar feeds offices, vending machines, and commuters across Asia, and a scoop of milk tea powder feeds thousands of shops. The category is old, cheap, and huge, and it is being rebuilt around
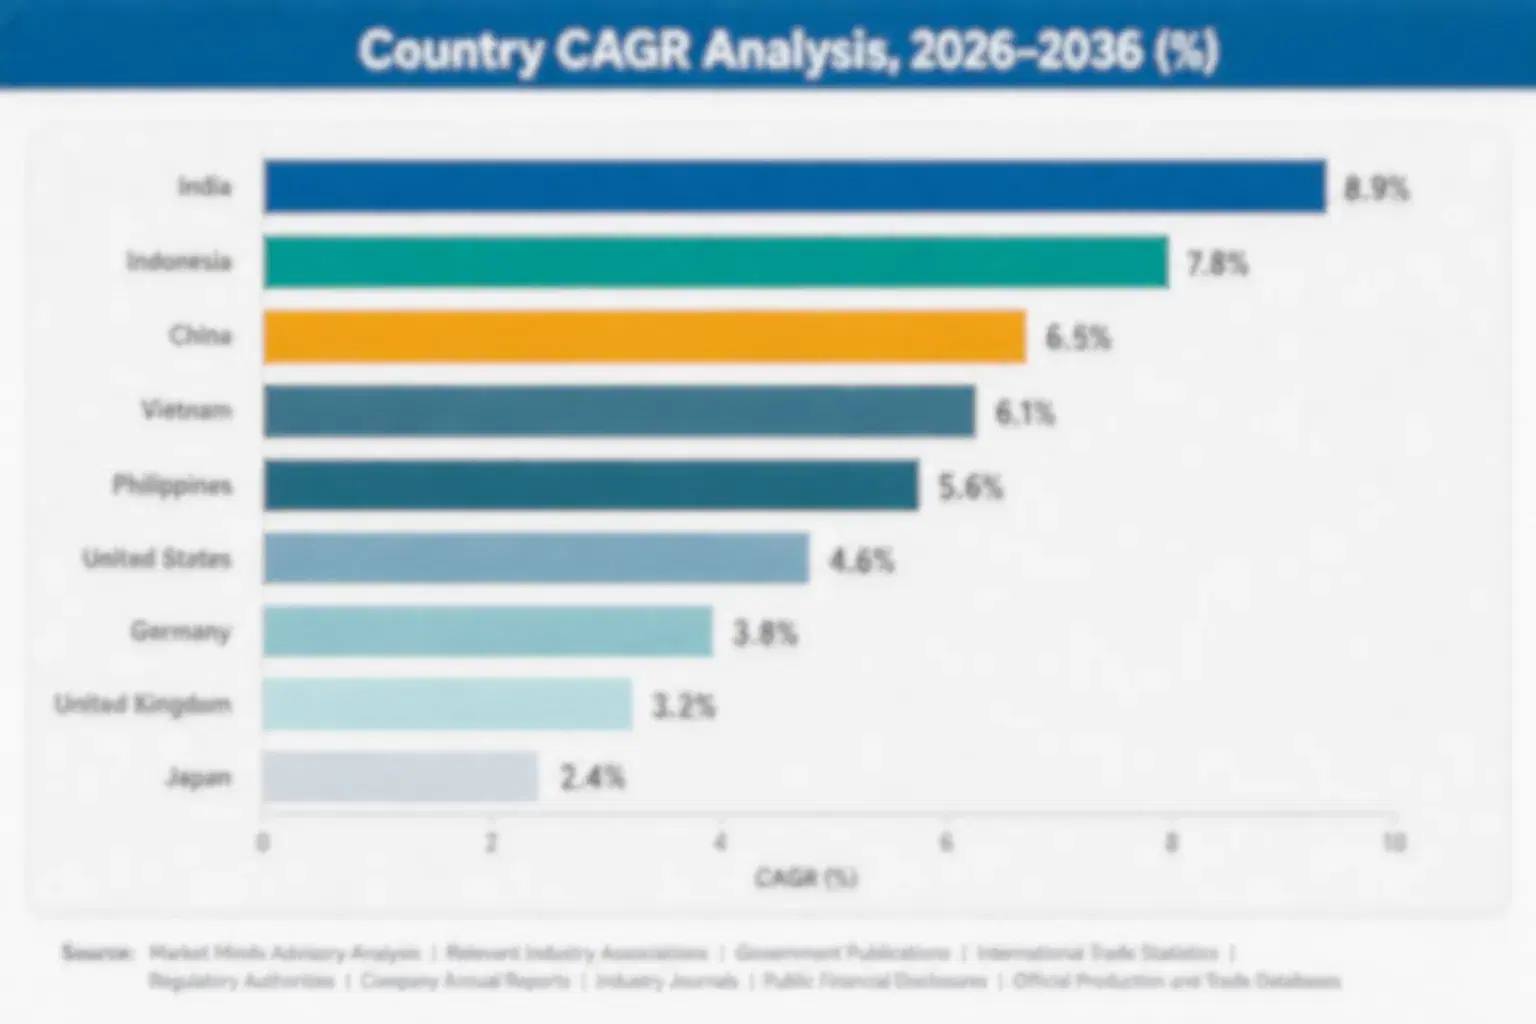
Functional and protein beverage premixes grow fastest, because buyers who love the convenience of a stick want lower sugar and a wellness reason to pay more, while bubble tea and specialty drink premixes follow as tea shops scale across Asia and beyond. South Asia and Pacific and East Asia hold the largest shares, since Indonesia, Vietnam, India, Korea, and China built the habit and the vending and shop channels that feed it. India leads country
The industry is moderately concentrated, with a global food major, a Korean premix leader, beverage groups, and many regional makers competing on taste, price per serving, and channel reach. Sugar, creamer, and coffee and tea costs, packaging prices, and health scrutiny shape recipes and margins, while capsules, ready-to-drink cans, and fresh coffee crowd the same convenience occasions. Majors own brands. Regional makers own price.
Market Definition
Beverage premixes comprise dry and liquid mixes sold in sticks, sachets, tubs, and bulk packs that combine coffee, tea, cocoa, milk, sweetener, or functional ingredients for preparation by adding hot or cold water or milk, including instant coffee premixes, milk tea and chai premixes, functional and protein beverage premixes, cocoa and malted beverage premixes, bubble tea and specialty drink premixes, and fruit and iced beverage premixes, sold through retail, vending, foodservice, and online channels. The scope excludes single-origin instant coffee jars, ready-to-drink cans, capsules, and plain tea bags.
Base Year Value
$22.0B in 2025 (MMA Primary Research Dataset, September 2026)
Forecast Period
2026 to 2036, eleven discrete annual values
CAGR
6.4% base case. Bull 7.7%. Bear 5.1%.
Fastest Growth Segment
Functional and Protein Beverage Premixes: 9.8% CAGR
Fastest Growth Country
India: 10.4% CAGR
Fastest Growth Region
South Asia and Pacific: 8.4% CAGR
Largest Region
East Asia: 26% of 2025 global value
Market Leaders
Nestlé, Dongsuh Foods, Kraft Heinz, JDE Peet's, Unilever. Source: MMA Analysis, company annual reports.
Primary Survey
n=3,800 procurement and R&D decision-makers, Q4 2025, six countries
Methodology
Demand-side build-up, cross-validated against public data, 47 expert interviews

Beverage Premix Market Forecast Scenarios

beverage-premix-market-size-forecast-scenario-1789803098352
From 2020 to 2025, beverage premixes grew through pandemic-era home consumption, the spread of milk tea shops, and stronger demand in Asia and the Middle East, while sugar, dairy, coffee, and packaging costs spiked in 2022 and squeezed margins. Growth ran slightly below today's pace, and price rises supplied a large part of the reported value gain. Buyers reward consistency over novelty.
The base case rests on three commercial mechanisms. First, functional and protein premixes gain distribution as low-sugar and wellness formulas give convenient sticks a reason to trade up. Second, bubble tea and specialty drink premixes grow through shop chains, cafes, and foodservice as tea shops scale across Asia and beyond. Third, India, Indonesia, and Africa add volume as modern retail and vending expand beyond mature markets. Each mechanism compounds steadily, and none needs a breakout year.
The bull case needs coffee, sugar, and dairy prices to stabilise, which would let makers scale promotions and hold margins while premium blends widen the mix. The bear case is a spike in raw material and packaging costs combined with sugar levies, which would squeeze margins and push buyers to cheaper unbranded premixes. Trial matters more than advertising.

Raw Material Costs, Channel Reach, and Sugar Reduction Decide Premix Winners

Beverage premixes cover several methods. Producers spray-dry or agglomerate coffee, tea, or cocoa extracts, blend them with sugar, creamer, milk powder, and flavours, and fill sticks, sachets, and tubs under dry conditions. Milk tea makers add tapioca-friendly bases, and functional lines add protein, fibre, or vitamins to the mix. Supply reliability decides renewal. Margins follow scale and discipline.
MARKET CONCENTRATION48% CR5Leading five groups hold a large combined share
COFFEE PREMIX SHARE39%Portion of value sold as instant coffee premixes
SUGAR AND CREAMER SHARE38%Portion of cost of goods taken by sugar and creamers
PACKAGING COST SHARE18%Portion of cost of goods taken by sticks and sachets
FOODSERVICE CHANNEL SHARE27%Portion of value sold through shops, vending, and offices
AVERAGE STICK PRICE$0.15Typical retail price for a single premix stick
Raw material control and channel reach decide value. Buyers judge premixes by taste, price per serving, and how consistent the cup is, so a maker needs stable coffee, tea, and creamer supply and reliable stick packaging. Premium brands use higher coffee content and real milk, while volume brands use higher creamer and sugar for cost. Makers with supply contracts, vending and shop relationships, and clear labelling win because a mix that tastes
Buyers judge premixes on taste, sugar level, price per serving, and convenience. Offices, vending operators, and tea shops want bulk packs with consistent performance, while households and commuters want boxes of sticks with clear branding. Price sensitivity is high in emerging markets and moderate elsewhere, since shoppers compare with fresh and ready-to-drink options, which pushes makers toward lower sugar, functional blends, and premium sticks
"A premix stick is one of the cheapest ways to sell a hot drink and one of the hardest to differentiate, and the makers that survive will be the ones that control the raw materials and the shop or vending relationship. The winners will cut the sugar before regulators do. Raw material and channel control, not flavour, are the constraints most makers underestimate."
Senior Analyst, Food and Beverage Practice · MMA Instant Beverage Premixes for Coffee Practice · September 2026

Market Trends

Functional and Protein Premixes Add Wellness to Convenient Sticks

Makers now sell premixes with protein, fibre, collagen, and adaptogens in sticks and tubs, using coffee and tea bases and low sugar to hold taste while adding a reason to pay more. Functional premixes sell at 30% to 90% above standard 3-in-1 sticks, and offices, gyms, and online retail build trial. Producers publish ingredient doses and avoid unsupported claims, and retailers give shelf space beside supplements and specialty coffee. The trend broadens premixes beyond price-led buyers and gives makers a route to higher margins in mature markets. Customers review suppliers every season.
Market Impact: vending and shops hold 27% value

Bubble Tea and Specialty Drink Premixes Scale With Shop Chains

Tea shop chains and cafes now buy milk tea bases, fruit tea powders, and specialty drink premixes in bulk, using consistent powders to make thousands of drinks a day with low training. Premixes cut ingredient cost per cup by 20% to 40% and reduce waste, and chains use custom blends to protect brand taste. Suppliers add technical support, flavour launches, and logistics, and small shops use standard blends to compete on price. The trend ties premix demand to shop growth in Asia, the Middle East, and North America. Taste consistency protects repeat purchase.
Market Impact: India premix sales grow 10%+ yearly

Market Opportunities and Growth Drivers

Convenience, Vending, and Shop Growth Sustain Premix Demand

Workers, commuters, and students across Asia, the Middle East, and Africa rely on sticks and sachets for a fast hot drink, and offices, vending machines, and convenience stores place premixes where impulse and routine purchases happen. Milk tea and specialty drink shops expand across cities and depend on bulk premixes for consistent taste. Makers that offer flavour variety, portion control, and reliable supply win contracts, and premixes keep buyers who might otherwise choose capsules or fresh coffee at higher cost. Repeat purchase follows because a mix that tastes the same each morning becomes routine.
Market Impact: sugar, creamer, coffee take 60%

Rising Incomes and Retail Extend Premixes Across India and Africa

India, Nigeria, Kenya, Vietnam, and Indonesia have seen premixes grow as urban incomes rise, modern retail and vending expand, and tea and coffee habits spread to younger buyers. Global makers use distribution networks to launch sticks and sachets at low price points, and local producers adapt sweetness, spice, and pack sizes to local tastes, since chai and sweet coffee mixes already suit household habits in many of these markets. Premixes take an established share of hot beverages in parts of Asia and Africa. Makers that adapt price and pack size win volume.
Market Impact: sugar levies cover 50+ jurisdictions

Market Restraints and Challenges

Sugar, Creamer, Coffee, and Tea Costs Squeeze Premix Margins

Sugar and creamers take about 38% of cost of goods, and coffee, tea, and cocoa a further 22%, and each can move sharply within a year. Sugar follows weather in Brazil and India, palm-based creamer follows edible oil markets, and coffee and tea follow harvests and freight. The root cause is agricultural and commodity exposure. Mitigations include forward contracts, reformulation, blended sources, and smaller sticks, though small makers cannot secure long contracts and buyers resist price rises, so margin recovery lags cost increases by several months. Cost control separates leaders from followers.
Market Impact: functional premixes sell 30-90% above standard

Sugar Levies and Health Scrutiny Cap Growth in Mature Markets

Traditional 3-in-1 sticks contain 60% to 70% sugar and creamer by weight, and sugar levies, front-of-pack labels, and health campaigns in Korea, Malaysia, Mexico, and other markets push buyers toward low-sugar options. Palm oil creamers also face sustainability scrutiny. The root cause is high sugar content and public health policy. Makers respond with reduced-sugar recipes, plant-based creamers, and functional blends, though these steps change taste, raise cost, and can slow sales in price-sensitive channels. Clear labelling builds buyer trust. Small brands feel every cost swing. Distribution reach compounds over time. Buyers reward consistency over novelty.
Market Impact: premixes cut cup cost by 20-40%
3 additional market trends, 2 additional growth drivers, and 4 additional restraints and challenges are covered in the full report. Contact sales@marketmindsadvisory.com to access the complete intelligence.

Segment CAGR and Growth Architecture

Beverage premixes are segmented by base beverage and function, which shows where habit strength, sugar policy, and pricing power sit. Six segments cover instant coffee premixes, milk tea and chai premixes, functional and protein premixes, cocoa and malted premixes, bubble tea and specialty drink premixes, and fruit and iced beverage premixes. Two segments grow fastest on different drivers.
beverage-premix-market-market-share-analysis-1789803098630

Functional and Protein Beverage Premixes

Functional and protein beverage premixes are the fastest-growing segment, at 9.8% a year, about 1.53 times the overall market rate. Buyers who value the convenience of a stick want lower sugar and a wellness reason to pay more, and makers use protein, fibre, collagen, and adaptogens with coffee and tea bases to hold taste. Prices sit 30% to 90% above standard 3-in-1 sticks, and margin per serving is strong. Taste and claim credibility are the main constraints, since added ingredients can change flavour and regulators limit health statements, so makers adjust recipes and wording. Offices, gyms, and online retail add reach, and repeat purchase builds when a mix delivers taste and function together.
CAGR 9.8%

Bubble Tea and Specialty Drink Premixes

Bubble tea and specialty drink premixes grow at 8.6% a year, because milk tea shops and cafes scale across Asia, the Middle East, and North America, and chains depend on consistent powders that cut ingredient cost per cup by 20% to 40% and reduce training. Suppliers sell milk tea bases, fruit tea powders, and custom blends in bulk, and technical support helps chains launch seasonal flavours. Sugar scrutiny and shop churn are the main constraints, since sweet drinks face health pressure and small shops open and close quickly, so suppliers develop lower-sugar bases and credit control. Suppliers with strong chain relationships win multi-year supply contracts, and limited seasonal flavours keep shops returning without heavy advertising budgets.
CAGR 8.6%
Full segment breakdown across 6 segments available in the complete report.

Regional Architecture and Country Demand Map

Beverage premix value follows sachet habits, shop and vending channels, and sugar policy. East Asia and South Asia and Pacific hold the largest shares through Korean coffee sticks and Southeast Asian and Indian mixes, North America follows through cocoa and foodservice, and South Asia and Pacific grows fastest.

South Asia and Pacific

South Asia and Pacific holds 24% share, above its usual band, because Indonesia, Vietnam, Malaysia, India, and the Philippines built the world's largest 3-in-1 coffee and chai premix habits through sachet sales, kiosks, and modern trade, so the region holds a larger share than its size elsewhere suggests. Nestlé, Mayora Indah, Trung Nguyen Legend, Vinacafe, Indofood, and Tata Consumer Products lead, and mom-and-pop stores, supermarkets, and vending carry the range. India grows fastest through chai premixes. Growth runs above the global rate as incomes rise. Price sensitivity, sugar scrutiny, and commodity costs restrain margins. Trial matters more than advertising. Supply reliability decides renewal. Margins follow scale and discipline. Customers review suppliers every season.
Share: 24% | CAGR: 8.4% (2026 to 2036)

East Asia

East Asia holds 26% share, with South Korea, China, Japan, and Taiwan leading through coffee mix sticks, milk tea powders, and strong shop and vending channels. Dongsuh Foods, Namyang Dairy, Ajinomoto, Suntory Holdings, and Chinese milk tea suppliers lead, and convenience stores, offices, and tea shop chains carry the range. Korea supplies the world's best-known coffee mix stick. China grows through bubble tea chains. Growth runs above the global rate. Sugar scrutiny, health campaigns, and competition from fresh coffee restrain margins across the region. Taste consistency protects repeat purchase. Cost control separates leaders from followers. Clear labelling builds buyer trust. Small brands feel every cost swing. Distribution reach compounds over time. Buyers reward consistency over novelty.
Share: 26% | CAGR: 7.3% (2026 to 2036)
Regional intelligence for 5 additional markets available in the complete report: North America, Western Europe, Latin America, Middle East and Africa, Eastern Europe. Contact sales@marketmindsadvisory.com.
beverage-premix-market-country-cagr-analysis-1789803098939

Four Margin Routes for Beverage Premix Makers

Margin in beverage premixes comes from functional lines, chain supply contracts, raw material security, and pack flexibility rather than volume alone. The routes below apply to global food groups, Asian premix leaders, and regional makers, and each can start inside one planning cycle, with clear measures in gross margin points, price per serving, and retained customers.

Launching Functional and Protein Premixes Ahead of Retail Resets

Functional and protein premixes sell at 30% to 90% above standard 3-in-1 sticks, so makers that launch protein, fibre, and collagen lines in sticks and tubs report gross margin gains of 5 to 8 points on those lines. Producers that publish doses, hold taste, and win office, gym, and online listings avoid the doubts that hurt trial. Retailers place products beside supplements and specialty coffee, and vending operators add volume. Pilot ranges in two supermarket chains and one office supplier typically confirm demand within one season, before national listings and export orders follow.
Market Impact: functional lines lift blended gross margin by 5-8 points

Winning Multi-Year Supply Contracts With Tea Shop and Cafe Chains

Tea shop and cafe chains buy premixes in bulk and rarely change suppliers once a blend defines their taste, so makers that supply custom blends, technical support, and reliable logistics win contracts that last three to five years. Suppliers that partner with chains report volume gains of 12% to 20% in partner accounts and gross margin above 30% on custom blends. Small makers can start with one chain and one blend. Contracts should fix specifications, minimum volumes, and price adjustment terms, and suppliers should track cup cost so that chains see savings.
Market Impact: chain contracts add 12-20% volume per partner account

Contracting Sugar, Creamer, and Coffee Early to Stabilise Costs

Sugar, creamer, coffee, and tea take about 60% of cost of goods, and prices can move 15% to 30% within a year when weather, edible oil, or freight markets tighten. Makers that sign 12-month forward contracts, dual-source creamer from two suppliers, and hold safety stock of packaging cut cost swings by roughly half. Buyers accept price changes slowly, so contracts matter more than list price increases, and stable supply lets makers hold gross margin near 28% across ranges. Makers that skip contracts pay 10% more in volatile years and lose promotional slots.
Market Impact: forward contracts halve cost swings and hold 28% margin

Adding Low-Sugar Recipes and Smaller Packs to Defend Share

Sugar levies and health campaigns push buyers toward lower-sugar sticks, and reduced-sugar recipes with 30% to 50% less sugar, plant-based creamers, and smaller five-stick trial packs lower the barrier for buyers who want change without losing taste. Makers that add low-sugar sticks alongside classic mixes report volume gains of 15% to 25% among new buyers without diluting core sales. Contract fillers avoid capital costs of $1 million or more, and shared filling agreements spread fixed cost. Makers should keep classic sticks for price shoppers, use low-sugar lines for retail, and book filling slots months ahead.
Market Impact: low-sugar sticks add 15-25% volume among new buyers

Who Controls the Margin Pool

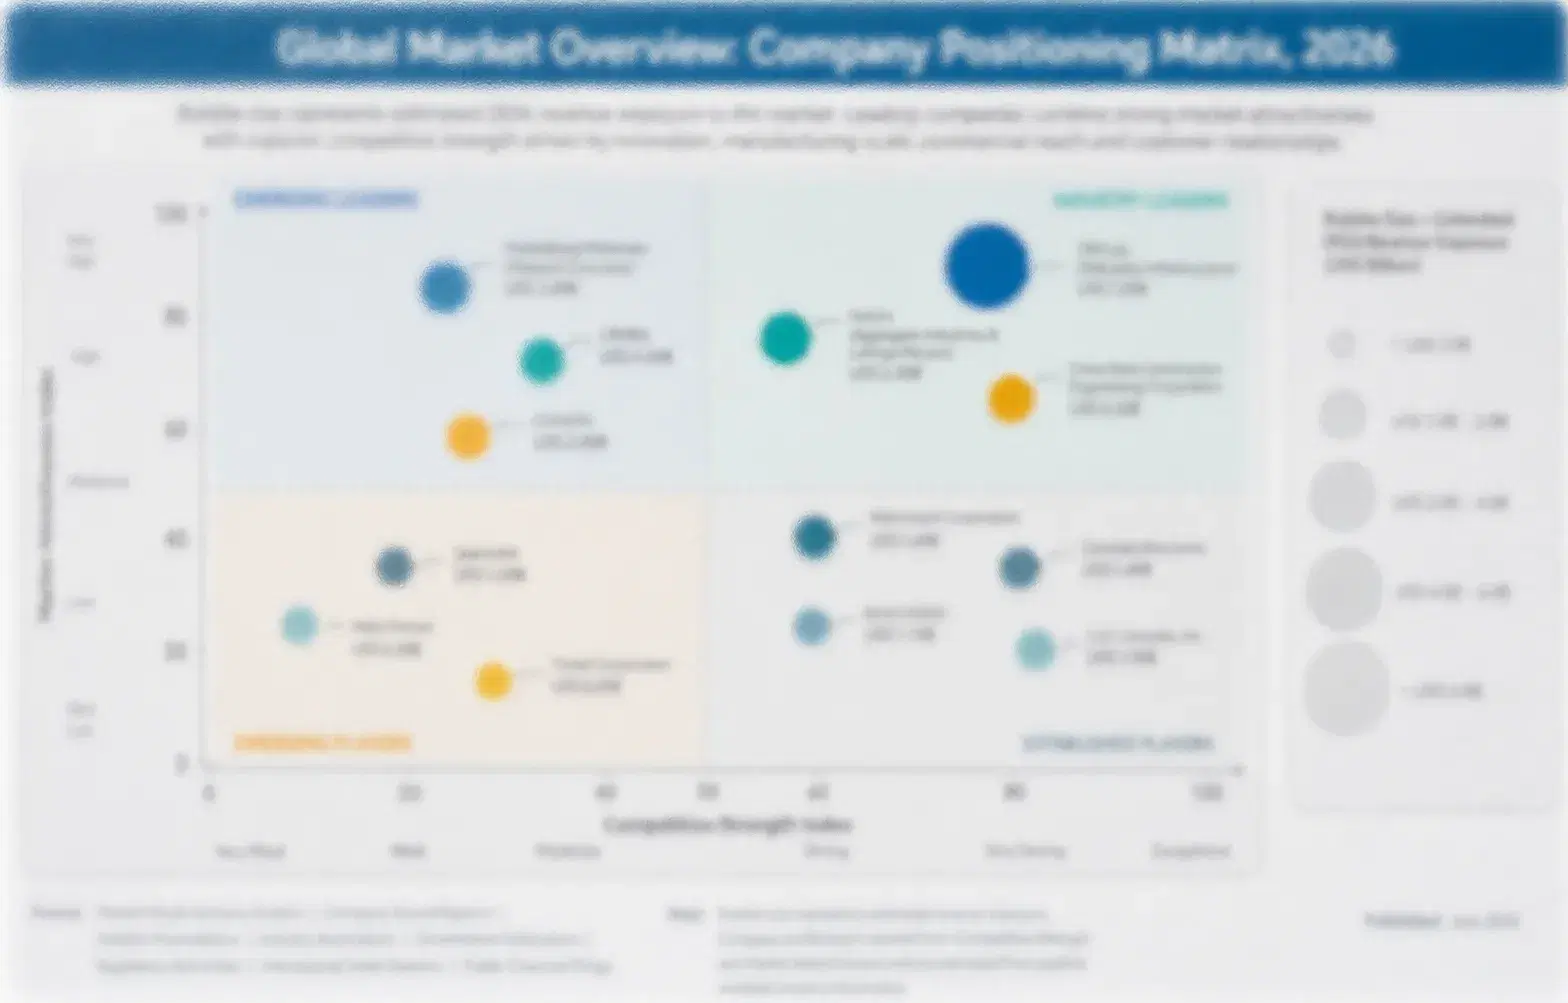
The beverage premix industry is moderately concentrated, with a CR5 of 48%, and many regional makers, private label suppliers, and shop-focused blenders sit outside the leading five. This assessment measures participants on estimated premix sales value, held constant across all players. Nestlé leads through its coffee and malted drink brands and global distribution, while Dongsuh Foods, Kraft Heinz, JDE Peet's, and Unilever follow, with a clear gap between
Competition runs on four dimensions today: taste and consistency, price per serving, channel reach in vending and shops, and sugar level. Global groups win on brand and distribution scale, while regional makers win on price and local flavour. Private label copies standard 3-in-1 sticks quickly, so premiums outside functional, low-sugar, and custom blend ranges erode within a year, and price competition appears at retailer range reviews and in

Emerging pressure comes from capsules, ready-to-drink cans, and fresh coffee chains, which compete for the same convenience occasions. Rankings shift where a maker secures raw materials, wins chain contracts, or launches a low-sugar line. Regional makers in India, Vietnam, and Indonesia can move up quickly, since local taste knowledge matters more than global scale.
beverage-premix-market-company-positioning-matrix-1789803099222

Competitive Moat and Risk Dimensions

NESTLÉ

Moat: Brand Portfolio and Distribution Scale

Nestlé sells Nescafé mixes, Milo, and other premix brands through supermarkets, kiosks, and vending in more than 180 countries, and its distribution network, purchasing scale, and brand trust give it reach that no regional maker can match. Its technical teams support foodservice customers with custom blends, and its research supports fast launches of low-sugar and functional variants.
NESTLÉ

Risk: Sugar Scrutiny and Portfolio Size

Nestlé faces sugar scrutiny on malted and sweet coffee mixes, and health campaigns and levies push buyers to lower-sugar options. Its size slows launches against agile regional makers, while coffee, sugar, and packaging cost spikes squeeze margins and private label copies core flavours at lower prices. Trial matters more than advertising.
DONGSUH FOODS

Moat: Coffee Mix Stick Leadership

Dongsuh Foods sells the Maxim coffee mix stick in Korea and export markets, and its brand recognition, stick format innovation, and convenience store and office channel presence give it a dominant position in Korean instant coffee. Its focus on mixes, flavour launches, and export partnerships builds volume, and its scale in coffee sourcing lowers cost against smaller makers.
DONGSUH FOODS

Risk: Narrow Focus and Sugar Rules

Dongsuh depends on the Korean market and on sweet coffee mixes, so sugar scrutiny and fresh coffee culture threaten volume. Coffee and packaging cost spikes squeeze margins, while low-sugar competitors and capsule brands attract younger buyers and export growth faces strong local brands. Supply reliability decides renewal.

Players Tracked

Prominent Players

Nestlé
Dongsuh Foods
Kraft Heinz
JDE Peet's
Unilever

Other Key Players

Trung Nguyen Legend
Vinacafe
Mayora Indah
Indofood
Tata Consumer Products
Suntory Holdings
Ajinomoto
Kirin Holdings
Associated British Foods
Mondelez International
The Hershey Company
Herbalife
Glanbia
Namyang Dairy
Lotte Chilsung Beverage

Recent Developments

JANUARY 2026

Nestlé Launches Reduced-Sugar Coffee Premix Sticks Across Southeast Asia

Nestlé launched reduced-sugar coffee premix sticks across Southeast Asia, cutting sugar by 30% and using plant-based creamer to hold taste and texture. It is a product launch, and it tests whether global makers can defend habit against sugar scrutiny. Sales volumes were not disclosed. Margins follow scale and discipline.
Signal: Confirms that global premix leaders now build reduced-sugar sticks to defend habits against sugar policy pressure.
FEBRUARY 2026

Dongsuh Foods Expands Protein Coffee Mix Range Across Korean Convenience Stores

Dongsuh Foods expanded its protein coffee mix range across Korean convenience stores and offices, adding new flavours and tubs for gyms. It is a range extension, not an acquisition, and it tests whether category leaders can win wellness buyers with familiar formats. Volume targets were not disclosed.
Signal: Suggests category leaders are using functional sticks and convenience reach to contest wellness premix growth in offices.
MARCH 2026

Unilever Signs Tea Base Supply Agreement With Milk Tea Chains in Asia

Unilever signed supply agreements with milk tea chains in Asia to provide custom tea bases and technical support, after ingredient costs rose. It is a supply agreement, not an acquisition, and it tests whether global makers can win chain accounts with custom blends. Contract volumes were not disclosed.
Signal: Shows global makers are locking in chain accounts with custom blends to protect volume and margins.

What Drives Beverage Premix Production Costs

Sugar, creamers, and milk powders account for roughly 38% of cost of goods, coffee, tea, and cocoa about 22%, stick and sachet packaging about 18%, flavours and additives about eight percent, and processing, labour, and energy about 14%. Sugar comes from Brazil, India, and Thailand, creamers from palm oil producers in Indonesia and Malaysia, and coffee from Vietnam, Brazil, and Indonesia.
The clearest recent shock came from sugar and coffee. Statistics Indonesia and the United States Department of Agriculture reported sharp increases in coffee and sugar prices across 2022 and 2024, and Nestlé reported in its annual reports that green coffee and packaging costs weighed on margins. Makers raised prices by 6% to 12%, reduced pack sizes, and cut promotions, which squeezed gross margin by several points until contracts reset in the following

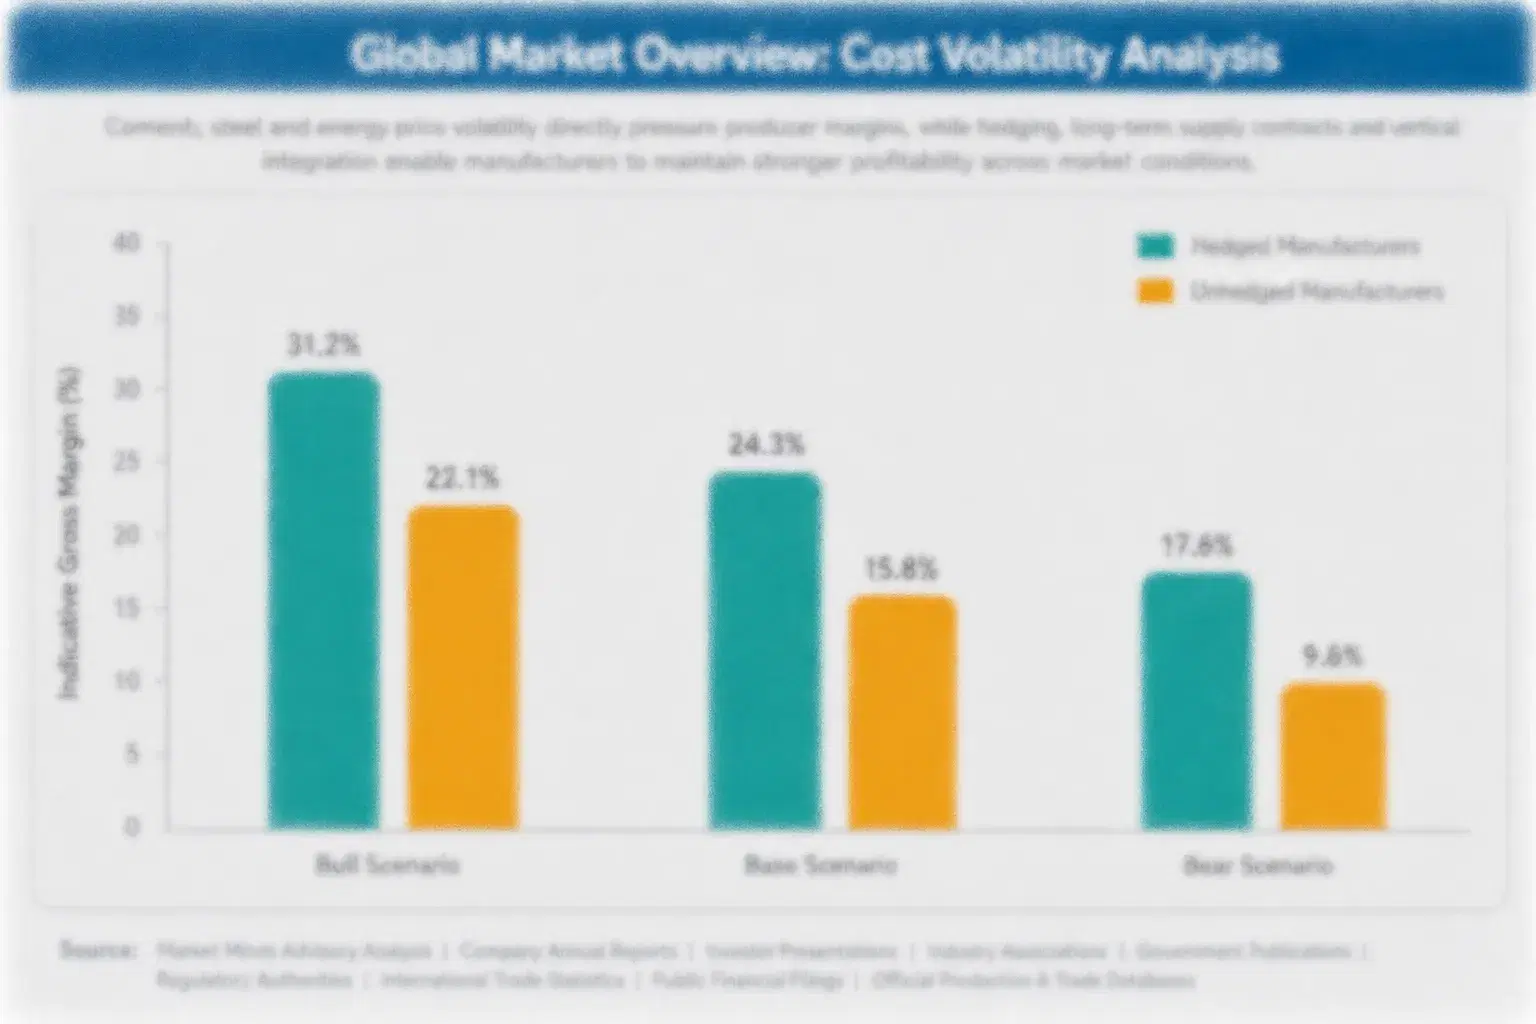
The competitive disadvantage falls on small makers, which buy sugar, creamer, and coffee in small lots at spot prices and cannot secure fixed contracts. Large groups sign commodity contracts, own blending and filling capacity, and spread costs across many brands. Exposure also varies by geography, since Asian makers face currency swings and import duties while Western makers face energy costs and compliance.
beverage-premix-market-cost-volatility-analysis-1789803099559

Signing Sugar, Creamer, and Coffee Contracts for Twelve Months

Makers sign forward contracts for sugar, creamer, coffee, and packaging for 12 months, consolidate orders across product lines, and dual-source key inputs. Forward contracts cut cost swings by roughly half, though they need volume commitments and working capital that only larger makers usually provide. Terms usually run one year, delivery reliability matters, and buyers should approve early.

Reformulating With Lower Sugar and Plant-Based Creamers to Cut Cost

Makers reformulate with lower sugar, blended sweeteners, and plant-based creamers to cut cost exposure and meet health rules. Reformulation lowers sugar cost by 10% to 20% and improves label appeal. The main risk is taste change, so premium makers test blends in panels and launch low-sugar sticks beside classic lines to hold loyal buyers. Customers review suppliers every season.

Using Contract Blenders to Avoid Capital Costs and Handle Peaks

Small makers use contract blenders and co-packers rather than buying equipment, avoiding capital costs of $1 million or more. Contract production adds cost per unit but lowers risk and handles seasonal peaks. The main challenge is scheduling, since slots fill early in the year, so makers book capacity months ahead and agree penalties for late delivery.

Portfolio Architecture for Margin Defence

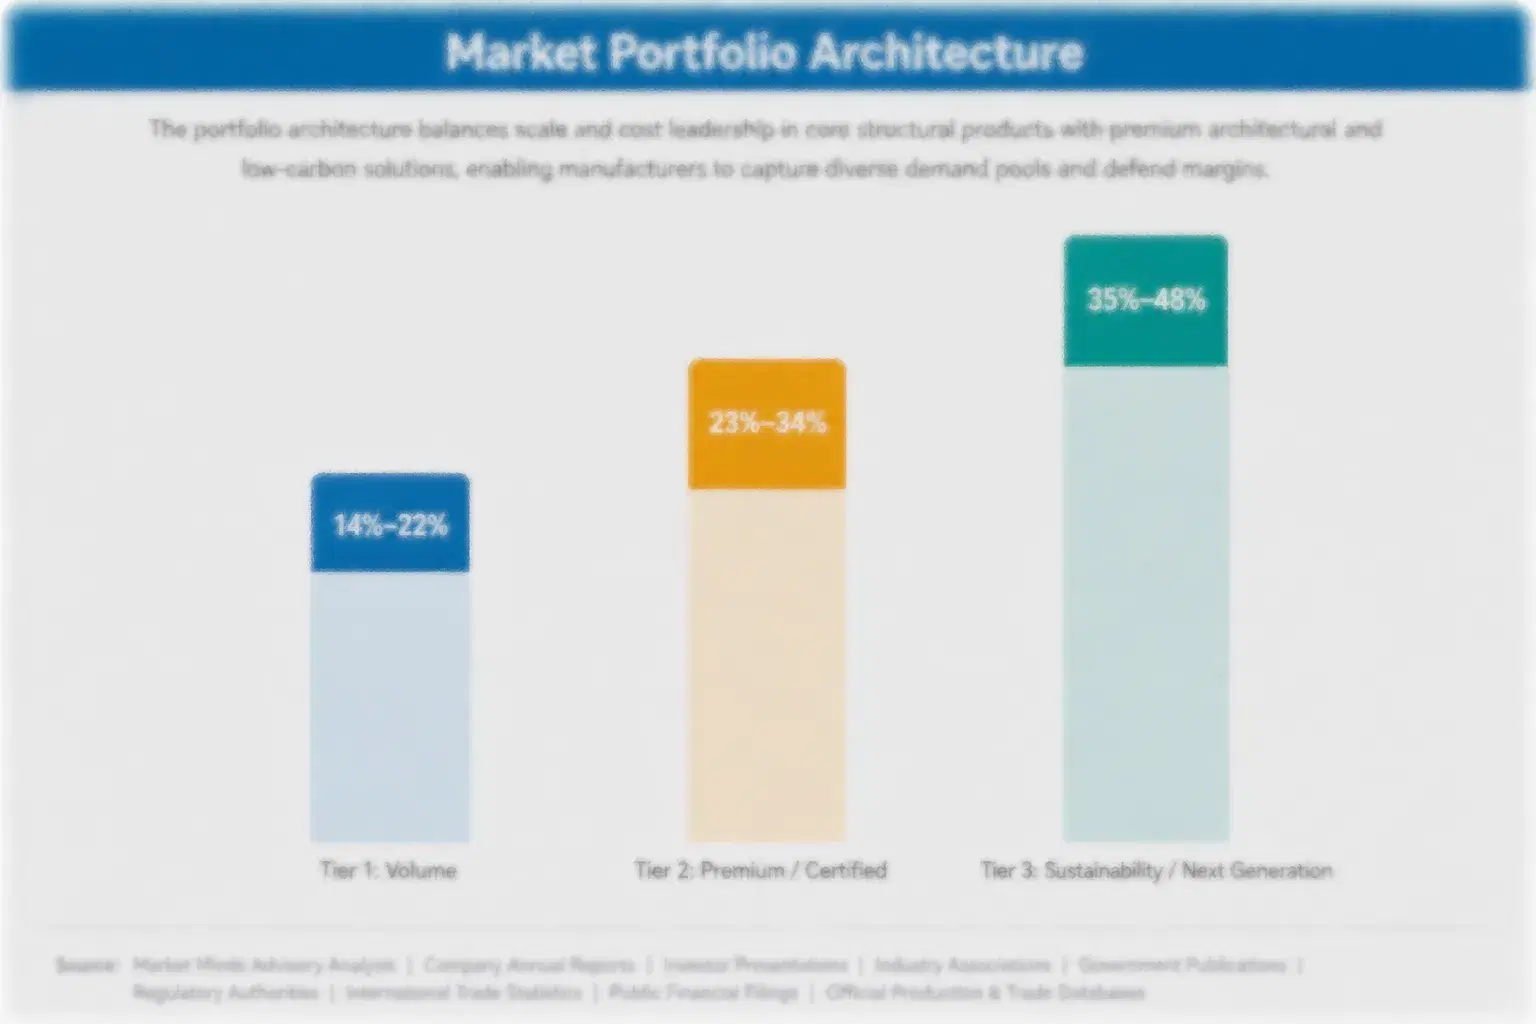
Margins run from thin returns on unbranded sweet 3-in-1 sticks and private label mixes sold in boxes to supermarkets and vending operators to strong returns on functional lines, custom chain blends, and low-sugar premium sticks sold through offices, shops, and online channels. Three tiers separate volume products, certified premium lines, and next-generation formats, and each tier draws on different buyer groups.
The tension between volume and premium is sharp. Volume lines protect blending utilisation and retailer relationships but face constant price pressure from private label and regional makers, while premium lines earn higher margins on smaller volumes and depend on taste, raw material quality, and channel relationships. Makers that run only volume struggle to fund innovation, while makers that run only premium lack the scale to hold vending contracts and commodity pricing.

High-value pools concentrate in functional lines, custom chain blends, and low-sugar premium sticks sold through offices, shops, and online retail. They gather where buyers pay for taste, consistency, or wellness fit rather than volume. Tea shop chains, cafes, and hospitality groups add further value, since these buyers ask for reliable delivery, consistent flavour, and technical support, and they reorder without shopping on

Volume / Commodity-Adjacent Tier

Unbranded sweet 3-in-1 sticks and private label mixes sold in boxes to supermarkets and vending operators, with thin margins, sugar and creamer cost exposure, and constant price competition, where buyers switch on price, promotion, and pack size.
Gross Margin: 18%-28%

Premium / Certified Tier

Premium coffee and tea sticks with higher coffee content, real milk, and consistent blends, sold through supermarkets, offices, and specialist retailers that require reliable delivery, clear labelling, and stable supply across seasons and promotions.
Gross Margin: 30%-42%

Sustainability / Regulatory / Next-Generation Tier

Functional, low-sugar, and plant-based premixes built on tested formulas, lower sugar, and clear labelling, sold through offices, chains, gyms, and online platforms to buyers who pay premiums for wellness, taste, and convenient preparation.
Gross Margin: 34%-50%
beverage-premix-market-portfolio-architecture-1789803099872

High-value Sub-segments and Strategic Watch-out

Functional and Protein Beverage Premixes

Functional and protein beverage premixes combine the fastest growth with strong pricing, since buyers pay 30% to 90% premiums for wellness positioning in a convenient stick. Taste and claim credibility limit competition, and makers with office and gym partners win shelf space. Repeat purchase compounds across routines.
Gross Margin: 34%-50%

Bubble Tea and Specialty Drink Premixes

Bubble tea and specialty drink premixes deliver solid growth and healthy pricing, since chains pay for consistent powders that cut cost per cup by 20% to 40%. Technical support and custom blends form the entry barrier, and suppliers with chain contracts win multi-year volume. Orders scale steadily with shop
Gross Margin: 30%-46%

Instant Coffee Premixes

Instant coffee premixes form the volume core, sold through supermarkets, vending, and kiosks at moderate margins. Growth is steady, at about 5.6% a year, as urban habits expand in emerging markets. Sugar cost, coffee cost, and private label competition decide profit, and makers use the segment as anchor volume.
Gross Margin: 18%-30%

Cocoa and Malted Beverage Premixes

Cocoa and malted beverage premixes are the strategic watch-out, since sugar scrutiny targets children's drinks, growth trails the market at about 4.6% a year, and health rules limit marketing. Makers should reformulate before scaling, because levy exposure and retailer delisting can erode margin quickly. Taste consistency protects repeat purchase.
Gross Margin: 22%-34%

Why Premix Buyers Keep Purchasing

Beverage premix demand behaves like an annuity of daily routine occasions. Buyers purchase the same stick each morning because it fits the commute, the desk, and the kettle, and shops reorder the same base every week because it defines their taste. Distributors use last quarter's sell-through to fix reorders, and vending operators use machine data to fix supply, so successful makers earn steadier volume than launches driven by
Adoption stickiness differs by end-use vertical. Tea shop chains and cafes are the deepest, since custom blends define brand taste and change only when quality or price fails. Offices and vending are almost as loyal, because machines and habits repeat. Households are shallower and switch on price, while hotels and airlines follow contract cycles that run for several years. Clear labelling builds buyer trust.

Buyer profiles are shifting between generations. Older buyers choose premixes for familiar taste and price and trust established brands, while younger buyers care about lower sugar, flavour variety, and functional benefits. Health-conscious professionals add a third group that wants protein and fibre options. Makers that publish ingredient doses and use social media for recipe ideas win younger buyers and keep
beverage-premix-market-end-use-penetration-index-1789803100227

MMA Verdict on Premix Strategy

These are among the four positions where our research anticipates prominent divergence between winners and laggards over the coming forecast period. Each is grounded in the demand model, the regulatory perimeter, and the announced capacity pipeline.
01 / FUNCTIONAL PREMIX STRATEGY

Build Functional and Protein Sticks Before Office and Gym Shelves Are Allocated

Functional and protein beverage premixes grow at 9.8% a year, about 1.53 times the market rate, and they sell at 30% to 90% above standard 3-in-1 sticks, so early range investment pays back inside roughly two years on most lines. Winners publish doses, hold taste, and secure office, gym, and online listings before rivals do. Makers that wait will find shelves allocated, and wellness buyers will already be loyal to competing functional sticks in offices, gyms, and online stores across Asia and North America.
02 / CHAIN CONTRACT STRATEGY

Win Multi-Year Chain Contracts Before Tea Shops Lock In Blend Suppliers

Bubble tea and specialty drink premixes grow at 8.6% a year, and tea shop chains that build their taste around a custom blend rarely change suppliers, so chain contracts deliver volume gains of 12% to 20% in partner accounts. Makers should supply custom blends, technical support, and reliable logistics, and fix minimum volumes and price terms in contracts. Those that sell only through retail will lose chain volume, and the premium that funds innovation will erode as regional makers and rivals copy the blends.
03 / RAW MATERIAL STRATEGY

Contract Sugar, Creamer, and Coffee Early to Protect Margin Against Shocks

Sugar, creamer, coffee, and tea take about 60% of cost of goods, and shocks in weather, edible oil, or freight markets can lift prices by 15% to 30% within a year, so unhedged makers face margin squeezes and missed deliveries. Makers should sign 12-month contracts, dual-source creamer from two suppliers, and hold safety stock of packaging. Those that buy only on the spot market will lose customer trust and margin during volatile years, and premium brands will lose the consistency that justifies their prices.
04 / SUGAR REDUCTION STRATEGY

Launch Low-Sugar Sticks Beside Classic Mixes Before Levies Force Reformulation

Sugar levies and health campaigns push buyers toward lower-sugar sticks, and reduced-sugar recipes with 30% to 50% less sugar and smaller trial packs lower the barrier for buyers who want change without losing taste. Makers should keep classic sticks for price shoppers, use low-sugar lines for retail, and rely on contract fillers to avoid capital costs of $1 million or more. Those that wait for regulation will miss volume gains of 15% to 25% among new buyers, and rivals with low-sugar ranges will take the shelf space.

Engagement Snapshot From the Field

A live engagement with an industry participant carrying material or product regulatory and market exposure ahead of a defining policy shift, showing how our research translates into a defensible multi-year portfolio strategy.
MARKET MINDS ADVISORY · CLIENT ENGAGEMENT SUMMARY
Beverage Premix Producer Strategic Portfolio Review and Transition Roadmap 2026·Investment Scenario on Beverage Premix Exposure Evaluation 2025-26
CLIENT PROFILE
The client is a mid-sized Southeast Asian premix producer with annual sales near USD 280 million (client-reported, unverified by MMA), three plants, and a portfolio led by sweet 3-in-1 coffee sticks, milk tea powders, and cocoa mixes sold through mom-and-pop stores, supermarkets, and vending operators. It had no low-sugar or functional range, limited chain accounts, and heavy exposure to sugar and creamer costs.
STRATEGIC CHALLENGE
Sugar levies were spreading, private label was eroding prices, and tea shop chains asked for custom blends. Management needed to decide whether to invest in low-sugar sticks, a functional range, or chain supply capability, with limited capital and only one plant able to run new blending formats. Rivals were already moving into low-sugar premixes.
MMA APPROACH
MMA analysed sales and cost data across 60 products, interviewed 12 supermarket buyers, eight tea shop chain purchasers, and six raw material suppliers, and ran a shopper survey on taste, sugar, and price preferences across three regions. It modelled margin by segment and channel, tested sugar and coffee cost scenarios, and ranked investments by payback period and execution risk.
KEY FINDINGS
  1. A low-sugar stick range could reach 10% of sales within two years at margins near 32% (client-reported, unverified by MMA). Small brands feel every cost swing.
  2. A functional protein range through offices and gyms could add 5% of sales at prices 60% above standard sticks, using existing lines and one new blending step.
  3. Twelve-month sugar, creamer, and coffee contracts covering 65% of volume could cut cost swings by about half in a volatile year, protecting promotional slots.
  4. Custom blend contracts with three tea shop chains could add 6% of sales within three years and secure multi-year volume. Distribution reach compounds over time.
CLIENT PROFILE
The client is a mid-sized Southeast Asian premix producer with annual sales near USD 280 million (client-reported, unverified by MMA), three plants, and a portfolio led by sweet 3-in-1 coffee sticks, milk tea powders, and cocoa mixes sold through mom-and-pop stores, supermarkets, and vending operators. It had no low-sugar or functional range, limited chain accounts, and heavy exposure to sugar and creamer costs.
STRATEGIC CHALLENGE
Sugar levies were spreading, private label was eroding prices, and tea shop chains asked for custom blends. Management needed to decide whether to invest in low-sugar sticks, a functional range, or chain supply capability, with limited capital and only one plant able to run new blending formats. Rivals were already moving into low-sugar premixes.
MMA APPROACH
MMA analysed sales and cost data across 60 products, interviewed 12 supermarket buyers, eight tea shop chain purchasers, and six raw material suppliers, and ran a shopper survey on taste, sugar, and price preferences across three regions. It modelled margin by segment and channel, tested sugar and coffee cost scenarios, and ranked investments by payback period and execution risk.
KEY FINDINGS
  1. A low-sugar stick range could reach 10% of sales within two years at margins near 32% (client-reported, unverified by MMA). Small brands feel every cost swing.
  2. A functional protein range through offices and gyms could add 5% of sales at prices 60% above standard sticks, using existing lines and one new blending step.
  3. Twelve-month sugar, creamer, and coffee contracts covering 65% of volume could cut cost swings by about half in a volatile year, protecting promotional slots.
  4. Custom blend contracts with three tea shop chains could add 6% of sales within three years and secure multi-year volume. Distribution reach compounds over time.
RECOMMENDED STRATEGY
Phase 1: Phase 1 (Months 1-6): Sign commodity contracts, book contract blending slots, and start low-sugar trials with supermarkets and two tea shop chains. Phase 2: Phase 2 (Months 7-18): Launch the low-sugar range nationally and start functional sticks with clear dose labels and office partnerships. Buyers reward consistency over novelty. Phase 3: Phase 3 (Months 19-30): Reduce low-margin classic volume, expand blending and stick filling capacity, and add export listings in two markets, reviewing margin quarterly.
OUTCOME
Within 30 months, low-sugar and functional products reached 19% of sales, launch costs were recovered, and gross margin improved by four points (client-reported, unverified by MMA). The client won multi-year custom blend contracts with four chains and vending listings across two countries, while buyers named it a preferred supplier for premixes.

Frequently Asked Questions

Foundational context covering the market sizes, CAGR, scope, country, region and competition that inform every finding below. This section is provided to cover basics and most often pre-purchase conversations, answered from the MMA Primary Research Dataset.

What is the current size of the Beverage Premix Market?

The global beverage premix market was valued at $22.0 billion in 2025. Growth is supported by convenience demand, milk tea shop expansion, and functional and low-sugar formats across retail and foodservice.

How large will the Beverage Premix Market be by 2036?

The market is projected to reach $43.5 billion by 2036, up from $23.4 billion in 2026. The increase of $20.1 billion reflects functional ranges, chain contracts, and emerging market volume.

What is the CAGR for the Beverage Premix Market 2026 to 2036?

The market is forecast to grow at a 6.4% CAGR from 2026 to 2036. The bull case reaches 7.7% and the bear case 5.1%, depending on raw material costs and sugar rules.

Which segment is growing fastest?

Functional and Protein Beverage Premixes is the fastest-growing segment at 9.8% CAGR, roughly 1.53 times the overall market rate. Bubble Tea and Specialty Drink Premixes follows as the second-fastest segment at 8.6% CAGR each year.

Who are the major companies in the Beverage Premix Market?

Major companies include Nestlé, Dongsuh Foods, Kraft Heinz, JDE Peet's, and Unilever. Trung Nguyen Legend, Mayora Indah, Tata Consumer Products, Suntory Holdings, Mondelez International, and private labels also hold meaningful positions.

Which country is growing fastest?

India is the fastest-growing country at a 10.4% CAGR, driven by chai premixes, modern retail, and vending expansion. Indonesia and Vietnam follow through sachet coffee habits and rising incomes.

Report Segmentation Architecture

The full report scope spans multiple orthogonal segmentation dimensions, with cross-tabulated demand data provided for each dimension pair. Coverage extends further to regional breakdowns, trend trajectories, and the competitive detail needed to support segment-level decision-making.

By Primary Market Dimension

  • Instant Coffee Premixes
  • Milk Tea and Chai Premixes
  • Functional and Protein Beverage Premixes
  • Cocoa and Malted Beverage Premixes
  • Bubble Tea and Specialty Drink Premixes
  • Fruit and Iced Beverage Premixes

By End-Use Industry

  • Home Consumption
  • Offices and Workplaces
  • Tea Shops and Cafes
  • Restaurants and Hospitality
  • Airlines and Travel Retail

By Commercial Dimension

  • Supermarkets and Traditional Trade
  • Vending and Kiosk Operators
  • Foodservice Distributors
  • Convenience Stores
  • Online and Direct-to-Business

By Region

  • South Asia and Pacific
  • East Asia
  • North America
  • Western Europe
  • Latin America
  • Middle East and Africa
  • Eastern Europe

Scope, Methodology, and Coverage

Every figure in this report is reproducible from documented input assumptions. The scope below maps the historical period, the forecast horizon, the segmentation dimensions, and the countries covered, alongside the underlying primary and qualitative methodology.
Historical Period
2020 to 2025
Forecast Period
2026 to 2036
Base Year
2025 (USD billions; MMA Primary Research Dataset, September 2026)
Market Definition
Beverage premixes comprise dry and liquid mixes sold in sticks, sachets, tubs, and bulk packs that combine coffee, tea, cocoa, milk, sweetener, or functional ingredients for preparation by adding hot or cold water or milk, including instant coffee premixes, milk tea and chai premixes, functional and protein beverage premixes, cocoa and malted beverage premixes, bubble tea and specialty drink premixes, and fruit and iced beverage premixes, sold through supermarkets, traditional trade, vending, foodservice, and online channels. The scope excludes single-origin instant coffee jars, ready-to-drink cans, capsules, and plain tea bags.
Quantitative Units
USD billions (sales value); billion servings for volume references
Segmentation Dimensions
By Base Beverage and Function; By End-Use Setting; By Commercial Dimension; By Region
Regions Covered
South Asia and Pacific, East Asia, North America, Western Europe, Latin America, Middle East and Africa, Eastern Europe
Countries Covered
South Korea, China, Japan, Taiwan, Indonesia, Vietnam, Malaysia, India, Philippines, Australia, United States, Canada, Mexico, Brazil, United Kingdom, Germany, France, Saudi Arabia, Nigeria, and additional markets relevant to this sector
Key Companies Profiled
Nestlé, Dongsuh Foods, Kraft Heinz, JDE Peet's, Unilever, Trung Nguyen Legend, Vinacafe, Mayora Indah, Indofood, Tata Consumer Products, Suntory Holdings, Ajinomoto, Kirin Holdings, Associated British Foods, Mondelez International, The Hershey Company, Herbalife, Glanbia, Namyang Dairy, Lotte Chilsung Beverage
Quantitative Methodology
Primary survey, n=3,800 respondents, Q4 2025, six countries; demand-side model with trade association cross-validation
Qualitative Methodology
47 expert interviews, Q4 2025; applied to validate demand model assumptions, identify emerging dynamics, and assess competitive positioning
Report Format
PDF and XLSX data workbook (Word format preview document)
Publisher
Market Minds Advisory
Report Code
MMA-2026-AGR-421
Published
September 2026
Contact
sales@marketmindsadvisory.com | www.marketmindsadvisory.com

Purchase the full Beverage Premix Market Report (2026 to 2036).

The full report delivers a detailed assessment of global beverage premixes through 2036, covering segment, regional, and country forecasts, competitive benchmarking of leading makers, and input cost analysis. It combines MMA primary research, including a six-country survey of 3,800 respondents and 47 expert interviews, with public trade and company data. Analysts also model sugar and coffee cost paths, levy scenarios, and functional adoption. Clients receive segment margin ranges, channel maps, and a case study on portfolio strategy. Chain and distributor contact frameworks are also included for negotiation planning.
Ten-year segment and regional demand forecasts
Sugar, creamer, coffee, and packaging price tracking
Competitive benchmarking of top twenty premix makers
Sugar levy and labelling rule tracker
Regional demand mechanism comparative analysis included
Quarterly primary survey data update access

Built For The People Who Decide

From boardroom strategy to bench-side execution, this report is read cover-to-cover by leaders shaping the next decade of their industry, turning demand scenarios, market dynamics and valuation benchmarks into decisions.
CXOs/ Presidents/ VPs/ Managers
M&A and Corporate Development
Strategy Teams and R&D Heads
Procurement and Product Directors
Regulatory and Compliance Leaders
Investor Relations and Equity Analysts