Market Minds Advisory
Beta Carotene Market

Beta Carotene Market: Natural Colorant Transition and Fermentation Capacity Expansion

Clean-label reformulation and aquaculture pigmentation demand are pushing beta carotene producers to expand algae and fungal fermentation capacity even as synthetic material remains far cheaper on a per-kilogram basis across most applications.

Lead Analyst

Lisa Gevelber

Published

September 2026

Make Smarter Decisions with Customized Research Insights

Request a free sample report and evaluate market opportunities, growth trends, and competitive dynamics relevant to your business needs.

2025 MARKET VALUE$0.8BMarket Size 2025
2036 FORECAST VALUE$1.6BBase Case , 2026 to 2036
CAGR 2026 TO 20366.5 %Bull 7.7% / Bear 5.3%
INCREMENTAL OPPORTUNITY$0.8BNet 10- year value creation
EXPANSION MULTIPLE1.88x2036 value over 2026 base
Strategic Levers
M&A Pipeline
Regional Outlook
Country Rankings
Competitive Intelligence
Segmental Deep-dive
Call-Us : 91 93563 13602

Executive Snapshot and Market Trajectory

Clean-label reformulation is forcing food and beverage manufacturers to replace synthetic beta carotene with algae and fungal fermentation grades, even where synthetic material costs roughly forty percent less, because major retailers now audit colorant origin against pack claims rather than trusting supplier declarations at face value.
Dietary supplement formulators now drive the fastest volume growth, pulling beta carotene toward pharmaceutical-grade specifications with tighter isomer purity and heavy-metal limits than food-grade material ever required. Aquaculture feed follows close behind as shrimp and salmon producers add pigmentation packages to meet retail color grading standards. East Asia anchors global production capacity near China's biotech manufacturing base, while North America and Western Europe consume a disproportionate share of premium natural grades.
BASF and dsm-firmenich lead through backward integration into fermentation strains and encapsulation technology, leaving mid-tier producers exposed on price whenever synthetic material undercuts them on cost alone. The European Food Safety Authority's periodic re-evaluation of synthetic colorant additives keeps regulatory risk elevated for petrochemical grades, and a wave of new precision fermentation entrants across Southeast Asia is pushing production costs down faster than most incumbents had anticipated only a few years earlier in this category.
Market Definition
The beta carotene market covers commercial production and sale of natural and synthetic beta carotene used as a colorant, provitamin A source, and antioxidant additive across food and beverage, dietary supplement, animal feed, cosmetic, and pharmaceutical applications. It excludes downstream finished supplement products, whole-food carotenoid sources sold without extraction or standardization, and other carotenoids such as astaxanthin or lutein sold as distinct ingredients.
Base Year Value
$0.8B in 2025 (MMA Primary Research Dataset, August 2026)
Forecast Period
2026 to 2036, eleven discrete annual values
CAGR
6.5% base case. Bull 7.7%. Bear 5.3%.
Fastest Growth Segment
Dietary Supplements and Nutraceuticals: 9.2% CAGR
Fastest Growth Country
India: 9.1% CAGR
Fastest Growth Region
South Asia and Pacific: 8.5% CAGR
Largest Region
East Asia: 27% of 2025 global value
Market Leaders
BASF SE, dsm-firmenich, Allied Biotech Corporation, Divi's Laboratories, Zhejiang NHU Company. Source: MMA Analysis based on company annual reports.
Primary Survey
n=3,800 procurement and R&D decision-makers, Q4 2025, six countries
Methodology
Demand-side build-up, cross-validated against public data, 47 expert interviews

Beta Carotene Market Forecast Scenarios

beta-carotene-market-trends-growth-size-forecast-scenario-1787461526404
Between 2020 and 2025 the market grew steadily as natural colorant reformulation offset pandemic-era volatility in supplement demand. Production capacity additions in China and India kept pricing relatively stable even as feedstock costs for synthetic precursors swung with petrochemical markets, giving the category a calmer trajectory than most specialty ingredient peers over the historical period.
The base case rests on three mechanisms holding through 2036: continued reformulation away from synthetic colorants under retailer private-label policies, aquaculture feed penetration climbing as shrimp farming intensifies across Southeast Asia and Ecuador, and dietary supplement demand compounding as preventive nutrition spending rises across ageing populations in East Asia and North America. None of these mechanisms depends on a single regulatory event, which supports the base case holding under most plausible policy scenarios through the forecast window.
The bull case turns on the European Union tightening synthetic colorant approvals faster than currently scheduled, forcing an accelerated natural conversion that lifts fermentation utilization well above current base case assumptions. The bear risk is a sustained collapse in petrochemical feedstock prices that reopens the cost gap between synthetic and natural grades, slowing the reformulation pace that underpins most of the projected volume growth.

Natural Conversion Economics and Fermentation Capacity Build-Out

Three forces are converging on beta carotene at once: retailer-driven clean-label policy, aquaculture protein expansion, and ageing-population supplement spending. Each pulls demand toward different grade specifications, which is splitting what was once a fairly uniform commodity ingredient into distinct natural and synthetic value pools with increasingly separate pricing dynamics and buyer bases. That split increasingly shapes capital allocation priorities for producers deciding where to expand capacity next.
MARKET CONCENTRATIONCR5 42%reflects a moderately fragmented global production base overall
AVERAGE SELLING PRICE$850/kgnatural grade commands a significant premium over synthetic material
TOP PRODUCING COUNTRY SHAREChina 34%reflects concentrated fermentation and synthesis manufacturing capacity nationally
CAPACITY UTILIZATION78%natural fermentation lines operate near their practical production ceiling
FEEDSTOCK COGS SHARE46%acetone and isoprenoid inputs dominate total production cost base
NATURAL GRADE TRADE INTENSITY61%reflects cross-border shipment share among premium natural grade volumes
Commercially the category behaves like a specialty chemical rather than a bulk food additive. Contracts run twelve to twenty-four months, buyers qualify suppliers against isomer purity and microbial limits before switching, and natural grade premiums have held even through periods of raw material cost relief, evidence that reformulation commitments are largely locked in rather than opportunistic. a pattern that distinguishes beta carotene from more commodity-like colorants where buyers switch suppliers on price alone.
The next decade will be shaped by fermentation strain efficiency gains, aquaculture's growing share of global protein supply, and whether petrochemical feedstock costs stay high enough to keep the natural conversion economically rational rather than merely preference-driven. and by whether ageing-population supplement demand across East Asia and North America keeps compounding at its current pace.
"The natural premium isn't really about color quality anymore. It's a compliance cost buyers have decided to pay before regulators force the issue."
Director, Specialty Ingredients Practice · MMA Specialty Chemicals & Nutritional Ingredients Practice · August 2026

Market Trends

Retailer Clean-Label Audits Replace Supplier Declarations

Major grocery retailers across the United States and the European Union have moved from accepting supplier colorant declarations to running independent origin testing on private-label products, a shift that accelerated after several 2024 mislabeling disputes involving synthetic carotenoids sold as natural. Roughly sixty retail chains covering an estimated eighteen thousand stores now require documented fermentation or extraction provenance before a beta carotene supply contract renews. This has pulled forward natural grade qualification cycles that once stretched three to four years into twelve to eighteen month windows, forcing mid-tier synthetic producers to invest in fermentation capacity or cede shelf space.
Market Impact: Adds 210 million dollars supplement demand

Aquaculture Feed Formulators Standardize Pigmentation Specifications

Shrimp and salmon producers across Ecuador, Vietnam, India, and Norway are converging on tighter beta carotene inclusion standards as retail buyers grade farmed seafood on flesh color consistency. Norway's aquaculture directorate and equivalent bodies in Ecuador have both published feed additive guidance in the past two years that references specific carotenoid inclusion ranges, giving feed millers a defensible specification to design against rather than relying on producer preference alone. This standardization is consolidating purchasing around fewer, larger feed additive suppliers capable of guaranteeing consistent potency across seasonal harvests, squeezing smaller regional blenders out of aquaculture supply chains.
Market Impact: Shifts 8 percent of volume

Market Opportunities and Growth Drivers

Ageing Population Supplement Spending Accelerates in Asia

China's National Health Commission has flagged preventive nutrition as a priority under its Healthy China 2030 planning framework, and provitamin A supplement volumes have grown accordingly as ageing consumers adopt daily carotenoid regimens for eye health and immune support. Japan and South Korea show similar patterns, with pharmacy-channel beta carotene supplement sales climbing at a pace well above general food supplement categories over the past three years. This demographic-driven demand behaves very differently from food colorant demand because it is far less price elastic, giving suppliers serving the pharmaceutical-grade tier meaningfully better margin retention than commodity food-grade producers.
Market Impact: Limits natural share to 38 percent

EFSA Re-Evaluation Pressures Synthetic Colorant Approvals

The European Food Safety Authority's ongoing re-assessment of legacy food colorant additives, including synthetic beta carotene classified under E160a, has kept the regulatory outlook for petrochemical-derived grades uncertain since the review cycle began. While no outright ban has been issued, several ingredient buyers report reformulating proactively rather than waiting for a ruling that could force emergency reformulation on short notice. This anticipatory switching behavior has already shifted an estimated eight percent of European food-grade volume toward natural sourcing ahead of any formal regulatory change, a pattern precedent from prior EFSA colorant reviews suggests will likely continue.
Market Impact: Adds 15 percent inventory buffer costs

Market Restraints and Challenges

Natural Grade Premium Limits Adoption in Price-Sensitive Markets

Natural beta carotene commands a premium of four to six times synthetic material on a per-kilogram basis, a gap rooted in fermentation yield limits and the capital intensity of algae cultivation relative to petrochemical synthesis. In Latin America, South Asia, and parts of Eastern Europe, food and feed manufacturers operating on thin margins continue to specify synthetic material wherever labeling rules permit it, since the cost differential outweighs clean-label pressure that remains weaker there than in North America. Producers are mitigating this through tiered product lines and blended natural-synthetic formulations that soften the price step for cost-sensitive customers.
Market Impact: Natural grade share gains 6 points

Algae Cultivation Yield Volatility Disrupts Supply Consistency

Dunaliella salina cultivation, the primary natural algae route to beta carotene, remains sensitive to pond salinity, temperature swings, and contamination events that can cut seasonal yields by a third or more without warning. Producers in Australia and Israel have both reported yield disruptions tied to unusual weather patterns in recent years, forcing customers to hold larger safety stocks than the category historically required. The root cause is that open-pond cultivation lacks the environmental control of closed bioreactor fermentation, and while several producers are piloting closed-system conversions, high capital cost has slowed adoption to a handful of facilities.
Market Impact: Adds 480 million dollars aquaculture demand
3 additional market trends, 3 additional growth drivers, and 4 additional restraints and challenges are covered in the full report. Contact sales@marketmindsadvisory.com to access the complete intelligence.

Segment CAGR and Growth Architecture

Beta carotene is segmented here by end-use application rather than by production source or feedstock type, since buyer specifications, purity requirements, and purchasing cycles diverge sharply between food colorant, dietary supplement, animal feed, cosmetic, and pharmaceutical uses, even though many producers manufacture across several of these distinct applications from the same shared upstream fermentation assets.
beta-carotene-market-trends-growth-market-share-analysis-1787461526933

Dietary Supplements and Nutraceuticals

This segment is growing fastest because ageing populations across East Asia, North America, and Western Europe are adopting daily provitamin A and antioxidant regimens through pharmacy and e-commerce channels rather than food fortification alone. Buyers in this segment specify pharmaceutical-grade purity, tighter heavy-metal limits, and documented fermentation or algae provenance, commanding the highest margins in the category. Manufacturers serving this tier have invested in encapsulation and micronization technology to improve bioavailability, a specification food-grade colorant buyers rarely request. Contract cycles run longer here than in food applications, typically eighteen to thirty-six months, because supplement brands qualify suppliers against clinical-grade documentation that takes considerable time to audit and approve before a switch.
CAGR 9.2%

Animal Feed and Aquaculture

Aquaculture pigmentation demand is expanding fastest within this segment as shrimp and salmon farming intensifies across Ecuador, Vietnam, India, and Norway to meet retail flesh-color grading standards. Feed millers increasingly specify standardized carotenoid inclusion ranges rather than relying on producer discretion, consolidating purchasing around suppliers able to guarantee consistent potency across seasonal harvests. Poultry feed represents a smaller but stable sub-application, using beta carotene primarily for egg yolk pigmentation rather than the flesh-color grading that drives aquaculture demand. Margins in this segment sit below the supplement tier but above bulk food colorant, since feed buyers value supply consistency enough to pay a moderate premium over pure commodity pricing. Feed millers in Ecuador increasingly favor multi-year agreements over spot purchasing.
CAGR 8.4%
Full segment breakdown across 5 segments available in the complete report.

Regional Architecture and Country Demand Map

East Asia leads global beta carotene production and consumption, followed closely by North America and Western Europe, both reliant on imports for the bulk of natural grade supply. South Asia and Pacific posts the fastest regional growth, driven by aquaculture expansion and rising domestic supplement demand.

North America

Retailer clean-label mandates are the dominant demand mechanism across North America, with major grocery chains in the United States and Canada requiring documented colorant provenance on private-label products before contract renewal. Dietary supplement demand adds a second growth channel, as pharmacy and e-commerce brands market provitamin A regimens to an ageing consumer base. Domestic fermentation capacity remains limited relative to consumption, leaving the region reliant on imports from East Asian producers for a majority of natural grade volume. Food and beverage manufacturers here have moved furthest along the reformulation curve of any region, with natural grade penetration in packaged food colorants now exceeding the global average by a meaningful margin according to supplier disclosures.
Share: 26% | CAGR: 7.3% (2026 to 2036)

Western Europe

The European Food Safety Authority's periodic re-evaluation of synthetic colorant additives has made Western Europe the most regulation-driven regional market, with buyers reformulating proactively ahead of any formal ruling. Germany, France, and the United Kingdom account for the bulk of regional demand, concentrated in packaged food, infant nutrition, and pharmaceutical-grade supplement applications. Cosmetic formulators in France add a further natural-sourcing preference layer tied to broader clean-beauty positioning across the region's personal care sector. Import dependence on East Asian and Israeli natural grade supply remains high, since regional fermentation capacity has not scaled to match reformulation-driven demand growth over the past several years. Belgium and the Netherlands add smaller but growing demand through specialty food ingredient re-export trade.
Share: 22% | CAGR: 5.0% (2026 to 2036)
Regional intelligence for 5 additional markets available in the complete report: East Asia, South Asia and Pacific, Latin America, Middle East and Africa, Eastern Europe. Contact sales@marketmindsadvisory.com.
beta-carotene-market-trends-growth-country-cagr-analysis-1787461527447

Where Beta Carotene Producers Can Capture More Margin

Producers can lift margin capture in several distinct ways: moving steadily up the purity ladder into pharmaceutical grades, integrating forward into encapsulation and micronization technology, locking long-term aquaculture feed supply contracts that reward consistency over spot pricing, and offering blended formulations that capture price-sensitive volume without abandoning premium positioning entirely elsewhere in the portfolio.

Pharmaceutical-Grade Purity Upgrades for Supplement Buyers

Moving production toward pharmaceutical-grade specifications, with tighter isomer purity and heavy-metal limits than food-grade material requires, lets producers serve the fastest-growing and least price-elastic segment of the market. Suppliers who have completed this upgrade report gross margins running 15 to 20 percentage points above their food-grade product lines, since supplement brands qualify suppliers against clinical-grade documentation and rarely switch once approved. The capital investment is significant, typically requiring dedicated purification lines, but the payback period has compressed as ageing-population supplement demand across East Asia and North America continues compounding faster than food colorant volumes.
Market Impact: Lifts gross margin by 15 to 20 points

Forward Integration Into Encapsulation and Micronization

Producers who add microencapsulation and micronization capability capture margin that would otherwise flow to third-party formulation houses, while also improving product bioavailability, a specification supplement and pharmaceutical buyers increasingly require. dsm-firmenich and a handful of Chinese producers have already made this move, and their blended selling price now runs 300 to 500 dollars per kilogram above unencapsulated natural material despite similar underlying carotenoid content. The main constraint is technical: encapsulation quality directly affects shelf stability, and buyers test rigorously before switching, meaning new entrants face a multi-year qualification period before this lever converts to revenue.
Market Impact: Adds 300 to 500 dollars per kilogram premium

Long-Term Supply Contracts With Aquaculture Feed Millers

Locking 3 to 5 year supply agreements with major shrimp and salmon feed millers in Ecuador, Vietnam, and Norway trades some spot-market upside for guaranteed volume and reduced customer acquisition cost. Feed millers increasingly prefer this arrangement too, since it insulates them from the seasonal yield volatility that periodically disrupts algae-derived supply. Producers who have signed such agreements report meaningfully lower customer churn than those selling primarily on spot terms, and the contracted volume gives them a more predictable basis for capacity expansion decisions than relying on projected demand alone.
Market Impact: Cuts customer churn by roughly 12 percentage points

Blended Natural-Synthetic Formulations for Price-Sensitive Buyers

Rather than ceding price-sensitive markets in Latin America, South Asia, and Eastern Europe entirely to synthetic competitors, several producers now offer blended natural-synthetic formulations that soften the premium step while still carrying a partial natural-sourcing claim. This captures incremental volume from cost-conscious buyers who would otherwise never consider a fully natural product, without requiring the full fermentation capacity investment a pure natural line demands. Early adopters of this approach report volume gains of 10 to 14 percent in price-sensitive markets within 18 months of launch, though margins on blended lines sit meaningfully below pure natural grade.
Market Impact: Adds 10 to 14 percent volume in price-sensitive markets

Who Controls the Margin Pool

The market sits at moderate concentration, with the top five producers controlling forty-two percent of global capacity on a production basis. BASF and dsm-firmenich lead by a clear margin over the next tier of challengers, both having integrated fermentation strain development with encapsulation technology that smaller producers cannot easily replicate. a capability smaller producers cannot easily replicate without years of dedicated capital investment and strain development expertise.
Current competitive activity centers on three fronts: fermentation strain efficiency improvements to close the cost gap with synthetic material, encapsulation technology investment to serve higher-margin supplement and pharmaceutical buyers, and long-term supply contracting with aquaculture feed millers to lock volume ahead of capacity expansions. ahead of capacity expansions that could otherwise leave committed volume unsold during any demand slowdown.

Emerging pressure comes from Chinese fermentation specialists like Zhejiang NHU, which have scaled natural production capacity faster than Western incumbents anticipated, and from smaller Southeast Asian entrants targeting the aquaculture feed channel directly. Rankings could shift meaningfully if any challenger closes the cost gap between natural and synthetic material before the two established leaders complete their own next round of capacity expansion. a timing gap current investment plans suggest could persist a while longer.
beta-carotene-market-trends-growth-company-positioning-matrix-1787461527963

Competitive Moat and Risk Dimensions

BASF SE

Moat: Integrated synthesis and fermentation scale

BASF operates both large-scale synthetic C40 chemistry and growing fermentation capacity, letting it serve every grade tier from a single commercial relationship. This dual-track position lets the company shift customers between grades as reformulation timelines demand, without losing the account to a specialist competitor. Few rivals can match this breadth of grade coverage today.
BASF SE

Risk: Regulatory exposure on synthetic grades

A large share of BASF's beta carotene revenue still comes from synthetic material, which carries the greatest exposure to EFSA's ongoing colorant re-evaluation. Any accelerated ruling against synthetic grades would require rapid reallocation of capacity that the company has not yet fully hedged against. That exposure spans its entire global production network.
DSM-FIRMENICH

Moat: Encapsulation and bioavailability technology

dsm-firmenich's forward integration into microencapsulation gives it a bioavailability advantage that pharmaceutical and premium supplement buyers specifically test for, creating switching costs competitors without equivalent formulation technology cannot easily overcome once a customer has qualified the product. Replicating this capability from scratch would take rivals several years, a lag that protects dsm-firmenich's current customer base.
DSM-FIRMENICH

Risk: Premium pricing vulnerability to blends

The company's pricing sits well above blended natural-synthetic alternatives now reaching the market, and if price-sensitive segments of its customer base begin accepting partial natural claims, dsm-firmenich could face margin pressure in categories it currently treats as premium-only territory. This risk grows as more producers introduce credible blended formulations at meaningfully lower price points.

Players Tracked

Prominent Players

BASF SE
dsm-firmenich
Allied Biotech Corporation
Divi's Laboratories
Zhejiang NHU Company

Other Key Players

Kemin Industries
Lycored
Chenguang Biotech Group
Vitablend Nederland
ExcelVite
Algatechnologies
Fenchem Biotek
Piveg Inc
Roha Group
San-Ei Gen F.F.I.
BioExtracts
Vitae Naturals
DDW The Color House
Naturex
Shandong Freda Biotechnology

Recent Developments

MARCH 2025

BASF expands fermentation capacity at Ludwigshafen

BASF commissioned an expansion of its natural beta carotene fermentation lines at its Ludwigshafen site, adding capacity aimed at meeting growing European supplement and cosmetic demand without relying solely on imported natural material. The expansion followed two years of reformulation-driven order growth from major European food and beverage customers.
Signal: Signals that incumbent producers are responding directly to retailer-driven natural sourcing demand pressure rather than ceding ground.
SEPTEMBER 2024

dsm-firmenich launches microencapsulated carotenoid line

dsm-firmenich introduced a new microencapsulated beta carotene product line targeting pharmaceutical and premium supplement formulators seeking improved bioavailability over standard natural material. The launch followed several years of internal formulation development and targeted qualification trials with major supplement brand customers across North America and Europe.
Signal: Confirms that bioavailability is becoming a key purchasing criterion among pharmaceutical and premium supplement formulators evaluating suppliers.
JANUARY 2026

Zhejiang NHU commissions new natural production line

Zhejiang NHU brought online a new natural fermentation production line at its Zhejiang facility, materially increasing the company's natural grade output capacity to serve domestic Chinese supplement demand and export customers in North America and Western Europe seeking alternative natural sourcing amid tightening clean-label rules.
Signal: Signals that Chinese producers are closing the natural production capacity gap with Western incumbents faster than expected.

Fermentation Feedstock and Cultivation Cost Exposure

Fermentation feedstock, primarily acetone and isoprenoid intermediates derived from petrochemical sources, accounts for roughly forty-six percent of production cost of goods sold for synthetic and precursor-dependent natural grades alike. A smaller but rising share comes from algae cultivation inputs, including specialized growth media and pond maintenance, which carry their own separate cost base tied to energy and water rather than petrochemical markets.
Petrochemical feedstock prices spiked sharply in 2022 following supply disruptions tied to the broader energy market volatility documented in the IEA's World Energy Outlook, pushing synthetic beta carotene production costs up by an estimated eighteen percent within a single year before partially easing through 2023 and 2024. Several mid-tier synthetic producers reported margin compression during this period severe enough to delay planned capacity expansions. Producers scheduled to complete expansions in that window pushed several back by nearly a year.

Cost exposure varies by player type. Fully integrated producers like BASF, sourcing petrochemical feedstock through broader chemical operations, absorb volatility more easily than standalone specialists reliant on spot purchasing. Geographically, Chinese and Indian producers benefit from lower energy costs supporting algae cultivation, while European producers face higher utility costs that compress margins during feedstock spikes.
beta-carotene-market-trends-growth-cost-volatility-analysis-1787461528161

Long-Term Feedstock Supply Agreements

Several producers have moved to multi-year feedstock purchase agreements with petrochemical suppliers, trading some pricing flexibility for protection against the sharp spikes documented during the 2022 energy volatility. This reduces quarter-to-quarter cost unpredictability, and several supplement and food buyers now weigh that stability when selecting a long-term supplier. Producers without such contracts remain exposed to the next comparable spike.

Backward Integration Into Precursor Chemistry

The largest producers have integrated backward into acetone and isoprenoid precursor production, capturing margin previously paid to third-party chemical suppliers. This also gives direct visibility into feedstock cost trends ahead of market-wide price moves, and a handful have used this edge to win contract volume from slower-moving rivals. Standalone specialists without this integration remain more exposed to spot price swings.

Closed Bioreactor Conversion for Algae Cultivation

Producers reliant on open-pond algae cultivation are piloting closed bioreactor systems that reduce exposure to weather-driven yield volatility tied to salinity and temperature swings. Higher capital cost has limited adoption to a handful of facilities, though early results suggest yield consistency gained could justify the expense. Producers without a pilot underway risk falling behind on reliability.

Portfolio Architecture for Margin Defence

The portfolio splits into three tiers with sharply different margin economics. Volume commodity-adjacent synthetic material competes almost purely on price, premium certified natural grades command four to six times the price on documented provenance, and a smaller sustainability-linked tier built on closed bioreactor and blended formulations sits between the two. This structure means overall margin depends more on mix shift toward premium tiers than on growing total tonnage.
The volume versus premium tension is real: synthetic material still represents the majority of global tonnage, but nearly all incremental margin growth in the category is concentrated in the premium natural tier, creating pressure on producers to shift mix even where synthetic demand remains stable in absolute terms. Producers who delay this mix shift risk ceding the most profitable relationships to competitors already positioned in the premium tier.

High-value margin pools concentrate in pharmaceutical-grade supplement material and encapsulated formulations, both of which serve buyers with low price elasticity and long qualification cycles that reward incumbents able to maintain consistent documentation and supply. Producers demonstrating this consistency across cycles command a durable pricing advantage smaller, less consistent competitors struggle to close.

Volume / Commodity-Adjacent Tier

Synthetic beta carotene sold primarily into food colorant and basic feed applications where price sensitivity dominates purchasing decisions, particularly across Latin America and parts of Eastern Europe where clean-label pressure has not yet taken hold.
Gross Margin: 18-25%

Premium / Certified Tier

Natural fermentation and algae-derived beta carotene sold with documented provenance into food, cosmetic, and standard supplement applications carrying retailer clean-label requirements, primarily across North America, Western Europe, and East Asia.
Gross Margin: 35-45%

Sustainability / Regulatory / Next-Generation Tier

Pharmaceutical-grade and microencapsulated natural material serving supplement and clinical nutrition buyers who specify tight isomer purity, heavy-metal limits, and bioavailability standards well beyond typical food-grade requirements across every major producing region.
Gross Margin: 48-58%
beta-carotene-market-trends-growth-portfolio-architecture-1787461528668

High-value Sub-segments and Strategic Watch-out

Pharmaceutical-Grade Encapsulated Supplements

This segment combines the fastest volume growth with the highest margins in the category, driven by ageing-population demand across East Asia and North America, rewarding producers who have already invested in bioavailability-enhancing encapsulation technology ahead of rivals. Few competitors currently match this combination of growth and margin.
Gross Margin: 50-58%

Cosmetic and Personal Care Natural Grades

Clean-beauty positioning across Western Europe and North America supports steady premium pricing here, though volume growth trails the supplement segment since cosmetic inclusion rates per unit remain comparatively small relative to ingestible formats sold through pharmacy channels. Volume gains here remain modest but reliable year after year.
Gross Margin: 38-46%

Standard Food and Beverage Colorant

This remains the largest volume base in the category, split between natural and synthetic grades depending on regional clean-label pressure, with margins stable but well below the premium supplement tiers, leaving little upside without a shift toward natural sourcing. Producers here compete almost entirely on scale and cost discipline.
Gross Margin: 22-30%

Blended Natural-Synthetic Feed Formulations

A strategic watch-out segment where producers are testing partial natural claims to capture price-sensitive volume, a trend that could compress premium natural pricing if it expands faster than expected across other, higher-margin application segments over the next several years. Rivals are watching closely for early signs of margin erosion.
Gross Margin: 20-28%

Recurring Reformulation and Feed Cycle Demand

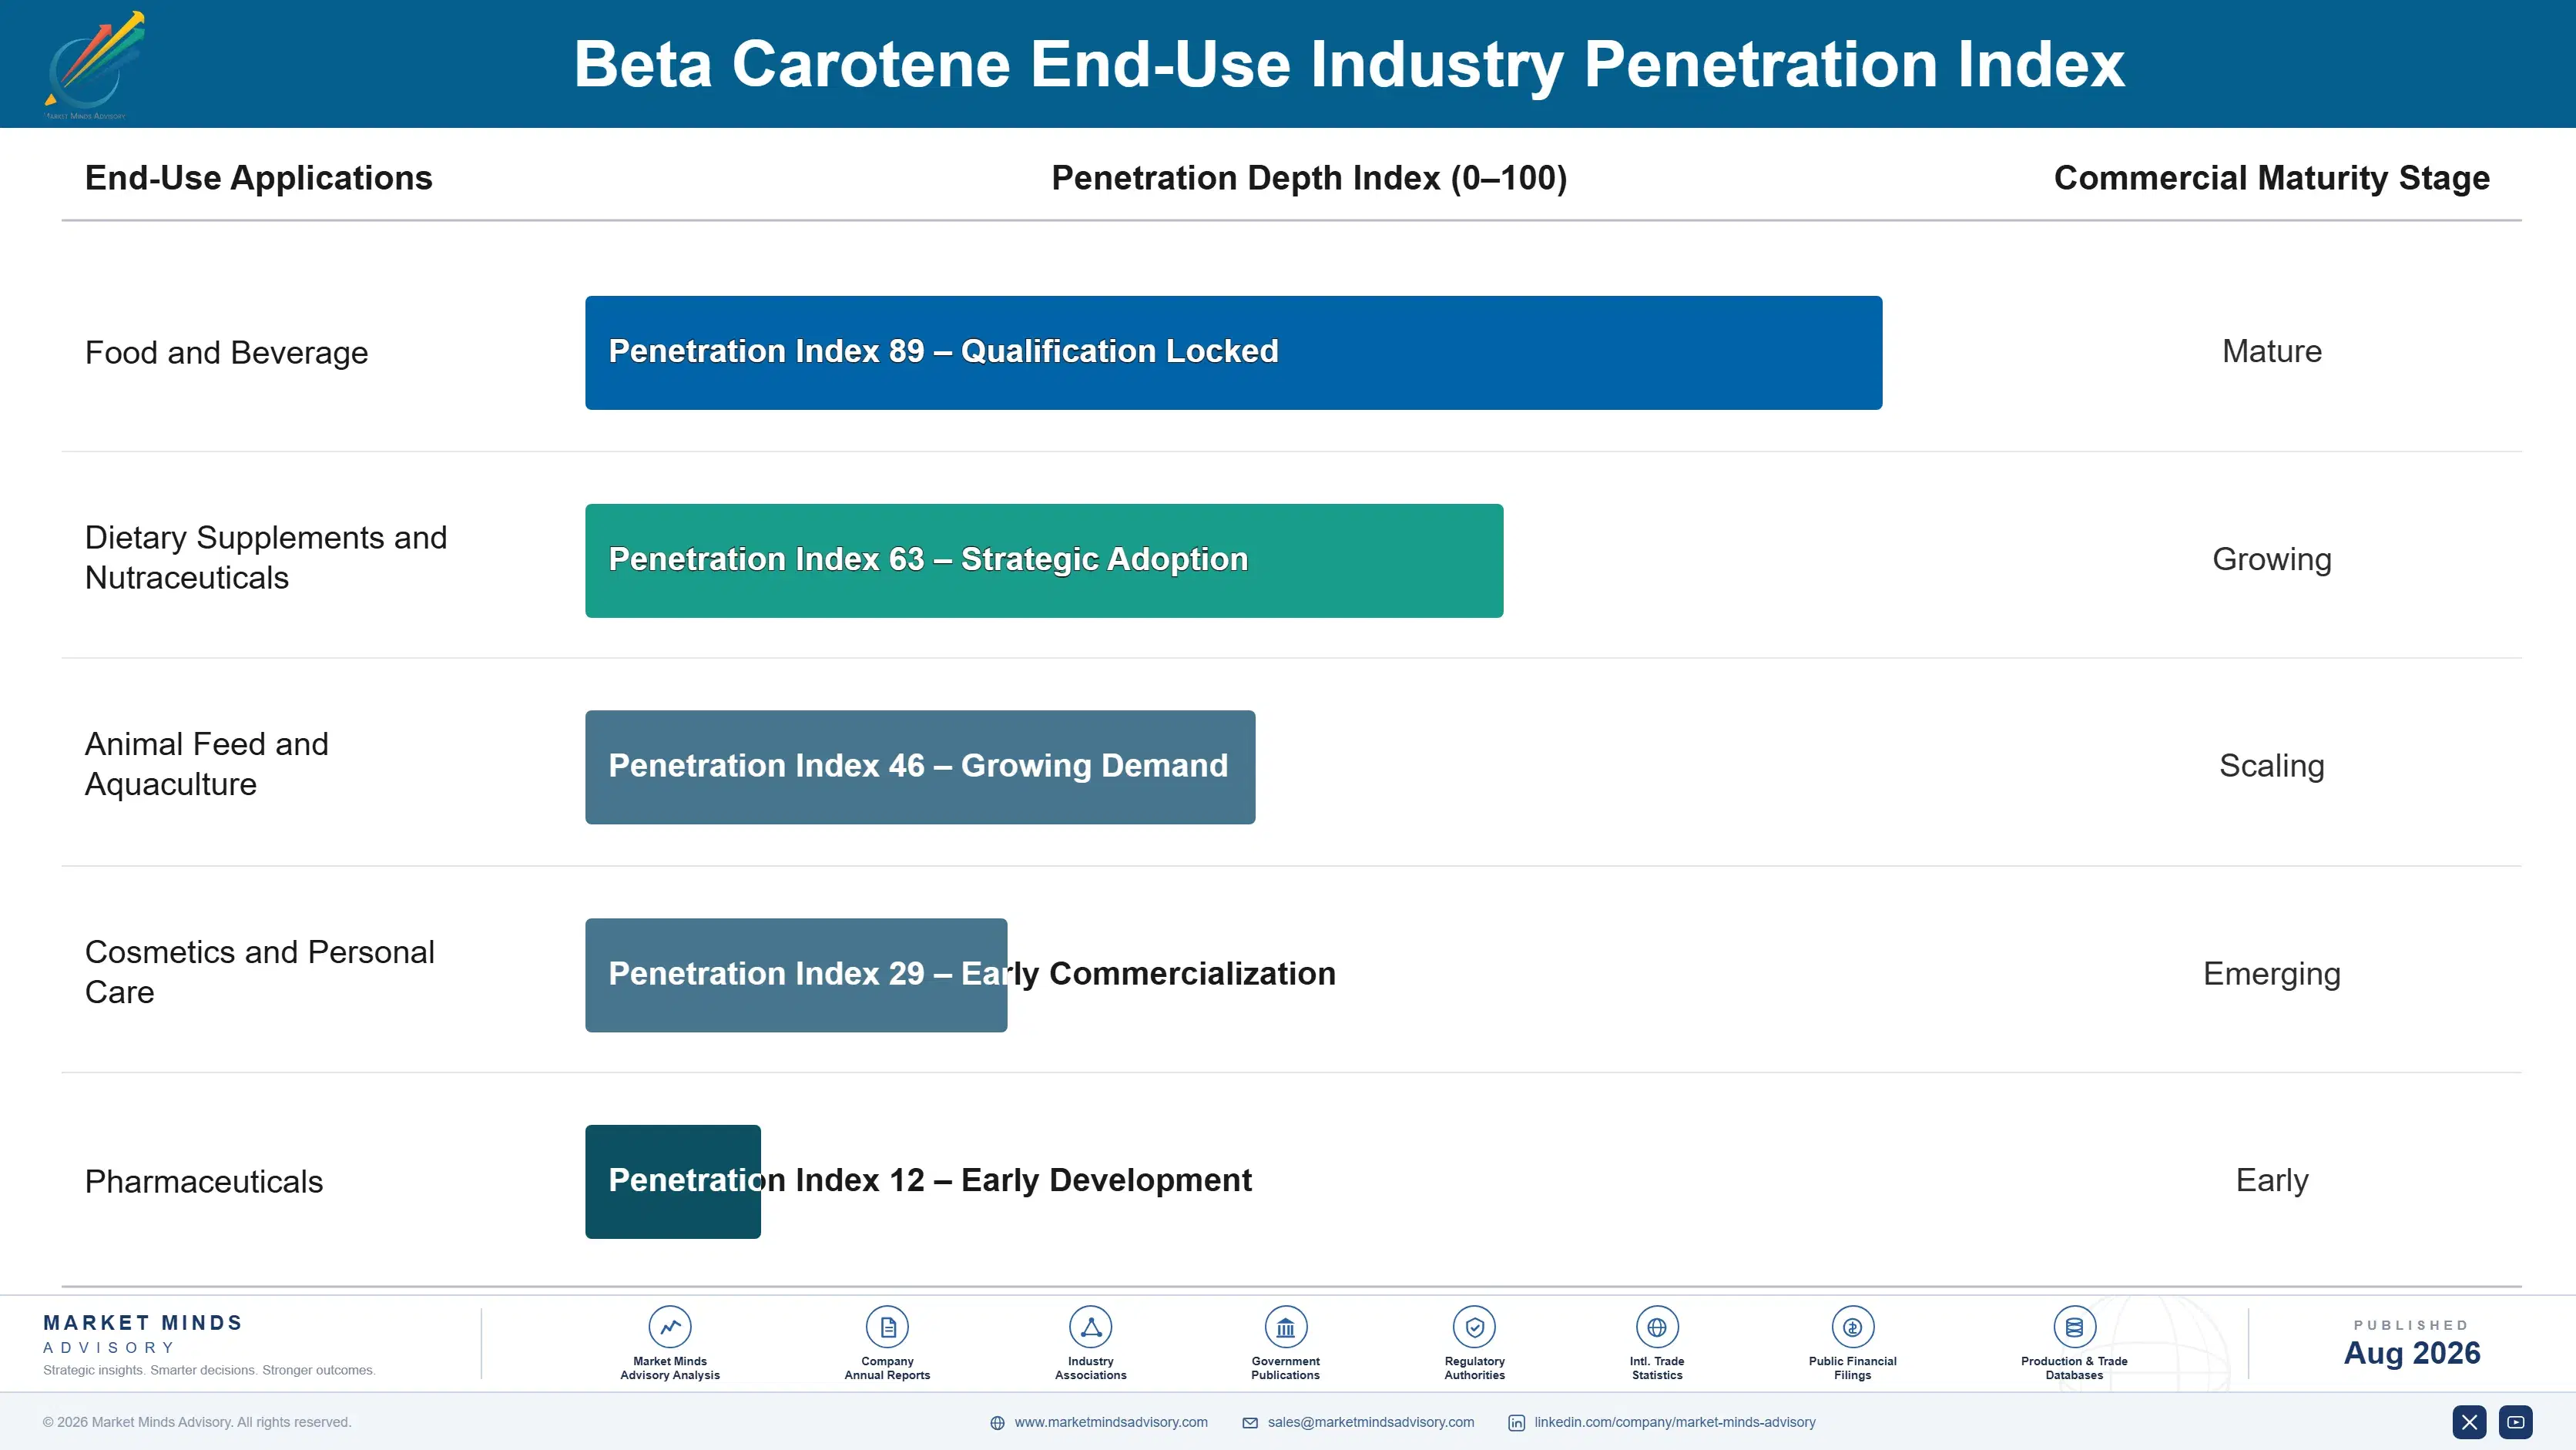
Beta carotene demand behaves less like a one-time reformulation event and more like an annuity once a buyer commits to a natural sourcing specification. Supplement brands and food manufacturers rarely revert to synthetic material after qualifying a natural supplier, since doing so would require re-labeling and risk a clean-label compliance dispute, giving suppliers unusually durable revenue once a contract is won.
Adoption depth varies considerably by end-use vertical. Pharmaceutical and supplement buyers commit deepest, often single-sourcing a qualified natural supplier across multiple product lines for years. Aquaculture feed millers commit almost as deeply once a pigmentation specification is standardized, since reformulating feed recipes disrupts harvest color consistency. Food and beverage colorant buyers, by contrast, show shallower commitment and will revisit sourcing more readily if price gaps widen.

A generational shift in buyer profile is underway too. Younger procurement and brand teams at food and supplement companies increasingly treat natural sourcing as a default assumption rather than a negotiable cost line, a mindset shift that is locking in demand durability even independent of near-term regulatory or retailer pressure. a dynamic that should keep reformulation-driven demand resilient even if regulatory timelines slip or retailer policies soften somewhat in coming years.
beta-carotene-market-trends-growth-end-use-penetration-index-1787461529157

Where Beta Carotene Value Concentrates Next

These are among the four positions where our research anticipates prominent divergence between winners and laggards over the coming forecast period. Each is grounded in the demand model, the regulatory perimeter, and the announced capacity pipeline.
01 / GRADE MIGRATION STRATEGY

Prioritize pharmaceutical-grade capacity over incremental synthetic expansion

Pharmaceutical-grade supplement demand is compounding at roughly forty percent above the category average, and buyers in this tier rarely switch suppliers once a qualification has been completed and documented in full. Producers still pouring capital into synthetic capacity expansion are chasing a shrinking margin pool relative to natural grades, one that keeps narrowing every year reformulation continues across major markets. The capital case for pharmaceutical-grade conversion now clears payback thresholds that looked marginal three years ago, making this the clearest capital allocation priority for producers still holding uncommitted expansion budget.
02 / AQUACULTURE CONTRACT POSITIONING

Lock long-term feed mill contracts before the next capacity cycle

Aquaculture feed millers across Ecuador, Vietnam, India, and Norway are consolidating purchasing around fewer suppliers able to guarantee consistent seasonal potency across harvest cycles in every major producing country. Early movers on long-term supply contracts are securing committed volume well ahead of competitors still selling primarily on spot market terms. Producers without aquaculture-specific supply agreements risk losing access to this channel entirely as feed millers finalize preferred supplier lists over the coming several years, a window that history suggests will not stay open indefinitely.
03 / FEEDSTOCK RISK MANAGEMENT

Hedge petrochemical feedstock exposure before the next price spike

The 2022 feedstock cost spike showed just how exposed unhedged synthetic and precursor-dependent producers are to broader petrochemical market volatility well beyond their direct control. Producers without long-term feedstock agreements or backward integration into precursor chemistry remain vulnerable to a repeat event, and margin compression during the last spike was severe enough to delay planned capacity expansions at several mid-tier competitors for over a year. Locking in supply terms now costs considerably less than repeating that same costly mistake a second time.
04 / REGIONAL EXPANSION SEQUENCING

Prioritize South Asia and Pacific capacity ahead of slower regions

South Asia and Pacific is growing faster than every other region tracked in this report, on the strength of India's aquaculture exports and rapidly expanding domestic supplement demand among urban consumers. Producers sequencing capacity expansion decisions should weight this region ahead of slower-growing Eastern Europe or Middle East and Africa markets, where clean-label pressure and regulatory scrutiny both remain comparatively muted for now. Early positioning here compounds advantage meaningfully as regional feed millers finalize long-term supplier relationships over the next several years.

Engagement Snapshot From the Field

A live engagement with an industry participant carrying material or product regulatory and market exposure ahead of a defining policy shift, showing how our research translates into a defensible multi-year portfolio strategy.
MARKET MINDS ADVISORY · CLIENT ENGAGEMENT SUMMARY
Beta Carotene Producer Strategic Portfolio Review and Transition Roadmap 2026·Investment Scenario on Beta Carotene Exposure Evaluation 2025-26
CLIENT PROFILE
The client, a mid-tier natural ingredients producer headquartered in Southeast Asia with reported annual revenue of approximately 180 million dollars (client-reported, unverified by MMA), operates fermentation and extraction facilities supplying beta carotene primarily into regional food colorant and aquaculture feed markets, with limited presence in higher-margin supplement and pharmaceutical grade tiers. despite operating for more than a decade in the regional specialty ingredients industry.
STRATEGIC CHALLENGE
The client faced margin compression from rising synthetic competition in its core food colorant business while lacking the encapsulation technology and purity documentation needed to compete for pharmaceutical-grade supplement contracts, leaving it uncertain whether to expand existing capacity or pivot toward a higher-margin product tier entirely. without a clear view of the investment required to get there.
MMA APPROACH
MMA conducted a comparative margin analysis across grade tiers using primary survey data and expert interviews with supplement and feed buyers, benchmarked the client's cost structure against integrated competitors, and modeled capacity expansion scenarios weighted by projected demand growth across each application segment through 2036. through 2036, drawing on the same primary survey and interview dataset used throughout this report.
KEY FINDINGS
  1. Pharmaceutical-grade conversion offered a projected fifteen to twenty point gross margin improvement over the client's existing food-grade product line within three years.
  2. Aquaculture feed millers in the client's home region were actively seeking long-term suppliers, an opportunity the client had not yet pursued despite geographic proximity.
  3. The client's existing fermentation strain performance was competitive with larger rivals, meaning the capacity constraint was in purification and encapsulation rather than upstream production.
  4. Regional competitors had not yet made equivalent purity upgrades, giving the client a meaningful first-mover window in its home market before rivals could respond.
CLIENT PROFILE
The client, a mid-tier natural ingredients producer headquartered in Southeast Asia with reported annual revenue of approximately 180 million dollars (client-reported, unverified by MMA), operates fermentation and extraction facilities supplying beta carotene primarily into regional food colorant and aquaculture feed markets, with limited presence in higher-margin supplement and pharmaceutical grade tiers. despite operating for more than a decade in the regional specialty ingredients industry.
STRATEGIC CHALLENGE
The client faced margin compression from rising synthetic competition in its core food colorant business while lacking the encapsulation technology and purity documentation needed to compete for pharmaceutical-grade supplement contracts, leaving it uncertain whether to expand existing capacity or pivot toward a higher-margin product tier entirely. without a clear view of the investment required to get there.
MMA APPROACH
MMA conducted a comparative margin analysis across grade tiers using primary survey data and expert interviews with supplement and feed buyers, benchmarked the client's cost structure against integrated competitors, and modeled capacity expansion scenarios weighted by projected demand growth across each application segment through 2036. through 2036, drawing on the same primary survey and interview dataset used throughout this report.
KEY FINDINGS
  1. Pharmaceutical-grade conversion offered a projected fifteen to twenty point gross margin improvement over the client's existing food-grade product line within three years.
  2. Aquaculture feed millers in the client's home region were actively seeking long-term suppliers, an opportunity the client had not yet pursued despite geographic proximity.
  3. The client's existing fermentation strain performance was competitive with larger rivals, meaning the capacity constraint was in purification and encapsulation rather than upstream production.
  4. Regional competitors had not yet made equivalent purity upgrades, giving the client a meaningful first-mover window in its home market before rivals could respond.
RECOMMENDED STRATEGY
Phase 1: Phase 1 (0-6 months): Commission a dedicated purification line to meet pharmaceutical-grade isomer purity and heavy-metal specifications required by supplement buyers. Phase 2: Phase 2 (6-18 months): Pursue qualification with two to three regional supplement brands while securing an aquaculture feed mill anchor contract. Phase 3: Phase 3 (18-36 months): Scale pharmaceutical-grade capacity based on qualification success and evaluate licensing encapsulation technology from an established partner.
OUTCOME
Within eighteen months of implementing the phased strategy, the client reported securing its first pharmaceutical-grade supplement contract and a three-year aquaculture feed supply agreement, alongside a reported blended gross margin improvement of roughly nine percentage points across its natural product lines (client-reported, unverified by MMA).

Frequently Asked Questions

Foundational context covering the market sizes, CAGR, scope, country, region and competition that inform every finding below. This section is provided to cover basics and most often pre-purchase conversations, answered from the MMA Primary Research Dataset.

What is the current size of the Beta Carotene Market?

The global beta carotene market was valued at approximately 0.8 billion dollars in 2025. Growth is concentrated in natural fermentation and algae-derived grades serving supplement and aquaculture feed applications.

How large will the Beta Carotene Market be by 2036?

The market is projected to reach approximately 1.6 billion dollars by 2036. This represents roughly a 1.88 times expansion from 2026 levels over the forecast period.

What is the CAGR for the Beta Carotene Market 2026 to 2036?

The market is forecast to grow at a compound annual growth rate of 6.5 percent between 2026 and 2036. Bull and bear scenarios range from 5.3 to 7.7 percent depending on regulatory and feedstock conditions.

Which segment is growing fastest?

Dietary supplements and nutraceuticals is the fastest-growing segment, expanding at approximately 9.2 percent annually. This is roughly 1.4 times the overall market growth rate, driven by ageing-population preventive nutrition spending.

Who are the major companies in the Beta Carotene Market?

Leading producers include BASF SE, dsm-firmenich, Allied Biotech Corporation, Divi's Laboratories, and Zhejiang NHU Company. These five companies control roughly forty-two percent of global production capacity.

Which country is growing fastest?

India is the fastest-growing national market, expanding at approximately 9.1 percent annually. Growth is driven by aquaculture feed exports and rising domestic dietary supplement consumption among urban consumers.

Report Segmentation Architecture

The full report scope spans multiple orthogonal segmentation dimensions, with cross-tabulated demand data provided for each dimension pair. Coverage extends further to regional breakdowns, trend trajectories, and the competitive detail needed to support segment-level decision-making.

By Production Source

  • Synthetic (Petrochemical) Beta Carotene
  • Natural Algae-Derived Fermentation
  • Natural Fungal Fermentation
  • Natural Plant Extraction
  • Blended Natural-Synthetic Formulations

By End-Use Industry

  • Food and Beverage
  • Dietary Supplements and Nutraceuticals
  • Animal Feed and Aquaculture
  • Cosmetics and Personal Care
  • Pharmaceuticals

By Commercial Dimension

  • Direct Manufacturer Supply
  • Distributor and Blender Channel
  • Private-Label Contract Supply
  • Spot Market Transactions

By Region

  • North America
  • Western Europe
  • East Asia
  • South Asia and Pacific
  • Latin America
  • Middle East and Africa
  • Eastern Europe

Scope, Methodology, and Coverage

Every figure in this report is reproducible from documented input assumptions. The scope below maps the historical period, the forecast horizon, the segmentation dimensions, and the countries covered, alongside the underlying primary and qualitative methodology.
Historical Period
2020 to 2025
Forecast Period
2026 to 2036
Base Year
2025 (USD billions; MMA Primary Research Dataset, August 2026)
Market Definition
The beta carotene market covers commercial production and sale of natural and synthetic beta carotene used as a colorant, provitamin A source, and antioxidant additive across food and beverage, dietary supplement, animal feed, cosmetic, and pharmaceutical applications. It excludes downstream finished supplement products and other distinct carotenoid ingredients such as astaxanthin or lutein.
Quantitative Units
USD billions (current prices); metric tons of production volume where applicable
Segmentation Dimensions
By Production Source; By End-Use Industry; By Commercial Dimension; By Region
Regions Covered
North America, Western Europe, East Asia, South Asia and Pacific, Latin America, Middle East and Africa, Eastern Europe
Countries Covered
USA, China, Germany, France, UK, Japan, South Korea, India, Australia, Canada, Brazil, Mexico, Indonesia, Vietnam, Thailand, Malaysia, UAE, Saudi Arabia, South Africa, Nigeria, Turkey, Poland, Netherlands, Italy, Spain, Sweden, Switzerland, Argentina, Colombia, Singapore, and additional markets relevant to this sector
Key Companies Profiled
BASF SE, dsm-firmenich, Allied Biotech Corporation, Divi's Laboratories, Zhejiang NHU Company, Kemin Industries, Lycored, Chenguang Biotech Group, Vitablend Nederland, ExcelVite, Algatechnologies, Fenchem Biotek, Piveg Inc, Roha Group, San-Ei Gen F.F.I., BioExtracts, Vitae Naturals, DDW The Color House, Naturex, Shandong Freda Biotechnology
Quantitative Methodology
Primary survey, n=3,800 respondents, Q4 2025, six countries; demand-side model with trade association cross-validation
Qualitative Methodology
47 expert interviews, Q4 2025; applied to validate demand model assumptions, identify emerging dynamics, and assess competitive positioning
Report Format
PDF and XLSX data workbook (Word format preview document)
Publisher
Market Minds Advisory
Report Code
MMA-2026-CHM-101
Published
August 2026
Contact
sales@marketmindsadvisory.com | www.marketmindsadvisory.com

Purchase the full Beta Carotene Market Report (2026 to 2036).

This report delivers a complete commercial assessment of the global beta carotene market across production sources, end-use applications, and seven world regions. It includes detailed segmentation analysis, competitive benchmarking of twenty profiled companies, and quantified regulatory and feedstock cost risk assessments across every major producing geography. Analysts combine primary survey data from 3,800 respondents with 47 expert interviews conducted in the fourth quarter of 2025 to validate demand forecasts running through 2036. The report is designed to support capacity planning, grade migration, and supply contract negotiation decisions for producers, feed millers, and ingredient buyers alike.
Ten-year quantitative market forecast across all major segments
Detailed grade-level segmentation analysis across five applications
Seven-region demand breakdown with share and CAGR data
Twenty-company competitive profiles with moat and risk analysis
Feedstock cost risk assessment with mitigation strategies
Aquaculture and dietary supplement channel demand analysis

Built For The People Who Decide

From boardroom strategy to bench-side execution, this report is read cover-to-cover by leaders shaping the next decade of their industry, turning demand scenarios, market dynamics and valuation benchmarks into decisions.
CXOs/ Presidents/ VPs/ Managers
M&A and Corporate Development
Strategy Teams and R&D Heads
Procurement and Product Directors
Regulatory and Compliance Leaders
Investor Relations and Equity Analysts