Market Minds Advisory
Barley Protein Market

Barley Protein Market: Barley Protein Market. Brewing Side-Stream Upcycling, Clean-Label Extraction, and Low-Allergen Plant Protein Demand Reshape Cereal Proteins.

Barley protein is emerging as a low-allergen cereal protein as brewers upcycle spent grain, extraction plants scale, and food makers weigh its taste and gluten limits against pea and soy in plant-based drinks and bakery.

Lead Analyst

Published

September 2026

Make Smarter Decisions with Customized Research Insights

Request a free sample report and evaluate market opportunities, growth trends, and competitive dynamics relevant to your business needs.

2025 MARKET VALUE$0.4BMarket Size 2025
2036 FORECAST VALUE$1.2BBase Case , 2026 to 2036
CAGR 2026 TO 203610.8 %Bull 12.1% / Bear 9.5%
INCREMENTAL OPPORTUNITY$0.8BNet 10- year value creation
EXPANSION MULTIPLE2.79x2036 value over 2026 base
Strategic Levers
M&A Pipeline
Regional Outlook
Country Rankings
Competitive Intelligence
Segmental Deep-dive
Call-Us : 91 93563 13602

Executive Snapshot and Market Trajectory.

Every brewery throws away a mountain of spent grain, and about a fifth of it is protein. Barley protein turns that waste into an ingredient, which is why brewers, maltsters, and starch processors are racing to build extraction plants before pea and soy rivals take the low-allergen shelf.
Barley protein isolates grow fastest, driven by plant-based beverage makers, sports nutrition brands, and bakeries that want a neutral cereal protein without soy or pea allergens, while spent grain concentrates anchor volume in feed-adjacent and snack uses. Western Europe holds the largest share because Nordic, German, and Belgian brewing and malting industries supply the raw material and host the first commercial plants, with North America following through brewer-led programs. Australia leads country growth.
Competition is concentrated among a few brewer-backed ventures, starch and protein processors, and specialist extraction start-ups. Advantage comes from side-stream access, extraction yield, and food-grade purity rather than price alone. Regulation shapes returns, since gluten labeling, novel food approvals, and upcycled ingredient standards decide what may be sold. Buyers reward clean taste, verified gluten status, and stable supply contracts with brewers. Certification adds cost but earns premiums.
Market Definition
Barley protein comprises protein concentrates, isolates, hydrolysates, and textured ingredients extracted from barley grain, malt, and brewers' spent grain, sold to food, beverage, nutrition, and feed-adjacent buyers. The scope excludes whole barley flour, malt extract sold for flavour, barley beta-glucan fibre, animal feed meal, and finished plant-based products where barley protein is a minor component.
Base Year Value
$0.4B in 2025 (MMA Primary Research Dataset, September 2026)
Forecast Period
2026 to 2036, eleven discrete annual values
CAGR
10.8% base case. Bull 12.1%. Bear 9.5%.
Fastest Growth Segment
Barley Protein Isolates: 15.9% CAGR
Fastest Growth Country
Australia: 13.9% CAGR
Fastest Growth Region
South Asia and Pacific: 12.8% CAGR
Largest Region
Western Europe: 32% of 2025 global value
Market Leaders
EverGrain, Lantmannen, Cargill, Roquette, Kerry Group. Source: MMA Analysis, company annual reports.
Primary Survey
n=3,800 procurement and R&D decision-makers, Q4 2025, six countries
Methodology
Demand-side build-up, cross-validated against public data, 47 expert interviews

Barley Protein Market Forecast Scenarios

barley-protein-market-size-forecast-scenario-1789771855340
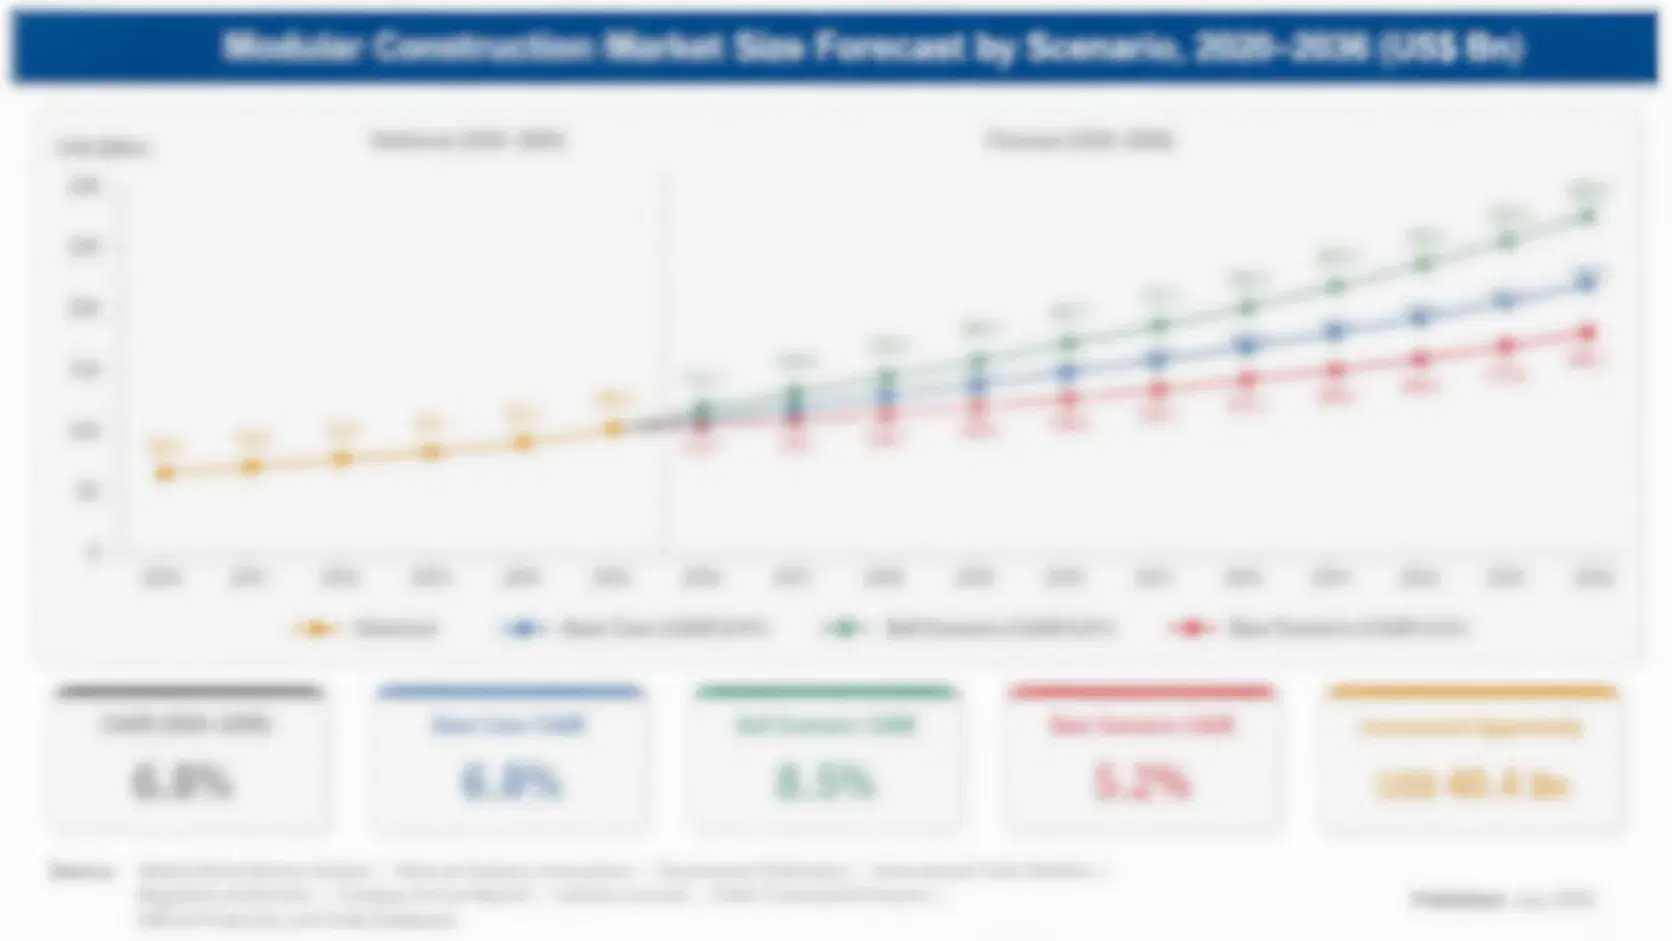
From 2020 to 2025, barley protein moved from pilot plants to first commercial volumes as brewers looked for value in spent grain and plant-based brands looked for alternatives to soy and pea. Growth averaged 9.6% a year from a small base, with isolates outpacing concentrates, though extraction cost, taste challenges, and gluten questions slowed adoption among cautious beverage and bakery buyers.
The base case assumes 10.8% annual growth through 2036, built on three named mechanisms: brewer and maltster investment in extraction plants that turn spent grain into a saleable protein stream, rising demand for allergen-light plant proteins in beverages, bars, and bakery as pea and soy face supply and labeling pressure, and improving extraction and hydrolysis technology that lifts yield and removes bitterness and colour. Upcycling claims support pricing. Each mechanism reinforces the others across the decade.
The bull case, at 12.1%, needs approved gluten-free-compatible grades and faster brewer plant roll-outs. The bear case, at 9.5%, reflects persistent taste issues, pea protein price cuts, and slower novel food approvals. Either path leaves the demand base intact, though mix and pricing would shift noticeably. Investors should weight the base case most heavily given current evidence.

Side-Stream Access and Extraction Yield Decide Barley Protein Winners

Barley protein is extracted from barley grain, malt rootlets, or brewers' spent grain, the wet residue left after mashing. Processors dry and mill the material, then use water, enzymes, and filtration to separate protein from fibre and starch, and finish with drying. Concentrates hold 50% to 70% protein, isolates above 85%. Taste, colour, and gluten content are the technical problems that decide which grades reach food makers.
MARKET CONCENTRATION52% CR5Leading five producers hold a large combined share
AVERAGE ISOLATE PRICE$6.40 per kgBarley isolates sell at a premium to pea protein
SPENT GRAIN PROTEIN CONTENT20%Typical protein share of dry brewers' spent grain
EXTRACTION YIELD55%Share of available protein recovered in modern plants
FEEDSTOCK SHARE OF COGS24%Spent grain and barley purchases are a modest cost line
PLANT UTILISATION58%Typical operating rate for early commercial extraction plants
Buyers use barley protein in several ways. Plant-based beverage makers use it for body and protein content, bakeries and snack makers add it to bars, crackers, and pasta, sports nutrition brands blend it with pea and rice proteins, and pet food makers use lower grades. Specifications cover protein content, solubility, gluten level in parts per million, and microbial counts, and buyers require food safety certificates on every lot.
The industry is concentrated at the producer stage. Brewer-backed EverGrain, Lantmannen in Sweden, and large processors such as Cargill and Roquette hold the technology and access to feedstock, while start-ups add niche extraction and upcycled brands. Side-stream contracts with breweries, novel food rules, and gluten labeling shape investment, and long-term offtake agreements are widening the buyer base.
"Barley protein is not a protein shortage story, it is a spent grain economics story. The company that controls the cheapest, cleanest stream of brewery residue will set the price ceiling for everyone who wants to sell a cereal protein."
Practice Lead, Plant Proteins and Cereal Ingredients Practice · MMA Plant Proteins and Cereal Ingredients Practice · September 2026

Market Trends

Brewers Build Spent Grain Protein Extraction Plants Beside Their Breweries

Large brewers are turning spent grain from a low-value feed into a protein stream by building extraction plants beside breweries, which avoids transport of wet material and secures steady feedstock. AB InBev and Archer Daniels Midland formed EverGrain to produce protein and fibre from spent grain, and European maltsters and starch processors are adding similar capacity. A large brewery generates 20,000 to 60,000 tonnes of spent grain a year, and extraction plants recover 40% to 60% of available protein. Contracts with breweries fix feedstock cost, and upcycled claims let brands charge 10% to 20% premiums.
Market Impact: spent grain is 85% of by-products
Allergen-Light Cereal Proteins Gain Ground Against Soy and Pea

Beverage and snack makers are diversifying away from soy and pea, which face allergen labeling, off-flavour complaints, and supply concentration in a few countries, and barley protein offers a neutral cereal alternative. Barley is not one of the major allergens in the United States, though it contains gluten, so brands must choose grades carefully and label accordingly. Isolates with gluten below 20 parts per million are in development, and brands blend barley protein with pea and rice to balance amino acids. Formulators report that blends lift protein content by 2 to 4 grams per serving.
Market Impact: pea prices rose sharply in 2022

Market Opportunities and Growth Drivers

Upcycling and Circular Goals Push Brewers to Monetise Spent Grain

Brewers face sustainability targets that reward waste reduction, and spent grain, which accounts for about 85% of brewing by-products, is a visible target. Selling it as protein instead of feed can raise its value from $30 to $60 per tonne to several hundred dollars per tonne of dry protein-rich material. Upcycled Food Association standards in the United States give brands a certified label, and European retailers reward circular sourcing in tenders. Brewer and food company partnerships now secure feedstock and offtake together, and investors treat side-stream protein as a lower-risk route to plant-based protein than growing new crops.
Market Impact: processing adds 10-25% to cost

Plant-Based Protein Demand Creates Room Beyond Soy and Pea

Plant-based protein ingredient demand is growing at high single digits, driven by beverages, meat alternatives, bakery, and sports nutrition, and formulators want blends that improve taste and reduce dependence on a few crops. Pea protein prices rose sharply in 2022 and 2023, according to European Commission and United States Department of Agriculture trade data. Barley grows in temperate zones from Canada to Australia, giving processors an alternative origin. Brands that add a third protein to blends gain resilience and marketing points, and barley protein at $4 to $7 per kilogram can compete in selected uses.
Market Impact: plants cost $30-120 million

Market Restraints and Challenges

Taste, Colour, and Gluten Content Limit Barley Protein Use

Barley protein carries a cereal, slightly bitter taste and grey-brown colour, and it contains hordein, a gluten protein, which excludes it from gluten-free products unless heavily processed. The root cause is the molecular makeup of barley proteins and phenolic compounds that bind to them. Beverage makers report off-notes above 2% inclusion, and celiac consumers cannot use most grades. Mitigation includes enzymatic hydrolysis, membrane filtration, colour removal, and blending, though each step adds cost of 10% to 25% and lowers yield, and reduced-gluten grades still need regulatory clarity, so adoption remains selective and slow.
Market Impact: breweries yield 20,000-60,000 tonnes

High Extraction Cost and Scale-Up Risk Slow Plant Rollout

Extraction from wet spent grain needs drying, milling, enzymes, filtration, and wastewater treatment, and plants cost $30 million to $120 million for meaningful capacity, according to company announcements. The root cause is the high water and energy use of protein separation and the seasonal, variable nature of feedstock. Utilisation in early plants runs near 58%. Mitigation includes plant sites beside breweries, modular equipment, and offtake agreements to support financing, though projects still face delays, and pea protein price declines can make barley protein uncompetitive, which makes lenders cautious about new capacity.
Market Impact: blends lift protein by 2-4 grams
3 additional market trends, 4 additional growth drivers, and 2 additional restraints and challenges are covered in the full report. Contact sales@marketmindsadvisory.com to access the complete intelligence.

Segment CAGR and Growth Architecture

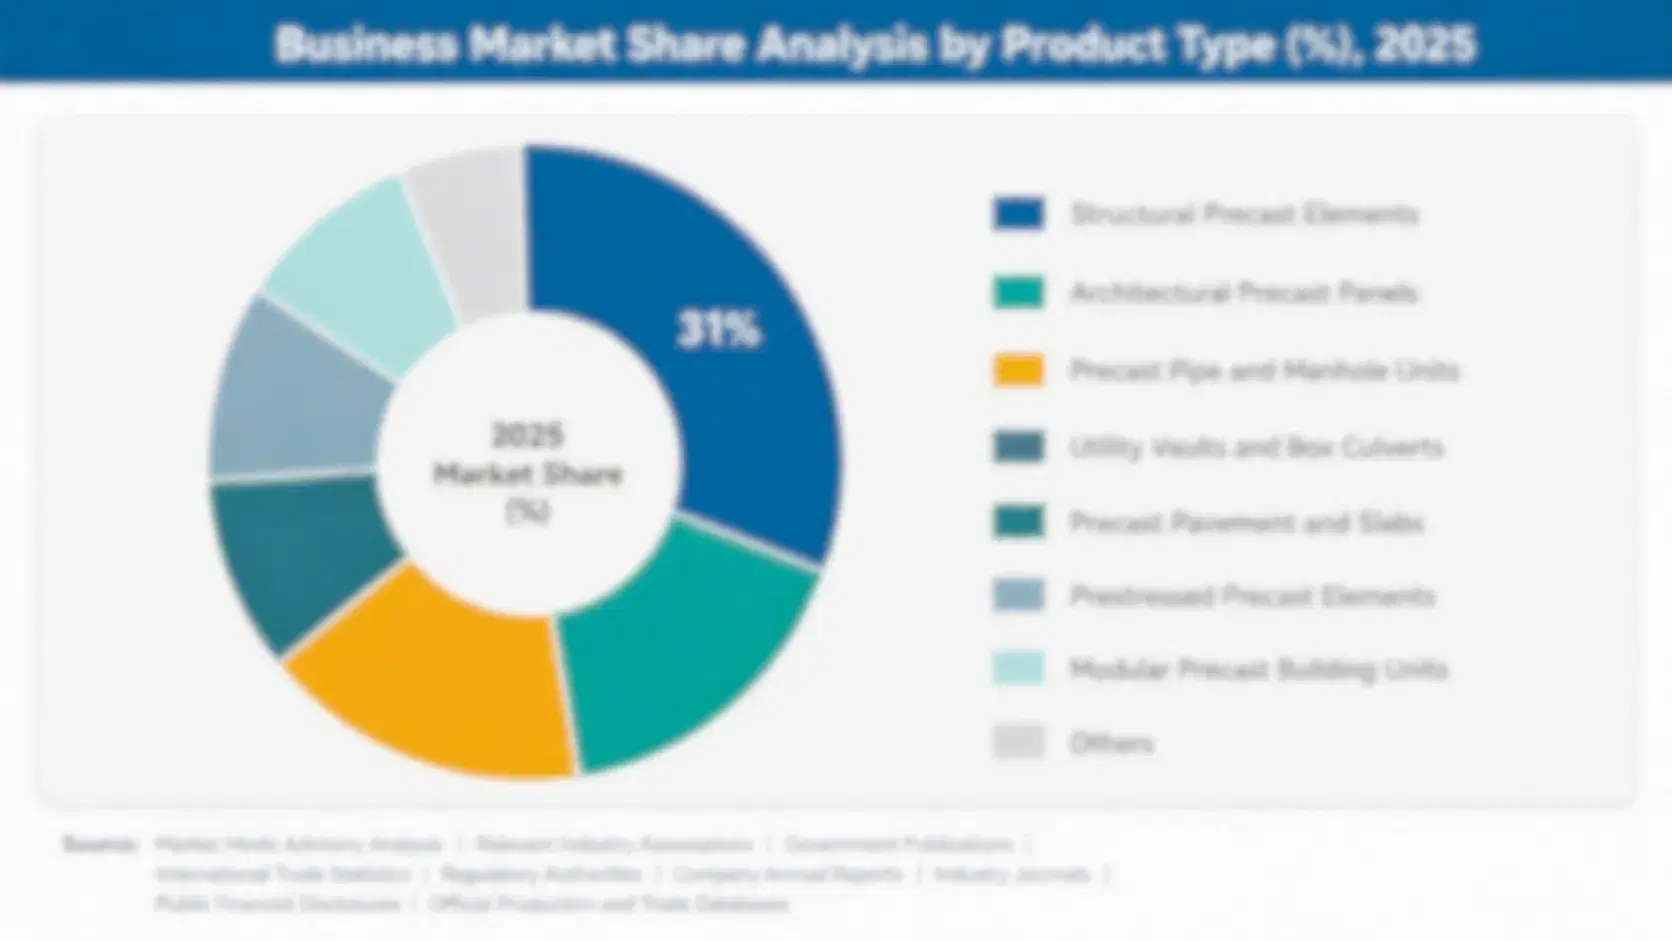
Barley protein is segmented by grade and processing route, because protein content, taste, gluten status, price, and buyer group differ more sharply between concentrates, isolates, hydrolysates, textured products, and spent grain flours than they do by end use. Barley protein isolates attract the most investment as beverage and nutrition brands convert cleaner taste and higher protein into premium contracts.
barley-protein-market-market-share-analysis-1789771855513

Barley Protein Isolates

Barley protein isolates are the fastest-growing segment, produced by alkaline or enzymatic extraction followed by precipitation and membrane filtration to reach protein content above 85% with reduced fibre, colour, and bitterness. Plant-based beverage makers, sports nutrition brands, and clinical nutrition buyers use them for solubility and neutral taste. Prices run 30% to 60% above concentrates, and yields are lower, so supply is tight. Producers with brewery feedstock contracts, membrane technology, and food safety certification win listings, and buyers run several trials before replacing pea or soy in flagship recipes. Pilot lots typically run for two seasons before beverage brands commit to full launches and multi-year supply agreements with producers each year.
CAGR 15.9%

Spent Grain Protein Concentrates

Spent grain protein concentrates are the second-fastest segment, made by dry fractionation or mild wet processing of brewers' spent grain to reach 40% to 65% protein while keeping fibre and some flavour. Bakeries, snack makers, pet food brands, and upcycled food companies buy them for protein and fibre boosts at moderate cost. Brewer-linked plants supply most volume under offtake agreements, and upcycled labels support premiums of 10% to 20%. Colour, gritty texture, and variable quality limit use in drinks, so brands focus on bars, crackers, and pasta, and suppliers invest in standardisation and testing. Standardisation matters here, because colour and protein content vary with brewery recipes, so producers blend lots and publish specification sheets.
CAGR 13.1%
Full segment breakdown across 6 segments available in the complete report.

Regional Architecture and Country Demand Map

Barley protein value follows brewing and malting geography, side-stream processing capacity, and plant-based ingredient demand. Western Europe leads through Nordic, German, and Belgian brewers and starch processors, North America follows through brewer-backed plants, and Australia is the fastest-growing country as barley supply and export ambitions expand.

North America

North America holds 26% share, with the United States and Canada hosting large brewery networks, barley growers in Alberta, Saskatchewan, Idaho, and Montana, and brewer-backed programs such as EverGrain in St. Louis. Plant-based beverage brands, sports nutrition companies, and craft brewers buy upcycled protein. Cargill, Kerry, and Ingredion add processing and distribution reach, while start-ups such as ReGrained sell spent grain ingredients. FDA gluten rules, taste limits, and high extraction cost restrain returns, though brewer sustainability goals and plant-based demand keep growth close to the global rate. Mexican brewers and Canadian maltsters add regional feedstock and pilot partnerships. Canadian craft brewers and American malting companies also join pilot programs, and food brands request upcycled certificates.
Share: 26% | CAGR: 10.6% (2026 to 2036)

Western Europe

Western Europe holds 32% share, above its usual band, because Germany, Belgium, the Netherlands, Denmark, Sweden, and Finland combine the world's densest brewing and malting industries with early commercial extraction plants and strong upcycled ingredient demand, so the region holds both feedstock and first-mover processors. Lantmannen, Boortmalt, Viking Malt, Emsland Group, and Roquette lead activity. European Union novel food rules and gluten labeling slow launches and hold growth below the global rate, though circular economy policy and retailer sustainability targets support steady volume. Nordic oat and barley beverage brands add domestic pull for barley-based protein. Dutch and Danish processors also test barley protein in oat drinks, while retailers in the United Kingdom and Germany ask for upcycled claims.
Share: 32% | CAGR: 9.4% (2026 to 2036)
Regional intelligence for 5 additional markets available in the complete report: East Asia, South Asia and Pacific, Latin America, Middle East and Africa, Eastern Europe. Contact sales@marketmindsadvisory.com.
barley-protein-market-country-cagr-analysis-1789771855690

Four Margin Routes for Barley Protein Producers

Margin in barley protein comes from moving beyond low-value spent grain toward isolates, hydrolysates, and application-tuned grades that beverage and nutrition brands cannot easily replace. Producers that secure brewery feedstock, invest in membrane and drying technology, and tie specifications to customer recipes earn more per kilogram than sellers competing on protein content and price alone.

Locking Long-Term Spent Grain Contracts With Breweries and Maltsters

Feedstock is 24% of cost of goods and wet grain spoils within days, so producers that sign multi-year contracts with breweries and maltsters, and build plants beside them, secure supply and avoid transport cost. Contracts cost nothing or a small fee per tonne, compared with spot grain at $30 to $60 per tonne, and they protect against shortages that cost 6 to 10 margin points. A brewery producing 40,000 tonnes of spent grain supports about 2,000 tonnes of protein. Brewers value predictable offtake, and both sides gain from shared sustainability claims and joint marketing of upcycled products.
Market Impact: brewery contracts protect 6 to 10 margin points

Upgrading From Concentrates to Isolates With Membrane Filtration

Isolates sell at 30% to 60% above concentrates, so producers that add membrane filtration, decolorisation, and spray drying capture much higher margin from the same feedstock. A membrane line costs $8 million to $25 million and is recovered within five seasons when sold to beverage and nutrition accounts. Isolates with above 85% protein and low gluten open sports nutrition and clinical uses. Customers validate each grade through pilot lots before scaling, and suppliers that share data on solubility, taste, and residue save weeks of testing, and contracts renew annually with agreed price bands and volume commitments.
Market Impact: isolate upgrades earn 30% to 60% price premiums

Certifying Upcycled and Low-Gluten Grades for Premium Buyers

Upcycled certification and verified low-gluten testing support premiums of 10% to 20% and open retailers and brands that will not buy uncertified ingredients. Certification and testing add 2% to 4% to cost, but certified lots sell at 10% to 20% above uncertified protein and avoid rejected shipments. Brands use the upcycled label on pack to reach sustainability-minded shoppers, and once a customer approves a supplier, switching means new audits and trials. Contracts run one to three years, and traceability records also support claims about carbon savings and waste reduction that retailers increasingly ask for.
Market Impact: certified lots earn 10% to 20% price premiums

Supplying Beverage and Nutrition Brands With Custom Protein Blends

Beverage and nutrition brands pay for blends of barley, pea, and rice protein tuned to taste and amino acid profile, so producers that offer custom blends and application support earn gross margins of 30% to 40%, above bulk concentrate sales at 15% to 22%. Technical support in formulation trials costs 3% to 5% of sales but shortens approvals by months. Customers sign annual volumes of 50 to 500 tonnes, and once a recipe is set, switching means reformulation. Producers also gain demand signals that guide investment in capacity, packaging, and new grade development.
Market Impact: custom blends earn 30% to 40% gross margins

Who Controls the Margin Pool

The barley protein industry is concentrated at the producer stage, with the top five suppliers holding about 52% of global revenue, the basis used throughout this section. EverGrain, Lantmannen, Cargill, Roquette, and Kerry Group lead through feedstock access, extraction technology, and customer relationships, while start-ups, maltsters, and regional processors serve niche buyers and pilot volumes in food and beverage categories.
Competition centers on three dimensions: feedstock security through brewery and maltster contracts, extraction yield and purity measured by protein content, taste, and gluten testing, and market access across beverages, bakery, nutrition, and blended protein programs. Leaders sign offtake agreements with brands and invest in isolate capacity, while challengers compete on upcycled positioning and price. Blends add another layer of differentiation. Consistency decides listings.

Emerging pressure comes from pea and oat protein producers cutting prices, from start-ups scaling brewery-side plants, and from brewers building extraction in-house instead of selling spent grain. Rankings shift where producers secure clean feedstock, win beverage approvals, or lose to cheaper alternatives. Acquisitions of start-ups and brewery partnerships will reorder positions faster than organic growth, particularly as buyers look for supply that reduces dependence on soy and pea origins.
barley-protein-market-company-positioning-matrix-1789771855870

Competitive Moat and Risk Dimensions

EVERGRAIN

Moat: Brewer-Backed Feedstock and Scale

EverGrain is a venture of AB InBev and Archer Daniels Midland that converts spent grain from large breweries into protein and fibre ingredients. It has access to feedstock from one of the world's biggest brewing networks, extraction technology, and ADM's food ingredient distribution, which give it scale and credibility with beverage and food brands looking for upcycled protein.
EVERGRAIN

Risk: Brewery Dependence and Scale-Up

EverGrain depends on the output and cooperation of its brewer parent, so brewery closures or changes in spent grain policy could limit feedstock. Scale-up of extraction plants has faced cost pressures, and competing pea and oat proteins can undercut prices if buyers do not value the upcycled story.
LANTMANNEN

Moat: Nordic Cereal Processing Expertise

Lantmannen is a Swedish farmer-owned cooperative with cereal milling, malting, and bioprocessing businesses, giving it direct access to barley, spent grain, and processing know-how. Its biorefinery capabilities, food ingredient customers, and long-standing farmer relationships support development of barley and oat protein ingredients, and its cooperative structure supports patient investment in new cereal-based product lines.
LANTMANNEN

Risk: Regional Focus and Market Reach

Lantmannen's activities centre on Northern Europe, so its reach in North America and Asia depends on partners and distributors. Larger ingredient groups with global sales forces can move faster with beverage brands, and volatile barley prices and gluten questions could slow commercial uptake of its protein lines.

Players Tracked

Prominent Players

EverGrain
Lantmannen
Cargill
Roquette
Kerry Group

Other Key Players

Ingredion
Tate and Lyle
Puris
Axiom Foods
Burcon NutraScience
Bunge
Emsland Group
Glanbia Nutritionals
Avebe
DSM-Firmenich
ReGrained
Tereos
Crespel and Deiters
Boortmalt
Viking Malt

Recent Developments

MARCH 2026

EverGrain Expands Spent Grain Protein Extraction Capacity at United States Brewery

EverGrain completed an organic expansion of spent grain protein extraction capacity beside a large United States brewery, adding drying and membrane filtration lines. The project is internal capital spending. It raises output of barley protein grades, and supports supply agreements with beverage and nutrition brands seeking upcycled protein.
Signal: Shows brewer-backed producers now investing in extraction capacity to serve upcycled plant protein demand at scale.
OCTOBER 2025

Lantmannen Signs Multi-Year Barley Protein Supply Agreements With Nordic Food Brands

Lantmannen signed multi-year barley protein supply agreements with Nordic food and beverage brands, covering volumes, protein specifications, and price formulas linked to feedstock cost. They give its plants steadier offtake, support financing of new capacity, and help brands secure allergen-light protein for oat and barley based products.
Signal: Confirms producers are locking in food brand demand through multi-year agreements to support new extraction capacity.
MAY 2025

Roquette Launches Cereal Protein Range for Plant-Based Beverages and Bakery

Roquette launched a cereal protein range for plant-based beverages and bakery, including barley-derived grades with improved solubility and neutral taste. The launch is a product introduction, not an acquisition. It widens its plant protein portfolio beyond pea, tests demand for cereal proteins, and gives formulators an additional option for blends.
Signal: Shows global protein producers now adding cereal proteins to portfolios to diversify beyond pea and soy.

What Drives Barley Protein Costs

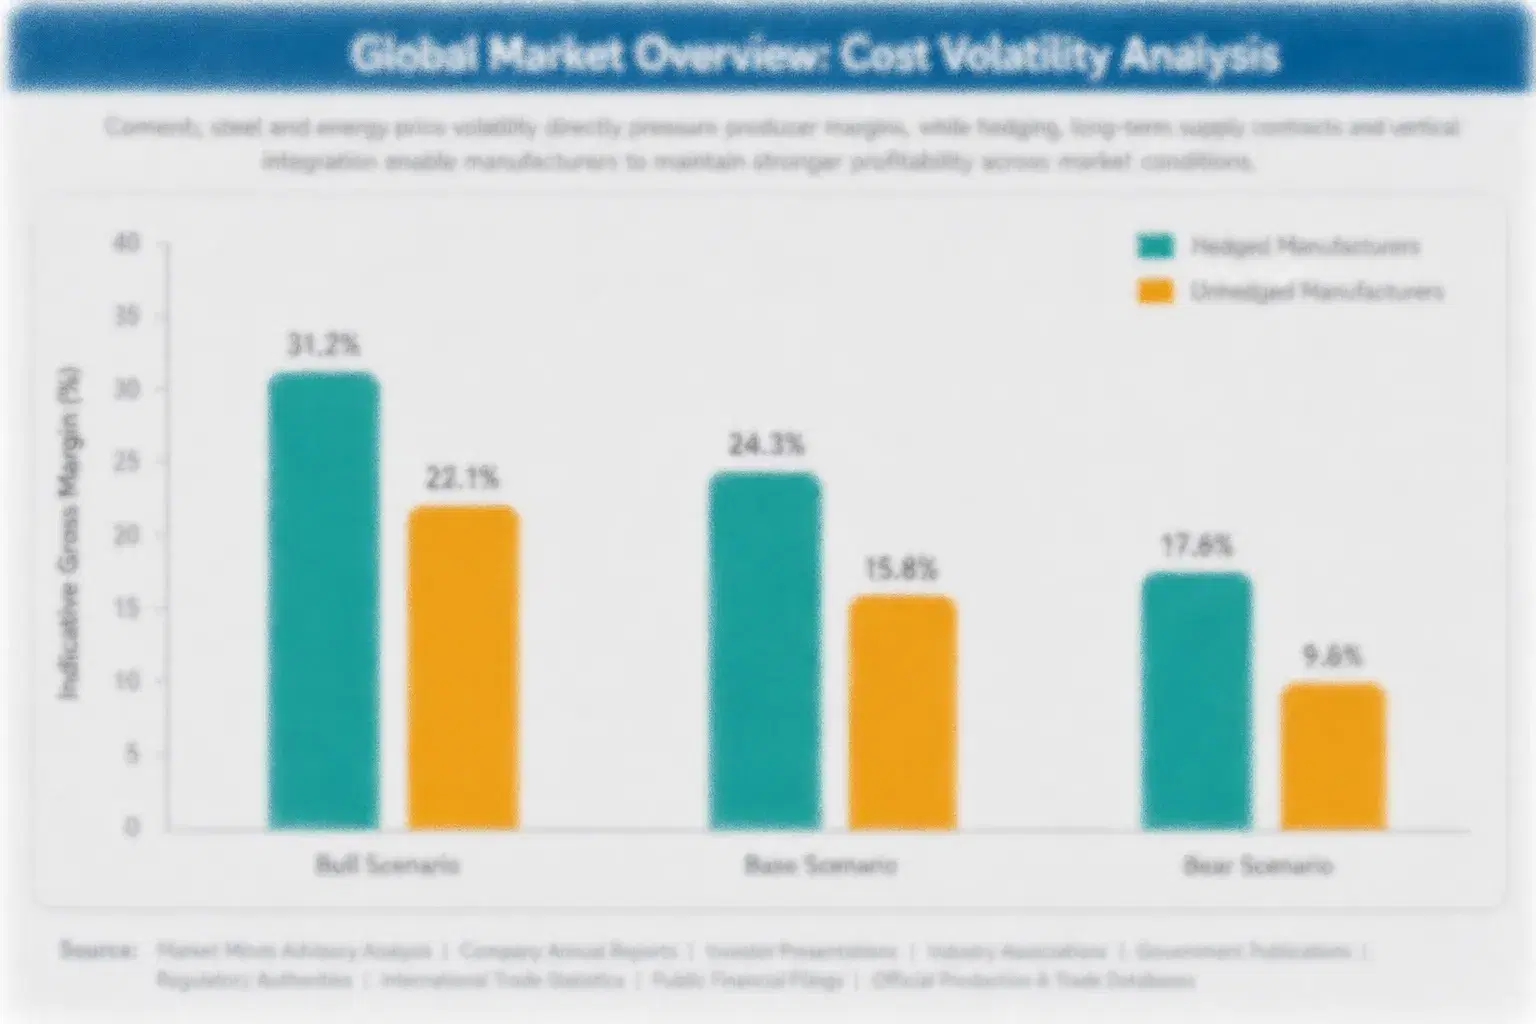
Feedstock accounts for roughly 24% of cost of goods, with spent grain from breweries in Europe and North America and malting barley from Canada, Australia, and Europe. Energy for drying, enzymes, water treatment, membranes, labour, packaging, and freight add most of the remainder, so energy price, extraction yield near 55%, and plant utilisation together determine margin for producers supplying beverage, bakery, and nutrition buyers. Currency swings matter too.
Energy and barley prices spiked in 2022, according to the International Energy Agency and the Lantmannen Annual Report 2022, as European gas prices surged and Ukrainian grain exports were disrupted, raising drying cost and malting barley prices. Producers with fixed-price contracts absorbed losses, others added surcharges, and some paused expansion. Margins narrowed as customers negotiated harder on renewals and shortened contract terms for later quarters.

Exposure varies by player type and geography. Brewer-backed producers with side-stream contracts and owned plants absorb shocks better than start-ups buying spot grain and renting capacity. European producers face energy and water cost, North American producers face feedstock logistics risk, and premium isolate and hydrolysate lines pass costs through more easily than commodity concentrates sold to feed-adjacent buyers.
barley-protein-market-cost-volatility-analysis-1789771856057

Placing Extraction Plants Beside Breweries and Maltsters

Producers locate drying and extraction plants at brewery sites, fixing feedstock cost and avoiding transport of wet grain that spoils within days. Integrated sites share utilities, wastewater treatment, and steam with the brewery, cutting energy cost by 10% to 20%. Long-term agreements with brewers also secure supply and give both sides shared sustainability claims.

Investing in Heat Recovery and Efficient Drying Technology

Producers install heat recovery, mechanical dewatering, and efficient dryers to reduce energy use, which is the largest controllable cost after feedstock. Modern systems cut drying energy by 20% to 30%, though they need capital and technical training. Lower energy intensity also improves carbon footprint claims that beverage and retail customers now ask for in tenders.

Passing Costs Through Index-Linked Pricing With Major Customers

Large beverage and nutrition brands agree to formulas linking price to published energy and barley indices plus a fixed processing margin, so cost swings are shared rather than absorbed by producers. Quarterly resets keep buyers informed and reduce disputes. Premium isolate lines use annual pricing, since customers value stable supply over the year. Terms remain annual.

Portfolio Architecture for Margin Defence

Margins run from thin returns on spent grain concentrates sold to feed-adjacent and snack buyers to strong profits on isolates, hydrolysates, and custom blends sold with technical support and certification, with gross margin roughly doubling between the volume tier and the top tier. Extraction technology, low-gluten verification, and application support add pricing power over the same feedstock, and buyers pay more for consistent taste and protein content.
Volume and premium pull in different directions. Concentrates sell in large lots to price-driven bakeries and pet food makers at thin margins and face pressure from pea and soy protein. Isolates, hydrolysates, and blends sell in smaller lots at much higher margins but need membranes, dryers, and testing, so producers must choose how much capital to commit to premium positioning and how quickly to move.

High-value pools concentrate in barley protein isolates for beverages, hydrolysates for clinical and sports nutrition, and custom blends for plant-based brands. These segments benefit from recurring orders, documented quality, and limited competition from start-ups. Producers combining brewery feedstock, extraction technology, and application support hold advantages that are difficult to replicate quickly, given the time needed to secure feedstock and build customer trust.

Volume / Commodity-Adjacent Tier

Spent grain protein concentrates sold in bulk to bakeries, snack makers, and pet food buyers, with thin margins, feedstock variability, and competition from pea and soy protein worldwide, where buyers switch when prices move.
Gross Margin: 18%-28%

Premium / Certified Tier

Barley protein grades with upcycled certification, gluten testing, and food safety audits, sold under annual contracts to food and beverage brands that require verified quality, consistent taste, documented origin, and reliable delivery each season.
Gross Margin: 28%-40%

Sustainability / Regulatory / Next-Generation Tier

Isolates, hydrolysates, and custom blends with low gluten, neutral taste, and application support, positioned for plant-based beverages, sports nutrition, and clinical products across major markets, supported by pilot trials and long-term supply agreements.
Gross Margin: 38%-54%
barley-protein-market-portfolio-architecture-1789771856247

High-value Sub-segments and Strategic Watch-out

Barley Protein Isolates

Barley protein isolates combine the fastest growth with strong pricing, as beverage and nutrition brands pay premiums for neutral taste and higher protein content. Membrane filtration and brewery feedstock limit competition, and producers with proven solubility and safety data win multi-year contracts from large accounts. Repeat orders follow.
Gross Margin: 38%-54%

Spent Grain Protein Concentrates

Spent grain concentrates offer moderate value with solid growth, since bakeries, snack makers, and upcycled brands pay steady premiums for protein and fibre from certified circular sources. Colour, texture, and variable quality constrain use, though standardisation and brewery partnerships help producers defend margin. Watch pea prices.
Gross Margin: 22%-34%

Hydrolyzed Barley Protein

Hydrolyzed barley protein forms a growing niche, sold to clinical, sports, and beverage buyers who need solubility and fast absorption. Margins are strong but volumes are small, and enzyme cost and bitterness control add complexity, though producers with process know-how and food safety certification hold clear advantages in the segment.
Gross Margin: 36%-52%

Textured Barley Protein

Textured barley protein is a strategic watch-out, tested in meat alternatives and snacks but limited by gluten content, colour, and competition from soy, pea, and wheat textured proteins. Changing formulations could restrict volume, so producers should track meat alternative demand and margins carefully as formats evolve.
Gross Margin: 20%-40%

Why Brands Stay With Protein Suppliers

Barley protein demand behaves like an annuity once a beverage, bakery, or nutrition brand approves a supplier. Taste, solubility, and gluten level are tied to a specific plant and process, so switching means new sensory trials, safety audits, and risk of flavour drift. Suppliers that serve the same account for years earn steady volume, and annual contracts renew at index-linked prices rather than open tenders that reset the whole relationship.
Stickiness varies by vertical. Beverage makers with signature recipes are the deepest, since taste and mouthfeel define the product and approvals are lengthy. Nutrition brands are next, because label claims and testing raise switching cost. Bakeries and snack makers are shallower, moving between suppliers when price or availability changes, and feed-adjacent buyers rotate suppliers frequently when a cheaper lot appears.

Buyer profiles are shifting. Older buyers focused on price, bulk concentrate, and long-standing traders, while younger product developers look for upcycled, allergen-light proteins with data and digital ordering. Sustainability reporting requirements push multinational brands to ask for feedstock origin and carbon data, so suppliers that answer with clear documentation and technical help keep loyalty across generations.
barley-protein-market-end-use-penetration-index-1789771856431

MMA Verdict on Barley Protein Strategy

These are among the four positions where our research anticipates prominent divergence between winners and laggards over the coming forecast period. Each is grounded in the demand model, the regulatory perimeter, and the announced capacity pipeline.
01 / FEEDSTOCK CONTRACT STRATEGY

Lock Brewery Spent Grain Contracts Before Rival Extraction Plants Do

Spent grain feedstock is 24% of cost of goods, and shortages cost 6 to 10 margin points. A brewery with 40,000 tonnes of spent grain supports about 2,000 tonnes of protein. MMA recommends signing multi-year contracts with two large breweries or maltsters within 24 months and building plants beside them, because feedstock is limited by geography, and producers that secure it early gain cost advantages that later entrants cannot match, while brewers value predictable offtake and shared sustainability claims, and steady sourcing lowers cost.
02 / ISOLATE INVESTMENT STRATEGY

Add Membrane Filtration Before Beverage Brands Lock Suppliers

Barley protein isolates grow at 15.9% a year, about 1.47 times the market rate, and sell at 30% to 60% above concentrates. A membrane line costs $8 million to $25 million. MMA advises adding one line with taste and gluten testing for two anchor beverage accounts within 24 months, because brands that qualify one isolate supplier rarely add a second, and early entrants gain application data and reference customers that late entrants struggle to match, while safety dossiers also speed approvals.
03 / GLUTEN COMPLIANCE STRATEGY

Verify Low-Gluten Grades Before Regulators and Retailers Demand Proof

Certified and tested grades earn 10% to 20% above uncertified protein, and testing adds 2% to 4% to cost. Barley contains gluten, so labeling errors carry recall risk. MMA recommends funding validated gluten testing and clear labeling for every food-grade lot within two years, since audited suppliers secure premium contracts, avoid rejected shipments, and give brands evidence that closes deals with cautious retailers, while buyers also value quick answers when regulators request records and complaints arrive, and lenders also favour that certainty.
04 / BLEND PARTNERSHIP CHANNEL STRATEGY

Supply Beverage and Nutrition Brands With Custom Protein Blends

Custom blends earn gross margins of 30% to 40% against 15% to 22% for bulk concentrates, and customers sign annual volumes of 50 to 500 tonnes. Technical support costs 3% to 5% of sales. MMA advises pursuing annual blend programs with two beverage brands and one nutrition company over the next two years, since recipe lock-in secures volume, and suppliers that serve these programs also gain reliable demand signals and stronger negotiating positions with breweries, and repeat business follows for years to come.

Engagement Snapshot From the Field

A live engagement with an industry participant carrying material or product regulatory and market exposure ahead of a defining policy shift, showing how our research translates into a defensible multi-year portfolio strategy.
MARKET MINDS ADVISORY · CLIENT ENGAGEMENT SUMMARY
Barley Protein Producer Strategic Portfolio Review and Transition Roadmap 2026·Investment Scenario on Barley Protein Exposure Evaluation 2025-26
CLIENT PROFILE
The client is a mid-sized European maltster with four plants and roughly $260 million in annual revenue (client-reported, unverified by MMA), supplying malt to regional breweries and selling by-products as animal feed. Gross margin on by-products sat near 8% (client-reported, unverified by MMA), and leadership wanted higher-value use of malt rootlets and spent grain streams.
STRATEGIC CHALLENGE
Feed prices were volatile, two brewery customers asked about upcycled protein programs, and larger competitors were announcing extraction plants and partnerships with food brands. Leadership needed a plan that justified investment in protein extraction, secured offtake, and lifted margin without overextending capital. The board wanted a decision within nine months, before the next investment cycle and customer contract renewals began.
MMA APPROACH
MMA benchmarked nine producers on feedstock, technology, and product mix, interviewed beverage brands, bakeries, and breweries about protein specifications and pricing, and modeled the economics of a concentrate plant, an isolate line, and offtake agreements under bull, base, and bear scenarios. Analysts also reviewed the client's by-product volumes and site utilities.
KEY FINDINGS
  1. Malt rootlets and spent grain volumes of 60,000 tonnes a year would support about 3,000 tonnes of protein concentrate, according to client plant records.
  2. A concentrate plant costing about $35 million (client-reported, unverified by MMA) would lift by-product gross margin from 8% to about 22% at base-case pricing.
  3. An isolate line would add 30% to 60% price premiums but needed membrane capital of about $15 million and offtake from two beverage accounts before approval.
  4. Brewery partnerships would secure additional feedstock and joint upcycled claims, though contract terms and sustainability reporting needed alignment in the first year.
CLIENT PROFILE
The client is a mid-sized European maltster with four plants and roughly $260 million in annual revenue (client-reported, unverified by MMA), supplying malt to regional breweries and selling by-products as animal feed. Gross margin on by-products sat near 8% (client-reported, unverified by MMA), and leadership wanted higher-value use of malt rootlets and spent grain streams.
STRATEGIC CHALLENGE
Feed prices were volatile, two brewery customers asked about upcycled protein programs, and larger competitors were announcing extraction plants and partnerships with food brands. Leadership needed a plan that justified investment in protein extraction, secured offtake, and lifted margin without overextending capital. The board wanted a decision within nine months, before the next investment cycle and customer contract renewals began.
MMA APPROACH
MMA benchmarked nine producers on feedstock, technology, and product mix, interviewed beverage brands, bakeries, and breweries about protein specifications and pricing, and modeled the economics of a concentrate plant, an isolate line, and offtake agreements under bull, base, and bear scenarios. Analysts also reviewed the client's by-product volumes and site utilities.
KEY FINDINGS
  1. Malt rootlets and spent grain volumes of 60,000 tonnes a year would support about 3,000 tonnes of protein concentrate, according to client plant records.
  2. A concentrate plant costing about $35 million (client-reported, unverified by MMA) would lift by-product gross margin from 8% to about 22% at base-case pricing.
  3. An isolate line would add 30% to 60% price premiums but needed membrane capital of about $15 million and offtake from two beverage accounts before approval.
  4. Brewery partnerships would secure additional feedstock and joint upcycled claims, though contract terms and sustainability reporting needed alignment in the first year.
RECOMMENDED STRATEGY
Phase 1: Phase 1 (Months 1-6): Complete pilot extraction trials, sign letters of intent with two beverage brands, and finalise plant financing and site design. Phase 2: Phase 2 (Months 7-18): Build the concentrate plant, secure gluten testing capability, and start supplying bakery and snack customers this year. Phase 3: Phase 3 (Months 19-30): Add an isolate line, sign brewery partnerships, and review pricing formulas each quarter with all major customers.
OUTCOME
Within 30 months, protein lines reached about 15% of revenue, and by-product gross margin rose from 8% to about 24% (client-reported, unverified by MMA). Two beverage brands signed three-year agreements, brewery partnerships expanded feedstock supply, and the board approved a second extraction site for the following year.

Frequently Asked Questions

Foundational context covering the market sizes, CAGR, scope, country, region and competition that inform every finding below. This section is provided to cover basics and most often pre-purchase conversations, answered from the MMA Primary Research Dataset.

What is the current size of the Barley Protein Market?

The global barley protein market was valued at $0.4 billion in 2025. This covers concentrates, isolates, hydrolysates, and textured ingredients extracted from barley grain, malt, and spent grain.

How large will the Barley Protein Market be by 2036?

MMA projects the market will reach approximately $1.2 billion by 2036. This represents cumulative growth of roughly $0.8 billion over the full ten-year forecast window.

What is the CAGR for the Barley Protein Market 2026 to 2036?

The market is forecast to grow at a 10.8% compound annual rate between 2026 and 2036. The bull case reaches 12.1% while the bear case falls to 9.5%.

Which segment is growing fastest?

Barley Protein Isolates is the fastest-growing segment at 15.9% CAGR, roughly 1.47 times the overall market rate. Spent Grain Protein Concentrates follows as the second-fastest segment at 13.1% CAGR each year.

Who are the major companies in the Barley Protein Market?

Leading companies include EverGrain, Lantmannen, Cargill, Roquette, and Kerry Group. These five suppliers together hold an estimated 52% of total global market revenue, based on MMA analysis of company disclosures.

Which country is growing fastest?

Australia is the fastest-growing major market, expanding at approximately 13.9% CAGR each year. Large barley supply and new processing investment are driving this above-market growth across the country.

Report Segmentation Architecture

The full report scope spans multiple orthogonal segmentation dimensions, with cross-tabulated demand data provided for each dimension pair. Coverage extends further to regional breakdowns, trend trajectories, and the competitive detail needed to support segment-level decision-making.

By Primary Market Dimension

  • Barley Protein Isolates
  • Spent Grain Protein Concentrates
  • Hydrolyzed Barley Protein
  • Textured Barley Protein
  • Barley Protein Flour Blends
  • Malt Rootlet Protein Extracts

By End-Use Industry

  • Plant-Based Beverages
  • Bakery and Snacks
  • Sports and Clinical Nutrition
  • Meat and Dairy Alternatives
  • Pet Food and Feed-Adjacent Uses

By Commercial Dimension

  • Bulk Ingredient Supply Contracts
  • Custom Blend Programs
  • Distributor and Trader Sales
  • Private Label Programs

By Region

  • North America
  • Western Europe
  • East Asia
  • South Asia and Pacific
  • Latin America
  • Middle East and Africa
  • Eastern Europe

Scope, Methodology, and Coverage

Every figure in this report is reproducible from documented input assumptions. The scope below maps the historical period, the forecast horizon, the segmentation dimensions, and the countries covered, alongside the underlying primary and qualitative methodology.
Historical Period
2020 to 2025
Forecast Period
2026 to 2036
Base Year
2025 (USD billions; MMA Primary Research Dataset, September 2026)
Market Definition
Barley protein comprises protein concentrates, isolates, hydrolysates, and textured ingredients extracted from barley grain, malt, and brewers' spent grain, sold to food, beverage, nutrition, and feed-adjacent buyers. The scope excludes whole barley flour, malt extract sold for flavour, barley beta-glucan fibre, animal feed meal, and finished plant-based products where barley protein is a minor component.
Quantitative Units
USD billions (current prices); thousand tonnes for volume references
Segmentation Dimensions
By Grade and Processing Route; By End-Use Industry; By Commercial Dimension; By Region
Regions Covered
North America, Western Europe, East Asia, South Asia and Pacific, Latin America, Middle East and Africa, Eastern Europe
Countries Covered
USA, Canada, Mexico, Brazil, Argentina, Germany, Belgium, Netherlands, Denmark, Sweden, Finland, UK, Poland, Czechia, Ukraine, South Africa, Nigeria, Japan, China, South Korea, India, Australia, and additional markets relevant to this sector
Key Companies Profiled
EverGrain, Lantmannen, Cargill, Roquette, Kerry Group, Ingredion, Tate and Lyle, Puris, Axiom Foods, Burcon NutraScience, Bunge, Emsland Group, Glanbia Nutritionals, Avebe, DSM-Firmenich, ReGrained, Tereos, Crespel and Deiters, Boortmalt, Viking Malt
Quantitative Methodology
Primary survey, n=3,800 respondents, Q4 2025, six countries; demand-side model with trade association cross-validation
Qualitative Methodology
47 expert interviews, Q4 2025; applied to validate demand model assumptions, identify emerging dynamics, and assess competitive positioning
Report Format
PDF and XLSX data workbook (Word format preview document)
Publisher
Market Minds Advisory
Report Code
MMA-2026-AGR-314
Published
September 2026
Contact
sales@marketmindsadvisory.com | www.marketmindsadvisory.com

Purchase the full Barley Protein Market Report (2026 to 2036).

The full report delivers a detailed assessment of global barley protein demand, grade mix, and competitive positioning through 2036. It includes segment forecasts by grade, country-level data for all seven world regions, and profiles of the twenty companies most relevant to cereal protein supply. Analysts also receive input cost modeling and portfolio margin benchmarking built from MMA's primary research dataset. A scenario planning module lets subscribers stress-test bull and bear assumptions against feedstock and regulatory outcomes. Quarterly updates keep the whole dataset current throughout the subscription year.
Ten-year segment and regional demand forecasts
Spent grain feedstock and price tracking
Competitive benchmarking of top twenty producers
Gluten labeling and novel food rule modeling
Regional demand mechanism comparative analysis included
Quarterly primary survey data update access

Built For The People Who Decide

From boardroom strategy to bench-side execution, this report is read cover-to-cover by leaders shaping the next decade of their industry, turning demand scenarios, market dynamics and valuation benchmarks into decisions.
CXOs/ Presidents/ VPs/ Managers
M&A and Corporate Development
Strategy Teams and R&D Heads
Procurement and Product Directors
Regulatory and Compliance Leaders
Investor Relations and Equity Analysts