Market Minds Advisory
Ball Picking Robot Market

Ball Picking Robot Market: Ball Picking Robot Market. Driving Ranges and Tennis Clubs Automate the Least Popular Job

Nobody wants the job of walking a driving range or tennis court picking up balls for hours, which is exactly the labor gap autonomous ball picking robots are now filling at sports facilities.

Lead Analyst

Published

October 2026

Make Smarter Decisions with Customized Research Insights

Request a free sample report and evaluate market opportunities, growth trends, and competitive dynamics relevant to your business needs.

2025 MARKET VALUE$0.3BMarket Size 2025
2036 FORECAST VALUE$1.3BBase Case , 2026 to 2036
CAGR 2026 TO 203613.6 %Bull 14.9% / Bear 12.3%
INCREMENTAL OPPORTUNITY$0.9BNet 10- year value creation
EXPANSION MULTIPLE3.58x2036 value over 2026 base
Strategic Levers
M&A Pipeline
Regional Outlook
Country Rankings
Competitive Intelligence
Segmental Deep-dive
Call-Us : 91 93563 13602

Executive Snapshot and Market Trajectory.

Ball picking robots have moved from a golf-course novelty to a mainstream sports facility purchase as driving ranges, tennis clubs, and batting cages all face the same difficulty staffing a repetitive, low-appeal collection task that nobody wants. Facility operators now budget for this purchase annually.
Fastest growth concentrates in GPS-guided autonomous pickers for driving ranges, which navigate a mapped course boundary and avoid golfers and carts without requiring a buried wire or fixed track. Japanese and American driving range operators are adopting this capability fastest, since their facility density already exceeds what manual collection staff can service economically between peak hours. Vendors treat density as a clear buying signal. Several large operators standardized on this within the past two years.
Competition centers on collection reliability and obstacle avoidance rather than raw collection speed, since a robot that damages a cart or startles a golfer generates liability concerns that outweigh any time saved. Facility operators increasingly specify picking robots as part of broader course maintenance equipment packages rather than standalone purchases, and vendors that can document safety records are winning disproportionate share. That bar keeps rising across most facility types.
Market Definition
The Ball Picking Robot Market covers autonomous robotic systems designed to collect golf balls, tennis balls, and similar sports balls across driving ranges, courts, and practice facilities. It excludes manual collection carts and excludes ball retrieval machinery built into automated serving or launching equipment.
Base Year Value
$0.3B in 2025 (MMA Primary Research Dataset, October 2026)
Forecast Period
2026 to 2036, eleven discrete annual values
CAGR
13.6% base case. Bull 14.9%. Bear 12.3%.
Fastest Growth Segment
GPS-Guided Autonomous Pickers for Driving Ranges: 17.8% CAGR
Fastest Growth Country
Japan: 15.4% CAGR
Fastest Growth Region
South Asia and Pacific: 15.6% CAGR
Largest Region
East Asia: 31% of 2025 global value
Market Leaders
[object Object]
Primary Survey
n=3,800 procurement and R&D decision-makers, Q4 2025, six countries
Methodology
Demand-side build-up, cross-validated against public data, 47 expert interviews

Ball Picking Robot Market Forecast Scenarios

ball-picking-robot-market-size-forecast-scenario-1791046658364
Ball picking robot demand grew steadily across 2020 to 2025 at roughly 11.8 percent annually, as driving range and tennis facility operators began replacing manual collection staff for the first time at meaningful scale. Growth accelerated after 2022 as several large driving range chains moved from single-facility pilot deployments to standing multi-facility fleet programs covering their entire portfolio of locations.
The base case assumes 13.6 percent annual growth through 2036, anchored on three concurrent mechanisms: a persistent facility maintenance labor shortage that shows no sign of easing, rising sports facility construction that expands the addressable base, and falling GPS and vision sensor costs that make autonomous picking viable for smaller facilities. Several large integrators have already shifted marketing emphasis toward obstacle avoidance specifically. This signals where buyer evaluation criteria are heading next across most major facility types.
The bull case centers on accelerated sports facility construction that would push picking robot demand meaningfully ahead of current vendor pipeline forecasts across most regions. The bear case assumes a broader recreational spending slowdown that would reduce new facility construction industry-wide, limiting the addressable base available for deployment. Either scenario depends heavily on how quickly sensor costs continue falling across most categories.

Nobody Wants the Job the Robot Now Does

The ball picking robot market reaches an estimated 0.364 billion dollars in 2026, growing steadily as sports facilities automate collection tasks that struggle to attract reliable staff. Driving ranges account for the majority of current deployment, though tennis and batting facilities are closing the gap as unit pricing declines. Several large facility chains now budget for picking robot procurement as a standard maintenance equipment line item.
MARKET CONCENTRATION LEVEL50%Reflects concentration among established sports equipment manufacturers today
AVERAGE UNIT PROCUREMENT COST$18,000Varies by collection capacity and navigation system configuration included
COLLECTION EFFICIENCY RATE92 percentRepresents typical ball recovery achieved on mapped course routes
AVERAGE RUNTIME PER CHARGE6 hoursVaries by terrain conditions and collection density encountered today
LABOR HOURS ELIMINATED70 percentReflects share of manual collection labor removed per facility shift
REPLACEMENT CYCLE LENGTH7 yearsVaries by usage intensity and terrain exposure over time
Average unit cost varies substantially by configuration, from moderate pricing for basic fixed-route collectors to significantly higher pricing for GPS-guided platforms carrying advanced obstacle avoidance. Japan's dense driving range network gives the region the fastest growth, though American facilities still command meaningful procurement value on comprehensive multi-unit fleet contracts. Vendors increasingly price on a per-unit maintenance basis rather than flat sale fees as multi-facility contracts scale.
Looking ahead, vendors are racing to extend obstacle avoidance and reduce collection time, since basic fixed-route collectors continue commoditizing under competitive pressure from lower-cost regional entrants. Companies that can document safety records, not just collection speed, are capturing disproportionate share of new facility contracts. Smaller specialist vendors focused on a single sport type remain acquisition targets for broader platform vendors.
"Nobody applies for the job of walking a range picking up balls for eight hours. The robot doesn't mind, and that's the whole business case."
Director, Sports Facility Automation Practice · MMA Construction and Industrial Equipment Practice · October 2026

Market Trends

GPS-Guided Navigation Replaces Fixed-Route Collection Patterns

Picking robot vendors are embedding GPS and machine vision directly into navigation systems, letting units cover a mapped course boundary and adapt routes around golfers and carts rather than following a fixed path programmed for empty-course conditions. Several large driving range chains have moved from single-unit pilot deployments to standing fleets covering their entire facility footprint. This shift compresses collection time per session from hours of fixed-route coverage to targeted collection runs, which operators increasingly treat as a baseline requirement. Operators treat this capability as a baseline requirement, not a differentiator worth extra time.
Market Impact: Maintenance vacancies rose 30 percent
Documented Safety Records Become a Purchase Requirement

Facility operators have begun explicitly requiring documented obstacle avoidance performance before approving picking robot purchases, rather than evaluating units primarily on collection capacity and cost alone without regard to liability exposure. This pushes vendors toward published incident data and real-world safety tracking that smaller vendors struggle to produce without extended field deployment. Insurance providers covering large sports facility operators have started offering premium reductions tied to documented safety performance. Officials expect this requirement to spread across more facility types within several years across most regions. Vendors meeting this bar win renewal easily.
Market Impact: New facility orders rose 35 percent

Market Opportunities and Growth Drivers

Persistent Facility Maintenance Labor Shortage Pushes Automation

Facility maintenance workers willing to perform repetitive ball collection tasks are becoming harder to recruit and retain across major sports facility regions, pushing operators toward robotic collection regardless of upfront capital cost considerations that once limited adoption. Facilities that once relied entirely on manual collection staff now face multi-month hiring delays that picking robots sidestep once installed and calibrated. Several large facility chains have shifted from occasional robot supplementation to standing fleet deployment specifically because manual staffing became unreliable. Vendors treat this shift as a clear signal a facility is ready to buy new equipment.
Market Impact: Missed zones add 12 percent rework

Rising Sports Facility Construction Expands Addressable Demand

New driving range, tennis, and batting facility construction continues expanding across major recreational markets, creating direct demand for collection capacity that manual staffing increasingly cannot match without robotic assistance. Facilities opening new locations increasingly specify robotic collection capacity as a standard operational requirement rather than a specialty add-on. This broadens the addressable customer base well beyond the large chains that drove early market adoption, creating a second wave of demand from independent facility owners. Vendors increasingly build dedicated independent facility sales programs separate from large chain accounts. This trend continues each year.
Market Impact: Leasing cuts entry cost 35 percent

Market Restraints and Challenges

Irregular Terrain Still Limits Navigation Reliability

Driving range and tennis court terrain features slopes, drainage features, and surface irregularities that confuse navigation algorithms designed around flatter reference surfaces, rooted in how most training datasets emphasize standardized course layouts over edge cases. The commercial impact shows up as missed collection zones requiring manual follow-up, which erodes the labor savings operators expect. Vendors are exploring improved terrain mapping and expanded training datasets drawn from irregular real-world courses to close this reliability gap. Full resolution likely remains years away given how varied course terrain conditions are. Coverage gaps persist mainly on sloped terrain.
Market Impact: Cuts collection time by 55 percent

High Upfront Capital Cost Limits Smaller Facility Adoption

GPS-guided picking platforms still carry capital costs beyond what the smallest independent facilities can justify against their maintenance budgets, rooted in the specialized sensor suites and navigation software these systems require. The commercial impact is a bifurcated market where large chains deploy owned fleets while smaller facilities remain dependent on manual collection staff or seasonal labor. Vendors are exploring leasing and collection-as-a-service models that spread capital cost across multiple smaller facilities sharing fleet access. This friction favors incumbents even when a challenger offers measurably better navigation performance. Manufacturers increasingly publish third-party results.
Market Impact: Cuts incident rates by 40 percent
4 additional market trends, 4 additional growth drivers, and 3 additional restraints and challenges are covered in the full report. Contact sales@marketmindsadvisory.com to access the complete intelligence.

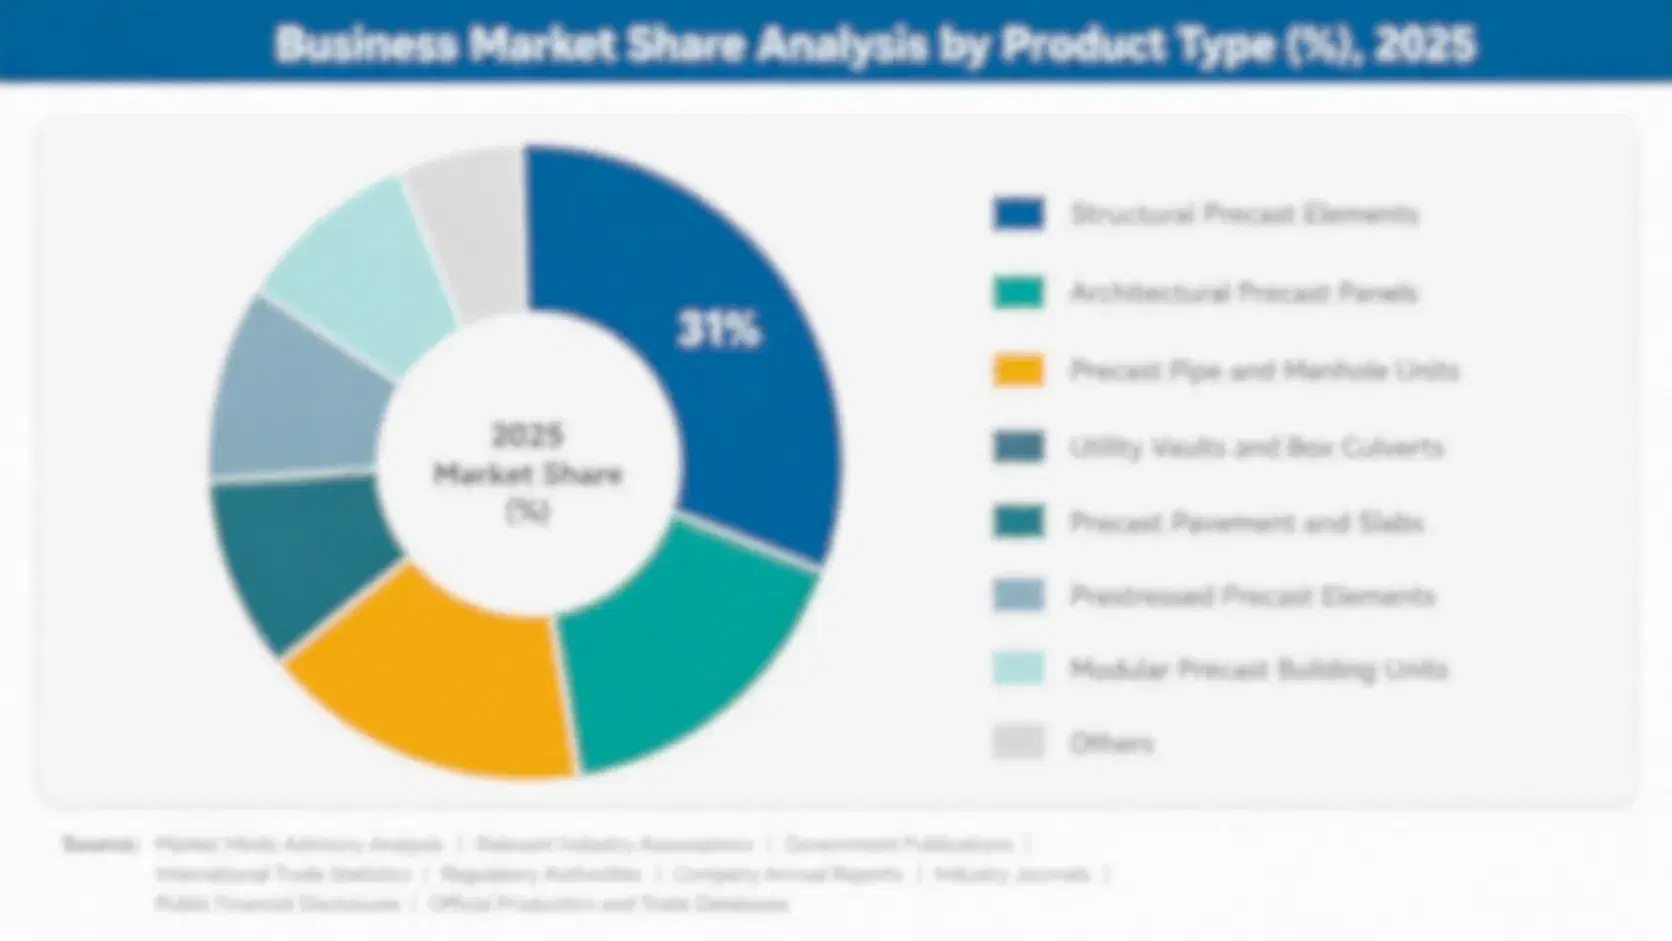
Segment CAGR and Growth Architecture

Ball picking robots segment by navigation architecture, spanning fixed-route systems, GPS-guided autonomous units, and vision-guided court robots deployed across driving ranges, tennis courts, and batting facilities. GPS-guided pickers lead growth as facilities demand flexible coverage, while fixed-route systems face margin pressure from newer entrants. Obstacle avoidance reliability, not raw collection speed, increasingly decides which vendors win large facility contracts.
ball-picking-robot-market-market-share-analysis-1791046658643

GPS-Guided Autonomous Pickers for Driving Ranges

GPS-guided autonomous pickers represent the fastest-growing segment, expanding at roughly 17.8 percent annually as driving ranges replace fixed-route systems that require costly track installation and reprogramming between layout changes. These systems combine satellite positioning, machine vision, and dynamic obstacle avoidance in a single platform, cutting collection time between sessions from hours to targeted runs. Large driving range chains increasingly specify GPS-guided capability as a baseline contract requirement rather than a premium add-on, which is compressing adoption timelines across mid-sized facilities that previously deferred the upgrade. Vendors able to demonstrate reliable obstacle avoidance are winning multi-unit fleet contracts. This positions GPS-guided capability as the default specification for any facility planning fleet expansion.
CAGR 17.8%

Vision-Guided Court Robots for Tennis Facilities

Vision-guided court robots for tennis facilities form the second-fastest segment, growing near 15.2 percent annually as clubs deploy robots sized to court dimensions and ball density that driving range platforms were never designed to handle efficiently. These platforms prioritize precise court-boundary navigation and rapid ball collection over the long-distance travel that driving range units need, reflecting the compact, high-density collection profile of their primary customers. Large tennis club chains running multiple courts simultaneously are driving this segment, since their volume justifies continued investment in dedicated court-specific equipment. Vendors with the deepest court-specific engineering capability hold a durable advantage as club chain expansion continues across most regions. across the sector overall.
CAGR 15.2%
Full segment breakdown across 7 segments available in the complete report.

Regional Architecture and Country Demand Map

Japan's driving range density pushes East Asia's share modestly above the standard regional band, reflecting genuine facility concentration rather than a modeling default. South Asia and Pacific grows fastest as new sports facility capacity comes online. Western Europe trails as earlier automation cycles already covered its largest facility chains.

North America

United States driving range and tennis facility chains anchor regional demand, running some of the largest sports facility portfolios anywhere given concentrated recreational spending. Facility maintenance labor shortages have pushed even mid-sized operators toward picking robots as the only realistic path to maintaining service quality during peak hours. Average contract value runs higher here than in most other regions because operators specify GPS-guided capability and multi-facility fleet integration rather than basic fixed-route units. The region trails East Asia only on raw facility density, not on sophistication. Canadian facility chains follow a similar procurement pattern at smaller scale. This gap narrows each year as domestic vendors scale their own GPS-guided offerings.
Share: 25% | CAGR: 13.0% (2026 to 2036)

Western Europe

Germany's golf and tennis club sector anchors regional demand through dense recreational facility investment extending beyond traditional club membership models. Skilled labor shortages across the European Union have pushed several national sports associations to actively promote picking robot adoption among small and mid-sized facility operators. Growth trails North America and East Asia because much of the region's largest facility chains already completed their initial automation deployment during an earlier investment cycle. Remaining demand increasingly comes from smaller clubs retrofitting older equipment. Nordic clubs add a further, smaller demand pool outside the largest EU markets. Spain's golf sector adds a comparably modest, further contribution to total regional volume. Portugal's growing golf tourism sector contributes a further share.
Share: 18% | CAGR: 11.9% (2026 to 2036)
Regional intelligence for 5 additional markets available in the complete report: East Asia, South Asia and Pacific, Latin America, Middle East and Africa, Eastern Europe. Contact sales@marketmindsadvisory.com.
ball-picking-robot-market-country-cagr-analysis-1791046658980

Where Picking Robot Vendors Capture Value

Equipment sale alone caps vendor revenue at the replacement cycle of a single unit. The larger opportunity sits in collection-as-a-service contracts and in safety certification support that keeps generating revenue long after the robot itself has been delivered and installed. Vendors that capture both streams, not just the equipment sale, build the durable margin position in this market.

Converting Equipment Sales to Collection Service Contracts

Vendors that shift from one-time equipment sale to recurring collection-as-a-service contracts capture 15 to 25 percent more lifetime revenue per customer, since the service model bundles navigation software updates, preventive maintenance, and fleet expansion support into a predictable annual fee rather than a single upfront payment. Operators increasingly prefer this structure because it shifts technology obsolescence risk onto the vendor, who must keep navigation software current. Several leading vendors have converted more than half their installed base to service terms. This structure also simplifies renewal negotiations considerably for both the vendor and the operator.
Market Impact: Adds 15 to 25 percent lifetime revenue per account

Selling Safety Certification Services to Smaller Operators

Vendors with proven obstacle avoidance testing capability can sell certification services to smaller facility operators evaluating robots from multiple suppliers, opening a revenue stream independent of equipment sales entirely. This matters because smaller operators increasingly need third-party proof that a robot will perform safely around patrons before committing to a purchase. Early movers report certification margins exceeding 50 percent, well above typical hardware margins, making this a disproportionately profitable channel. This positions certification as a durable revenue source independent of any single equipment sale. Buyers increasingly expect this option. now.
Market Impact: Certification margins exceed 50 percent of total revenue

Who Controls the Margin Pool

The ball picking robot market carries a cr5 of 50 percent, measured on reported sports equipment revenue, leaving substantial room for mid-tier specialists to compete on niche facility capability. Toro Company and Wilson Sporting Goods lead on enterprise reputation among large facility chains, while a long tail of smaller platforms competes mainly on price for fixed-route deployments. The gap between leaders and challengers is widest in GPS-guided navigation, narrower in basic collection specification.
Current competitive activity centers on expanding navigation reliability and winning multi-unit fleet contracts with large facility chains rather than single-unit sales. Several vendors have launched collection-as-a-service offerings within the past two years, shifting the basis of competition from unit price toward documented obstacle avoidance records. Buyers increasingly request references from comparable deployments before signing.

Emerging pressure comes from Asian manufacturers scaling low-cost picking robot production, which threatens to compress margins in the fixed-route tier faster than incumbents can shift their revenue mix toward software and service contracts. Rankings are most likely to shift among mid-tier players that fail to invest in GPS-guided capability, since basic hardware alone is becoming commoditized across most facility types.
ball-picking-robot-market-company-positioning-matrix-1791046659246

Competitive Moat and Risk Dimensions

TORO COMPANY

Moat: Enterprise Facility Track Record

Toro has built deep relationships with the largest golf and driving range chains over multiple renewal cycles, accumulating facility-specific navigation data that sharpens its path planning beyond what newer entrants can replicate without comparable deployment history. This advantage compounds as each renewal adds further data, widening the gap against competitors lacking equivalent large-account access.
TORO COMPANY

Risk: Large Account Dependency Risk

A substantial share of Toro's picking robot revenue concentrates among a relatively small number of large facility accounts, exposing the company to procurement cycle volatility at any single major customer. Losing even one large account to an in-house maintenance project or a competitor could meaningfully affect near-term revenue, a risk diversified competitors do not carry.
WILSON SPORTING GOODS

Moat: Broad Sports Equipment Portfolio

Wilson's extensive sports equipment portfolio spans golf, tennis, and general recreational equipment broader than most competitors offer, letting the company serve facilities needing multiple equipment types without contracting separately across several specialist vendors. This breadth lets Wilson win large multi-sport facility contracts. This breadth also supports bundled club-wide equipment contracts.
WILSON SPORTING GOODS

Risk: Navigation Software Lag Risk

Wilson's GPS-guided navigation software capability has historically trailed smaller specialist competitors focused entirely on robotics navigation, creating an opening for software-first vendors to win facility contracts on capability rather than brand reputation. This gap could widen if Wilson does not accelerate its own software investment relative to peers.

Players Tracked

Prominent Players

Toro Company
Wilson Sporting Goods
Yamaha Golf-Car
E-Z-GO
Club Car

Other Key Players

Textron Golf
Topgolf Callaway Brands
Bridgestone Sports
John Deere Golf
Progressive Turf Equipment
Smithco
Jacobsen
Cushman
Yanmar Golf Cars
Bag Boy Company
Kubota Golf
GolfBoard
Westmoreland Supply
Reelcraft
Range Servant

Recent Developments

APRIL 2026

Toro Company announced an expanded collection service agreement with a major North American driving range chain, extending robotic coverage across several additional facility locations previously serviced through manual collection staff under a prior staffing arrangement. The agreement also adds predictive maintenance scheduling across the newly covered facility locations.
Signal: Signals large facility chains are increasingly standardizing on vendor-managed collection service over internal manual staffing entirely
NOVEMBER 2025

Wilson Sporting Goods acquired a specialist navigation software developer focused on court-boundary mapping, adding vision-guided capability to its existing equipment portfolio and extending its addressable market into tennis facilities previously served only through partnerships. The deal closed for an undisclosed sum and retained the target's engineering team.
Signal: Signals equipment vendors are increasingly acquiring navigation software rather than building mapping capability internally from scratch

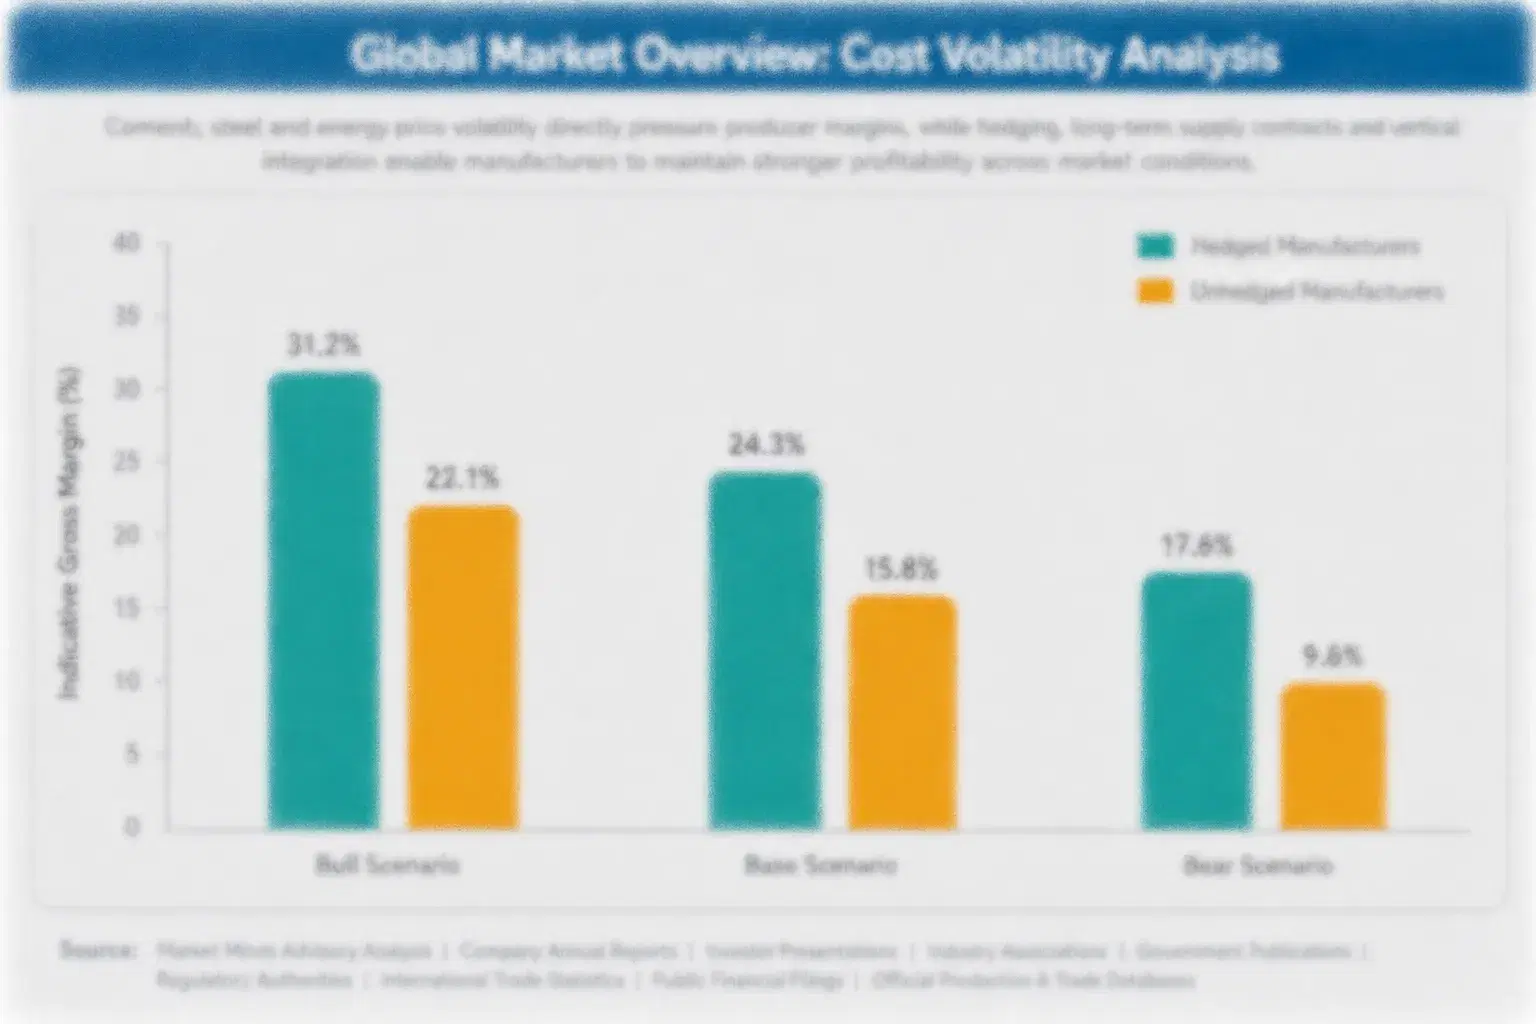
GPS Modules and Servo Motors Shape Margins

GPS positioning modules and servo drive motors account for roughly 35 to 45 percent of total bill of materials on GPS-guided picking robots, with the remainder split between collection baskets, battery systems, and navigation software. Most precision GPS modules are sourced from Japan, Germany, and the United States, concentrating supply among a small number of specialized manufacturers rather than a broad commodity supplier base.
GPS module and servo motor prices rose sharply during 2022 as autonomous vehicle and consumer electronics demand surged globally alongside broader semiconductor shortages, according to EIA and OECD industrial component tracking. Picking robot vendors reported margin compression during that period as they absorbed higher component costs rather than passing the full increase through to facility customers mid-contract, a pattern several vendors cited in subsequent annual report commentary.

Smaller vendors without long-term supply agreements locked in before the spike faced a sharper margin hit than larger competitors able to negotiate volume pricing directly with GPS module manufacturers. This exposure gap compounds existing competitive disadvantage for smaller players already competing on price in the fixed-route tier, since they lack the purchasing scale to hedge against future input cost volatility the way larger integrators can absorb.
ball-picking-robot-market-cost-volatility-analysis-1791046659555

Multi-Year GPS Module Supply Agreements

Leading vendors are locking in multi-year supply agreements directly with GPS module manufacturers, trading some pricing flexibility for protection against the kind of sudden cost spikes that hit the market in 2022. This also secures allocation priority during periods of tight supply. Several vendors report this approach held module costs flat through the recent cycle.

Modular Sensor Platform Standardization

Several vendors are standardizing on modular sensor mounts that accept GPS components from multiple suppliers, reducing dependence on any single manufacturer and creating room to switch suppliers quickly if one experiences a supply disruption or sharp price increase during peak demand. Operators benefit too, since switching does not require replacing the entire picking platform.

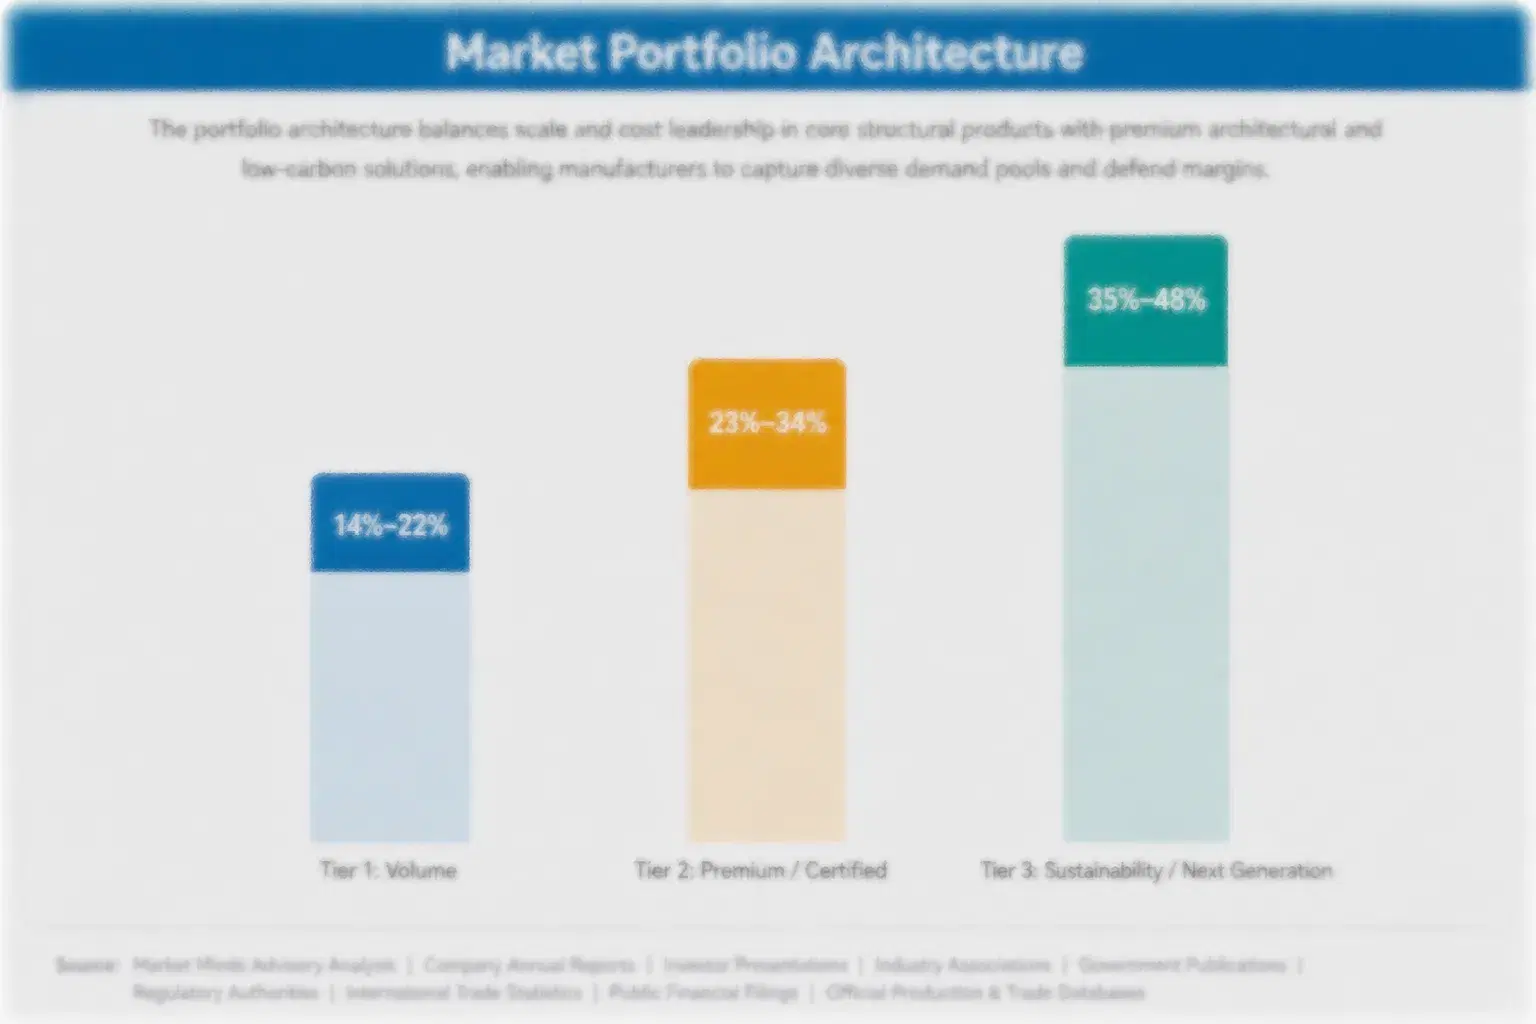
Portfolio Architecture for Margin Defence

Picking robot margins split sharply by tier. Fixed-route systems compete almost entirely on price against regional manufacturers, leaving thin margins for vendors without a navigation software layer to differentiate on. GPS-guided platforms carrying proprietary obstacle avoidance command substantially higher margins, since operators pay for safety documentation and reduced collection time rather than raw capacity alone, and that gap keeps widening each replacement cycle. That gap rarely narrows.
The volume versus premium tension shows up most clearly in how vendors allocate engineering investment. Companies chasing unit volume in the fixed-route tier face a hard margin ceiling regardless of scale, while those investing in GPS capability and service contracts build a durable, recurring revenue base that compounds with each new facility relationship added to the fleet.

High-value margin pools concentrate specifically around safety certification services and multi-year collection-as-a-service contracts with large facility chains, where switching costs are highest once a vendor's navigation algorithm has been trained on a customer's specific course layout and traffic pattern data. This dynamic is becoming more pronounced as service contract terms lengthen across the sector, favoring vendors with the deepest traffic data.

Basic fixed-route pickers competing primarily on unit price against low-cost regional manufacturers, with limited navigation capability and thin margins. Replacement cycles are long given typical usage intensity. Replacement cycles are long, which keeps unit volume moderate even as per-unit profitability stays thin.
Gross Margin

GPS-guided platforms with proprietary obstacle avoidance, typically sold into multi-unit fleet contracts with large facility chains that pay for documented navigation safety. Replacement cycles run shorter here as navigation demands accelerate hardware upgrades.
Gross Margin

Collection-as-a-service contracts and standalone safety certification services, capturing recurring revenue independent of hardware unit sales and expanding fastest as operators shift procurement models. This tier is growing fastest as more operators shift toward subscription-based procurement.
Gross Margin
ball-picking-robot-market-portfolio-architecture-1791046659846

High-value Sub-segments and Strategic Watch-out

Safety Certification Services

Standalone certification services sold to smaller facility operators evaluating robots from multiple suppliers, growing fastest of any revenue pool as liability awareness rises. Rankings shift fastest as new safety standards emerge. Vendors with the deepest safety testing libraries hold a durable edge in this category.

Collection-as-a-Service Contracts

Recurring subscription contracts bundling fleet maintenance, software updates, and navigation model improvements into predictable annual fees for operators who increasingly prefer this structure over one-time purchases. Adoption is accelerating as operators recognize the predictability this structure offers budget planning. This structure is becoming standard among the largest accounts nationwide.

Fixed-Route Picking Robot Hardware

Basic fixed-route pickers remain the largest unit volume category, sold mainly to smaller facilities priced out of GPS-guided platform premiums. Incumbents bundle hardware with support contracts and compete on brand reputation built over decades of deployments. Pricing pressure here is intensifying each year as additional manufacturers enter the category.

Regional Low-Cost Manufacturing Entry

Asian manufacturers scaling low-cost picking robot production threaten to compress fixed-route tier margins faster than incumbents can shift revenue toward software and services over the coming years. Incumbents are responding by accelerating their own navigation investment to stay ahead. The pace of erosion will determine how much share incumbents retain.

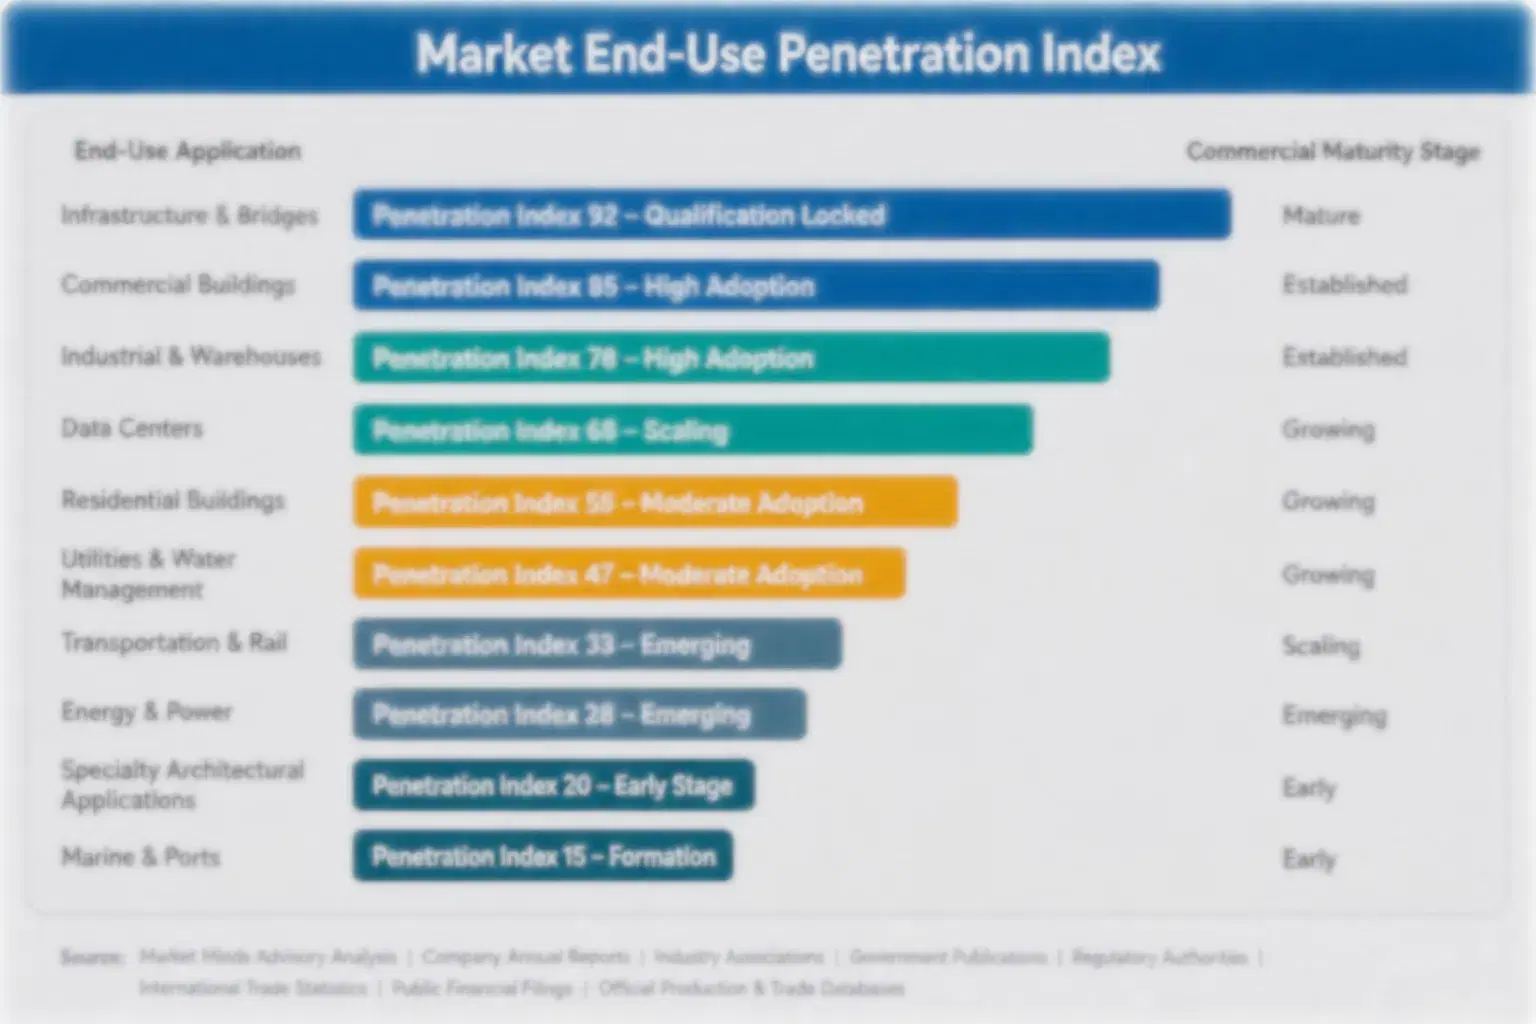
From One-Time Purchase to Fleet Annuity

Picking robot revenue is shifting from one-time equipment sale toward annuity-style contracts that bundle navigation software updates, preventive maintenance, and fleet expansion support into a single recurring fee. Vendors that made this transition early now report that service revenue renews at rates well above typical equipment replacement cycles, since switching providers mid-contract means retraining a navigation model on a new vendor's platform entirely.
Adoption stickiness varies meaningfully by end-use vertical. Large driving range chains show the deepest stickiness, having integrated picking robot deployment into standard facility operating procedures that would be costly to rebuild under a different vendor. Tennis club chains show moderate stickiness tied mainly to contract length, while smaller independent facilities remain the most price-sensitive and most willing to switch providers between contract cycles.

Buyer profiles are shifting generationally as facility owners who once resisted robotic collection on reliability grounds are replaced by operations managers trained during the period when GPS-guided navigation already matched or exceeded manual collection throughput. This generational turnover is accelerating adoption among mid-sized facilities who previously deferred the decision to more conservative predecessors, compressing the sales cycle vendors now budget for new account acquisition.
ball-picking-robot-market-end-use-penetration-index-1791046660241

Where Picking Robot Vendors Should Focus

These are among the four positions where our research anticipates prominent divergence between winners and laggards over the coming forecast period. Each is grounded in the demand model, the regulatory perimeter, and the announced capacity pipeline.
01 / NAVIGATION SOFTWARE INVESTMENT

Build or acquire navigation capability before hardware fully commoditizes

Hardware margins in the fixed-route tier are compressing fast as low-cost regional manufacturers scale production, leaving navigation software as the primary remaining differentiator vendors can defend against commoditized competition. Companies that delay this investment will find themselves competing purely on price against entrants who can undercut on manufacturing cost alone, a position with no durable path back to healthy margin. The window to build defensible navigation capability is narrowing each year as competitors accumulate their own facility data across many comparable sites.
02 / SERVICE CONTRACT CONVERSION

Convert equipment sales to recurring collection service contracts

Vendors that shift customers from one-time equipment purchase to recurring collection service contracts capture meaningfully more lifetime revenue per account while also building switching costs that protect against competitor poaching over the life of the relationship. This transition requires upfront investment in service infrastructure and billing systems that smaller vendors may struggle to fund without outside capital. Those that complete it first will set the contract structure that slower competitors are eventually forced to match on far less favorable terms down the line.
03 / REGIONAL MANUFACTURING RESPONSE

Respond directly to Asian low-cost manufacturing competition

Low-cost Asian manufacturers are scaling picking robot production at price points Western vendors cannot match on hardware alone, threatening the fixed-route tier most directly and squeezing out mid-tier competitors without a clear differentiation strategy. Vendors should either exit that tier entirely in favor of premium GPS-guided platforms or establish their own lower-cost manufacturing footprint to compete on comparable terms. Splitting focus across both price points without a clear tier strategy risks losing ground in each segment simultaneously over the next several years.
04 / MULTI-SPORT MARKET EXPANSION

Expand multi-sport facility coverage ahead of construction growth

New sports facility construction continues expanding across major recreational markets, and vendors with the broadest multi-sport coverage capture disproportionate share of this growing project base as it compounds over the next several years. Vendors that delay this expansion risk losing deals to competitors able to demonstrate proven performance across multiple sport types and facility layouts. Building this coverage after a competitor already has it established is far costlier than building it first across the same facility, chain, and sport types.

Engagement Snapshot From the Field

A live engagement with an industry participant carrying material or product regulatory and market exposure ahead of a defining policy shift, showing how our research translates into a defensible multi-year portfolio strategy.
MARKET MINDS ADVISORY · CLIENT ENGAGEMENT SUMMARY
Ball Picking Robot Producer Strategic Portfolio Review and Transition Roadmap 2026·Investment Scenario on Ball Picking Robot Exposure Evaluation 2025-26
CLIENT PROFILE
A regional driving range chain operating multiple locations across several states engaged MMA to evaluate whether expanding its picking robot fleet could reduce reliance on seasonal collection staff. The chain's existing program relied on a small pilot fleet shared across its busiest location, and leadership wanted an independent assessment before committing further capital to a chain-wide expansion.
STRATEGIC CHALLENGE
The chain faced rising labor costs and unreliable seasonal staffing as peak-hour demand outpaced its limited picking robot capacity. Leadership needed to determine which vendor platforms could realistically scale across its full location network within a defined budget cycle, and whether GPS-guided navigation justified its higher upfront cost. across most locations.
MMA APPROACH
MMA benchmarked four leading picking robot vendors against the chain's specific course layouts and traffic patterns, evaluating navigation reliability, collection efficiency, and total cost of ownership across a five-year horizon. The engagement combined vendor technical interviews with site-specific deployment modeling to project realistic rollout timelines and ongoing service costs. Findings were validated against comparable expansions at peer chains of similar location scale.
KEY FINDINGS
  1. Expanding the fleet across all locations reduced reliance on seasonal collection staff by roughly half during the pilot expansion period (client-reported, unverified by MMA).
  2. Navigation reliability varied meaningfully across vendors on the chain's most sloped and irregular course layouts. requiring additional sensor calibration before full deployment across those courses.
  3. Collection-as-a-service contracts cost less over a five-year horizon than continued reliance on seasonal staffing (client-reported, unverified by MMA). once software licensing and maintenance costs were factored into the comparison.
  4. Collection time per session dropped significantly across the pilot fleet's full coverage area after deployment. freeing facility staff to focus on customer-facing service tasks instead.
CLIENT PROFILE
A regional driving range chain operating multiple locations across several states engaged MMA to evaluate whether expanding its picking robot fleet could reduce reliance on seasonal collection staff. The chain's existing program relied on a small pilot fleet shared across its busiest location, and leadership wanted an independent assessment before committing further capital to a chain-wide expansion.
STRATEGIC CHALLENGE
The chain faced rising labor costs and unreliable seasonal staffing as peak-hour demand outpaced its limited picking robot capacity. Leadership needed to determine which vendor platforms could realistically scale across its full location network within a defined budget cycle, and whether GPS-guided navigation justified its higher upfront cost. across most locations.
MMA APPROACH
MMA benchmarked four leading picking robot vendors against the chain's specific course layouts and traffic patterns, evaluating navigation reliability, collection efficiency, and total cost of ownership across a five-year horizon. The engagement combined vendor technical interviews with site-specific deployment modeling to project realistic rollout timelines and ongoing service costs. Findings were validated against comparable expansions at peer chains of similar location scale.
KEY FINDINGS
  1. Expanding the fleet across all locations reduced reliance on seasonal collection staff by roughly half during the pilot expansion period (client-reported, unverified by MMA).
  2. Navigation reliability varied meaningfully across vendors on the chain's most sloped and irregular course layouts. requiring additional sensor calibration before full deployment across those courses.
  3. Collection-as-a-service contracts cost less over a five-year horizon than continued reliance on seasonal staffing (client-reported, unverified by MMA). once software licensing and maintenance costs were factored into the comparison.
  4. Collection time per session dropped significantly across the pilot fleet's full coverage area after deployment. freeing facility staff to focus on customer-facing service tasks instead.
RECOMMENDED STRATEGY
Phase 1: Phase one expanded the fleet across the highest-traffic location within the first operating year of the engagement. and highest peak-hour demand. Phase 2: Phase two extended deployment to the remaining locations using the validated vendor selection over the following year. across the broader chain footprint. Phase 3: Phase three converted the full chain to collection-as-a-service contracts with the originally selected primary vendor across all remaining chain locations.
OUTCOME
The chain expanded its picking robot fleet across all locations within sixteen months, reporting meaningfully reduced labor costs and faster peak-hour service recovery (client-reported, unverified by MMA). Leadership credited the phased approach with avoiding the disruption a simultaneous chain-wide conversion would have caused. ahead of schedule.

Frequently Asked Questions

Foundational context covering the market sizes, CAGR, scope, country, region and competition that inform every finding below. This section is provided to cover basics and most often pre-purchase conversations, answered from the MMA Primary Research Dataset.

What is the current size of the Ball Picking Robot Market?

The Ball Picking Robot Market is estimated at 0.364 billion dollars in 2026. Growth is driven primarily by a persistent facility maintenance labor shortage worldwide.

How large will the Ball Picking Robot Market be by 2036?

The market is projected to reach approximately 1.303 billion dollars by 2036, adding 0.939 billion dollars of incremental value. That represents a 3.58x expansion over the 2026 base figure.

What is the CAGR for the Ball Picking Robot Market 2026 to 2036?

The market is forecast to grow at 13.6 percent annually through 2036 under the base case scenario. The bull case reaches 14.9 percent while the bear case falls to 12.3 percent.

Which segment is growing fastest?

GPS-guided autonomous pickers for driving ranges lead all segments at 17.8 percent CAGR through 2036. That is roughly 1.31 times the overall market growth rate of 13.6 percent.

Who are the major companies in the Ball Picking Robot Market?

Toro Company, Wilson Sporting Goods, Yamaha Golf-Car, E-Z-GO, and Club Car lead the field. Together these five companies hold a combined cr5 of 50 percent.

Which country is growing fastest?

Japan leads regional growth at 15.4 percent CAGR, driven by its dense driving range network and limited available land. Domestic manufacturing scale further reinforces this growth lead.

Report Segmentation Architecture

The full report scope spans multiple orthogonal segmentation dimensions, with cross-tabulated demand data provided for each dimension pair. Coverage extends further to regional breakdowns, trend trajectories, and the competitive detail needed to support segment-level decision-making.

By Navigation Architecture

    By Facility Type

      By Commercial Dimension

        By Region

        • North America
        • Western Europe
        • East Asia
        • South Asia and Pacific
        • Latin America
        • Middle East and Africa
        • Eastern Europe

        Scope, Methodology, and Coverage

        Every figure in this report is reproducible from documented input assumptions. The scope below maps the historical period, the forecast horizon, the segmentation dimensions, and the countries covered, alongside the underlying primary and qualitative methodology.
        Historical Period
        2020 to 2025
        Forecast Period
        2026 to 2036
        Base Year
        2025 (USD billions; MMA Primary Research Dataset, October 2026)
        Market Definition
        The Ball Picking Robot Market covers autonomous robotic systems designed to collect golf balls, tennis balls, and similar sports balls across driving ranges, courts, and practice facilities. The scope excludes manual collection carts and excludes ball retrieval machinery built into automated serving or launching equipment.
        Quantitative Units
        USD billions
        Segmentation Dimensions
        Regions Covered
        North America, Western Europe, East Asia, South Asia and Pacific, Latin America, Middle East and Africa, Eastern Europe
        Countries Covered
        Key Companies Profiled
        Toro Company, Wilson Sporting Goods, Yamaha Golf-Car, E-Z-GO, Club Car, Textron Golf, Topgolf Callaway Brands, Bridgestone Sports, John Deere Golf, Progressive Turf Equipment, Smithco, Jacobsen, Cushman, Yanmar Golf Cars, Bag Boy Company, Kubota Golf, GolfBoard, Westmoreland Supply, Reelcraft, Range Servant
        Quantitative Methodology
        Primary survey, n=3,800 respondents, Q4 2025, six countries; demand-side model with trade association cross-validation
        Qualitative Methodology
        47 expert interviews, Q4 2025; applied to validate demand model assumptions, identify emerging dynamics, and assess competitive positioning
        Report Format
        PDF and XLSX data workbook (Word format preview document)
        Publisher
        Market Minds Advisory
        Report Code
        MMA-2026-CON-584
        Published
        October 2026
        Contact
        sales@marketmindsadvisory.com | www.marketmindsadvisory.com

        Purchase the full Ball Picking Robot Market Report (2026 to 2036).

        This report provides a comprehensive analysis of the global Ball Picking Robot Market, covering market sizing, segmentation, regional dynamics, and competitive positioning through 2036. It examines the shift from fixed-route collection systems toward GPS-guided autonomous units and recurring collection-as-a-service revenue models. The analysis draws on primary survey data, expert interviews, and company disclosures to benchmark vendor strategy across facility labor shortage dynamics, GPS module cost exposure, and emerging low-cost manufacturing competition. It also profiles the two leading vendors on moat and risk factors, documents recent competitive developments, and lays out revenue lever and portfolio tier economics for executives evaluating where to position within the market.
        Ten-year market sizing and forecast model
        Seven-region demand and growth breakdown analysis
        Competitive benchmarking of twenty leading vendors
        Segment-level CAGR and share analysis detail
        Input cost exposure and mitigation pathways
        Portfolio margin and tier economics breakdown

        Built For The People Who Decide

        From boardroom strategy to bench-side execution, this report is read cover-to-cover by leaders shaping the next decade of their industry, turning demand scenarios, market dynamics and valuation benchmarks into decisions.
        CXOs/ Presidents/ VPs/ Managers
        M&A and Corporate Development
        Strategy Teams and R&D Heads
        Procurement and Product Directors
        Regulatory and Compliance Leaders
        Investor Relations and Equity Analysts