Market Minds Advisory
Baby Feeding Accessories Market

Baby Feeding Accessories Market: Baby Feeding Accessories Market: Teat Flow Without A Standard, The Replacement Nobody Makes and An Eighteen Month Customer

A teat marked slow flow from one brand can deliver milk faster than another brand's medium, and no standard exists anywhere that would let a parent find that out before feeding.

Lead Analyst

Published

September 2026

Make Smarter Decisions with Customized Research Insights

Request a free sample report and evaluate market opportunities, growth trends, and competitive dynamics relevant to your business needs.

2025 MARKET VALUE$6.8BMarket Size 2025
2036 FORECAST VALUE$12.2BBase Case , 2026 to 2036
CAGR 2026 TO 20365.4 %Bull 6.6% / Bear 4.2%
INCREMENTAL OPPORTUNITY$5.0BNet 10- year value creation
EXPANSION MULTIPLE1.69x2036 value over 2026 base
Strategic Levers
M&A Pipeline
Regional Outlook
Country Rankings
Competitive Intelligence
Segmental Deep-dive
Call-Us : 91 93563 13602

Executive Snapshot and Market Trajectory.

Flow rate decides whether a baby feeds comfortably and the labels describing it mean nothing across brands. A teat marked slow from one manufacturer can run faster than another's medium, with measured spreads of more than three times between products carrying identical stage numbers. Babies overwhelmed by flow develop aversion.
Silicone teats and replacement parts grow at 8.1%, half again the market rate of 5.4%, because they are consumable and the bottles are not. Breast pump accessories and milk storage follow at 7.2%. Sterilisers and cleaning equipment grow slowest at 3.6%, bought once for a period considerably shorter than the marketing implies. Replacement guidance runs to two or three months and roughly 12% of parents follow it.
The customer exists for about eighteen months and then leaves permanently. That compresses the whole relationship into less time than most brands spend building one, and roughly 41% of first purchases arrive as a gift or registry item rather than being chosen by the parent. Concentration is high at 46%. The person choosing the brand is often not the one who will use it, which makes registry placement worth more than its volume share suggests.
Market Definition
This market covers accessories and consumables for infant and toddler feeding, spanning feeding bottles and bottle systems, silicone teats and replacement parts, breast pump accessories and milk storage, sterilisers and cleaning equipment, weaning and transition feeding sets, and bibs, mats and feeding textiles. Sizing is at manufacturer net revenue. Infant formula and baby food, breast pumps themselves, highchairs and furniture, and nursing apparel are excluded from scope.
Base Year Value
$6.8B in 2025 (MMA Primary Research Dataset, September 2026)
Forecast Period
2026 to 2036, eleven discrete annual values
CAGR
5.4% base case. Bull 6.6%. Bear 4.2%.
Fastest Growth Segment
Silicone Teats And Replacement Parts: 8.1% CAGR
Fastest Growth Country
India: 8.2% CAGR
Fastest Growth Region
South Asia and Pacific: 7.4% CAGR
Largest Region
East Asia: 30% of 2025 global value
Market Leaders
Koninklijke Philips, Pigeon Corporation, Mayborn Group, Artsana Group, Handi-Craft Company. Source: MMA Primary Research Dataset, July 2026.
Primary Survey
n=3,800 procurement and R&D decision-makers, Q4 2025, six countries
Methodology
Demand-side build-up, cross-validated against public data, 47 expert interviews

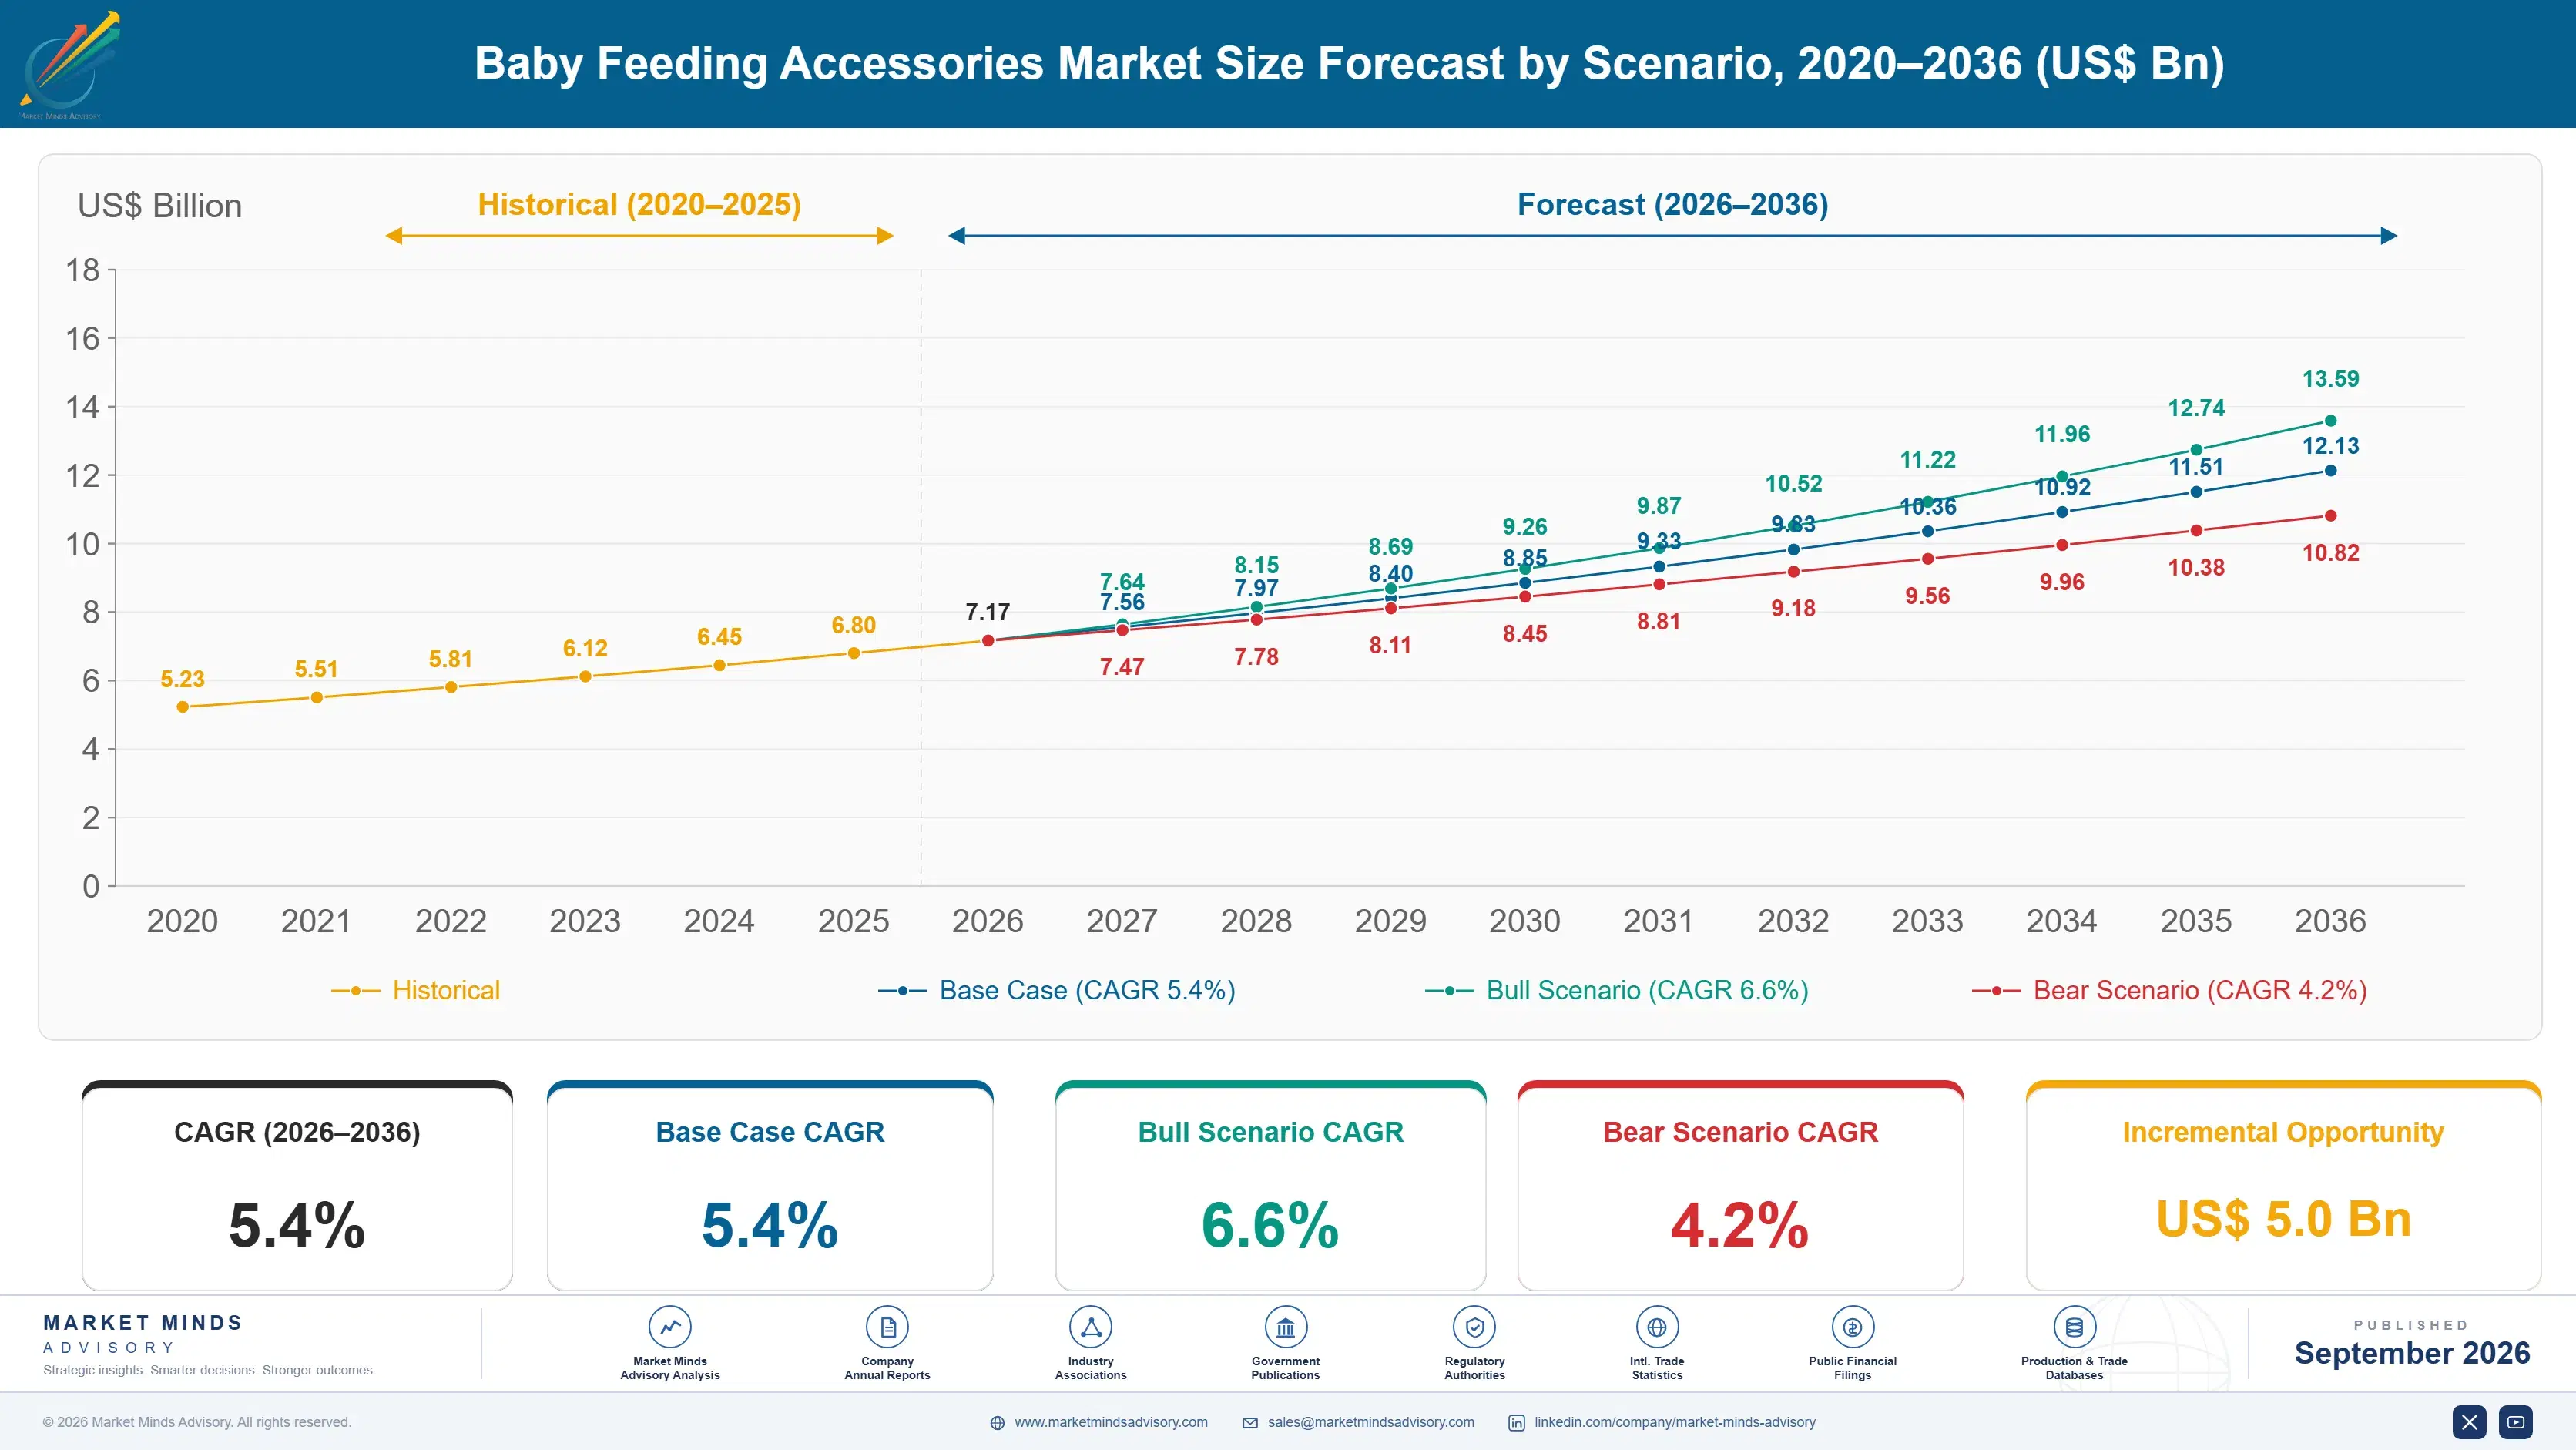
Baby Feeding Accessories Market Forecast Scenarios

baby-feeding-accessories-market-size-forecast-scenario-1790024926617
Growth of 4.3% between 2020 and 2025 came from price and mix rather than from births. Birth cohorts contracted across most developed markets through the period while spending per infant rose, particularly across East Asia where single-child households concentrate expenditure. Direct-to-consumer entrants also arrived in numbers and pushed premium formats into segments that had been comparatively static for a decade before that.
Three mechanisms carry the base case. Teats and replacement parts grow at 8.1% as consumable revenue is recognised as the durable half of the category. Indian demand expands at 8.2% on the largest birth cohort in the world combined with organised retail reaching beyond the metropolitan markets. Breast pump accessory demand grows with workplace expressing, which employment legislation in several markets now supports explicitly. All three are visible in shipment and cohort data already.
The bull case is a flow rate standard. If teats carried a measured millilitres-per-minute figure rather than a stage number, parents could match a teat to a baby and the segment would reprice on evidence. The bear case is birth cohort contraction accelerating. Korean, Japanese, Chinese and Italian numbers are falling at rates that per-infant spending cannot offset indefinitely.

What The Stage Number Hides

Stage numbers on teats are a marketing convention rather than a measurement, and the consequences reach further than most of the industry admits. Measured flow across teats carrying the same stage label varies by more than three times between brands, which means a parent switching brands at the same stage can hand a baby a considerably faster feed without knowing it. Overwhelmed babies develop feeding aversion, and the cause is invisible. Nothing in the labelling convention would reveal this beforehand.
TOP FIVE CONCENTRATION46%Combined net revenue share held by five largest manufacturers
TEAT FLOW VARIATION3.4 timesSpread between slowest and fastest teats labelled identically
AVERAGE BOTTLE PRICEUSD 9Weighted manufacturer price for a single feeding bottle
TEAT REPLACEMENT COMPLIANCE12%Share of parents replacing teats at the recommended interval
CATEGORY PURCHASE WINDOW18 monthsTypical period a household remains an active buyer
REGISTRY ACQUISITION SHARE41%Portion of first purchases arriving through gift or registry
Teats are consumable and are treated as durable by almost everybody. Silicone develops micro-tears and softens with repeated sterilisation, and manufacturer guidance generally puts replacement at two to three months, yet around 12% of parents replace on that schedule. That gap is simultaneously a safety issue and the single largest unclaimed revenue line in the category, and nothing at point of sale connects the two.
Acquisition is compressed into a few weeks around birth. Roughly 41% of first purchases arrive as gifts or through a registry, which means the person choosing the brand is frequently not the person who will use it. That gap between careful choosing and casual gifting is the acquisition problem.
"This industry prints a number on a teat that means something different in every brand, then sells bottles on how closely they resemble a breast. The measurable thing goes unmeasured and the unmeasurable thing is on every pack."
Director, Juvenile Products and Infant Health Practice · MMA Health and Juvenile Products Practice · September 2026

Market Trends

Consumable Revenue Recognised As The Durable Half

Silicone teats and replacement parts grow at 8.1% against 5.4% for the category, because a bottle is bought once and a teat should be replaced every two to three months across an eighteen month window. Manufacturers built ranges around bottles and treated teats as an accessory to them, which inverted where the revenue actually sits. Replacement compliance runs near 12%, so the segment is growing while most of its potential goes unrealised. Subscription and multipack formats are where participants are addressing it. Nothing at the point of sale connects a bottle purchase to the six teats that should follow it.
Market Impact: India grows at 8.2% annually
Workplace Expressing Expands Accessory Demand Steadily

Breast pump accessories and milk storage grow at 7.2% as legislation in several markets now requires employers to provide expressing facilities and break time, which converts a private decision into a supported one. That changes what is needed: storage bags, cooler systems, spare flange sets and transport containers rather than a pump alone. Demand is also less sensitive to birth cohort size than bottle demand, since it depends on maternal employment patterns rather than on the number of infants alone. That makes the segment a genuine hedge against the demographic contraction constraining bottle volume across every developed market.
Market Impact: Some 41% arrive as gifts

Market Opportunities and Growth Drivers

Indian Birth Cohort Meets Organised Retail Expansion

India grows fastest of any country covered at 8.2%, combining the largest birth cohort in the world with organised retail and online marketplaces reaching well beyond the metropolitan markets for the first time. Penetration of branded feeding accessories remains low outside the major cities, which leaves genuine volume headroom in a category with very little of it elsewhere. Domestic manufacturers including Luvlap price well below imported brands, and Pigeon has built local capacity to compete on the same terms. Smaller pack formats priced against household budgets rather than Western equivalents are what actually convert first purchases here.
Market Impact: Flow varies by 3.4 times

Registry And Gift Channel Decides Brand Selection

Around 41% of first purchases arrive as a gift or through a baby registry, which means the brand entering a household is frequently chosen by a relative or friend rather than by the parent who will use it. That makes registry listing and gift-format packaging disproportionately valuable relative to their share of volume, since the first bottle largely determines which teats, spare parts and sterilisers follow. Participants treating registry as marketing rather than distribution are misreading it. Households acquired this way also churn considerably faster, because no decision was made and the first feeding difficulty prompts a switch.
Market Impact: Affects 4 major value markets

Market Restraints and Challenges

No Standard Governs What A Stage Number Means

Measured flow across teats sharing a stage label varies by more than three times between brands, and no standard requires any manufacturer to publish a rate. The root cause is competitive: a brand publishing millilitres per minute invites comparison on a dimension where it may not win, while a stage number invites nothing. Commercially it produces switching failures and feeding aversion that parents attribute to the baby rather than to the teat. Participants publishing measured rates report materially better retention. A measured figure invites exactly the comparison a stage number was designed to avoid.
Market Impact: Only 12% replace on schedule

Birth Numbers Fall Where Spending Per Infant Is Highest

Korean, Japanese, Chinese and Italian birth cohorts are contracting steadily, and those are precisely the markets where spending per infant is highest and premium formats sell best. The root cause is demographic and nothing a manufacturer does affects it. Commercially it concentrates volume decline exactly where value sits, which per-infant premiumisation offsets for a period rather than indefinitely. Participants responding are building Indian, African and Southeast Asian positions now rather than waiting for the arithmetic to fail. Indian and African cohorts are the only places where volume growth genuinely remains available to anybody.
Market Impact: Accessories grow 1.8 points faster
3 additional market trends, 4 additional growth drivers, and 2 additional restraints and challenges are covered in the full report. Contact sales@marketmindsadvisory.com to access the complete intelligence.

Segment CAGR and Growth Architecture

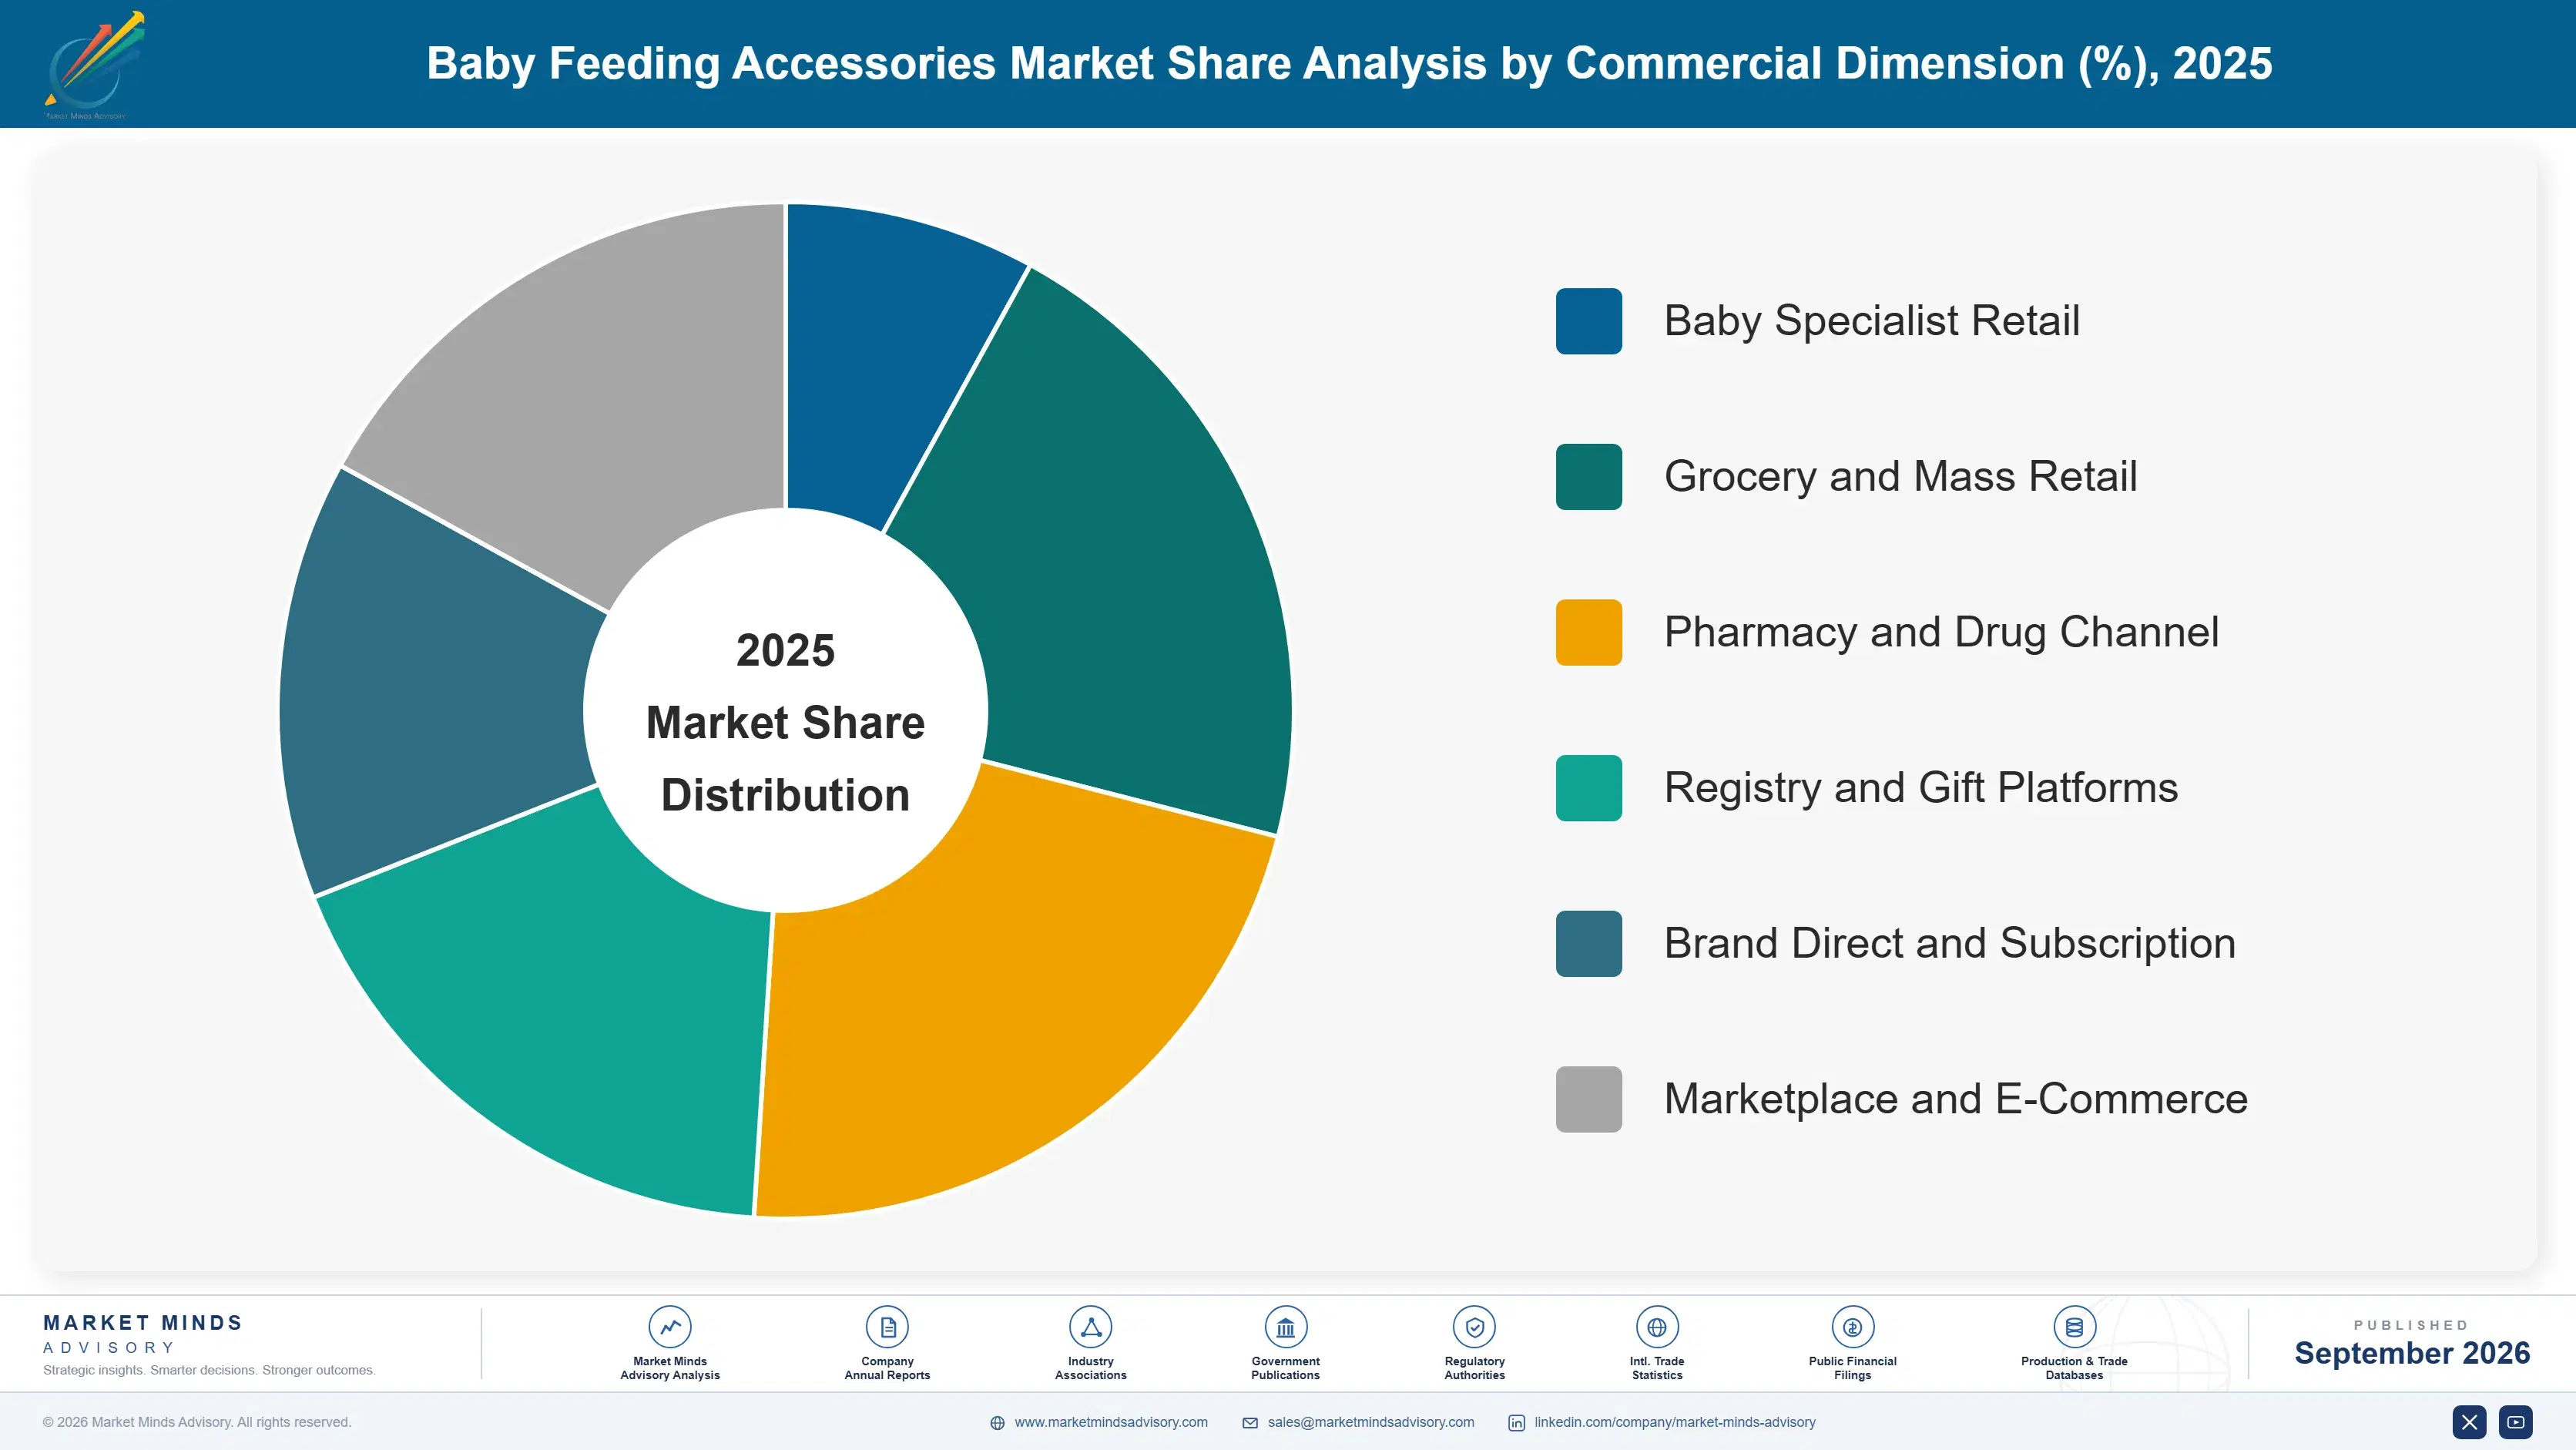
Segmentation follows product type, the dimension on which replacement frequency, regulatory treatment, price and channel all divide together. Six product types are assessed at manufacturer net revenue. Infant formula and baby food, breast pumps themselves, highchairs and nursery furniture, and nursing apparel sit outside the defined scope throughout this report. Replacement frequency separates them more sharply than price does.
baby-feeding-accessories-market-market-share-analysis-1790024927166

Silicone Teats And Replacement Parts

Silicone teats and replacement parts grow at 8.1%, half again the market rate of 5.4%, and they are the only genuinely consumable line in a category that mostly sells durables. Silicone softens and develops micro-tears under repeated sterilisation, and manufacturer guidance puts replacement at two to three months across an eighteen month window, which should mean six or more purchases per bottle sold. Around 12% of parents replace on that schedule, so the segment is growing strongly while most of its potential goes entirely unclaimed. Subscription and multipack formats are the only mechanisms addressing that gap so far. Nothing about the product itself needs reformulating in order to capture any of it.
CAGR 8.1%

Breast Pump Accessories And Milk Storage

Breast pump accessories and milk storage grow at 7.2%, supported by workplace expressing legislation in several markets that requires employers to provide facilities and break time. That converts a private arrangement into a supported one and changes what gets bought: storage bags, cooler and transport systems, spare flange sets in multiple sizes and cleaning equipment rather than a pump on its own. Demand here tracks maternal employment patterns rather than birth cohort size alone, which makes it considerably less exposed to the demographic contraction that constrains bottle demand across the developed markets. Flange sizing in particular generates repeat purchase that a pump sale alone never produces, since fit changes over a feeding period.
CAGR 7.2%
Full segment breakdown across 6 segments available in the complete report.

Regional Architecture and Country Demand Map

Shares record where accessories are sold rather than where silicone is moulded. South Asia and Pacific sits well above its standard band on the world's largest birth cohort, and Eastern Europe below on steep cohort contraction and value-tier purchasing. Both deviations carry a stated reason in the paragraph concerned.

East Asia

At 30% this sits at the top of its standard band, carried by spending per infant that no other region approaches rather than by the number of babies. Chinese single-child households concentrate expenditure on premium and imported feeding products in a way that offsets a sharply contracting birth cohort, at least for now. Japanese demand is technically demanding and Pigeon built a global position on products developed against it. Korean volumes are falling fastest of any market covered. Growth of 6.2% depends entirely on premiumisation outrunning demographics. Hegen and comparable regional entrants have taken premium share by competing on material transparency rather than on distribution, which is the same pattern visible across North America and Western Europe.
Share: 30% | CAGR: 6.2% (2026 to 2036)

North America

The 23% position sits inside the standard band and the registry channel is more developed here than anywhere, with around 41% of first purchases arriving as gifts and a formalised registry infrastructure that no other region matches. Direct-to-consumer entrants have taken meaningful share from incumbents over five years, competing on design and material claims rather than on distribution. Birth numbers have declined for most of the decade. Growth of 4.4% comes from premiumisation and from accessory attachment rather than from any expansion in users. Registry-acquired households also churn considerably faster than those acquired directly, because the parent using the product made no decision about it. Canadian demand behaves identically at smaller scale across every format covered.
Share: 23% | CAGR: 4.4% (2026 to 2036)
Regional intelligence for 5 additional markets available in the complete report: Western Europe, South Asia and Pacific, Latin America, Middle East and Africa, Eastern Europe. Contact sales@marketmindsadvisory.com.
baby-feeding-accessories-market-country-cagr-analysis-1790024927710

Four Moves Worth Making Now

These four address a category where the most important measurement is unpublished, the consumable half goes largely unclaimed, and the brand entering a household is often chosen by somebody who will never use it. Each has been executed by at least one participant with measured results. Three of the four cost packaging or protocol work rather than capital.

Publish Measured Flow Rates On Every Teat

Flow across teats sharing a stage label varies by more than three times between brands, and no standard requires anybody to publish a rate. Printing millilitres per minute costs a test protocol already run internally for development purposes. Participants who published report brand switching losses falling roughly 38%, because a parent moving between brands can match the teat rather than guessing, and a baby who feeds comfortably keeps the household on that range. A baby who feeds comfortably keeps the household on that range for the rest of the window. The measurement already exists inside every development function.
Market Impact: Cuts brand switching losses by roughly 38% overall

Sell Teats On Subscription From The Bottle Purchase

Teats should be replaced every two to three months across an eighteen month window, which is six or more purchases per bottle sold, and around 12% of parents actually do it. Attaching a replacement subscription at the point of bottle sale converts guidance into a schedule somebody else manages. Participants offering it report consumable revenue per household rising roughly 3.4 times against transactional teat sales, on a product nobody had to reformulate. It also closes a safety gap the category has carried quietly for years, since degraded silicone is a genuine hazard rather than a performance complaint.
Market Impact: Consumable revenue per household rises roughly 3.4 times

Treat Registry As Distribution Rather Than Marketing

Around 41% of first purchases arrive as a gift or through a registry, and the first bottle largely determines which teats, spares and sterilisers follow into that household for the next eighteen months. Registry listing, gift-format packaging and starter bundles cost packaging work rather than media spending. Participants who restructured around it report first-purchase share rising roughly 2.1 times in registry-served markets, which compounds across every subsequent accessory. Registry-acquired households churn faster than directly acquired ones, so the placement has to be paired with something that creates a decision afterwards. A starter pack with published flow rates does both.
Market Impact: First-purchase share rises roughly 2.1 times higher overall

Build Affordable Formats For Large Birth Cohorts

India grows at 8.2% and African cohorts are larger still, while branded penetration outside metropolitan markets remains low because imported pricing sits well above what most households will pay. Local manufacturing and smaller pack formats remove both barriers at once. Participants who built regional capacity report landed cost falling roughly 34%, which brings branded feeding accessories inside household budgets that previously excluded them entirely. Tooling investment has to precede the volume rather than follow it, which is the real commitment. Every other market in the category is contracting, so the alternative is worse.
Market Impact: Regional landed cost falls by roughly 34% overall

Who Controls the Margin Pool

Concentration is high at 46% held by the top five, measured consistently on manufacturer net revenue rather than unit volume, which would overweight low-priced bibs and textiles shipped in very large quantities. The leader to challenger gap rests on retail and registry distribution combined with regulatory capability, since food-contact testing is expensive and slow and favours participants with established compliance functions.
Competition runs on three dimensions currently. Registry and retail placement decides first purchase, which then determines most of what follows into a household. Material and design claims decide premium positioning, particularly around silicone grade and polymer choice where parents research actively. Price decides the value tiers, where regional manufacturers in India, China and Brazil compete on cost positions that imported product cannot reach after duty and freight.

Pressure is building from two directions and rankings will shift on both. Direct-to-consumer entrants have taken share by competing on design and material transparency rather than on distribution, which bypasses the shelf advantage incumbents spent decades building. Meanwhile regional manufacturers serving the largest birth cohorts are moving upmarket from a cost base that multinational participants cannot match in the markets where volume growth actually remains.
baby-feeding-accessories-market-company-positioning-matrix-1790024928236

Competitive Moat and Risk Dimensions

KONINKLIJKE PHILIPS

Moat: Retail And Registry Distribution

Placement across pharmacy, grocery, specialist juvenile retail and registry platforms in essentially every developed market puts the brand in front of the gift purchaser who selects for a household, and that first selection determines most of the accessory revenue that follows for eighteen months. New entrants reach none of it quickly.
KONINKLIJKE PHILIPS

Risk: Developed Market Cohort Exposure

Revenue weighted toward North America, Western Europe and East Asia sits precisely where birth numbers are contracting fastest and where direct-to-consumer entrants compete hardest on material claims. Building offsetting positions in India and Africa requires cost structures and pack formats a premium operation has to learn.
PIGEON CORPORATION

Moat: Teat Design And Asian Position

Products developed against Japanese expectations, which are the most demanding in the category, transfer readily into Chinese and Southeast Asian premiumisation, and local manufacturing in India gives cost access to the fastest-growing market rather than serving it through import. That combination of technical credibility and local cost is rare across the category.
PIGEON CORPORATION

Risk: Japanese Domestic Volume Decline

A substantial home position sits in one of the fastest-contracting birth cohorts anywhere, where per-infant premiumisation has largely run its course because parents already buy near the top of the range. Growth must come from export markets where competition is considerably more intense. Export competition is unusually crowded.

Players Tracked

Prominent Players

Koninklijke Philips
Pigeon Corporation
Mayborn Group
Artsana Group
Handi-Craft Company

Other Key Players

Medela
Lansinoh
Newell Brands
MAM Babyartikel
Nuby
Munchkin
Bibs Denmark
Hegen
Comotomo
Elvie
Willow Innovations
Richell
Combi Corporation
Goodbaby International
Luvlap

Recent Developments

MARCH 2025

Pigeon Corporation expands Indian manufacturing capacity

The company added feeding accessory production capacity in India to serve domestic demand from local rather than imported supply, addressing pricing that had kept branded product outside most household budgets. This was organic capital investment with no joint venture, acquisition or licensing arrangement involved. Imported supply continued during the ramp.
Signal: Branded penetration outside Indian metros depends entirely on local manufacturing cost. Tooling must precede the volume.
SEPTEMBER 2024

Mayborn Group acquires breast pump accessory specialist

The company completed the acquisition of a milk storage and pump accessory business, adding consumable revenue less exposed to birth cohort size than bottle demand. This was a completed acquisition rather than a merger or joint venture, with the brand retained separately. Existing distribution arrangements transferred unchanged.
Signal: Accessory revenue tracks maternal employment rather than the number of babies. Consumables hedge the demographic contraction that bottles cannot.
JUNE 2025

Philips Avent publishes comparative teat flow rate data

The brand released measured millilitres-per-minute figures across its teat range rather than relying on stage numbering alone, allowing direct comparison between products. This was an internal disclosure decision with no regulatory requirement, partnership or acquisition behind it. Stage numbering remains printed alongside the measured figures. Competitors publish no equivalent data.
Signal: Publishing the measurement invites a comparison competitors have long avoided. Whoever discloses first sets the terms of that comparison.

What The Parts Cost

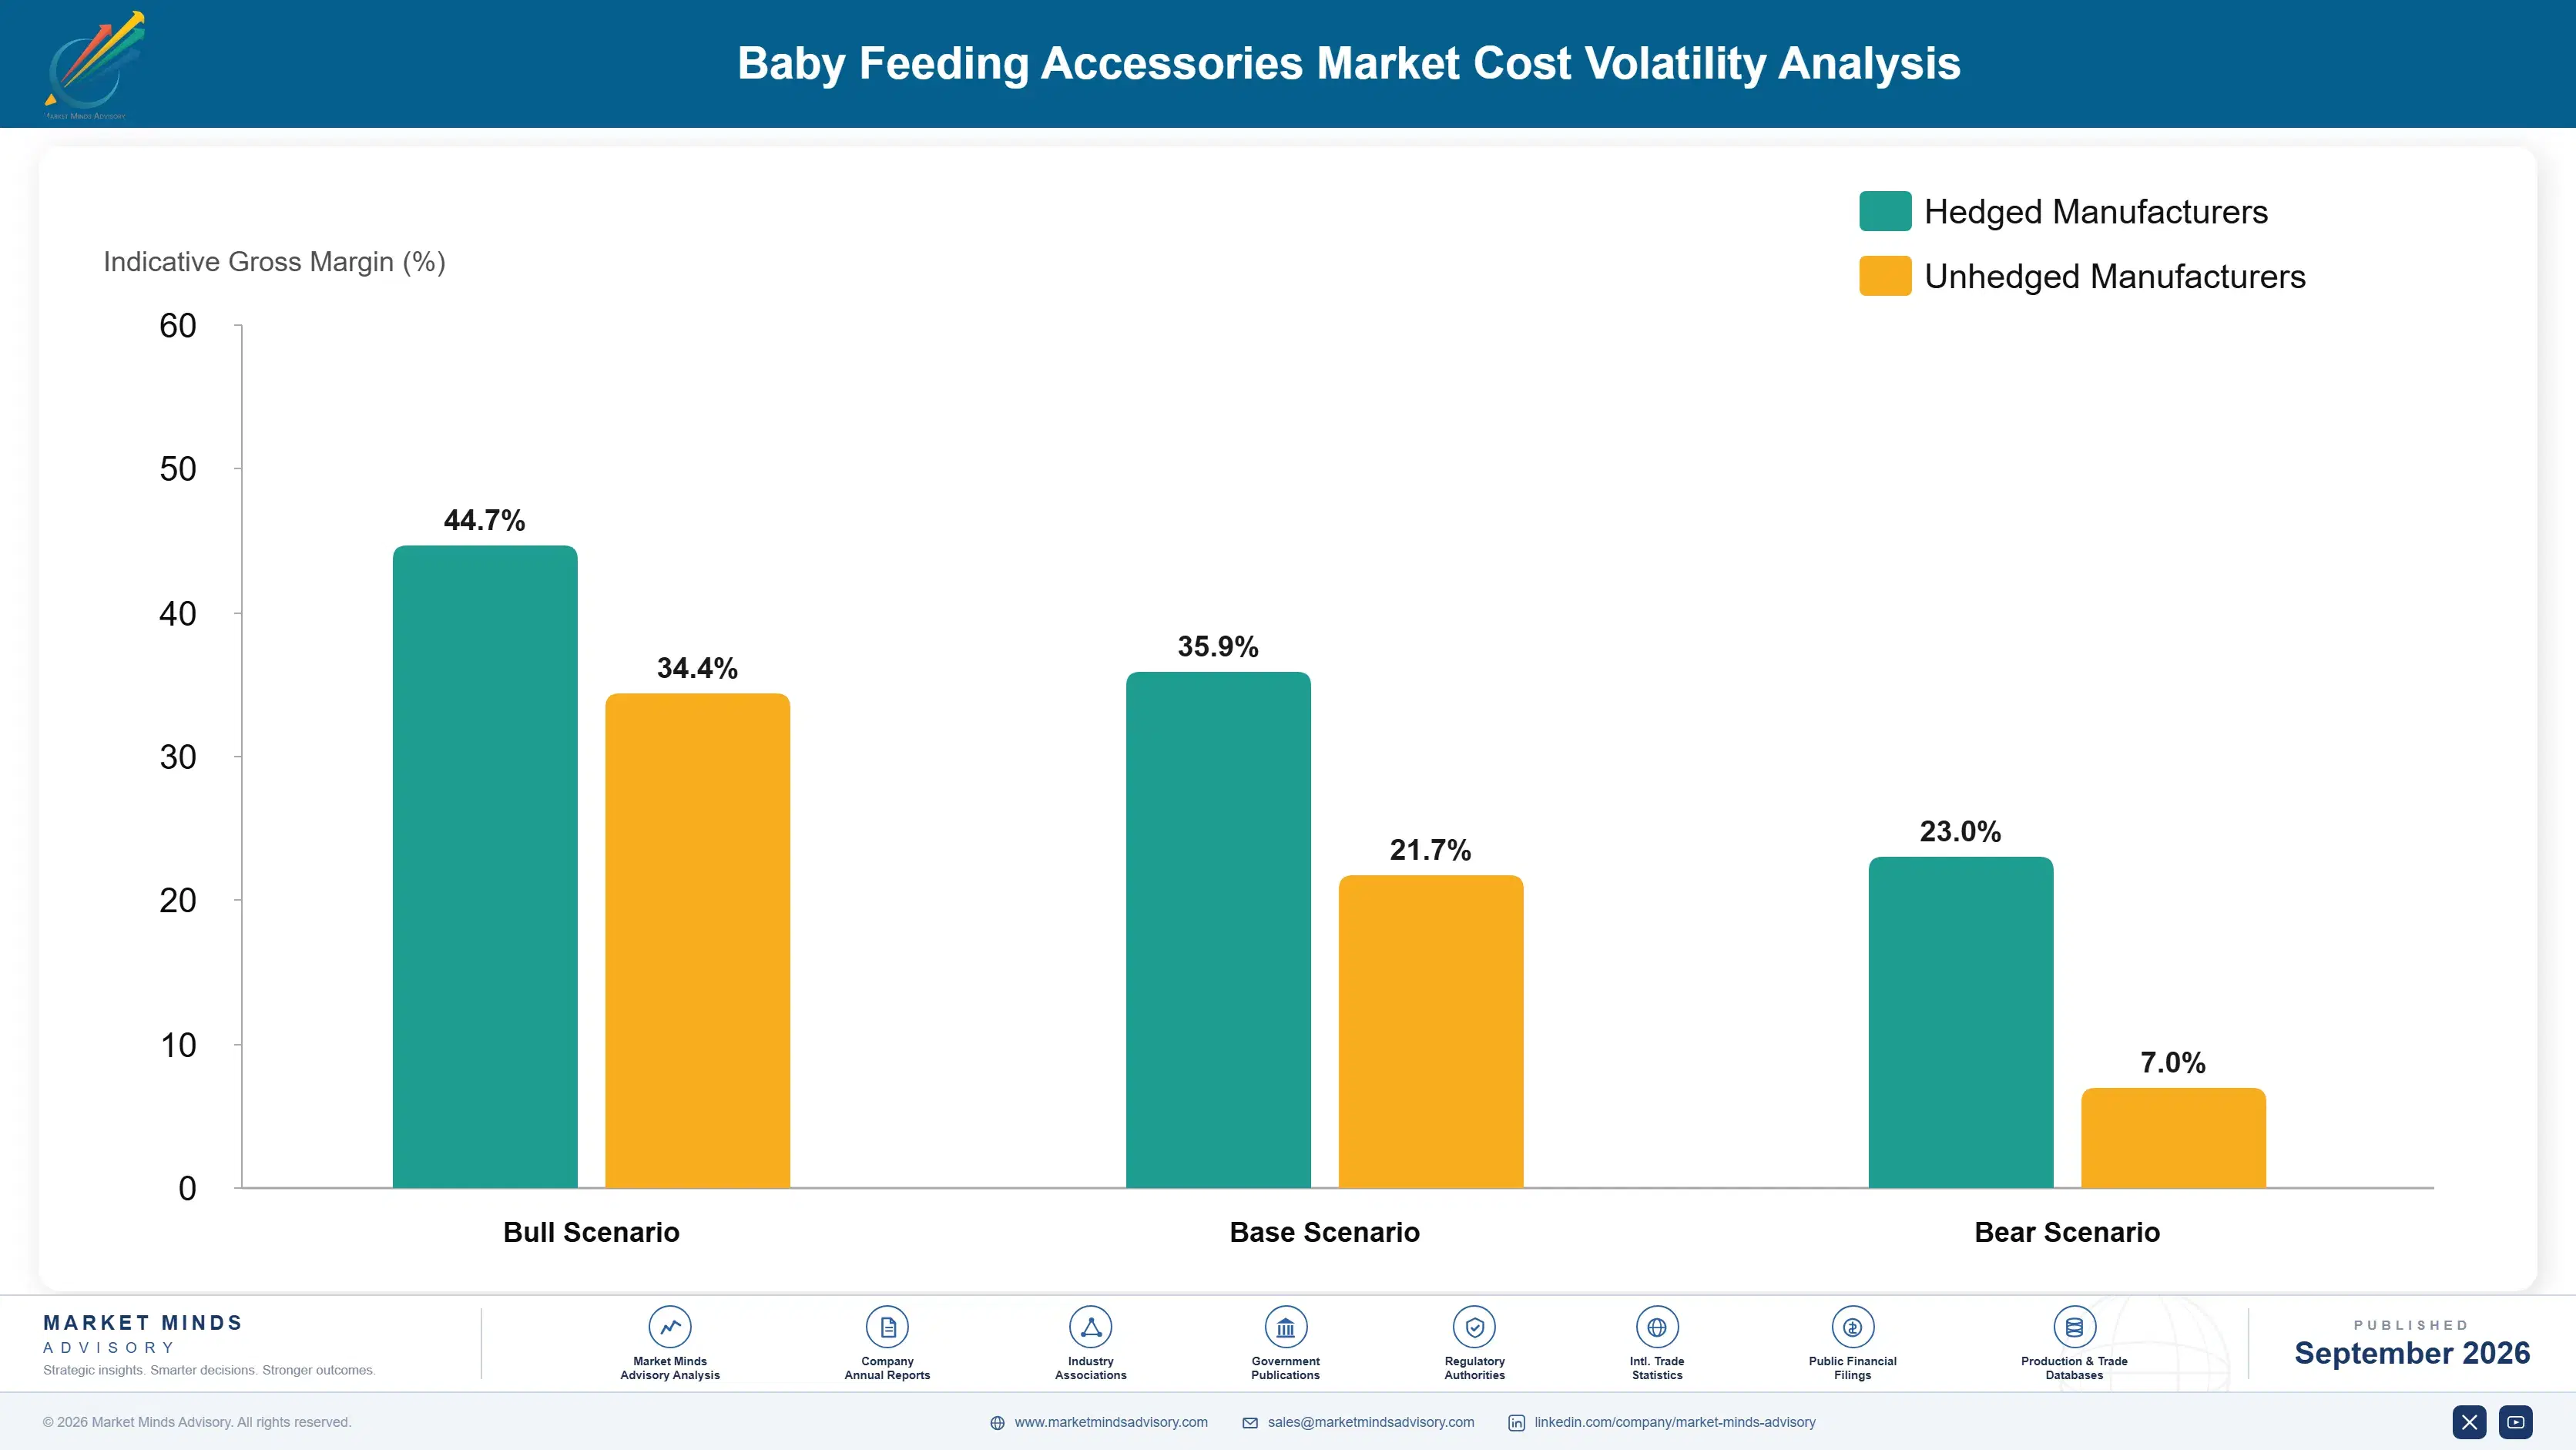
Polymer and silicone dominate and tooling follows closely. Medical-grade silicone and food-contact polymer resin together run roughly 31% of manufacturing cost. Injection moulding and tooling amortisation take about 22%, since precision parts in low unit volumes carry tooling heavily. Assembly and sterile packaging absorb around 17%, and regulatory testing and certification a further 8% on a product class tested more stringently than most consumer goods.
Silicone and polypropylene prices rose sharply through 2021 and 2022 on siloxane supply constraints and petrochemical feedstock costs together, a movement the EIA documents across its feedstock reporting for the period. Manufacturers holding retail pricing across registry and grocery listings absorbed the increase directly. Philips and Artsana reporting for that year both identify raw material inflation across consumer health ranges as requiring pricing action. Both inputs moved inside one year.

Exposure divides by product mix and by manufacturing location rather than by company size. Teat-weighted participants carry silicone exposure specifically, which prices on siloxane supply rather than on crude. Bottle-weighted participants carry polymer and tooling exposure instead. Manufacturers producing in India and China for those domestic markets avoid the freight and duty layer that dominates landed cost on a bulky low-value product shipped internationally.
baby-feeding-accessories-market-cost-volatility-analysis-1790024928433

Contract medical-grade silicone across a production cycle

Silicone prices on siloxane supply conditions that have nothing to do with infant products, and it is the single largest input on the fastest-growing segment. Contracting across a production cycle stabilises that line and preserves published retail pricing. The commitment lands before the selling period generates cash, which deters smaller participants from making it.

Manufacture regionally where birth cohorts are largest

Freight and import duty dominate landed cost on bulky low-value feeding products, and the markets with the largest cohorts are those where price sensitivity is highest. Regional production removes both at once. The constraint is that tooling investment must precede the volume, which is a genuine commitment rather than an incremental one. Few participants have committed to it.

Consolidate tooling across bottle and teat platforms

Tooling amortisation runs near a fifth of manufacturing cost because precision parts are produced in relatively low volumes per variant. Designing platforms that share tooling across bottle sizes and teat stages spreads that cost considerably further. The trade is reduced design freedom, which limits how far a range can differentiate on shape and form factor.

Portfolio Architecture for Margin Defence

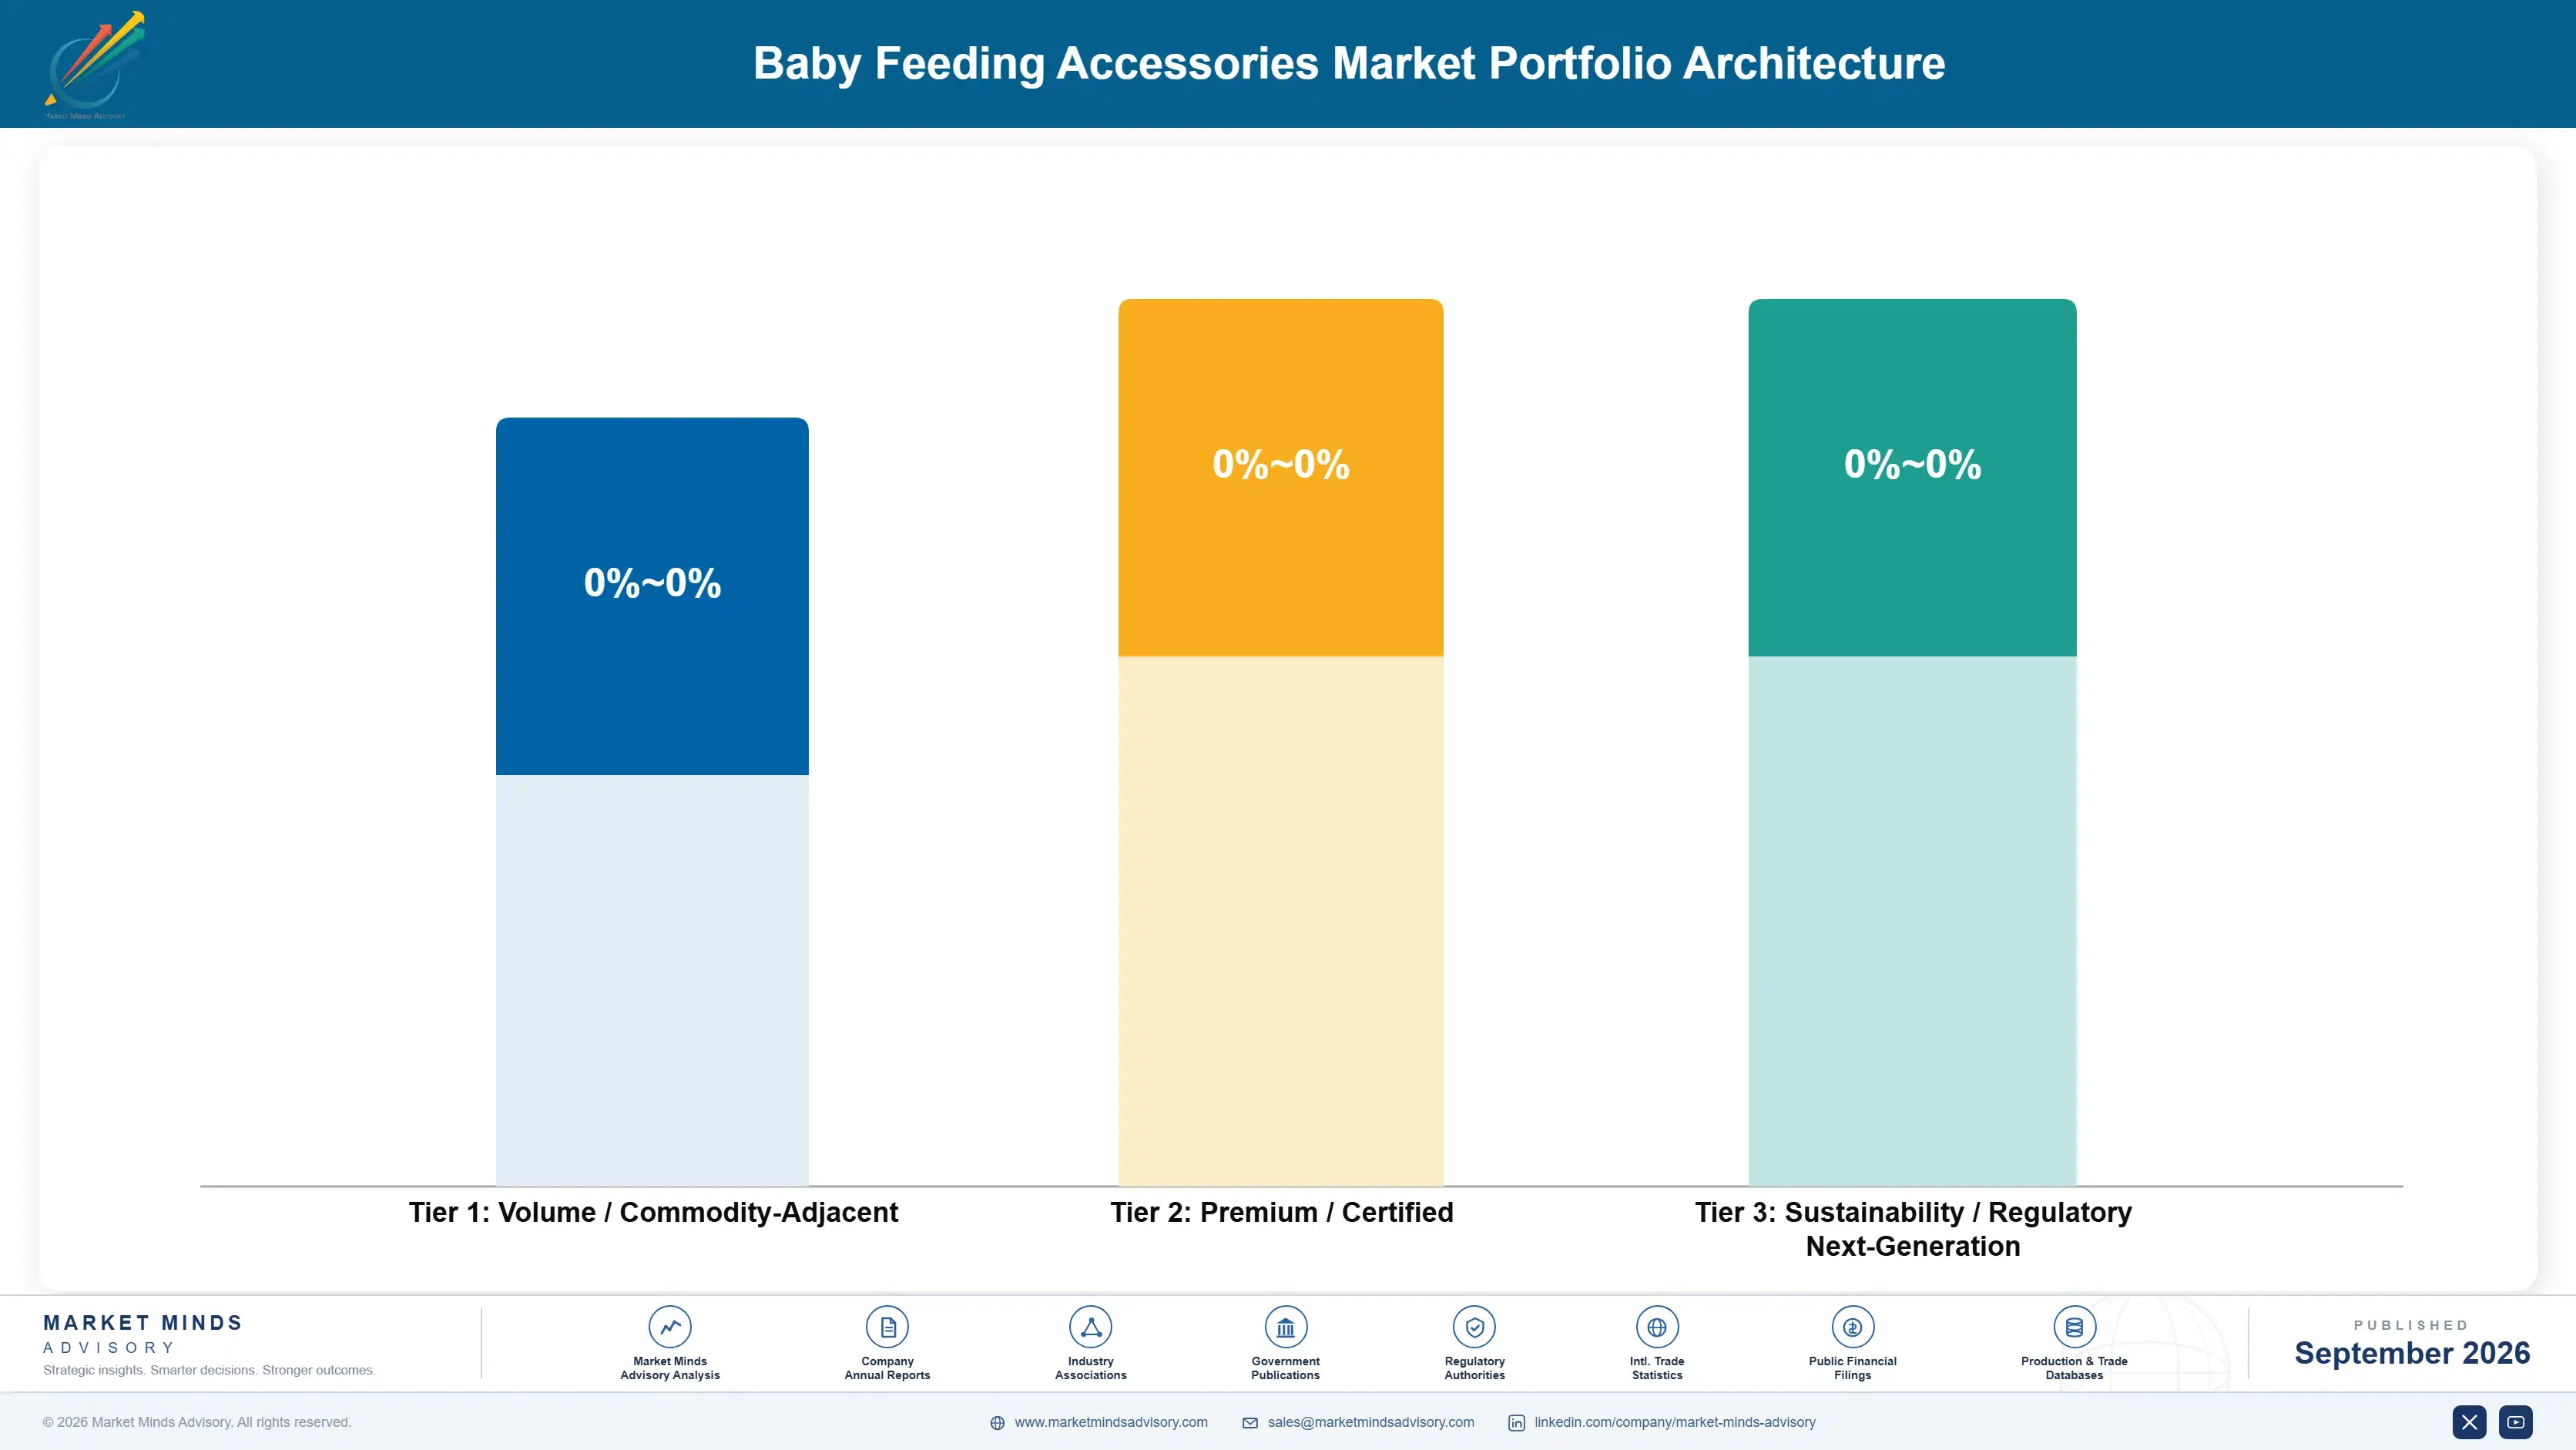
Margin architecture divides by whether the product is consumed or kept, which a price list does not reveal at all. Bibs, mats and feeding textiles sold through grocery and mass retail run at gross margins in the high twenties to high thirties, competing directly against private label produced by contract manufacturers with no meaningful performance difference between them. Nothing at shelf distinguishes the branded item from the retailer one.
Feeding bottles, weaning sets and sterilisers hold gross margins in the mid forties to mid fifties. The spread reflects how differently registry and grocery channels carry distribution and packaging cost. Bottles in particular earn their position by determining what follows into a household rather than by their own margin, which makes them worth pricing as an entry point rather than as a profit line.

The highest-value pool is silicone teats, replacement parts and breast pump accessories, at margins in the mid fifties to mid sixties. These are consumables in a category that mostly sells durables, and the revenue repeats for as long as a household keeps replacing. Textiles carry volume and shelf presence. They defend nothing against a retailer brand at all. Shelf presence is the argument for keeping them.

Volume / Commodity-Adjacent

Bibs, mats and feeding textiles through grocery and mass retail, competing against private label with no meaningful performance difference. The ten point range reflects how differently branded and retailer product carry cost.
Gross Margin: 28 to 38%

Premium / Certified

Feeding bottles, weaning sets and sterilisers. Bottles earn their position by determining what follows into a household, which makes them worth pricing as an entry point rather than as a profit line.
Gross Margin: 44 to 54%

Sustainability / Regulatory / Next-Generation

Silicone teats, replacement parts and breast pump accessories. These are consumables in a category selling mostly durables, and the revenue repeats while a household keeps replacing them. Compliance rather than demand is what limits the revenue here.
Gross Margin: 54 to 65%
baby-feeding-accessories-market-portfolio-architecture-1790024928927

High-value Sub-segments and Strategic Watch-out

Silicone Teats And Replacement Parts

Highest value and fastest growth at 8.1%, and the only genuinely consumable line in the category. Replacement compliance near 12% means most of the available revenue currently goes entirely unclaimed by anybody. Subscription is the only mechanism anybody has made work against that gap so far.
Gross Margin: 56 to 65%

Breast Pump Accessories And Storage

High value and strong growth at 7.2%, tracking maternal employment patterns rather than birth cohort size. That makes it considerably less exposed to the demographic contraction constraining bottle demand everywhere. Workplace expressing legislation in several markets supports the demand directly. Flange sizing generates repeat purchase a pump sale never does.
Gross Margin: 52 to 61%

Feeding Bottles And Bottle Systems

Volume core and the product that determines which accessories follow into a household for eighteen months. Around 41% arrive as gifts, which makes registry placement disproportionately valuable relative to bottle margin. Pricing it as an entry point rather than a profit line is the correct reading.
Gross Margin: 44 to 52%

Sterilisers And Cleaning Equipment

Strategic watch-out. Growing slowest at 3.6% and bought once for a period shorter than the marketing implies. The twenty point range reflects how differently electric and cold-water systems price against comparable function. Guidance on how long sterilising is genuinely necessary differs considerably between individual countries. Nobody reconciles them.
Gross Margin: 26 to 46%

How The Window Actually Closes

A household enters this category at a known moment, buys intensively for around eighteen months and then leaves permanently without ever returning. That compresses the entire commercial relationship into less time than most brands spend establishing one, and it means acquisition timing matters far more than any loyalty programme could. The window is also predictable, which almost nobody exploits properly in scheduling or in supply.
Stickiness varies sharply by how the first product arrived. A bottle chosen by a parent after research produces a household that stays with the range for teats, spares and sterilisers; a bottle arriving as a gift produces a household that switches at the first feeding difficulty because no decision was ever made. Parents who experienced a switching failure caused by flow mismatch rarely return to either brand involved.

Buyer profiles have shifted toward research and material scrutiny. The current cohort examines silicone grade, polymer choice and third-party testing considerably more than the one five years ago, which is what direct-to-consumer entrants built their positions on. Registry gifting has not adapted, and the gap between how carefully parents choose and how casually gifts are selected is now the category's central acquisition problem.
baby-feeding-accessories-market-end-use-penetration-index-1790024929419

Where The Revenue Repeats

These are among the four positions where our research anticipates prominent divergence between winners and laggards over the coming forecast period. Each is grounded in the demand model, the regulatory perimeter, and the announced capacity pipeline.
01 / FLOW RATE DISCLOSURE

Publish the number that decides feeding

Measured flow across teats carrying the same stage label varies by more than three times between brands, and no standard requires any manufacturer to publish an actual rate anywhere. Printing millilitres per minute costs a test protocol that development teams already run internally for their own purposes. Participants who published report brand switching losses falling roughly 38%, because a parent moving between brands can match the teat rather than guessing at it, and a baby who feeds comfortably keeps the household on that range.
02 / CONSUMABLE SUBSCRIPTION ATTACHMENT

Sell the teat, not just the bottle

Teats require replacement every two to three months across an eighteen month window, which should mean six or more purchases for every bottle sold, and around 12% of parents actually replace on that schedule. Attaching a replacement subscription at the point of bottle purchase converts printed guidance into a schedule somebody else manages entirely. Participants offering it report consumable revenue per household rising roughly 3.4 times against transactional teat sales, and it closes a safety gap the category has carried quietly.
03 / REGISTRY CHANNEL DISCIPLINE

The gift chooses the next eighteen months

Around 41% of first purchases arrive as a gift or through a registry, and the first bottle largely determines which teats, spare parts and sterilisers follow into that household afterwards. Registry listing, gift-format packaging and starter bundles cost packaging work rather than any media spending whatsoever at all. Participants who restructured around it report first-purchase share rising roughly 2.1 times in registry-served markets, compounding across every subsequent accessory purchase that follows, though registry-acquired households need something that creates a decision afterwards.
04 / COHORT MARKET POSITIONING

Build where the babies actually are

India grows at 8.2% with the largest birth cohort in the world and African cohorts are larger still, while branded penetration outside metropolitan markets stays low because imported pricing exceeds what most households will pay. Local manufacturing and smaller pack formats remove both of those barriers simultaneously. Participants who built regional capacity report landed cost falling roughly 34%, which brings branded accessories inside household budgets that previously excluded them entirely, and every other market in this category is contracting anyway.

Engagement Snapshot From the Field

A live engagement with an industry participant carrying material or product regulatory and market exposure ahead of a defining policy shift, showing how our research translates into a defensible multi-year portfolio strategy.
MARKET MINDS ADVISORY · CLIENT ENGAGEMENT SUMMARY
Baby Feeding Accessories Producer Strategic Portfolio Review and Transition Roadmap 2026·Investment Scenario on Baby Feeding Accessories Exposure Evaluation 2025-26
CLIENT PROFILE
A juvenile products manufacturer with feeding accessory revenue near USD 190 million (client-reported, unverified by MMA), weighted approximately 58% to bottles and sterilisers, 24% to textiles and 18% to teats and replacement parts. No subscription existed. Registry listings covered two of five served markets and teat flow rates were never published anywhere. Replacement purchasing had never been measured.
STRATEGIC CHALLENGE
Revenue had been flat for three years while management attributed the position to falling birth rates across its principal markets. A price increase across the bottle range had been approved. Nobody had examined replacement purchase rates in the installed base, or why customers acquired through registry churned at different rates from those acquired directly.
MMA APPROACH
MMA measured actual teat replacement purchasing across 24 months of linked customer records rather than relying on stated intention. Flow rates were tested across the client's range and eight competitor ranges at matched stage labels. Churn was analysed by acquisition route, and registry placement was mapped against first-purchase share in each served market.
KEY FINDINGS
  1. Teat replacement purchasing averaged 1.4 units per bottle sold against a guidance-implied six, leaving roughly USD 47 million of consumable revenue unclaimed in the installed base annually.
  2. Measured flow at the client's stage two teat ran 2.9 times faster than a competitor's stage two, and switching complaints concentrated entirely on households moving between those two brands.
  3. Registry-acquired households churned at 2.4 times the rate of directly acquired ones, because no purchase decision had been made and the first difficulty prompted a switch.
  4. The three markets without registry listings delivered first-purchase share roughly half that of the two with them, at identical retail distribution. and comparable retail spend behind them.
CLIENT PROFILE
A juvenile products manufacturer with feeding accessory revenue near USD 190 million (client-reported, unverified by MMA), weighted approximately 58% to bottles and sterilisers, 24% to textiles and 18% to teats and replacement parts. No subscription existed. Registry listings covered two of five served markets and teat flow rates were never published anywhere. Replacement purchasing had never been measured.
STRATEGIC CHALLENGE
Revenue had been flat for three years while management attributed the position to falling birth rates across its principal markets. A price increase across the bottle range had been approved. Nobody had examined replacement purchase rates in the installed base, or why customers acquired through registry churned at different rates from those acquired directly.
MMA APPROACH
MMA measured actual teat replacement purchasing across 24 months of linked customer records rather than relying on stated intention. Flow rates were tested across the client's range and eight competitor ranges at matched stage labels. Churn was analysed by acquisition route, and registry placement was mapped against first-purchase share in each served market.
KEY FINDINGS
  1. Teat replacement purchasing averaged 1.4 units per bottle sold against a guidance-implied six, leaving roughly USD 47 million of consumable revenue unclaimed in the installed base annually.
  2. Measured flow at the client's stage two teat ran 2.9 times faster than a competitor's stage two, and switching complaints concentrated entirely on households moving between those two brands.
  3. Registry-acquired households churned at 2.4 times the rate of directly acquired ones, because no purchase decision had been made and the first difficulty prompted a switch.
  4. The three markets without registry listings delivered first-purchase share roughly half that of the two with them, at identical retail distribution. and comparable retail spend behind them.
RECOMMENDED STRATEGY
Phase 1: Phase one: cancel the bottle price increase and publish measured flow rates across the entire teat range immediately. The test protocol already existed. Phase 2: Phase two: attach a teat replacement subscription at every bottle purchase across direct and retail channels. No product reformulation is required at all. Phase 3: Phase three: secure registry listings in the three uncovered markets and redesign gift-format starter packs. Gift packs carry the published flow data.
OUTCOME
Consumable revenue rose by roughly two thirds within four quarters as subscription attached to new and existing households (client-reported, unverified by MMA). Switching complaints fell sharply once flow rates were published, and first-purchase share in the newly listed registry markets approached the level of the established two within a year.

Frequently Asked Questions

Foundational context covering the market sizes, CAGR, scope, country, region and competition that inform every finding below. This section is provided to cover basics and most often pre-purchase conversations, answered from the MMA Primary Research Dataset.

What is the current size of the Baby Feeding Accessories Market?

The market was valued at USD 6.8 billion in 2025, rising to USD 7.2 billion in 2026. Sizing is at manufacturer net revenue across six product types.

How large will the Baby Feeding Accessories Market be by 2036?

MMA forecasts USD 12.2 billion by 2036, an increase of USD 5.0 billion over the 2026 base. That represents expansion of 1.69 times across the forecast period.

What is the CAGR for the Baby Feeding Accessories Market 2026 to 2036?

The base case CAGR is 5.4%, with a bull case of 6.6% and a bear case of 4.2%. Historical growth between 2020 and 2025 ran at 4.3%.

Which segment is growing fastest?

Silicone teats and replacement parts grow at 8.1%, half again the market rate, as the only genuinely consumable line. Breast pump accessories follow at 7.2%.

Who are the major companies in the Baby Feeding Accessories Market?

Koninklijke Philips, Pigeon Corporation, Mayborn Group, Artsana Group and Handi-Craft lead on net revenue, holding a combined 46%. Registry and retail placement rather than product separates them.

Which country is growing fastest?

India grows fastest at 8.2%, combining the largest birth cohort in the world with organised retail reaching well beyond the metropolitan markets for the first time.

Report Segmentation Architecture

The full report scope spans multiple orthogonal segmentation dimensions, with cross-tabulated demand data provided for each dimension pair. Coverage extends further to regional breakdowns, trend trajectories, and the competitive detail needed to support segment-level decision-making.

By Product Type

  • Feeding Bottles and Bottle Systems
  • Silicone Teats and Replacement Parts
  • Breast Pump Accessories and Milk Storage
  • Sterilisers and Cleaning Equipment
  • Weaning and Transition Feeding Sets
  • Bibs, Mats and Feeding Textiles

By End-Use Stage

  • Newborn and Early Infant Feeding
  • Established Bottle Feeding
  • Expressed Milk and Workplace Use
  • Weaning and Solids Transition
  • Toddler Cup and Self Feeding
  • Hospital and Neonatal Supply

By Commercial Dimension

  • Baby Specialist Retail
  • Grocery and Mass Retail
  • Pharmacy and Drug Channel
  • Registry and Gift Platforms
  • Brand Direct and Subscription
  • Marketplace and E-Commerce

By Region

  • East Asia
  • North America
  • Western Europe
  • South Asia and Pacific
  • Latin America
  • Middle East and Africa
  • Eastern Europe

Scope, Methodology, and Coverage

Every figure in this report is reproducible from documented input assumptions. The scope below maps the historical period, the forecast horizon, the segmentation dimensions, and the countries covered, alongside the underlying primary and qualitative methodology.
Historical Period
2020 to 2025
Forecast Period
2026 to 2036
Base Year
2025 (USD billions; MMA Primary Research Dataset, September 2026)
Market Definition
This market covers accessories and consumables for infant and toddler feeding, spanning feeding bottles and bottle systems, silicone teats and replacement parts, breast pump accessories and milk storage, sterilisers and cleaning equipment, weaning and transition feeding sets, and bibs, mats and feeding textiles. Sizing is at manufacturer net revenue across specialist, grocery, pharmacy, registry, direct subscription and marketplace channels. Infant formula and baby food, breast pumps themselves, highchairs and nursery furniture, and nursing apparel are excluded from scope throughout this report.
Quantitative Units
USD billions at manufacturer net revenue; volume in millions of units shipped; flow rate in millilitres per minute.
Segmentation Dimensions
Product type, end-use stage, commercial dimension, and geographic region.
Regions Covered
East Asia, North America, Western Europe, South Asia and Pacific, Latin America, Middle East and Africa, Eastern Europe
Countries Covered
China, India, United States, Japan, Germany, Brazil
Key Companies Profiled
Koninklijke Philips, Pigeon Corporation, Mayborn Group, Artsana Group, Handi-Craft Company, Medela, Lansinoh, Newell Brands, MAM Babyartikel, Nuby, Munchkin, Bibs Denmark, Hegen, Comotomo, Elvie, Willow Innovations, Richell, Combi Corporation, Goodbaby International, Luvlap
Quantitative Methodology
Primary survey, n=3,800 respondents, Q4 2025, six countries; demand-side model with trade association cross-validation
Qualitative Methodology
47 expert interviews, Q4 2025; applied to validate demand model assumptions, identify emerging dynamics, and assess competitive positioning
Report Format
PDF and XLSX data workbook (Word format preview document)
Publisher
Market Minds Advisory
Report Code
MMA-2026-HLT-809
Published
September 2026
Contact
sales@marketmindsadvisory.com | www.marketmindsadvisory.com

Purchase the full Baby Feeding Accessories Market Report (2026 to 2036).

The full report sizes the baby feeding accessories market across six product types, six end-use stages and six commercial dimensions for all seven global regions through 2036. It measures actual teat replacement purchasing through linked customer records rather than relying on stated intention or manufacturer guidance. Flow rates are tested across competing ranges at matched stage labels to establish the real spread. Churn is analysed by acquisition route, separating registry-gifted households from those that chose directly. Competitive assessment covers 20 participants on a consistent manufacturer net revenue basis.
Teat replacement purchasing measured through linked customer records
Flow rates tested across competing ranges at matched stages
Churn analysed by registry versus direct acquisition route
Birth cohort contraction modelled against per-infant spending
Six product types sized through 2036
Twenty participants assessed on manufacturer net revenue

Built For The People Who Decide

From boardroom strategy to bench-side execution, this report is read cover-to-cover by leaders shaping the next decade of their industry, turning demand scenarios, market dynamics and valuation benchmarks into decisions.
CXOs/ Presidents/ VPs/ Managers
M&A and Corporate Development
Strategy Teams and R&D Heads
Procurement and Product Directors
Regulatory and Compliance Leaders
Investor Relations and Equity Analysts