Market Minds Advisory
Baby Diaper Market

Baby Diaper Market: Baby Diaper Market: Falling Birth Rates, The Pants Conversion and Where Fluff Pulp Actually Comes From

Births are falling in every market that pays the most per diaper, and manufacturers are holding revenue by selling fewer units at higher prices to a smaller number of babies.

Lead Analyst

Published

September 2026

Make Smarter Decisions with Customized Research Insights

Request a free sample report and evaluate market opportunities, growth trends, and competitive dynamics relevant to your business needs.

2025 MARKET VALUE$57.0BMarket Size 2025
2036 FORECAST VALUE$89.6BBase Case , 2026 to 2036
CAGR 2026 TO 20364.2 %Bull 5.4% / Bear 3.0%
INCREMENTAL OPPORTUNITY$30.2BNet 10- year value creation
EXPANSION MULTIPLE1.51x2036 value over 2026 base
Strategic Levers
M&A Pipeline
Regional Outlook
Country Rankings
Competitive Intelligence
Segmental Deep-dive
Call-Us : 91 93563 13602

Executive Snapshot and Market Trajectory.

Fewer babies are being born in almost every market that pays well for diapers. Manufacturers have held revenue anyway by moving parents up price tiers faster than the birth cohort shrinks, which works until it does not. Nobody has a plan for the point where the tiers run out.
Training pants and pull-ons grow at 6.3%, half again the market rate of 4.2%, because they carry higher prices, convert taped-diaper users at a predictable age, and extend the period a child stays in the category. Premium taped diapers follow at 5.1%. Economy taped diapers grow slowest at 1.4%, losing volume to private label and to trade-up together. Both movements pull in the same direction at once.
Fluff pulp is the input nobody thinks about and it decides this industry's margins. Roughly 34% of material cost is bleached softwood pulp from a small number of North American and Nordic mills, and price moves there pass through to a product parents buy weekly. Concentration is high at 63% held by the top five, and Nigeria is growing fastest at 8.9%. Volume growth exists only where unit prices are lowest anywhere.
Market Definition
This market covers disposable absorbent products for infants and toddlers, spanning premium taped diapers, mid-tier taped diapers, economy taped diapers, training pants and pull-ons, swim pants, and cloth and reusable systems. Sizing is at manufacturer net revenue. Adult incontinence products, feminine hygiene, baby wipes, nappy creams and disposal systems are excluded from scope.
Base Year Value
$57.0B in 2025 (MMA Primary Research Dataset, September 2026)
Forecast Period
2026 to 2036, eleven discrete annual values
CAGR
4.2% base case. Bull 5.4%. Bear 3.0%.
Fastest Growth Segment
Training Pants And Pull-Ons: 6.3% CAGR
Fastest Growth Country
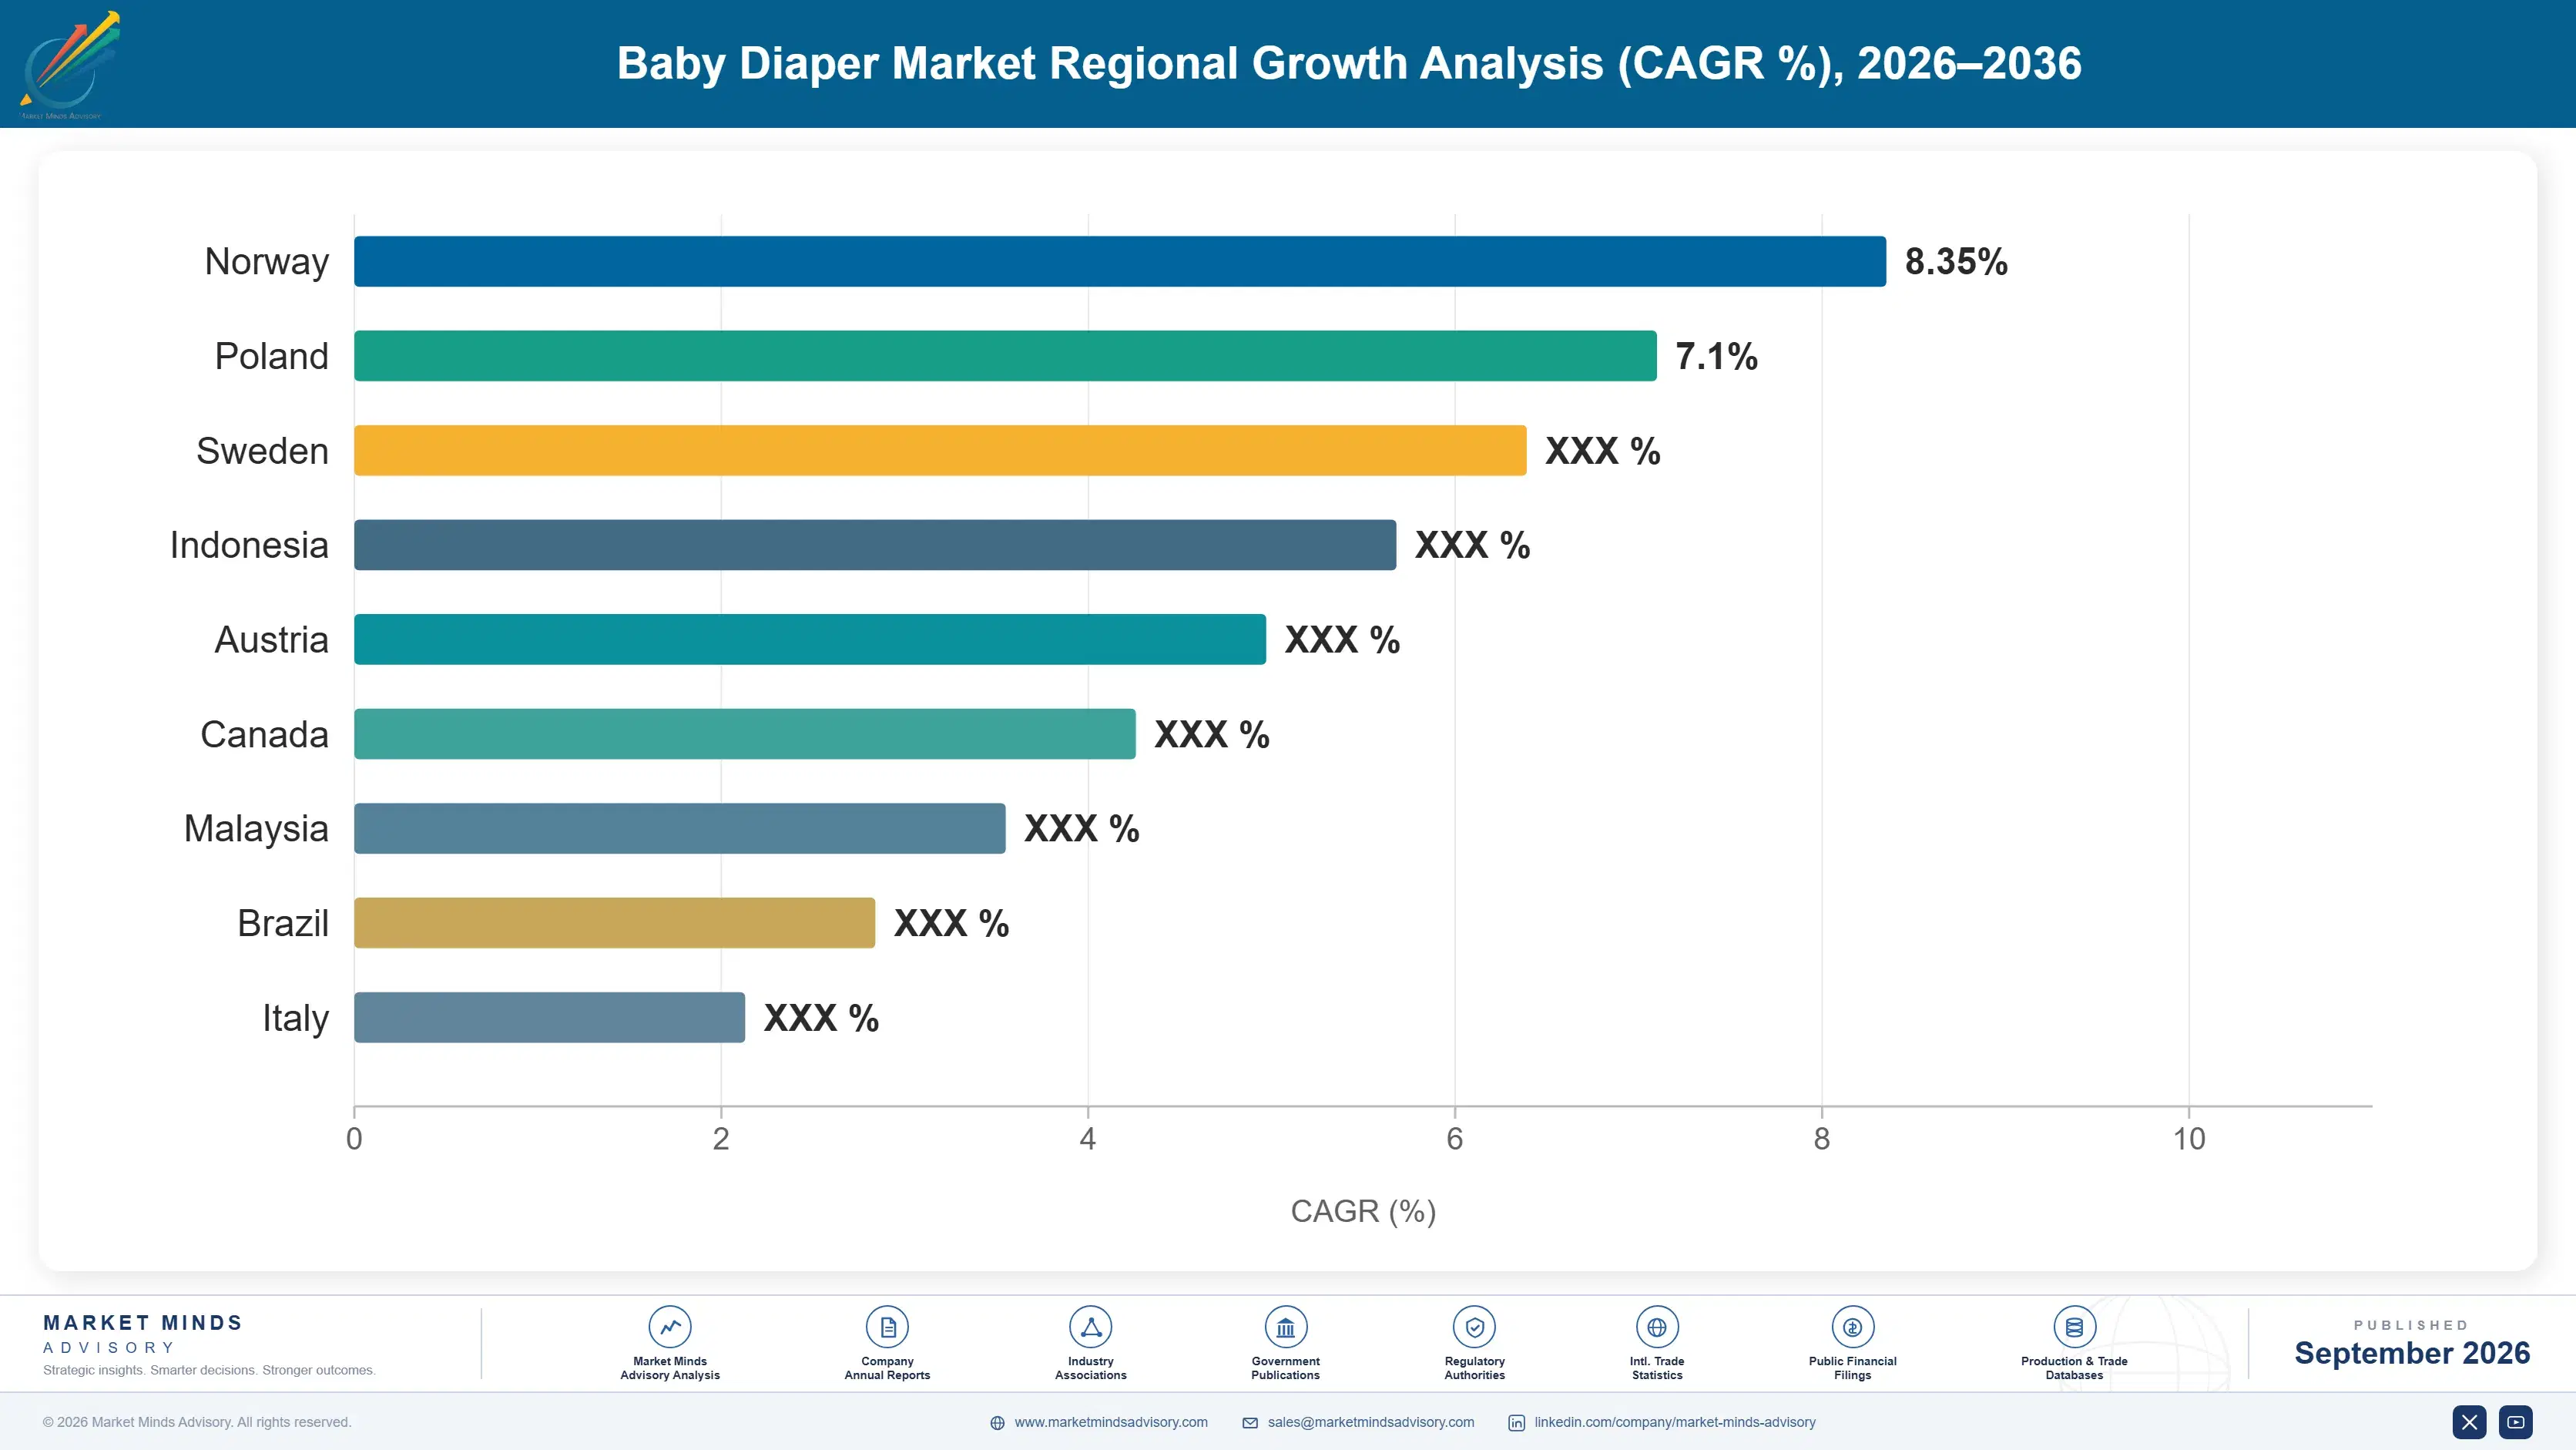
Nigeria: 8.9% CAGR
Fastest Growth Region
South Asia and Pacific: 6.2% CAGR
Largest Region
East Asia: 31% of 2025 global value
Market Leaders
Procter and Gamble, Kimberly-Clark, Unicharm, Essity, Ontex Group. Source: MMA Primary Research Dataset, July 2026.
Primary Survey
n=3,800 procurement and R&D decision-makers, Q4 2025, six countries
Methodology
Demand-side build-up, cross-validated against public data, 47 expert interviews

Baby Diaper Market Forecast Scenarios

baby-diaper-market-share-analysis-size-forecast-scenario-1790023889351
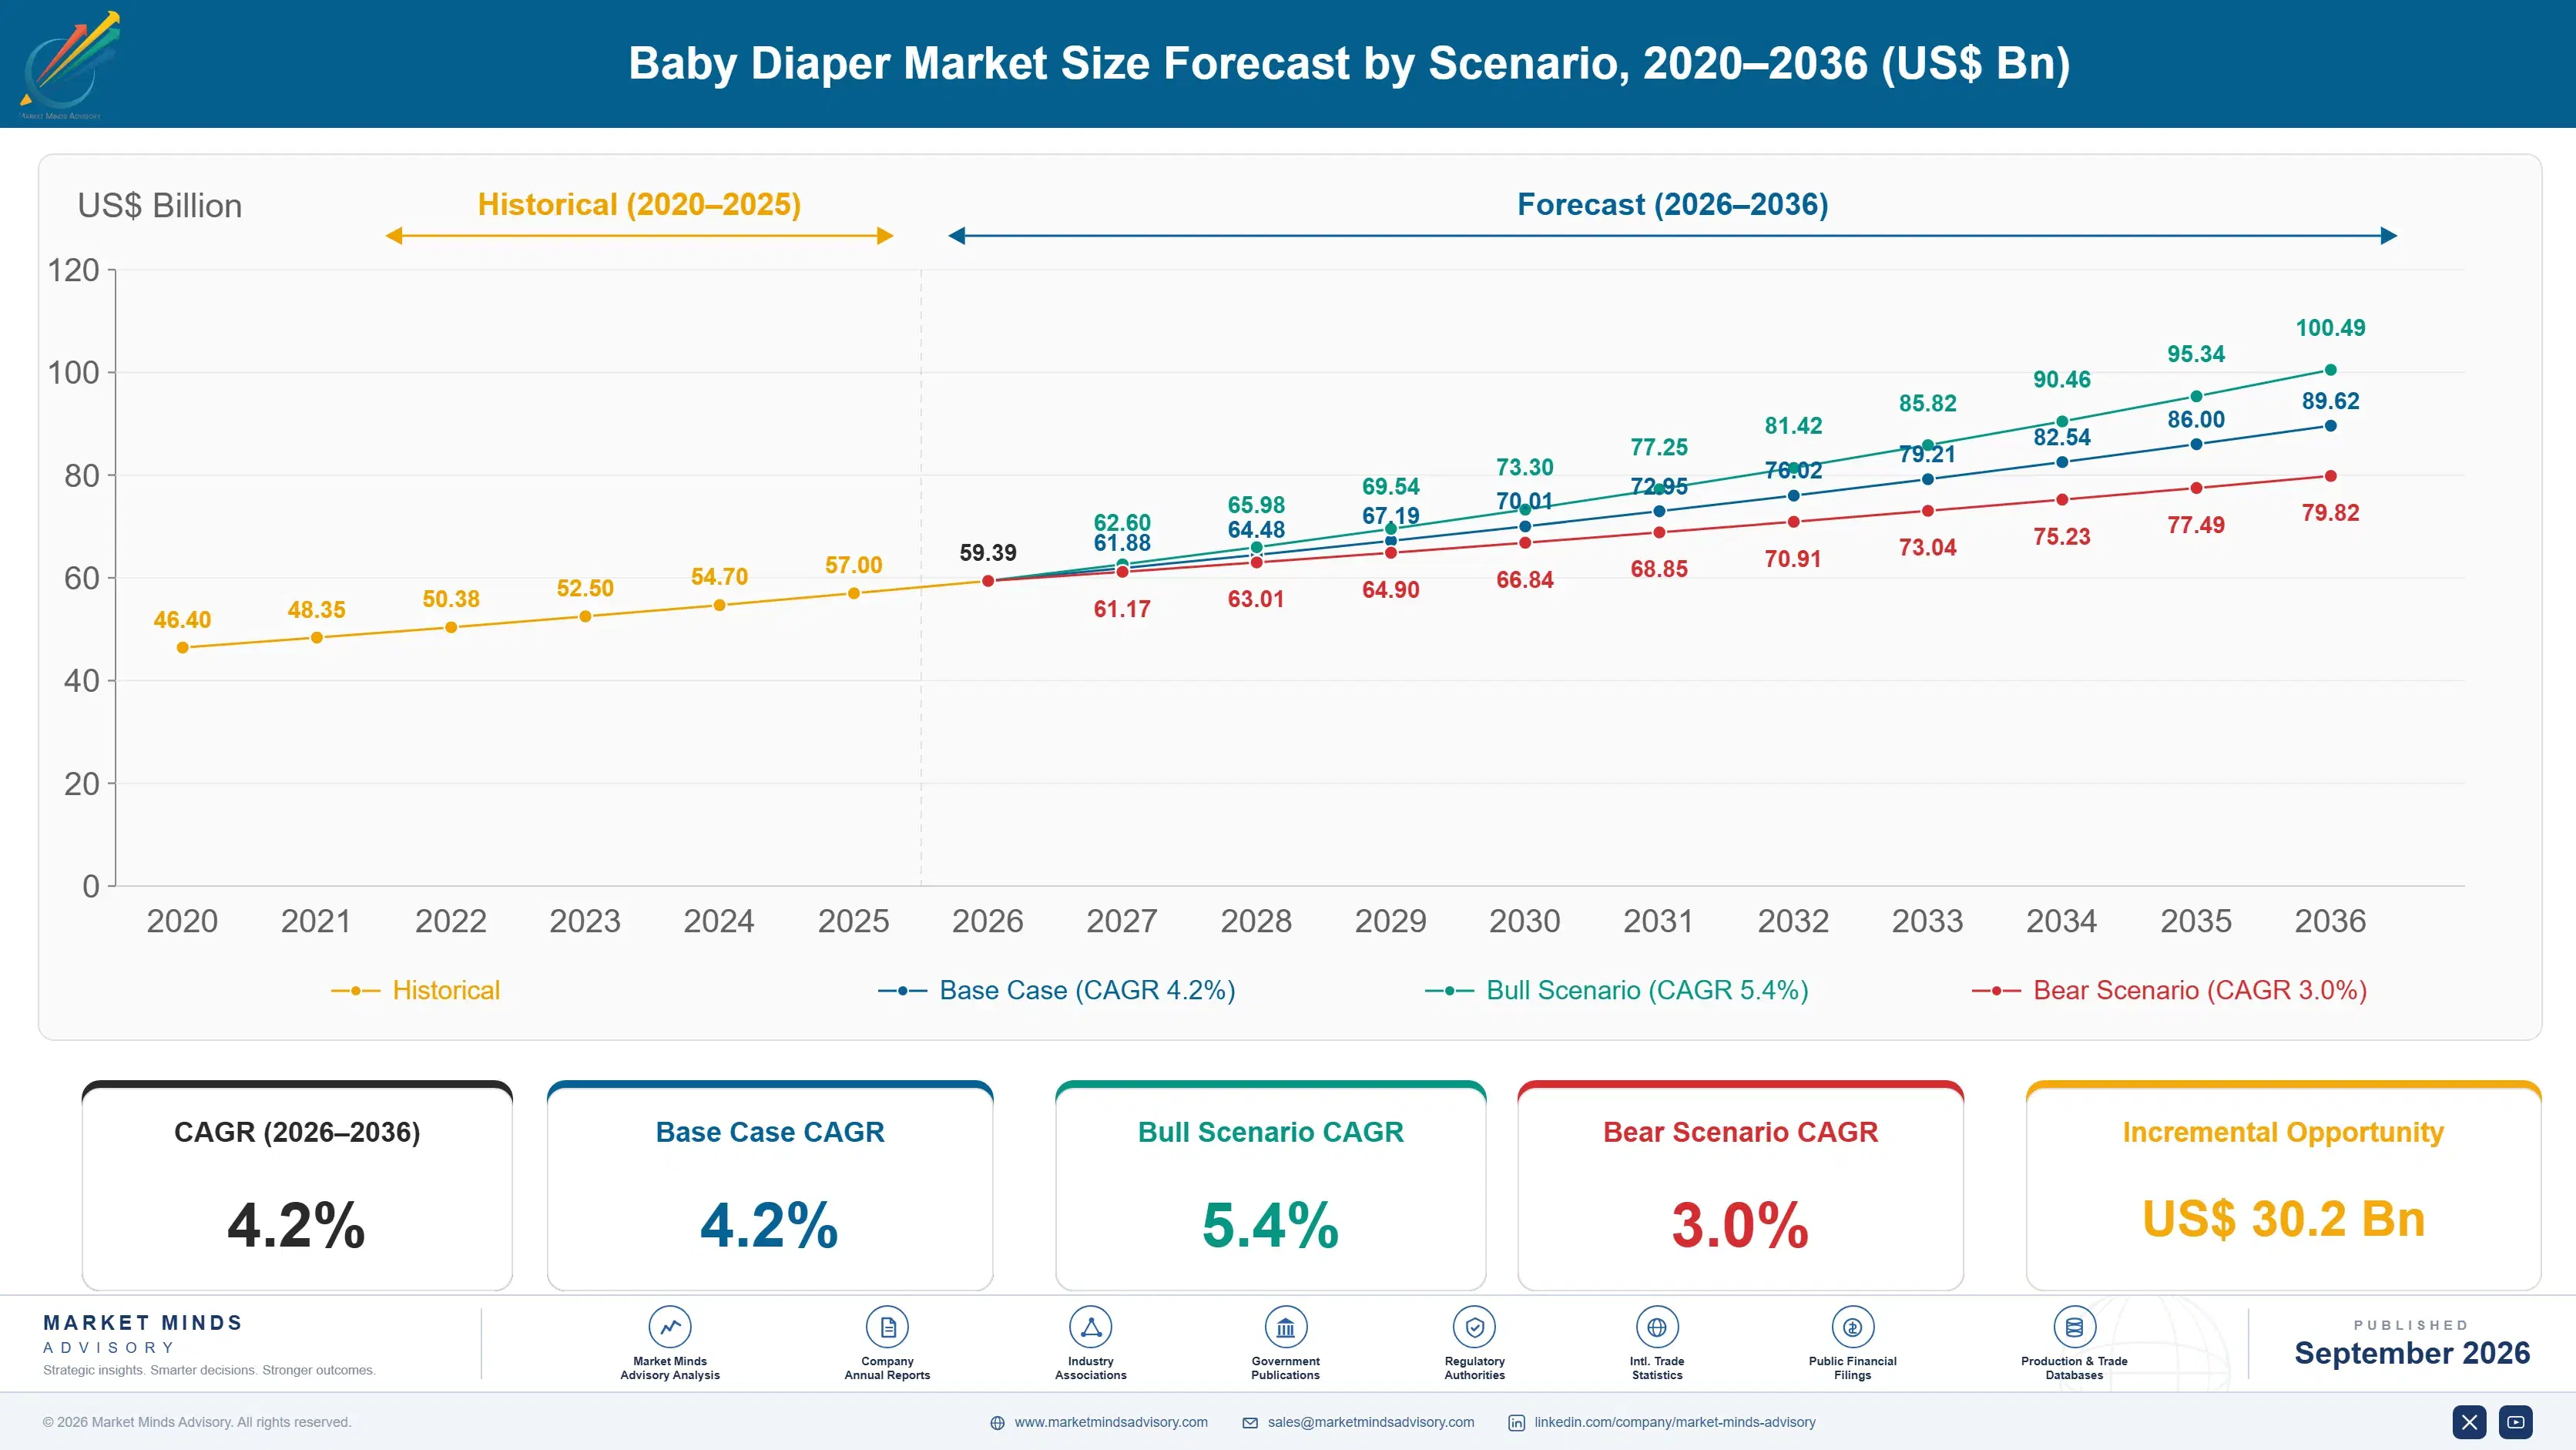
Growth of 3.2% between 2020 and 2025 was almost entirely price rather than volume. Pulp, superabsorbent polymer and polypropylene costs all rose sharply through 2021 and 2022, and manufacturers took price across every tier to recover it. Unit volumes fell in most developed markets as birth cohorts contracted, and the two movements offset each other closely enough that headline revenue looked stable.
Three mechanisms carry the base case forward. Training pants grow at 6.3% on higher prices and a conversion that happens at a predictable age in every market. African demand expands quickly, with Nigeria at 8.9% as disposable penetration rises from a genuinely low base. Premiumisation continues in Asia, where Chinese and Indian parents trade up faster than their birth cohorts shrink, which is the arithmetic holding this category together. None requires any change in consumer behaviour.
The bull case is African penetration accelerating. Disposable use across Sub-Saharan Africa remains low and local manufacturing is expanding, which removes the import cost that has kept prices out of reach. The bear case is birth rates falling faster than trade-up can compensate. Korean, Japanese, Chinese and Italian cohorts are contracting at rates that no premiumisation strategy can outrun indefinitely.

Fewer Babies, Higher Prices

This is a category where the customer base is contracting by arithmetic rather than by preference. Birth numbers are falling across Japan, Korea, China, Italy and increasingly the United States, and every one of those markets pays well above the global average per unit. Manufacturers have answered by moving parents up tiers and into pants formats faster than the cohorts shrink. That works while there is a tier above the one a parent currently buys.
TOP FIVE CONCENTRATION63%Combined net revenue share held by the five largest manufacturers
FLUFF PULP COST SHARE34%Portion of material cost accounted for by bleached softwood pulp
AVERAGE UNIT PRICEUSD 0.28Weighted manufacturer price for a single taped diaper globally
DAILY CHANGE FREQUENCY6 changesAverage number of diapers used per infant each day
PRIVATE LABEL SHARE24%Portion of volume sold under retailer rather than manufacturer brands
PANTS FORMAT SHARE31%Share of category volume in pull-on rather than taped formats
Fluff pulp is the input that decides margins and almost nobody outside the industry has heard of it. Bleached softwood pulp accounts for roughly 34% of material cost, comes from a small number of mills in North America and the Nordics, and prices on a global commodity market that responds to conditions entirely unrelated to babies. Superabsorbent polymer and polypropylene add most of the rest, both petrochemical derived.
Private label now takes about 24% of volume and it behaves differently than in most categories. Parents trust retailer brands here more readily than they do in food, partly because the performance gap has genuinely narrowed and partly because the purchase repeats weekly enough for a mistake to be cheap.
"This industry has spent fifteen years getting better at selling more expensive diapers to a shrinking number of babies, and it has been remarkably good at it. The question nobody answers is what happens when the last tier runs out."
Director, Personal Care and Hygiene Practice · MMA Personal Care and Hygiene Practice · September 2026

Market Trends

Pants Formats Convert Parents At A Predictable Age

Training pants and pull-ons now take around 31% of category volume and grow at 6.3% against 4.2% overall, because the conversion happens at roughly the same developmental point in every market. A child who begins walking makes taped changes difficult, and parents move formats without needing persuasion. Pants carry higher prices for similar material content, and they extend the period a child remains in the category at all. Manufacturers have responded by lowering the entry age at which pants are marketed. Bringing that conversion forward by a few months is worth real money per child.
Market Impact: Nigeria grows at 8.9% annually

Private Label Takes Share Without Damaging Category Value

Retailer brands hold about 24% of volume and the performance gap against branded product has narrowed considerably, particularly on absorbency and leakage where the technology is now widely available to contract manufacturers. Parents accept private label here more readily than in most categories, since the purchase repeats weekly and a disappointing pack costs little to abandon. What is unusual is that private label growth has not compressed category value, because the same parents trade up on pants and premium tiers simultaneously. Retailers now price their own brand against mid-tier rather than economy, which is where the damage lands.
Market Impact: Premium tier grows 0.9 points faster

Market Opportunities and Growth Drivers

African Disposable Penetration Rises From A Low Base

Nigeria grows fastest of any country covered at 8.9%, and Sub-Saharan penetration of disposable products remains well below global levels, which leaves genuine volume headroom in a category with very little of it elsewhere. Local manufacturing capacity is expanding across Nigeria, Kenya, Egypt and South Africa, and domestic production removes the import duty and freight that kept unit prices above what most households would pay. Smaller count packs matched to weekly cash budgets have proved decisive for adoption. A 16-unit pack converts households a promotion on a 44-unit pack never reaches. The format decision matters more than the product one.
Market Impact: Japan cohort falls below 700,000

Asian Premiumisation Outpaces Shrinking Birth Cohorts

Chinese and Indian parents are trading up through tiers faster than their birth numbers contract, which is the arithmetic currently holding category revenue together across the region. Chinese premium penetration has risen sharply as single-child households concentrate spending, and Japanese and Korean parents already sit at the top of the global price range. Indian growth carries both effects at once, with penetration and tier both rising. Manufacturers have added premium variants specifically for these markets rather than exporting Western ranges. Indian demand carries penetration and tier growth together, which is rare and makes it the region's most valuable position.
Market Impact: Pulp is 34% of material cost

Market Restraints and Challenges

Birth Numbers Fall Fastest Where Prices Are Highest

Korean, Japanese, Chinese and Italian birth cohorts are contracting at rates that premiumisation can offset for a period but not indefinitely, and every one of those markets pays well above the global average per unit. The root cause is demographic rather than commercial and nothing a manufacturer does affects it. Commercially it means volume decline concentrated precisely where value sits. Participants responding are building African and South Asian positions now rather than waiting for the developed market arithmetic to break. The developed market arithmetic works for perhaps another decade on current trends.
Market Impact: Pants reach 31% of volume

Fluff Pulp Pricing Sits Outside Anybody's Control

Bleached softwood pulp is roughly 34% of material cost and trades on a global commodity market driven by paper demand, mill outages and shipping conditions that have nothing to do with this category at all. The root cause is concentration: a limited number of mills in North America and the Nordics supply most of it. Commercially it means input cost moves independently of anything a manufacturer plans. Mitigation runs to pulp reduction through higher polymer loading, contracted supply and dual sourcing. Each of the three trades one exposure for another rather than removing it.
Market Impact: Private label holds 24% of volume
3 additional market trends, 4 additional growth drivers, and 2 additional restraints and challenges are covered in the full report. Contact sales@marketmindsadvisory.com to access the complete intelligence.

Segment CAGR and Growth Architecture

Segmentation follows product tier and format, the dimension on which price realisation, material content, conversion age and retailer treatment all divide together. Six categories are assessed at manufacturer net revenue. Adult incontinence, feminine hygiene, baby wipes, creams and disposal systems sit outside the defined scope throughout this report. Material content varies far less across the six than price does.
baby-diaper-market-share-analysis-market-share-analysis-1790023889914

Training Pants And Pull-Ons

Training pants and pull-ons grow at 6.3%, half again the market rate of 4.2%, and take around 31% of volume on a conversion that happens at a predictable developmental point rather than through persuasion. A child who begins walking makes taped changes genuinely difficult, and parents switch format without needing a campaign to tell them. Pants carry noticeably higher prices for similar material content, which is the commercial attraction, and they extend the period a child remains in the category before toilet training completes. Manufacturers have responded by marketing pants at progressively lower entry ages across most markets. It is the cleanest set of economics available anywhere in this whole category.
CAGR 6.3%

Premium Taped Diapers

Premium taped diapers grow at 5.1% on trade-up rather than on volume, which is the pattern across every developed market in this category. Thinner cores with higher polymer loading, skin-contact materials and indicator technology justify prices well above mid-tier, and parents concentrating spending on fewer children accept them readily. Chinese premium penetration has risen particularly sharply for exactly that reason. The commercial risk is that the performance gap to mid-tier is narrowing as core technology diffuses to contract manufacturers, which means the premium increasingly rests on packaging, softness and brand rather than on measurable absorbency difference. That is a weaker position than measurable superiority, and it is the direction the tier is travelling in every developed market.
CAGR 5.1%
Full segment breakdown across 6 segments available in the complete report.

Regional Architecture and Country Demand Map

Shares record where diapers are sold rather than where pulp or polymer originate. East Asia sits above its standard band on population and premium pricing together, and Middle East and Africa above on penetration rising from a low base. Both deviations carry a stated reason in the paragraph concerned.

East Asia

At 31% this sits above the standard band, carried by population scale and by per-unit prices among the highest anywhere. Japanese and Korean parents pay more per diaper than any other market, and Unicharm built a global position on products developed for those expectations. Chinese demand has premiumised rapidly as single-child households concentrate spending, offsetting birth cohorts that are contracting sharply. Growth of 4.9% depends entirely on trade-up outrunning demographics, and that arithmetic has a limit that is now visible in Korean and Japanese volumes. Korean volumes have already begun falling in a way premiumisation cannot offset, and Japan is close behind. Hengan and Daio hold meaningful domestic positions against the global majors across the region.
Share: 31% | CAGR: 4.9% (2026 to 2036)

North America

The 22% position sits inside the standard band and this is where private label has advanced furthest. Retailer brands hold a substantially higher share here than the global average, helped by large-format retail and by parents who treat a weekly repeat purchase as low risk. Births have declined for most of the past decade, so revenue growth of 3.3% comes from price and from pants conversion rather than from any volume expansion. Subscription and online replenishment channels have grown considerably faster than store-based sales. A household on subscription switches brands far less often than one choosing from a shelf each week, which makes the first repeat purchase disproportionately valuable. Canadian demand behaves identically at smaller scale.
Share: 22% | CAGR: 3.3% (2026 to 2036)
Regional intelligence for 5 additional markets available in the complete report: Western Europe, South Asia and Pacific, Latin America, Middle East and Africa, Eastern Europe. Contact sales@marketmindsadvisory.com.
baby-diaper-market-share-analysis-country-cagr-analysis-1790023890485

Four Moves Worth Making Now

These four address a category where the customer base shrinks by arithmetic, the growth sits in markets that pay least per unit, and the largest input cost responds to a commodity market with no connection to babies. Each has been executed by at least one manufacturer with measured results. Two of the four cost nothing beyond a marketing decision.

Lower The Entry Age For Pants Marketing

Pants take around 31% of volume, grow at 6.3% and carry higher prices for similar material content, and the conversion happens when a child starts walking rather than when a campaign runs. Marketing pants from an earlier developmental point brings that revenue forward by months per child. Manufacturers who moved entry-age messaging earlier report pants mix rising roughly 9 points within two years, which lifts realised price per unit across the whole portfolio without any change to the product. The developmental evidence supports going earlier than most brands currently do. Nothing about the product needs to change at all.
Market Impact: Pants mix rises by roughly 9 points overall

Reduce Pulp Loading Through Higher Polymer Content

Fluff pulp is about 34% of material cost and prices on a commodity market nobody in this category influences. Thinner cores using more superabsorbent polymer and less pulp cut that exposure directly while also reducing pack size, which lowers freight and shelf space at the same time. Manufacturers who reformulated report pulp cost share falling toward 24% with no measurable performance loss, and the thinner product tests better with parents on comfort. The trade is greater petrochemical exposure, which moves on a different cycle and rarely at the same time. Holding both exposures is safer than holding either alone.
Market Impact: Pulp cost share falls toward 24% of materials

Build African Manufacturing Before Penetration Rises

Sub-Saharan penetration is well below global levels and Nigeria grows at 8.9%, but imported product carries duty and freight that put prices beyond most household budgets. Local manufacturing removes both. Participants who built regional capacity report landed cost falling by roughly 31%, which lets them sell small count packs matched to weekly cash budgets. That pack format rather than the product itself is what converts households into regular users at this stage. Regional plants need volume to justify their fixed cost, so the investment precedes the demand rather than following it. That timing is the real decision.
Market Impact: Regional landed cost falls by roughly 31% overall

Match Pack Counts To Household Cash Cycles

Large packs are cheaper per unit and unaffordable for households budgeting weekly, which excludes exactly the users penetration growth depends on. Small counts priced against a weekly cash outlay convert non-users where a value-per-diaper argument does not. Manufacturers who introduced small packs in emerging markets report new user acquisition rising roughly 2.4 times against equivalent price promotions on large packs, at a modest cost in packaging efficiency per unit sold. The efficiency loss is small against a conversion effect that price promotion has never produced in the same territories. Large packs stay for established users.
Market Impact: New user acquisition rises roughly 2.4 times higher

Who Controls the Margin Pool

Concentration is high at 63% held by the top five, measured consistently on manufacturer net revenue rather than on unit volume, which would overweight economy and private label supply. The leader to challenger gap is wide and it rests on distribution and manufacturing scale rather than on technology, since core absorbency capability has diffused to contract manufacturers serving retailer brands competently.
Competition runs on three dimensions currently. Retailer relationships decide shelf position, and in a weekly repeat purchase shelf position is close to decisive. Product technology decides premium tier defensibility, though the gap there is narrowing as cores improve across the board. Cost position decides the value tiers, where private label competes directly and manufacturing scale is the only durable answer available to a branded participant.

Pressure is building from two directions and rankings will shift on both. Private label continues taking volume with performance that increasingly matches branded mid-tier, which compresses the tier where most units actually sit. Regional manufacturers in Africa and South Asia are building positions in the only markets adding users, and they start with cost structures and pack formats that global participants have to retrofit rather than assume.
baby-diaper-market-share-analysis-company-positioning-matrix-1790023891008

Competitive Moat and Risk Dimensions

PROCTER AND GAMBLE

Moat: Global Scale And Distribution

Manufacturing scale across multiple continents combined with retailer relationships built over decades produces unit costs and shelf access that no regional competitor matches, and in a weekly repeat purchase that shelf position compounds because habit forms around what is reliably available. New entrants start from neither position.
PROCTER AND GAMBLE

Risk: Developed Market Cohort Exposure

Revenue weighted toward North America, Western Europe and East Asia sits precisely where birth numbers are falling fastest and where private label has advanced furthest. Building offsetting positions in Africa and South Asia requires cost structures and pack formats that a premium-oriented operation has to learn rather than assume.
UNICHARM

Moat: Asian Premium Product Development

Products developed against Japanese and Korean expectations, which are the most demanding in the category, transfer readily into Chinese and Southeast Asian premiumisation as those markets trade up. That gives a technology and positioning advantage precisely where the trade-up growth is actually occurring. The transfer runs one direction only.
UNICHARM

Risk: Japanese Domestic Volume Decline

A substantial home market position sits in the fastest-contracting birth cohort of any developed country, where premiumisation has largely run its course because parents already pay near the top of the global range. Growth must come from export markets where competition is considerably more intense.

Players Tracked

Prominent Players

Procter and Gamble
Kimberly-Clark
Unicharm
Essity
Ontex Group

Other Key Players

Hengan International
Daio Paper
Oji Holdings
Domtar Personal Care
First Quality Enterprises
Fippi
Nobel Hygiene
Millennium Babycares
Hayat Kimya
Sanita
Bella Baby Happy
DSG International
Softcare Group
Nepia
Diapex

Recent Developments

APRIL 2025

Hayat Kimya expands African manufacturing capacity in Nigeria

The manufacturer added production lines at its Nigerian facility to serve West African demand from local capacity rather than through import. This was organic capital investment funded internally, with no acquisition, joint venture or contract manufacturing arrangement involved anywhere. Existing import supply continued during the capacity ramp.
Signal: Local production is what makes affordable pack formats possible in these markets. Affordability follows manufacturing location rather than pricing policy.
SEPTEMBER 2024

Unicharm launches thinner core premium range in China

The company introduced a reformulated premium range using higher polymer loading and reduced pulp content across Chinese distribution. This was an organic product launch developed internally, with no licensing arrangement, partnership or acquisition behind the reformulation work. The previous formulation remains available in other markets.
Signal: Pulp reduction serves cost exposure and consumer comfort preference at once. Both point the same way.
JANUARY 2025

Ontex Group divests Latin American operations to regional buyer

The company completed the sale of its Latin American business to a regional operator, concentrating its portfolio on European and North American markets. This was a completed divestiture rather than a merger, joint venture or minority stake transaction of any kind. Manufacturing in the region transferred with the business.
Signal: European participants are narrowing while growth sits elsewhere. Narrowing toward contracting markets is defensible but limited.

What Goes Into A Diaper

Materials dominate and three of them account for most of it. Bleached softwood fluff pulp runs roughly 34% of material cost, superabsorbent polymer around 27%, and polypropylene nonwovens about 19%. Adhesives, elastics and packaging take the remainder. Pulp comes from a small number of North American and Nordic mills; polymer and nonwovens are petrochemical derived and follow crude and naphtha pricing closely.
Fluff pulp prices rose sharply through 2021 and into 2022 on mill outages and shipping disruption, while polymer and polypropylene climbed on energy and feedstock costs in the same window, a movement the EIA documents across its petrochemical feedstock reporting for the period. Kimberly-Clark and Essity both identified material inflation across personal care as requiring pricing action in their disclosures for that year. Both movements landed inside a single twelve month window.

Exposure divides by core formulation and by manufacturing location rather than by company size. Manufacturers running pulp-heavy cores carry the greatest commodity exposure, while those using thinner high-polymer designs trade pulp risk for petrochemical risk. Producers manufacturing close to their markets avoid the freight that dominates landed cost on a bulky low-value product, which is why African local production changes affordability so substantially.
baby-diaper-market-share-analysis-cost-volatility-analysis-1790023891206

Reformulate cores toward higher polymer and lower pulp

Pulp is the largest single material cost and moves on a commodity market driven by paper demand rather than by anything in this category. Higher polymer loading cuts that exposure while reducing pack bulk, which lowers freight and shelf space together. The trade is greater petrochemical exposure, which moves on a different cycle and rarely at the same time.

Manufacture within the region the product is sold

Diapers are bulky and low value per unit, which makes freight a large share of landed cost on any long shipping route. Producing close to the market removes that and the associated duty. The obstacle is that regional plants need volume to justify the fixed cost, and penetration must rise before the volume exists.

Contract pulp supply across multiple mill sources

Pulp supply concentrates in a limited number of North American and Nordic mills, which means an outage at one moves price for everybody buying. Contracting across several sources and across a full production cycle reduces both price and availability exposure. Smaller manufacturers rarely have the volume to obtain terms worth having. Availability matters as much as price here.

Portfolio Architecture for Margin Defence

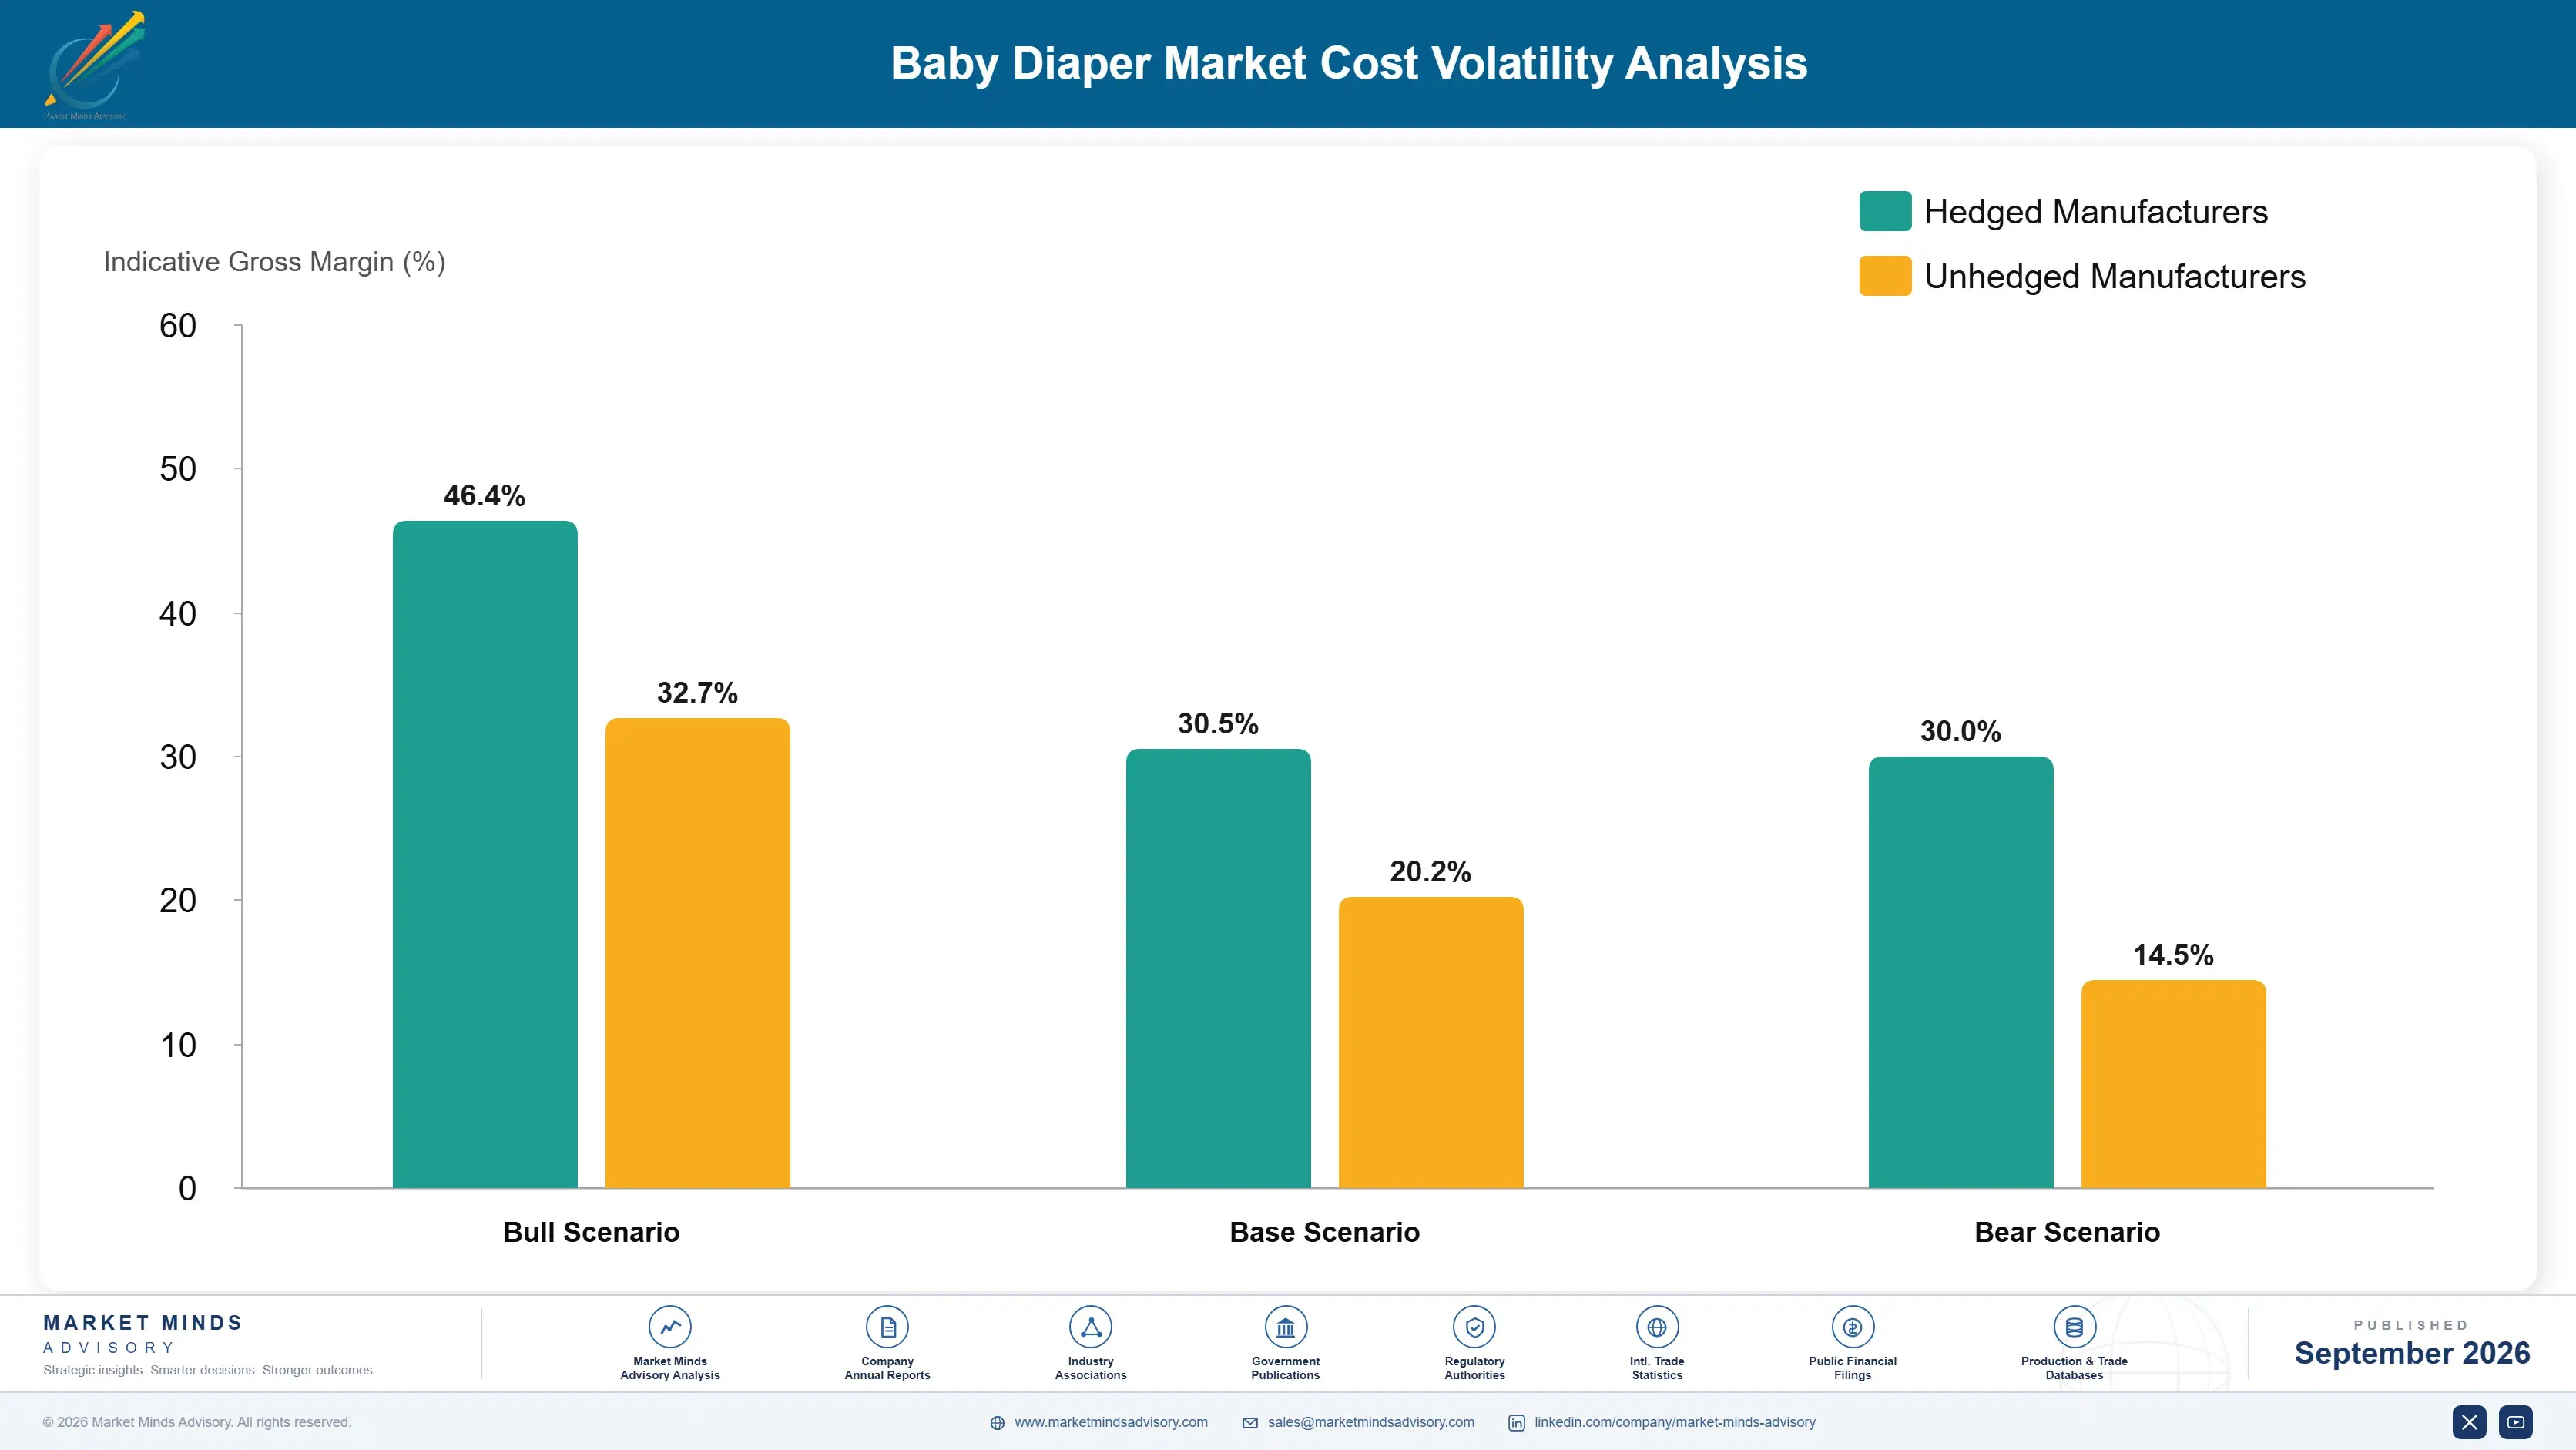
Margin architecture divides by tier and format rather than by material cost, which is not what a bill of materials would suggest. Economy taped diapers sold through discount and large-format retail run at gross margins in the high teens to high twenties, competing directly against private label produced by contract manufacturers with comparable absorbency and lower overhead. Absorbency is no longer where the difference lies in this tier.
Mid-tier taped diapers and swim pants hold gross margins in the low thirties to low forties. The spread reflects how differently branded and retailer-supplied product carry marketing and distribution cost. This is where most units actually sit and where private label pressure is heaviest, which makes it the tier most exposed to the performance gap continuing to narrow.

The highest-value pool is premium taped diapers and training pants, at margins in the low forties to low fifties. Pants carry higher prices for similar material content and convert at a developmental point that needs no persuasion, which is the cleanest economics in the category. Economy product holds volume and factory utilisation. It defends nothing against a retailer brand. Keeping the lines running is the argument for it. It is not a competitive position.

Volume / Commodity-Adjacent

Economy taped diapers through discount and large-format retail, competing directly against private label with comparable absorbency and lower overhead. The ten point range reflects how differently scale positions absorb material cost.
Gross Margin: 18 to 28%

Premium / Certified

Mid-tier taped diapers and swim pants. This is where most units sit and where private label pressure is heaviest, which makes it the tier most exposed to a narrowing performance gap.
Gross Margin: 32 to 42%

Sustainability / Regulatory / Next-Generation

Premium taped diapers and training pants. Pants carry higher prices for similar material content and convert at a developmental point requiring no persuasion, which is the cleanest economics available here.
Gross Margin: 42 to 52%
baby-diaper-market-share-analysis-portfolio-architecture-1790023891711

High-value Sub-segments and Strategic Watch-out

Training Pants And Pull-Ons

High value and fastest growth at 6.3%. Conversion happens when a child starts walking rather than when a campaign runs, and the format carries higher prices for essentially the same material content as taped. Marketing entry age is the lever, and most brands have not pushed it far enough.
Gross Margin: 44 to 52%

Premium Taped Diapers

High value and moderate growth at 5.1%, carried by trade-up rather than volume. The performance gap to mid-tier is narrowing as core technology diffuses, which shifts the premium toward packaging and brand. That is a weaker position than measurable superiority ever was in this category.
Gross Margin: 42 to 50%

Mid-Tier Taped Diapers

Volume core, holding the largest share of units and facing the heaviest private label pressure of any tier. Scale and retailer relationships are the only durable defences available to a branded participant here. Contract manufacturers now match branded absorbency at lower overhead than any major carries.
Gross Margin: 32 to 40%

Cloth And Reusable Systems

Strategic watch-out. Share remains small despite sustained environmental attention, and the eighteen point range reflects how differently direct-to-consumer brands and service-based laundering models price the same underlying product. Laundering services carry operating cost that direct-to-consumer brands avoid entirely, which is most of the spread here.
Gross Margin: 28 to 46%

How Parents Actually Choose

Demand here is time-limited and intense, which makes it unlike almost any other repeat purchase. A household enters the category at a known moment, buys around six units daily for roughly 30 months, and then leaves permanently and never returns. That compresses the whole relationship into a period shorter than most brands spend building one, and acquisition timing matters more than loyalty programmes ever could.
Stickiness varies sharply by when the choice was made. The brand used in the first weeks, frequently determined by a hospital pack or a grandparent's purchase, retains at rates nothing later can match. Parents who switch after a leak rarely switch back. Private label adoption tends to happen at the second child rather than the first, once the household has learned what actually matters.

Buyer profiles have shifted in one clear direction. Parents are older, having fewer children, and concentrating spending accordingly, which is what makes premiumisation work against shrinking cohorts. Online replenishment has grown faster than store sales, and a subscribed household switches brands far less often than one choosing from a shelf weekly. That channel shift favours whoever establishes the first repeat.
baby-diaper-market-share-analysis-end-use-penetration-index-1790023892199

Where Value Still Grows

These are among the four positions where our research anticipates prominent divergence between winners and laggards over the coming forecast period. Each is grounded in the demand model, the regulatory perimeter, and the announced capacity pipeline.
01 / FORMAT CONVERSION TIMING

Market pants earlier in the developmental window

Pants take around 31% of volume, grow at 6.3% against 4.2% overall and carry higher prices for essentially the same material content as taped product. The conversion happens when a child begins walking rather than when a campaign runs, so moving entry-age messaging earlier brings that revenue forward by months per child. Manufacturers who did it report pants mix rising roughly 9 points inside two years, lifting realised price across the whole portfolio, without requiring any change to the product itself anywhere.
02 / CORE FORMULATION ECONOMICS

Trade pulp exposure for thinner product

Fluff pulp accounts for roughly 34% of material cost and prices on a commodity market driven by paper demand and mill outages rather than by anything happening in this category. Higher polymer loading cuts that exposure while reducing pack bulk, which lowers freight and shelf space at the same time. Manufacturers who reformulated report pulp cost share falling toward 24% with no measurable performance loss and better parent comfort scores, which is an unusually clean trade for a commodity exposure.
03 / EMERGING MARKET MANUFACTURING

Build capacity where users are still arriving

Sub-Saharan penetration sits well below global levels and Nigeria grows at 8.9%, the fastest of any country covered, yet imported product carries duty and freight that put it beyond most household budgets entirely. Local manufacturing removes both of those at once. Participants who have built regional capacity report landed cost falling by roughly 31%, which is what makes affordable pack formats genuinely possible rather than merely desirable in those markets, though the capacity investment has to precede the demand arriving.
04 / PACK FORMAT DISCIPLINE

Size the pack to the weekly wage

Large packs deliver a better price per diaper and yet remain unaffordable to households budgeting on a weekly cash cycle, which excludes precisely the users that penetration growth actually depends on everywhere. Small counts priced against a weekly cash outlay convert non-users where a value-per-unit argument never will. Manufacturers who introduced them report new user acquisition rising roughly 2.4 times against an equivalent level of promotional spending on the large pack sizes, at a modest and quantifiable cost in packaging efficiency per unit.

Engagement Snapshot From the Field

A live engagement with an industry participant carrying material or product regulatory and market exposure ahead of a defining policy shift, showing how our research translates into a defensible multi-year portfolio strategy.
MARKET MINDS ADVISORY · CLIENT ENGAGEMENT SUMMARY
Baby Diaper Producer Strategic Portfolio Review and Transition Roadmap 2026·Investment Scenario on Baby Diaper Exposure Evaluation 2025-26
CLIENT PROFILE
A regional diaper manufacturer operating three plants across South and Southeast Asia with net revenue near USD 210 million (client-reported, unverified by MMA). Product mix ran approximately 71% mid-tier taped, 18% economy and 11% pants. Core formulation was pulp-heavy across every tier, and the standard pack size was 44 units in all markets served. No smaller format existed.
STRATEGIC CHALLENGE
Gross margin had fallen four points across two years while volumes grew, and management attributed the decline to competitive pricing pressure from global brands. A price increase across the mid-tier range had been approved. Nobody had examined material cost composition by tier or tested whether pack size was constraining new user acquisition.
MMA APPROACH
MMA rebuilt material cost by component and by tier, separating pulp, polymer, nonwoven and packaging rather than reporting a combined materials line. Pack size was tested against acquisition rates in matched territories. Pants conversion age was measured across the installed customer base using purchase sequence data. Findings were reconciled against audited plant cost records.
KEY FINDINGS
  1. Pulp represented 41% of material cost against a category norm near 34%, and the entire four point margin decline traced to pulp price movement rather than to competitive pricing.
  2. Pants accounted for 11% of volume against 31% globally, and customers were converting to competitor pants roughly four months before the client marketed any.
  3. A 16-unit pack tested in two territories acquired new users at 2.7 times the rate of promotional pricing on the standard 44-unit pack.
  4. Reformulating to a thinner high-polymer core cut material cost by 9% and reduced pack volume enough to add 22% more units per pallet.
CLIENT PROFILE
A regional diaper manufacturer operating three plants across South and Southeast Asia with net revenue near USD 210 million (client-reported, unverified by MMA). Product mix ran approximately 71% mid-tier taped, 18% economy and 11% pants. Core formulation was pulp-heavy across every tier, and the standard pack size was 44 units in all markets served. No smaller format existed.
STRATEGIC CHALLENGE
Gross margin had fallen four points across two years while volumes grew, and management attributed the decline to competitive pricing pressure from global brands. A price increase across the mid-tier range had been approved. Nobody had examined material cost composition by tier or tested whether pack size was constraining new user acquisition.
MMA APPROACH
MMA rebuilt material cost by component and by tier, separating pulp, polymer, nonwoven and packaging rather than reporting a combined materials line. Pack size was tested against acquisition rates in matched territories. Pants conversion age was measured across the installed customer base using purchase sequence data. Findings were reconciled against audited plant cost records.
KEY FINDINGS
  1. Pulp represented 41% of material cost against a category norm near 34%, and the entire four point margin decline traced to pulp price movement rather than to competitive pricing.
  2. Pants accounted for 11% of volume against 31% globally, and customers were converting to competitor pants roughly four months before the client marketed any.
  3. A 16-unit pack tested in two territories acquired new users at 2.7 times the rate of promotional pricing on the standard 44-unit pack.
  4. Reformulating to a thinner high-polymer core cut material cost by 9% and reduced pack volume enough to add 22% more units per pallet.
RECOMMENDED STRATEGY
Phase 1: Phase one: cancel the mid-tier price increase and reformulate all tiers toward thinner high-polymer cores. Reformulation trials were already complete. Phase 2: Phase two: launch small pack formats across emerging territories and lower the pants marketing entry age substantially. Existing pack sizes remain available. Phase 3: Phase three: expand pants capacity to reach a mix nearer the global share within two years. Capital comes from the material savings.
OUTCOME
Gross margin recovered the four lost points within three quarters, with reformulation and freight savings contributing roughly equally (client-reported, unverified by MMA). Pants mix reached 19% of volume in the first year, and small pack formats delivered new user growth that price promotion had never produced in the same territories.

Frequently Asked Questions

Foundational context covering the market sizes, CAGR, scope, country, region and competition that inform every finding below. This section is provided to cover basics and most often pre-purchase conversations, answered from the MMA Primary Research Dataset.

What is the current size of the Baby Diaper Market?

The market was valued at USD 57.0 billion in 2025, rising to USD 59.4 billion in 2026. Sizing is at manufacturer net revenue across six product categories.

How large will the Baby Diaper Market be by 2036?

MMA forecasts USD 89.6 billion by 2036, an increase of USD 30.2 billion over the 2026 base. That represents expansion of 1.51 times across the forecast period.

What is the CAGR for the Baby Diaper Market 2026 to 2036?

The base case CAGR is 4.2%, with a bull case of 5.4% and a bear case of 3.0%. Historical growth between 2020 and 2025 ran at 3.2%.

Which segment is growing fastest?

Training pants and pull-ons grow at 6.3%, half again the market rate, on a conversion that happens at a predictable developmental age. Premium taped diapers follow at 5.1%.

Who are the major companies in the Baby Diaper Market?

Procter and Gamble, Kimberly-Clark, Unicharm, Essity and Ontex Group lead on net revenue, holding a combined 63%. Concentration is high by consumer goods standards, sustained by scale and retailer relationships rather than by technology.

Which country is growing fastest?

Nigeria grows fastest at 8.9%, as disposable penetration rises from a low base and local manufacturing removes the import duty and freight that kept prices unreachable.

Report Segmentation Architecture

The full report scope spans multiple orthogonal segmentation dimensions, with cross-tabulated demand data provided for each dimension pair. Coverage extends further to regional breakdowns, trend trajectories, and the competitive detail needed to support segment-level decision-making.

By Product Tier and Format

  • Premium Taped Diapers
  • Mid-Tier Taped Diapers
  • Economy Taped Diapers
  • Training Pants and Pull-Ons
  • Swim Pants
  • Cloth and Reusable Systems

By End-Use Stage

  • Newborn and Early Infant
  • Crawling Stage
  • Early Walking Stage
  • Toilet Training Transition
  • Overnight Use
  • Swimming and Water Activity

By Commercial Dimension

  • Large Format Grocery Retail
  • Discount and Value Retail
  • Pharmacy and Drug Channel
  • Online Subscription Replenishment
  • Marketplace and E-Commerce
  • Institutional and Hospital Supply

By Region

  • East Asia
  • North America
  • Western Europe
  • South Asia and Pacific
  • Latin America
  • Middle East and Africa
  • Eastern Europe

Scope, Methodology, and Coverage

Every figure in this report is reproducible from documented input assumptions. The scope below maps the historical period, the forecast horizon, the segmentation dimensions, and the countries covered, alongside the underlying primary and qualitative methodology.
Historical Period
2020 to 2025
Forecast Period
2026 to 2036
Base Year
2025 (USD billions; MMA Primary Research Dataset, September 2026)
Market Definition
This market covers disposable and reusable absorbent products for infants and toddlers, spanning premium taped diapers, mid-tier taped diapers, economy taped diapers, training pants and pull-ons, swim pants, and cloth and reusable systems. Sizing is at manufacturer net revenue across grocery, discount, pharmacy, subscription, marketplace and institutional channels. Adult incontinence products, feminine hygiene, baby wipes, nappy creams and disposal systems are excluded from scope throughout this report.
Quantitative Units
USD billions at manufacturer net revenue; volume in billions of units shipped; price in USD per single diaper.
Segmentation Dimensions
Product tier and format, end-use stage, commercial dimension, and geographic region.
Regions Covered
East Asia, North America, Western Europe, South Asia and Pacific, Latin America, Middle East and Africa, Eastern Europe
Countries Covered
China, India, United States, Japan, Nigeria, Brazil
Key Companies Profiled
Procter and Gamble, Kimberly-Clark, Unicharm, Essity, Ontex Group, Hengan International, Daio Paper, Oji Holdings, Domtar Personal Care, First Quality Enterprises, Fippi, Nobel Hygiene, Millennium Babycares, Hayat Kimya, Sanita, Bella Baby Happy, DSG International, Softcare Group, Nepia, Diapex
Quantitative Methodology
Primary survey, n=3,800 respondents, Q4 2025, six countries; demand-side model with trade association cross-validation
Qualitative Methodology
47 expert interviews, Q4 2025; applied to validate demand model assumptions, identify emerging dynamics, and assess competitive positioning
Report Format
PDF and XLSX data workbook (Word format preview document)
Publisher
Market Minds Advisory
Report Code
MMA-2026-PAC-798
Published
September 2026
Contact
sales@marketmindsadvisory.com | www.marketmindsadvisory.com

Purchase the full Baby Diaper Market Report (2026 to 2036).

The full report sizes the baby diaper market across six product tiers and formats, six end-use stages and six commercial dimensions for all seven global regions through 2036. It decomposes material cost by component rather than reporting a combined materials line, separating pulp, polymer, nonwoven and packaging exposure by tier. Pants conversion age is measured across installed customer bases using purchase sequence data. Pack format effects on new user acquisition are tested in matched territories. Competitive assessment covers 20 participants on a consistent manufacturer net revenue basis.
Material cost decomposed by component and by tier
Pants conversion age measured from purchase sequences
Pack format acquisition effects tested in matched territories
Birth cohort contraction modelled against trade-up capacity
Six product tiers sized through 2036
Twenty participants assessed on manufacturer net revenue

Built For The People Who Decide

From boardroom strategy to bench-side execution, this report is read cover-to-cover by leaders shaping the next decade of their industry, turning demand scenarios, market dynamics and valuation benchmarks into decisions.
CXOs/ Presidents/ VPs/ Managers
M&A and Corporate Development
Strategy Teams and R&D Heads
Procurement and Product Directors
Regulatory and Compliance Leaders
Investor Relations and Equity Analysts