Market Minds Advisory
Autosampler Market

Autosampler Market: Automated Sample Injection Systems for Chromatography and Mass Spectrometry

Mass spectrometry-coupled autosamplers are pulling laboratory automation budgets away from standalone liquid chromatography injectors, forcing instrument manufacturers to bundle sampling hardware with software and consumables as biopharma quality control testing volume accelerates worldwide.

Lead Analyst

Alice Ballenger

Published

September 2026

Make Smarter Decisions with Customized Research Insights

Request a free sample report and evaluate market opportunities, growth trends, and competitive dynamics relevant to your business needs.

2025 MARKET VALUE$1.2BMarket Size 2025
2036 FORECAST VALUE$2.3BBase Case , 2026 to 2036
CAGR 2026 TO 20366.2 %Bull 7.4% / Bear 4.9%
INCREMENTAL OPPORTUNITY$1.1BNet 10- year value creation
EXPANSION MULTIPLE1.82x2036 value over 2026 base
Strategic Levers
M&A Pipeline
Regional Outlook
Country Rankings
Competitive Intelligence
Segmental Deep-dive
Call-Us : 91 93563 13602

Executive Snapshot and Market Trajectory

Mass spectrometry-coupled autosamplers are pulling laboratory automation budgets away from standalone liquid chromatography injectors, compressing sample throughput timelines for pharmaceutical quality control laboratories processing rising testing volumes nationwide today. Laboratory directors describe this as the biggest workflow shift the category has seen in a decade broadly today overall now.
Expanding biopharma quality control testing demand, growing high-throughput screening investment, and rising analytical laboratory automation adoption are concentrating demand in North America and Western Europe, where pharmaceutical research investment and laboratory infrastructure maturity sustain the highest per-laboratory instrument spend of any region tracked in this study. China's own rapidly expanding pharmaceutical manufacturing capacity reinforces this concentration well beyond what population alone would explain across nearly every regulated pharmaceutical market tracked.
A tightly concentrated group of analytical instrumentation manufacturers controls most branded revenue, while software and consumables attachment increasingly determines profitability, even as mass spectrometry coupling reshapes which companies lead laboratory automation conversations at major analytical chemistry conferences worldwide. Smaller specialty manufacturers without meaningful software integration increasingly struggle to secure large laboratory network accounts at scale nationwide each cycle across most institutional purchasing decisions studied worldwide today.
Market Definition
This market covers automated sample injection instruments used in liquid chromatography, gas chromatography, and mass spectrometry analytical workflows, including robotic liquid handling autosamplers and associated software and data integration systems. It excludes the chromatography and mass spectrometry instruments themselves and general laboratory liquid handling equipment unrelated to automated sample injection.
Base Year Value
$1.2B in 2025 (MMA Primary Research Dataset, August 2026)
Forecast Period
2026 to 2036, eleven discrete annual values
CAGR
6.2% base case. Bull 7.4%. Bear 4.9%.
Fastest Growth Segment
Mass Spectrometry-Coupled Autosamplers: 9.8% CAGR
Fastest Growth Country
China: 9.2% CAGR
Fastest Growth Region
South Asia and Pacific: 8.2% CAGR
Largest Region
North America: 30% of 2025 global value
Market Leaders
Agilent Technologies Inc., Thermo Fisher Scientific Inc., Waters Corporation, Shimadzu Corporation, Revvity Inc. Source: MMA Analysis based on company annual reports.
Primary Survey
n=3,800 procurement and R&D decision-makers, Q4 2025, six countries
Methodology
Demand-side build-up, cross-validated against public data, 47 expert interviews

Autosampler Market Forecast Scenarios

autosampler-market-size-forecast-scenario-1787306598879
Autosampler market spending grew at roughly 5.6% annually between 2020 and 2025, as expanding pharmaceutical quality control testing volume and steady analytical laboratory automation investment brought more instruments into deployment across major developed and emerging laboratory markets tracked closely by industry observers. Growth accelerated further toward the end of the historical window as mass spectrometry coupling gained broader laboratory acceptance.
The base case assumes continued mass spectrometry-coupled autosampler adoption, expanding high-throughput screening investment across biopharma laboratories, and steady replacement cycle demand, sustaining a 6.2% blended annual growth rate through 2036 across most major laboratory instrumentation markets worldwide tracked in this study. Continued software integration investment and service contract expansion further reinforce this trajectory across most major laboratory markets reviewed by MMA analysts across most major reimbursement and procurement channels tracked globally today.
A bull scenario assumes faster-than-expected biopharma testing volume growth pulls instrument replacement cycles well ahead of current expectations across emerging markets. The bear case centers on laboratory capital budget tightening that slows instrument replacement timelines relative to the underlying testing volume growth trajectory. Either scenario would meaningfully reshape which manufacturers lead laboratory automation conversations by the end of the forecast period.

Mass Spectrometry Coupling Redraws Lab Automation

Autosamplers sit at the convergence of pharmaceutical quality control regulatory requirements, laboratory automation investment, and a genuinely fast-moving mass spectrometry coupling shift that has pulled sample injection technology from standalone chromatography accessories into integrated analytical workflow components. Laboratory directors increasingly weigh software integration as heavily as raw sampling precision when selecting instruments. This dynamic increasingly rewards manufacturers w
MARKET CONCENTRATIONCR5 68%share held by the five largest instrumentation manufacturers combined
AVERAGE INSTRUMENT PRICE$18,500blended average across standalone and integrated autosampler platforms
LEADING COUNTRY SHAREUnited States 23%of global instrument spend concentrated domestically across all laboratory types
INSTALLED BASE UTILISATION RATE74%average laboratory autosampler operating capacity across major markets currently
CONSUMABLES ATTACH RATE46%of total category revenue from recurring vial sales
REPLACEMENT CYCLE LENGTH8 yearsaverage laboratory instrument replacement interval across major applications
Commercially, this market behaves like a capital equipment and consumable hybrid: laboratories invest in instrument hardware once, then purchase sample vials, seals, and maintenance contracts recurringly, creating a service and consumable revenue stream layered atop the initial capital sale that increasingly determines manufacturer profitability. This dual revenue structure increasingly attracts specialty investors seeking durable, consumable-driven margin profiles. Few other capital equipment categories combine such distinct hardware and recurring consumable revenue pools.
Over the next decade, expanding biopharma testing volume, growing high-throughput screening investment, and continued mass spectrometry coupling adoption will keep pulling laboratory automation budgets toward integrated, software-connected instrument platforms across most major pharmaceutical and analytical laboratory markets tracked in this study. Manufacturers slow to adapt risk ceding laboratory mindshare to faster-moving competitors across the category.
"Nobody buys an autosampler for the autosampler anymore. They buy it because it has to talk to the mass spec and the software stack the lab already runs, and that integration is where the real competition happens."
Director, Analytical Instrumentation and Laboratory Automation Practice · MMA An

Market Trends

Mass Spectrometry Coupling Becomes Standard Configuration

Laboratories increasingly specify autosamplers designed for direct mass spectrometry workflow integration rather than standalone chromatography-only configurations, reflecting the growing dominance of liquid chromatography-mass spectrometry methods in pharmaceutical bioanalysis and quality control testing protocols across major regulated laboratory markets. Manufacturers report mass spectrometry-coupled configurations now represent roughly 44% of new autosampler placements, a substantial increase from a decade ago when standalone chromatography configurations dominated new instrument sales. This shift is pulling manufacturers to redesign core autosampler platforms specifically for tighter mass spectrometry timing and carryover performance requirements. Manufacturers view this shift as essential to remaining competitive in an increasingly software-driven category.
Market Impact: Covers 3,000 plus regulated facilit

High-Throughput Screening Investment Expands Robotic Handling

Biopharma drug discovery laboratories continue investing in robotic liquid handling autosamplers capable of processing significantly higher sample volumes than traditional single-vial injection systems, supporting the industry's expanding high-throughput screening and combinatorial chemistry testing requirements across major research organizations. Laboratory automation suppliers report robotic handling platform sales have grown by roughly 32% since 2022, outpacing standard autosampler growth considerably as drug discovery organizations scale testing capacity to match expanding compound libraries. This trend is pulling instrument manufacturers to develop modular platforms accommodating both standard and high-throughput configurations. Manufacturers view robotic handling as essential to serving the industry's fastest-growing customer segment.
Market Impact: Adds capacity across 50 plus facili

Market Opportunities and Growth Drivers

Expanding Pharmaceutical Quality Control Testing Requirements

Regulatory quality control testing requirements for pharmaceutical manufacturing continue expanding as biopharma production volume grows and regulatory agencies increase scrutiny of manufacturing consistency, directly driving demand for automated sample injection instruments capable of supporting higher testing throughput without proportionally expanding laboratory staffing. Good manufacturing practice compliance requirements increasingly mandate automated, validated sample handling processes that reduce human error risk compared to manual injection methods still used in some smaller laboratory settings. This driver sustains steady baseline instrument demand growth even without accounting for mass spectrometry coupling or robotic handling adoption effects separately.
Market Impact: Cycles span 7 to 9 years

Biopharma Manufacturing Capacity Investment Grows Rapidly

Expanding biopharma manufacturing capacity investment across both established and emerging pharmaceutical markets continues growing the installed base of laboratories requiring quality control and testing instrumentation, directly expanding the addressable autosampler market as new manufacturing facilities come online across major producing regions. Government and private investment in domestic pharmaceutical manufacturing capacity has accelerated considerably in several markets seeking supply chain resilience, directly driving new laboratory construction and associated instrumentation procurement. This driver is expected to sustain above-average instrument demand growth in emerging manufacturing markets for years to come. Manufacturers view emerging market capacity expansion as essential to sustaining long-term category growth.
Market Impact: Budget delays add 18 months

Market Restraints and Challenges

Long Replacement Cycles Limit Annual Volume Growth

Autosamplers typically remain in active laboratory service for seven to nine years given their capital equipment nature and the extensive method validation work required whenever a laboratory switches instrument platforms, fundamentally limiting annual unit volume growth regardless of underlying testing demand expansion across regulated laboratory environments. The root cause is that regulated pharmaceutical laboratories must revalidate analytical methods whenever instrument platforms change, creating a genuine switching cost that discourages replacement purchases until instruments approach end of service life or fail entirely. This constraint disproportionately affects instrument manufacturers competing primarily for replacement cycle volume rather than new laboratory construction demand.
Market Impact: Adds 44 percent coupled share

Laboratory Capital Budget Constraints Slow Upgrade Timing

Smaller laboratories and academic research institutions frequently face capital budget constraints that delay instrument replacement well beyond optimal technical lifespan, limiting these customers' ability to adopt newer mass spectrometry-coupled or robotic handling platforms despite genuine testing throughput needs across their research programmes. The underlying cause is that laboratory capital equipment budgets typically compete against other institutional priorities, and autosamplers rarely receive the same funding urgency as more visible research infrastructure investments within constrained budget environments. This constraint disproportionately affects academic and smaller commercial laboratories relative to well-funded pharmaceutical manufacturing quality control operations. Manufacturers are offering extended financing and leasing programmes.
Market Impact: Grows robotic handling sales 32 per
3 additional market trends, 3 additional growth drivers, and 4 additional restraints and challenges are covered in the full report. Contact sales@marketmindsadvisory.com to access the complete intelligence.

Segment CAGR and Growth Architecture

This market segments by application technology spanning liquid chromatography autosamplers, gas chromatography autosamplers, mass spectrometry-coupled autosamplers, robotic liquid handling autosamplers, headspace and SPME autosamplers, and software and data integration systems across laboratory workflows. This dimension is the one laboratory directors actually reference when structuring instrument and software purchasing decisions and software purchasing decisions across the industry.
autosampler-market-market-share-analysis-1787306599410

Mass Spectrometry-Coupled Autosamplers

Mass spectrometry-coupled autosamplers are the fastest-growing segment as pharmaceutical bioanalysis and quality control laboratories increasingly standardize on liquid chromatography-mass spectrometry methods that require tighter injection timing precision and lower carryover than standalone chromatography configurations can reliably deliver. Clinical and regulatory laboratories particularly value this segment's improved method sensitivity and reduced sample cross-contamination risk, both of which directly support the stringent data integrity requirements that regulated pharmaceutical testing environments demand consistently. This segment commands strong pricing power reflecting both its specialized engineering requirements and the software integration investment needed to support reliable mass spectrometry workflow connectivity across the laboratory. Manufacturers are pursuing deeper software partnerships with mass spectrometry platform providers as this segment increasingly determines competitive positioning industry-wide.
CAGR 9.8%

Robotic Liquid Handling Autosamplers

Robotic liquid handling autosamplers are growing considerably faster than the broader market as biopharma drug discovery organizations scale high-throughput screening programmes requiring significantly higher sample processing volume than traditional single-vial injection platforms can practically support within reasonable laboratory timeframes. This segment benefits from expanding compound library sizes and growing combinatorial chemistry testing requirements that directly drive demand for instruments capable of unattended, high-volume overnight sample processing runs. Manufacturers are investing in modular robotic platforms that laboratories can scale incrementally as testing volume grows, since large upfront capital commitments for maximum throughput capacity often exceed what smaller drug discovery organizations can justify before demonstrating sustained testing volume growth. This modular approach increasingly determines which manufacturers win larger drug discovery organization accounts.
CAGR 8.5%
Full segment breakdown across 6 segments available in the complete report.

Regional Architecture and Country Demand Map

North America and Western Europe together account for the majority of global instrument spend, reflecting concentrated pharmaceutical research investment, regulatory testing infrastructure, and laboratory automation maturity across major developed markets. East Asia and South Asia are closing the gap fastest as domestic manufacturing investment continues expanding rapidly.

North America

The United States anchors regional demand through its dense concentration of pharmaceutical quality control and biopharma research laboratories, favorable capital equipment financing availability, and the largest installed base of mass spectrometry-coupled platforms of any national market tracked in this study. Canada maintains a smaller but steadily expanding laboratory base, with growing biopharma manufacturing investment gradually increasing instrument procurement across major research institutions. American pharmaceutical and contract research organizations continue driving bulk purchasing volume that gives manufacturers a reliable large-account revenue base ahead of broader academic and smaller laboratory conversion. This region's laboratory infrastructure maturity and testing volume make it the benchmark market other national markets reference when evaluating instrument technology adoption timelines.
Share: 30% | CAGR: 6.6% (2026 to 2036)

Western Europe

Germany, France, and the United Kingdom lead regional demand through well-established pharmaceutical manufacturing and academic research laboratory networks, with Germany's chemical and pharmaceutical manufacturing base particularly influential in driving quality control instrumentation demand across the region. Public and private research funding across the region supports steady laboratory instrumentation investment, though overall capital equipment spending intensity trails North America somewhat across most major markets. Nordic countries show disproportionately high per-laboratory instrument investment despite small absolute population, reflecting well-funded life sciences research infrastructure supporting advanced analytical capability. Regional growth trails North America and East Asia modestly as laboratory infrastructure among major markets is already comparatively mature. Smaller Western European markets follow this same research-driven adoption pattern closely across their national laboratory sectors.
Share: 25% | CAGR: 4.8% (2026 to 2036)
Regional intelligence for 5 additional markets available in the complete report: East Asia, South Asia and Pacific, Latin America, Middle East and Africa, Eastern Europe. Contact sales@marketmindsadvisory.com.
autosampler-market-country-cagr-analysis-1787306599934

Consumables Attachment and Software Integration Strategy

Manufacturers are shifting commercial strategy toward recurring consumables attachment, software and data integration platform investment, and service contract expansion, capturing more predictable laboratory-level revenue rather than depending purely on one-time instrument hardware sales alone across the category. This mirrors a broader capital equipment industry shift toward relationship-driven, service-based commercial models overall today across the sector.

Recurring Consumables and Vial Attachment Programmes

Manufacturers are structuring instrument placements to maximize downstream sample vial, seal, and consumable attachment, since these recurring purchases generate materially higher margins than the initial capital hardware sale and recur consistently throughout the instrument's operational lifetime at a given laboratory. This lever converts a one-time equipment sale into a multi-year recurring revenue relationship similar to commercial models common across other capital-intensive laboratory equipment categories. Manufacturers report consumables attachment revenue now represents roughly 46% of total autosampler category revenue across major manufacturers. Manufacturers view this attachment ratio as the single most important commercial metric tracked internally.
Market Impact: Consumables now drive roughly 46 pe

Software and Data Integration Platform Investment

Manufacturers are investing in laboratory information management system integration and data analytics software that connects autosampler instruments to broader laboratory workflow platforms, converting hardware sales into deeper software-enabled relationships that create meaningful switching costs once laboratories build validated workflows around a specific platform. This lever strengthens customer retention considerably, since switching instrument platforms requires laboratories to revalidate entire analytical workflows built around specific software integration. Manufacturers report software-integrated platforms improving customer retention by roughly 34% compared to standalone hardware offerings. Manufacturers view software integration as increasingly essential to defending long-term laboratory account relationships.
Market Impact: Improves customer retention by roug

Extended Service Contract and Financing Programmes

Manufacturers are expanding extended service contract and equipment financing programmes specifically designed to smooth revenue across the category's naturally long replacement cycles while making instrument access more financially viable for smaller and academic laboratories previously priced out of premium platform categories. This lever generates predictable recurring service revenue independent of new instrument sales cycles, providing manufacturers a more stable revenue base during periods when capital equipment purchasing slows across the broader laboratory customer base. Manufacturers report service contract attachment adding roughly 21% to total account revenue over the instrument's operational lifetime.
Market Impact: Adds roughly 21 percent to total li

High-Throughput Platform Upsell Investment Programme Strategy

Manufacturers are developing modular robotic handling platforms that allow laboratories to upgrade incrementally from standard autosamplers to high-throughput configurations as testing volume grows, capturing expansion revenue from existing customers rather than depending entirely on new customer acquisition to drive category growth. This lever captures incremental revenue from laboratories whose testing needs evolve over time, avoiding the customer acquisition cost associated with winning entirely new laboratory accounts for premium platform categories. Manufacturers report modular upgrade programmes capturing roughly 27% additional revenue from existing customer accounts. Manufacturers view this upsell motion as increasingly important to sustaining long-term account growth.
Market Impact: Captures roughly 27 percent more ac

Who Controls the Margin Pool

The top five instrumentation manufacturers control roughly 68% of global revenue, a high concentration reflecting the substantial research and development investment required to develop mass spectrometry-integrated platforms alongside a meaningful long tail of specialty and regional manufacturers competing within narrower application niches. Mid-sized specialty manufacturers with differentiated technology remain attractive acquisition targets for larger originators. This dynamic keeps deal activ
Current competitive activity centers on mass spectrometry integration and software platform development, robotic high-throughput handling capacity expansion, and extended service contract and financing programme development aimed at smoothing revenue across the category's long replacement cycles. Several manufacturers are also piloting bundled financing and service packages to differentiate beyond hardware alone. This positioning increasingly determines which manufacturers win larger, multi-laboratory network relationships.

Emerging pressure comes from Asian domestic instrumentation manufacturers developing lower-cost platforms for their expanding domestic pharmaceutical manufacturing markets, and from software-focused entrants building laboratory data integration layers that could eventually shift purchasing leverage away from pure hardware manufacturers. Established leaders are responding by accelerating their own software and robotics investment to defend share, while monitoring these entrants closely for signs of accelerating competitive share gains.
autosampler-market-company-positioning-matrix-1787306600456

Competitive Moat and Risk Dimensions

AGILENT TECHNOLOGIES INC.

Moat: Broad Platform Installed Base Depth

Agilent maintains one of the industry's broadest installed bases across liquid and gas chromatography autosampler platforms, giving it deep application method libraries and laboratory relationships accumulated over decades that narrower competitors would need years to replicate at comparable scale. This installed base advantage compounds as laboratories build multi-year purchasing relationships around trusted platforms.
AGILENT TECHNOLOGIES INC.

Risk: Capital Spending Cycle Exposure Risk

Agilent's revenue depends heavily on pharmaceutical and biopharma laboratory capital equipment spending cycles, and a sustained slowdown in laboratory capital budgets during economic uncertainty could disproportionately affect new instrument sales relative to the company's more resilient consumables and service revenue streams. Investors are watching laboratory capital spending trends closely for early signs of slower demand.
THERMO FISHER SCIENTIFIC INC.

Moat: Integrated MS Workflow Bundling Advantage

Thermo Fisher sells mass spectrometry instruments, autosamplers, and laboratory software under one integrated commercial relationship, giving it cross-selling advantages and workflow integration depth that narrower autosampler-only competitors cannot easily replicate across comparable laboratory account volume. Few competitors can match this integrated portfolio breadth built over decades of acquisition and development.
THERMO FISHER SCIENTIFIC INC.

Risk: Cross-Platform Integration Complexity Risk

Thermo Fisher's broad portfolio strategy requires maintaining compatibility across numerous instrument and software combinations, and any integration reliability issues across this complex portfolio could meaningfully affect customer satisfaction relative to more focused single-platform competitors. Thermo Fisher continues investing in quality assurance infrastructure to reduce this integration risk over time.

Players Tracked

Prominent Players

Agilent Technologies Inc.
Thermo Fisher Scientific Inc.
Waters Corporation
Shimadzu Corporation
Revvity Inc.

Other Key Players

Bruker Corporation
Danaher Corporation
SCIEX
Gilson Inc.
Tosoh Corporation
JASCO Inc.
Hitachi High-Tech Corporation
Restek Corporation
Teledyne Technologies Incorporated
LECO Corporation
Anton Paar GmbH
Metrohm AG
Spark Holland B.V.
Analytik Jena GmbH
CTC Analytics AG

Recent Developments

MARCH 2026

Agilent Expands Mass Spectrometry-Coupled Autosampler Manufacturing Capacity

Agilent Technologies announced an organic capacity expansion at its manufacturing facility to increase production of its mass spectrometry-coupled autosampler platform, aimed at meeting rising demand from pharmaceutical quality control laboratories converting from standalone chromatography configurations across major markets. The expansion is expected to reach full production capacity within the next.
Signal: Signals continued manufacturer confidence
OCTOBER 2025

Thermo Fisher Signs Software Integration Partnership With Laboratory Platform Provider

Thermo Fisher Scientific entered a multi-year software integration partnership with a major laboratory information management system provider, extending its autosampler platform connectivity across additional laboratory workflow software used by pharmaceutical quality control customers. Financial terms of the multi-year partnership were not fully disclosed by either party involved.
Signal: Reflects growing manufacturer investment i
JANUARY 2026

Waters Acquires Regional High-Throughput Robotics Startup

Waters Corporation completed the acquisition of a regional robotics startup developing high-throughput liquid handling technology, expanding its autosampler portfolio to capture rising demand from biopharma drug discovery laboratories scaling screening programme capacity. Financial terms of the transaction were not disclosed by either company involved in the deal.
Signal: Indicates growing instrumentation manufact

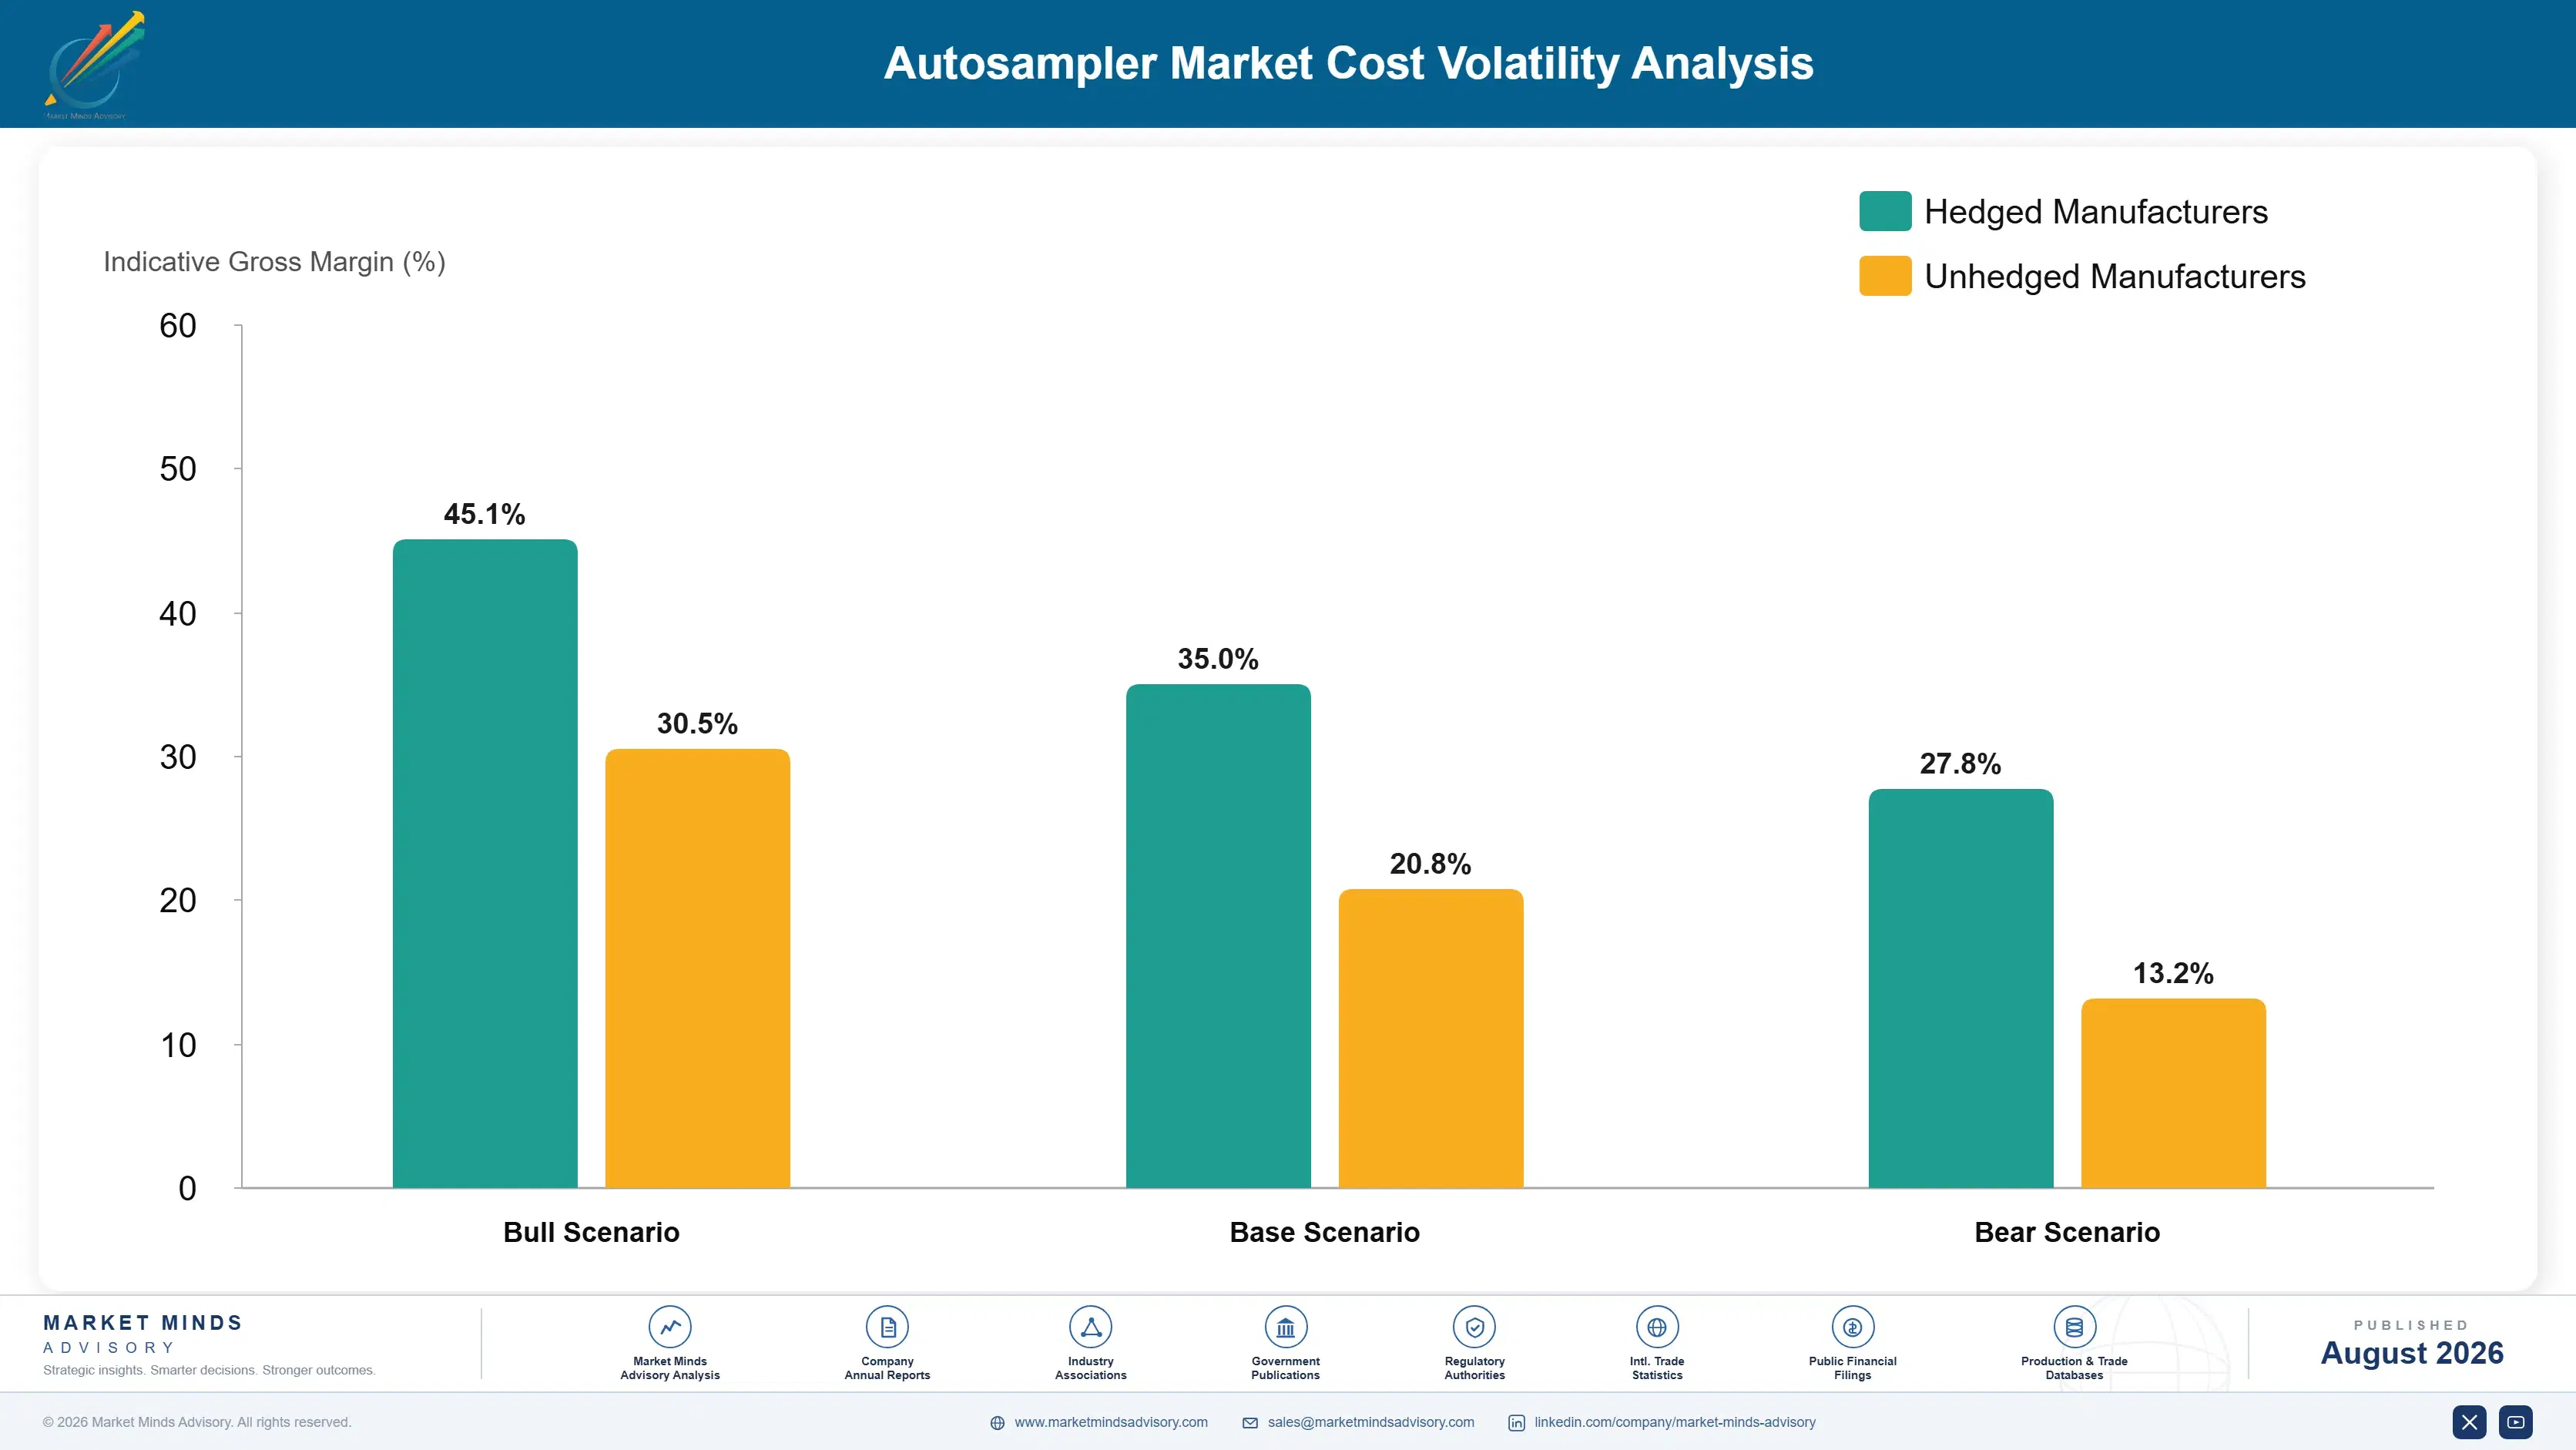
Precision Robotics and Electronics Cost Exposure

Precision robotic components, specialty electronics, and inert sample handling materials together represent roughly 42% of cost of goods sold for autosampler manufacturers, with precision robotic component manufacturing concentrated among a small group of specialized suppliers serving the broader analytical instrumentation industry. Manufacturers with vertically integrated component production face materially less exposure to this concentration today.
Precision robotics and electronics component prices rose meaningfully during 2021 and 2022 amid broader manufacturing supply chain disruption, with company annual reports from major manufacturers confirming that input cost pressure remained elevated through much of the period before moderating somewhat through 2024 and 2025. Smaller manufacturers absorbed a disproportionate share of this cost inflation given weaker supplier negotiating positions previously to smaller manufacturers lacking comparable scale.

Smaller specialty manufacturers without long-term supplier contracts face materially higher input cost volatility than the largest players, who can negotiate multi-year fixed pricing given their purchasing scale. This creates a durable cost disadvantage for smaller instrument makers competing on price against larger competitors able to smooth input cost swings. Geography also matters, since manufacturers closer to precision component supply hubs face smaller logistics cost swings.
autosampler-market-cost-volatility-analysis-1787306600652

Multi-Year Fixed Pricing Supplier Contracts

Larger manufacturers are locking in multi-year fixed pricing agreements with precision robotics and electronics suppliers, insulating instrument production costs from short-term component price volatility that smaller competitors remain fully exposed to across each purchasing cycle. This approach has become standard practice among the largest instrumentation manufacturers globally over the past decade today, particularly those with strong purchasing scale.

Vertical Integration Into Precision Component Manufacturing

Some larger manufacturers are bringing precision robotic component manufacturing in-house rather than outsourcing entirely, capturing manufacturing margin previously paid to third-party suppliers while gaining tighter quality control over supply. This shift represents a meaningful strategic bet on long-term category volume growth continuing steadily across the wider industry, reflecting genuine confidence in continued category expansion ahead.

Secondary Supplier Qualification Programmes

Manufacturers are qualifying secondary suppliers for critical precision components to reduce dependency on any single source, reducing disruption risk when a primary supplier faces its own capacity constraints. Smaller manufacturers increasingly pursue this strategy too, despite the added qualification cost involved over the coming years ahead, and this trend keeps accelerating across the wider industry today.

Portfolio Architecture for Margin Defence

This market organizes into three commercial tiers spanning standard gas and liquid chromatography autosamplers at the volume end, mass spectrometry-coupled platforms occupying the premium middle tier, and robotic high-throughput handling systems and integrated software platforms capturing the strongest margins at the top of the portfolio architecture overall. Manufacturers increasingly structure pricing and research investment explicitly around this three-tier architecture.
Volume and premium tiers pull manufacturers in different directions: standard autosamplers sustain broad laboratory relationships and unit volume, while mass spectrometry-coupled and robotic platforms deliver materially stronger margins that increasingly determine which companies can fund the research and development the category requires going forward. Most manufacturers now allocate a growing share of research budget toward the top two tiers. This explicit structuring helps allocate scarce development resources toward the highest-return opportunities available.

The highest-value pools concentrate around mass spectrometry-coupled and robotic high-throughput platforms sold under software integration and service contracts, where technical differentiation and workflow lock-in together sustain premium pricing power that standard autosamplers simply cannot match across comparable volume. Manufacturers unable to compete in this tier increasingly struggle to sustain category-leading margins over time today across the industry.

Volume / Commodity-Adjacent Tier

Standard gas and liquid chromatography autosamplers sold into general analytical and academic research laboratory settings broadly. This tier represents the largest unit volume category by laboratory count served across most markets.
Gross Margin: 26-34%

Premium / Certified Tier

Mass spectrometry-coupled autosampler platforms sold into pharmaceutical quality control and bioanalysis laboratories under strong technical positioning. Laboratories in this tier rarely switch platforms once analytical methods are formally validated each time.
Gross Margin: 42-50%

Sustainability / Regulatory / Next-Generation Tier

Robotic high-throughput handling systems and integrated software platforms commanding the strongest pricing power given technical and workflow differentiation. This tier increasingly determines which manufacturers can fund the research the category requires.
Gross Margin: 54-62%
autosampler-market-portfolio-architecture-1787306601153

High-value Sub-segments and Strategic Watch-out

Mass Spectrometry-Coupled Autosamplers

The fastest-growing and highest-margin segment, combining strong regulatory testing momentum with genuine technical differentiation across most major pharmaceutical markets tracked, drawing intense investment. Manufacturers are allocating a growing share of research budget toward this segment specifically, and this priority shows no sign of shifting through the current planning cycle.
Gross Margin: 54-62%

Robotic Liquid Handling Autosamplers

Strong margins and steady growth driven by expanding high-throughput screening demand that traditional single-vial injection platforms cannot practically address. Manufacturers are developing modular platforms to further differentiate within this expanding segment, since large upfront capital commitments often exceed what smaller organizations can justify today now.
Gross Margin: 48-56%

Liquid Chromatography Autosamplers

The volume core segment sustaining broad laboratory relationships even as mass spectrometry coupling gradually captures premium positioning industry-wide. Manufacturers rely on this segment to sustain broad laboratory relationships even as newer categories expand, and this role remains commercially important despite slower relative growth overall now.
Gross Margin: 28-36%

Gas Chromatography Autosamplers

A strategic watch-out segment facing slower relative growth as liquid chromatography methods expand, though it remains essential for volatile compound analysis applications. Manufacturers watch this segment closely for signs of accelerating displacement by liquid chromatography methods, since faster than expected decline would materially change portfolio revenue mix.
Gross Margin: 24-32%

Laboratory Method Validation Lock-In Streams

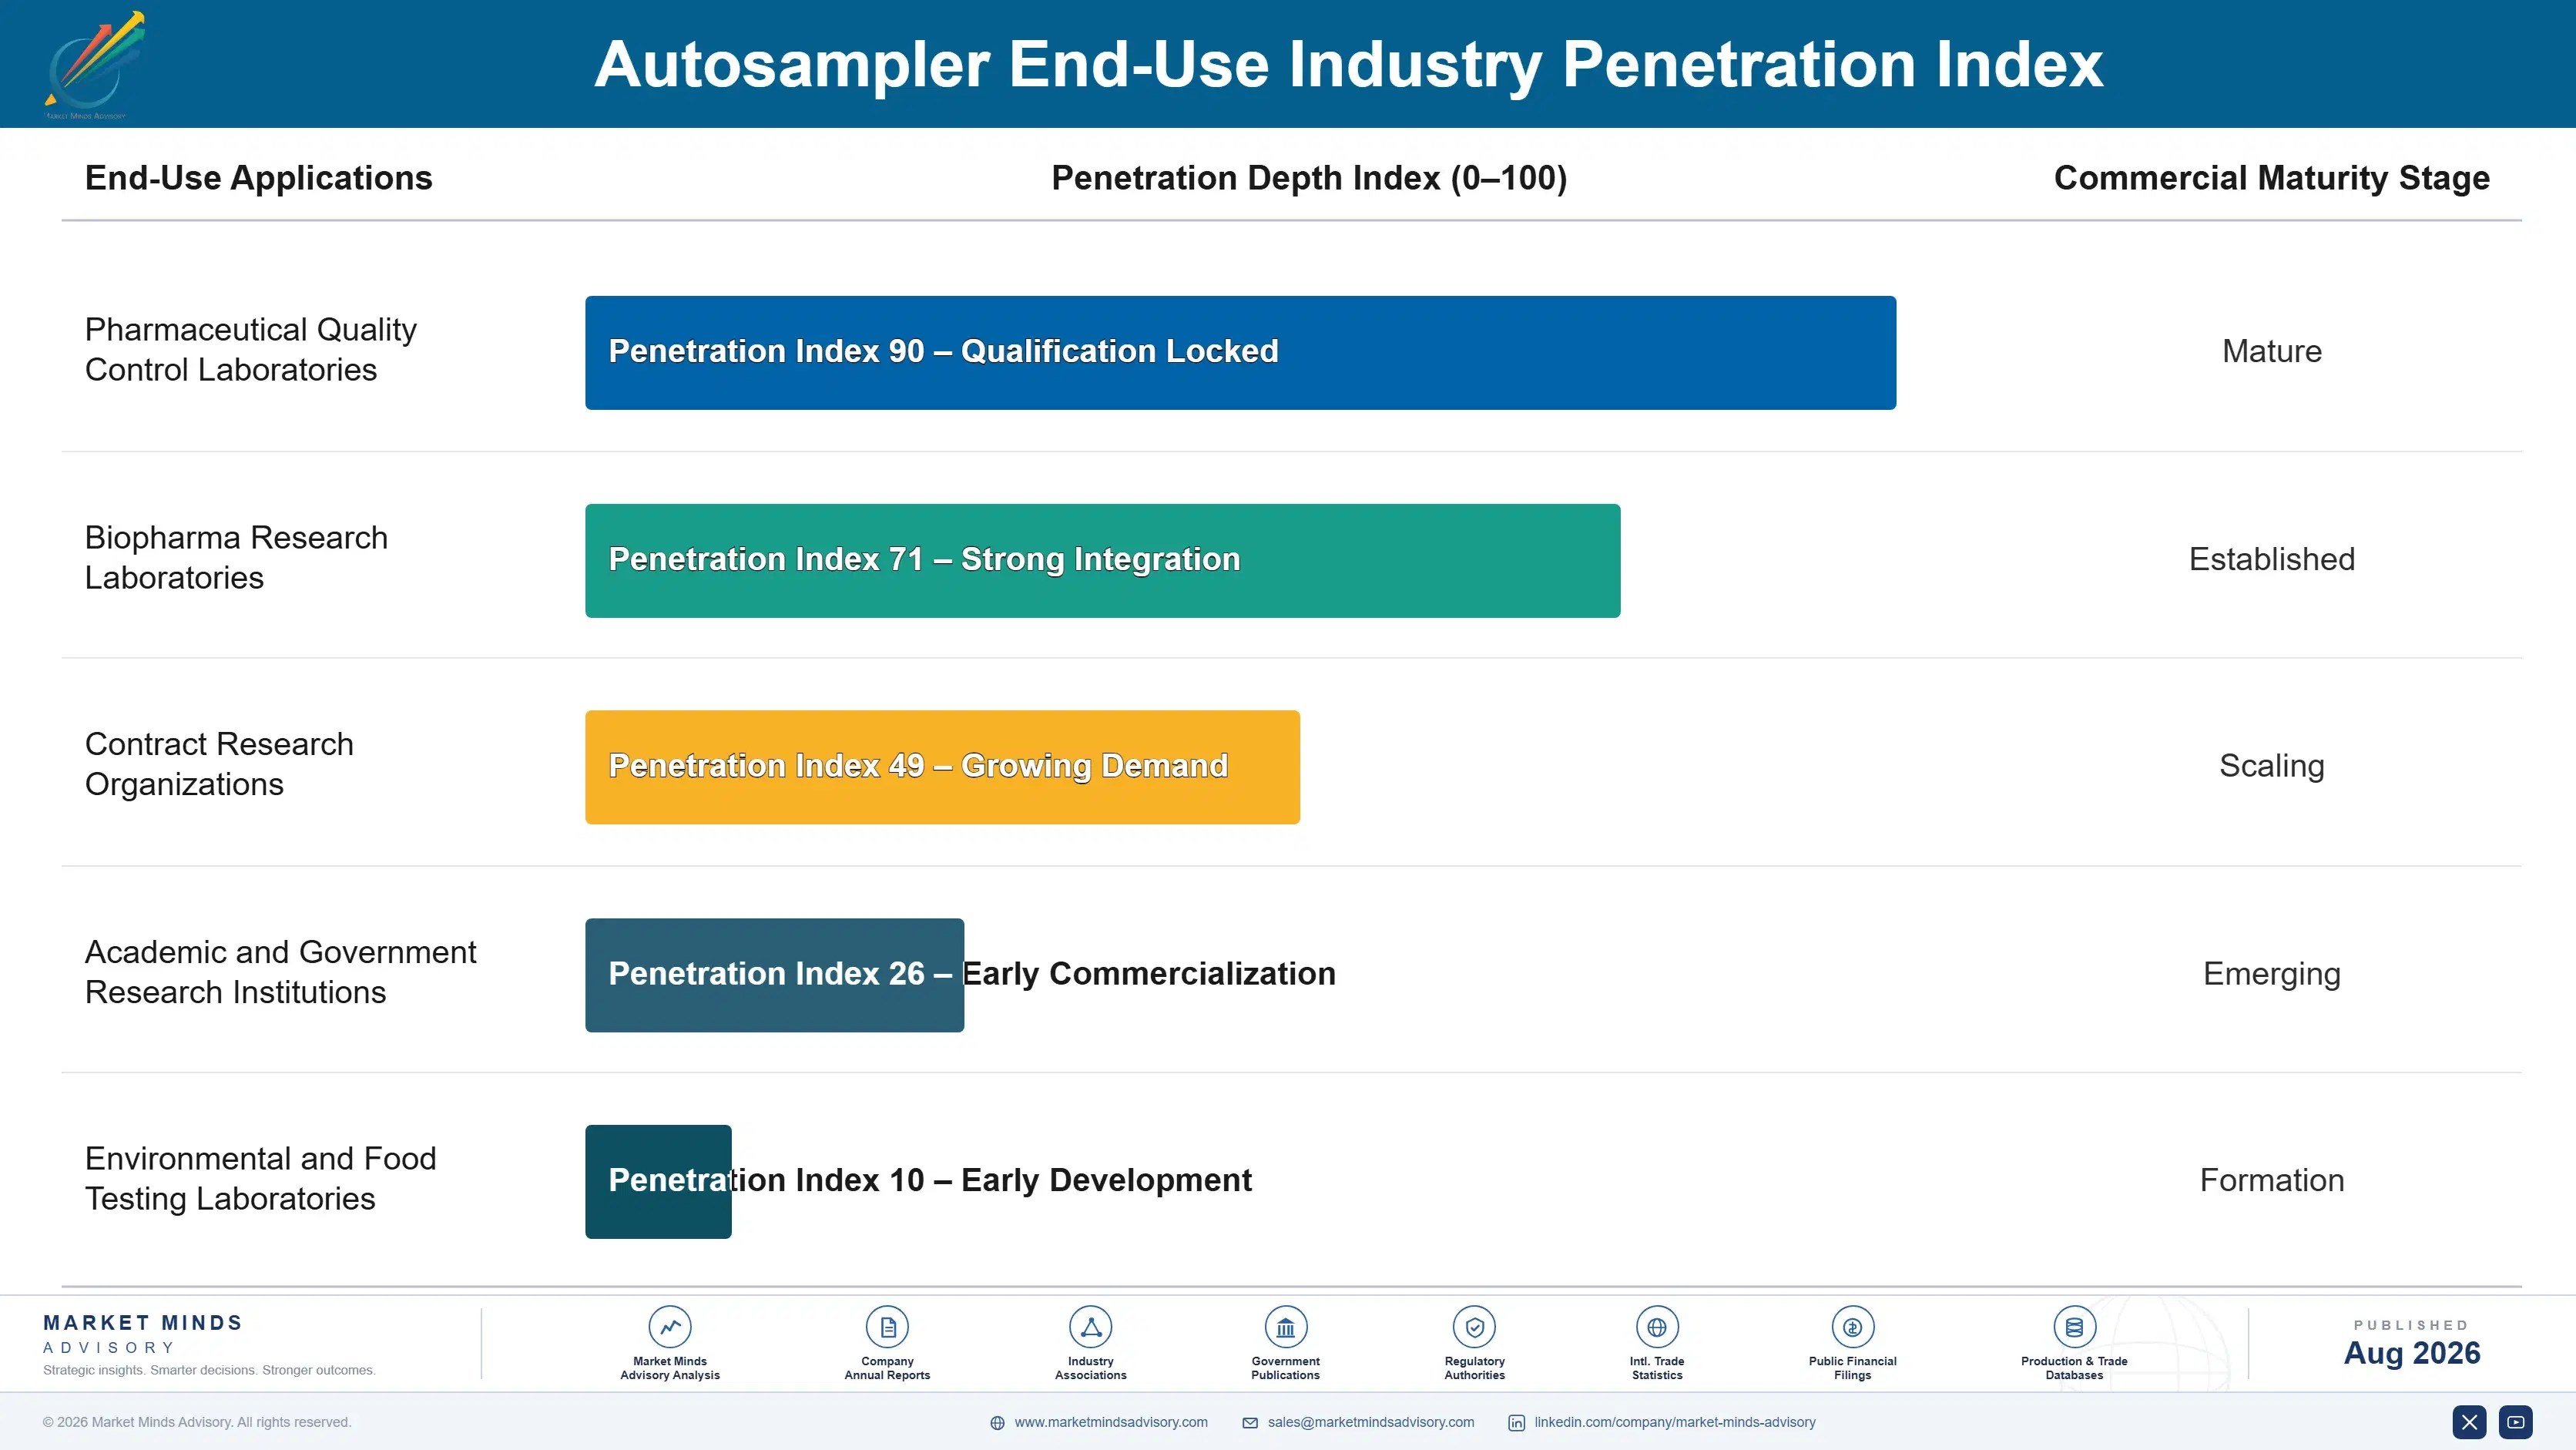
Instrument placement functions as an annuity anchor once a laboratory validates analytical methods on a specific platform: every subsequent test run generates recurring consumable and service revenue, and switching platforms requires costly method revalidation that regulated laboratories generally avoid unless existing instruments become unsupportable. Manufacturers increasingly price initial hardware competitively specifically to accelerate this downstream consumable relationship. This dynamic
Adoption depth varies considerably by laboratory type: pharmaceutical quality control and contract research laboratories adopt newer mass spectrometry-coupled and robotic platforms earliest, while academic and smaller commercial laboratories more often continue operating older standard configurations until capital budget cycles permit replacement. Manufacturers tailor commercial and technical support investment differently across each of these distinct laboratory tiers. Regional laboratory infrastructure maturity further shapes which instrument options laboratories realistically encounter first.

A generational shift is underway as analytical chemists trained during the mass spectrometry coupling era enter laboratory roles expecting integrated, software-connected instrument platforms as standard practice, gradually normalizing a workflow that earlier-trained chemists historically associated only with specialized, high-cost research applications. Manufacturers are adapting training and marketing investment accordingly to reach this newly influential chemist cohort.
autosampler-market-end-use-penetration-index-1787306601639

Where Autosampler Economics Are Heading Next

These are among the four positions where our research anticipates prominent divergence between winners and laggards over the coming forecast period. Each is grounded in the demand model, the regulatory perimeter, and the announced capacity pipeline.
01 / PLATFORM TECHNOLOGY TRANSITION

Mass spectrometry coupling will keep displacing standalone configurations

Laboratories converting to mass spectrometry-coupled autosampler platforms are setting a precedent that regulated testing protocols appear increasingly willing to formalize as standard practice, and this trajectory shows no sign of reversing given continued liquid chromatography-mass spectrometry method adoption. Standalone chromatography configurations will persist in applications not requiring mass spectrometry sensitivity rather than disappearing entirely. Manufacturers overweighted toward legacy standalone configuration revenue face a gradually shrinking core category over the coming decade regardless of overall market growth, across nearly every manufacturer portfolio MMA analysts reviewed this cycle.
02 / CONSUMABLES REVENUE STRATEGY

Recurring consumable revenue now determines category profitability

Manufacturers that treat instrument placement as the primary revenue event are underpricing the real value of the consumable attachment relationship that follows every sample run performed thereafter across the instrument's operational lifetime. The razor-and-blade model rewards companies willing to price instruments competitively while protecting consumable margins over the long laboratory relationship lifecycle. Expect further consolidation among manufacturers unable to sustain this recurring revenue model at meaningful scale within this rapidly consolidating analytical instrumentation category within this rapidly consolidating analytical instrumentation category worldwide.
03 / SOFTWARE INTEGRATION INVESTMENT

Software connectivity will become the primary competitive differentiator

Laboratory information management system integration and data analytics software are still an early revenue contributor today, but the workflow lock-in they create could eventually determine competitive positioning as much as hardware performance itself for laboratory purchasing decisions. Manufacturers without a credible software integration strategy risk ceding this emerging layer to specialized entrants. Expect software connectivity to become a standard bundled expectation rather than a differentiating extra within the next several years, particularly those competing for large laboratory network accounts, particularly those competing for the largest laboratory network accounts available.
04 / EMERGING MANUFACTURING INVESTMENT

Emerging market manufacturing expansion will sustain long-term volume growth

Government and private investment in domestic pharmaceutical manufacturing capacity across several emerging markets is directly expanding the addressable laboratory instrumentation base beyond what mature market replacement cycles alone could ever generate. Manufacturers investing early in distribution and support infrastructure across these markets are best positioned to capture this expanding volume. Expect emerging market volume growth to meaningfully outpace mature market growth through most of the current forecast period ahead, reshaping which manufacturers lead emerging market growth this decade, reshaping which manufacturers lead emerging market growth over this coming decade.

Engagement Snapshot From the Field

A live engagement with an industry participant carrying material or product regulatory and market exposure ahead of a defining policy shift, showing how our research translates into a defensible multi-year portfolio strategy.
MARKET MINDS ADVISORY · CLIENT ENGAGEMENT SUMMARY
Autosampler Producer Strategic Portfolio Review and Transition Roadmap 2026·Investment Scenario on Autosampler Exposure Evaluation 2025-26
CLIENT PROFILE
The client is a mid-sized contract research organization operating six analytical laboratories, generating combined annual autosampler procurement and service spend of approximately $4.8 million (client-reported, unverified by MMA). Leadership sought guidance on standardizing instrument platforms across its laboratory network to improve operational efficiency across its laboratory network prior to this engagement beginning across the network prior to this engagement beginning in early 2025.
STRATEGIC CHALLENGE
The organization's six laboratories used a fragmented mix of autosampler platforms inherited from separate facility acquisitions, and leadership was uncertain whether consolidating to a single standardized platform would generate meaningful efficiency gains without disrupting ongoing client testing programmes and method validations given ongoing client testing commitments across the network given ongoing client testing commitments across the network overall.
MMA APPROACH
MMA's team benchmarked comparable contract research organization consolidation outcomes, modeled projected procurement and service cost savings against method revalidation investment required across all six laboratories, and evaluated leading mass spectrometry-coupled platforms against the organization's existing client testing portfolio to inform the organization's final standardization decision to inform the organization's final standardization decision process.
KEY FINDINGS
  1. Consolidating to a single standardized platform was projected to reduce per-unit procurement costs by roughly 17% through volume-based manufacturer contracting across the network.
  2. Method revalidation investment was concentrated in the first four months following conversion, with minimal ongoing validation cost required after initial adoption across all six laboratories.
  3. Laboratories with the highest existing testing volume showed the fastest payback period on revalidation investment, making them logical priority candidates for early conversion phases.
  4. Standardization was projected to improve service contract efficiency considerably, reducing the administrative burden of managing multiple manufacturer relationships network-wide across the full laboratory network studied.
CLIENT PROFILE
The client is a mid-sized contract research organization operating six analytical laboratories, generating combined annual autosampler procurement and service spend of approximately $4.8 million (client-reported, unverified by MMA). Leadership sought guidance on standardizing instrument platforms across its laboratory network to improve operational efficiency across its laboratory network prior to this engagement beginning across the network prior to this engagement beginning in early 2025.
STRATEGIC CHALLENGE
The organization's six laboratories used a fragmented mix of autosampler platforms inherited from separate facility acquisitions, and leadership was uncertain whether consolidating to a single standardized platform would generate meaningful efficiency gains without disrupting ongoing client testing programmes and method validations given ongoing client testing commitments across the network given ongoing client testing commitments across the network overall.
MMA APPROACH
MMA's team benchmarked comparable contract research organization consolidation outcomes, modeled projected procurement and service cost savings against method revalidation investment required across all six laboratories, and evaluated leading mass spectrometry-coupled platforms against the organization's existing client testing portfolio to inform the organization's final standardization decision to inform the organization's final standardization decision process.
KEY FINDINGS
  1. Consolidating to a single standardized platform was projected to reduce per-unit procurement costs by roughly 17% through volume-based manufacturer contracting across the network.
  2. Method revalidation investment was concentrated in the first four months following conversion, with minimal ongoing validation cost required after initial adoption across all six laboratories.
  3. Laboratories with the highest existing testing volume showed the fastest payback period on revalidation investment, making them logical priority candidates for early conversion phases.
  4. Standardization was projected to improve service contract efficiency considerably, reducing the administrative burden of managing multiple manufacturer relationships network-wide across the full laboratory network studied.
RECOMMENDED STRATEGY
Phase 1: Phase 1 (Months 1-4): Convert the two highest-volume laboratories first, using their experience to refine revalidation procedures for later phases. Phase 2: Phase 2 (Months 5-9): Convert the next three laboratories in order of testing volume, applying lessons learned from the initial conversion phase throughout. Phase 3: Phase 3 (Months 10-12): Complete conversion at the remaining laboratory, finalizing network-wide standardization and service contracting and finalize service agreements network-wide.
OUTCOME
The organization completed conversion across all six laboratories within the recommended twelve-month timeline, reporting a 15% reduction in annual instrumentation procurement and service costs network-wide (client-reported, unverified by MMA) while maintaining consistent testing quality across every laboratory location involved throughout while maintaining consistent testing quality across every laboratory location throughout the transition.

Frequently Asked Questions

Foundational context covering the market sizes, CAGR, scope, country, region and competition that inform every finding below. This section is provided to cover basics and most often pre-purchase conversations, answered from the MMA Primary Research Dataset.

What is the current size of the Autosampler Market?

The global autosampler market was valued at approximately $1.2 billion in 2025. This includes liquid chromatography, gas chromatography, and mass spectrometry-coupled autosampler platforms sold across pharmaceutical, biopharma, and academic research channels combined.

How large will the Autosampler Market be by 2036?

The market is projected to reach approximately $2.33 billion by 2036. This reflects continued mass spectrometry coupling adoption and expanding biopharma testing demand worldwide under continued mass spectrometry coupling and biopharma testing growth.

What is the CAGR for the Autosampler Market 2026 to 2036?

The market is expected to grow at a compound annual growth rate of 6.2% between 2026 and 2036. This reflects steady demand from pharmaceutical quality control and research laboratories.

Which segment is growing fastest?

Mass spectrometry-coupled autosamplers are the fastest-growing segment, expanding at approximately 9.8% annually. This reflects growing adoption of liquid chromatography-mass spectrometry testing methods over standalone chromatography configurations still widely used today.

Who are the major companies in the Autosampler Market?

Leading companies include Agilent Technologies, Thermo Fisher Scientific, Waters, Shimadzu, and Revvity. Together they account for roughly 68% of global instrument revenue across the broader analytical instrumentation category worldwide.

Which country is growing fastest?

China is the fastest-growing major market at an estimated 9.2% CAGR, driven by rapidly expanding pharmaceutical manufacturing capacity and quality control infrastructure investment across its rapidly modernizing pharmaceutical manufacturing sector.

Report Segmentation Architecture

The full report scope spans multiple orthogonal segmentation dimensions, with cross-tabulated demand data provided for each dimension pair. Coverage extends further to regional breakdowns, trend trajectories, and the competitive detail needed to support segment-level decision-making.

By Application Technology

  • Liquid Chromatography Autosamplers
  • Gas Chromatography Autosamplers
  • Mass Spectrometry-Coupled Autosamplers
  • Robotic Liquid Handling Autosamplers
  • Headspace and SPME Autosamplers
  • Software and Data Integration Systems

By End-Use Industry

  • Pharmaceutical Quality Control Laboratories
  • Biopharma Research Laboratories
  • Contract Research Organizations
  • Academic and Government Research Institutions
  • Environmental and Food Testing Laboratories

By Commercial Dimension

  • Direct Laboratory Procurement
  • Group Purchasing Organizations
  • Distributor Networks
  • Service and Financing Programmes

By Region

  • North America
  • Western Europe
  • East Asia
  • South Asia and Pacific
  • Latin America
  • Middle East and Africa
  • Eastern Europe

Scope, Methodology, and Coverage

Every figure in this report is reproducible from documented input assumptions. The scope below maps the historical period, the forecast horizon, the segmentation dimensions, and the countries covered, alongside the underlying primary and qualitative methodology.
Historical Period
2020 to 2025
Forecast Period
2026 to 2036
Base Year
2025 (USD billions; MMA Primary Research Dataset, August 2026)
Market Definition
This report covers automated sample injection instruments used specifically in liquid chromatography, gas chromatography, and mass spectrometry analytical workflows, including robotic liquid handling autosamplers and associated software and data integration systems. It excludes the chromatography and mass spectrometry instruments themselves and general laboratory liquid handling equipment.
Quantitative Units
USD billions (current prices); instrument unit shipments; average selling price per unit
Segmentation Dimensions
By Application Technology; By End-Use Industry; By Commercial Dimension; By Region
Regions Covered
North America, Western Europe, East Asia, South Asia and Pacific, Latin America, Middle East and Africa, Eastern Europe
Countries Covered
USA, China, Germany, France, UK, Japan, South Korea, India, Australia, Canada, Brazil, Mexico, Indonesia, Vietnam, Thailand, Malaysia, UAE, Saudi Arabia, South Africa, Nigeria, Turkey, Poland, Netherlands, Italy, Spain, Sweden, Switzerland, Argentina, Colombia, Singapore, and additional markets relevant to this sector
Key Companies Profiled
Agilent Technologies Inc., Thermo Fisher Scientific Inc., Waters Corporation, Shimadzu Corporation, Revvity Inc., Bruker Corporation, Danaher Corporation, SCIEX, Gilson Inc., Tosoh Corporation, JASCO Inc., Hitachi High-Tech Corporation, Restek Corporation, Teledyne Technologies Incorporated, LECO Corporation, Anton Paar GmbH, Metrohm AG, Spark Holland B.V., Analytik Jena GmbH, CTC Analytics AG
Quantitative Methodology
Primary survey, n=3,800 respondents, Q4 2025, six countries; demand-side model with trade association cross-validation
Qualitative Methodology
47 expert interviews, Q4 2025; applied to validate demand model assumptions, identify emerging dynamics, and assess competitive positioning
Report Format
PDF and XLSX data workbook (Word format preview document)
Publisher
Market Minds Advisory
Report Code
MMA-2026-CHM-127
Published
August 2026
Contact
sales@marketmindsadvisory.com | www.marketmindsadvisory.com

Purchase the full Autosampler Market Report (2026 to 2036).

The full report provides detailed technology-level segmentation, laboratory procurement pattern analysis, and country-level manufacturing investment tracking across all seven regions covered in this study. It includes manufacturer-level competitive benchmarking based on software integration and service infrastructure. Subscribers receive quarterly updates tracking new product launches and laboratory capacity investment as they occur. A companion dataset provides instrument unit volume estimates by application for detailed market sizing purposes A dedicated analyst contact is also available to support custom data requests beyond the standard deliverable scope provided Custom analytical support is available upon request.
Technology-level segmentation breakdown by application type
Laboratory procurement pattern trend analysis service
Country-level manufacturing investment tracking and updates
Manufacturer competitive benchmarking scorecards and comparisons
Quarterly product launch and investment update service
Instrument unit volume dataset by application

Built For The People Who Decide

From boardroom strategy to bench-side execution, this report is read cover-to-cover by leaders shaping the next decade of their industry, turning demand scenarios, market dynamics and valuation benchmarks into decisions.
CXOs/ Presidents/ VPs/ Managers
M&A and Corporate Development
Strategy Teams and R&D Heads
Procurement and Product Directors
Regulatory and Compliance Leaders
Investor Relations and Equity Analysts