Market Minds Advisory
Automotive Display Units Market

Automotive Display Units Market: Cockpit Digitization, Panel Technology, and Supplier Positioning Through 2036

Digital cockpits are replacing analog gauges and physical switchgear across nearly every vehicle segment, pulling automakers into a display race over screen count and brightness even as oversupply squeezes margin for suppliers without differentiated technology.

Lead Analyst

David Horsley

Published

September 2026

Make Smarter Decisions with Customized Research Insights

Request a free sample report and evaluate market opportunities, growth trends, and competitive dynamics relevant to your business needs.

2025 MARKET VALUE$29.0BMarket Size 2025
2036 FORECAST VALUE$87.0BBase Case , 2026 to 2036
CAGR 2026 TO 203610.5 %Bull 11.8% / Bear 9.2%
INCREMENTAL OPPORTUNITY$54.9BNet 10- year value creation
EXPANSION MULTIPLE2.71x2036 value over 2026 base
Strategic Levers
M&A Pipeline
Regional Outlook
Country Rankings
Competitive Intelligence
Segmental Deep-dive
Call-Us : 91 93563 13602

Executive Snapshot and Market Trajectory

Screen count per vehicle has become a competitive marketing metric in its own right, pushing automakers to add displays even in trim levels where analog gauges once sufficed, and that shift is now the single largest driver of cockpit electronics spending industry-wide. That single metric now shapes trim-level pricing decisions.
Head-up displays are absorbing the fastest growth as automakers use windshield-projected information to differentiate premium trims without adding visible screen clutter to the dashboard. East Asia dominates both panel manufacturing and vehicle production, with Chinese OEMs specifying pillar-to-pillar curved displays on mainstream models years before European or American competitors reach equivalent trim levels, compressing the technology diffusion timeline the industry once assumed would take a decade.
Panel suppliers are consolidating around OLED and mini-LED technology as LCD margins compress under oversupply, while automakers increasingly demand software-defined display architecture that separates hardware procurement from the user interface layer suppliers used to control end to end. That separation is reshaping who actually captures value in the cockpit, since interface design and update cadence now matter as much to the customer as panel brightness or resolution ever did. That shift is accelerating.
Market Definition
The automotive display units market covers digital instrument clusters, center stack infotainment screens, head-up displays, rear-seat entertainment panels, and curved or pillar-to-pillar display assemblies sold into passenger and commercial vehicles. It excludes aftermarket screens, standalone navigation devices not integrated into the vehicle electrical architecture, and consumer tablets mounted as accessories.
Base Year Value
$29.0B in 2025 (MMA Primary Research Dataset, August 2026)
Forecast Period
2026 to 2036, eleven discrete annual values
CAGR
10.5% base case. Bull 11.8%. Bear 9.2%.
Fastest Growth Segment
Head-Up Displays (HUD): 13.5% CAGR
Fastest Growth Country
China: 12.8% CAGR
Fastest Growth Region
South Asia and Pacific: 12.5% CAGR
Largest Region
East Asia: 30% of 2025 global value
Market Leaders
LG Display, Samsung Display, BOE Technology Group, Continental AG, and Visteon lead by disclosed automotive display shipment volume. Source: MMA Analysis based on company annual reports.
Primary Survey
n=3,800 procurement and R&D decision-makers, Q4 2025, six countries
Methodology
Demand-side build-up, cross-validated against public data, 47 expert interviews

Automotive Display Units Market Forecast Scenarios

automotive-display-units-market-trends-size-forecast-scenario-1787314681728
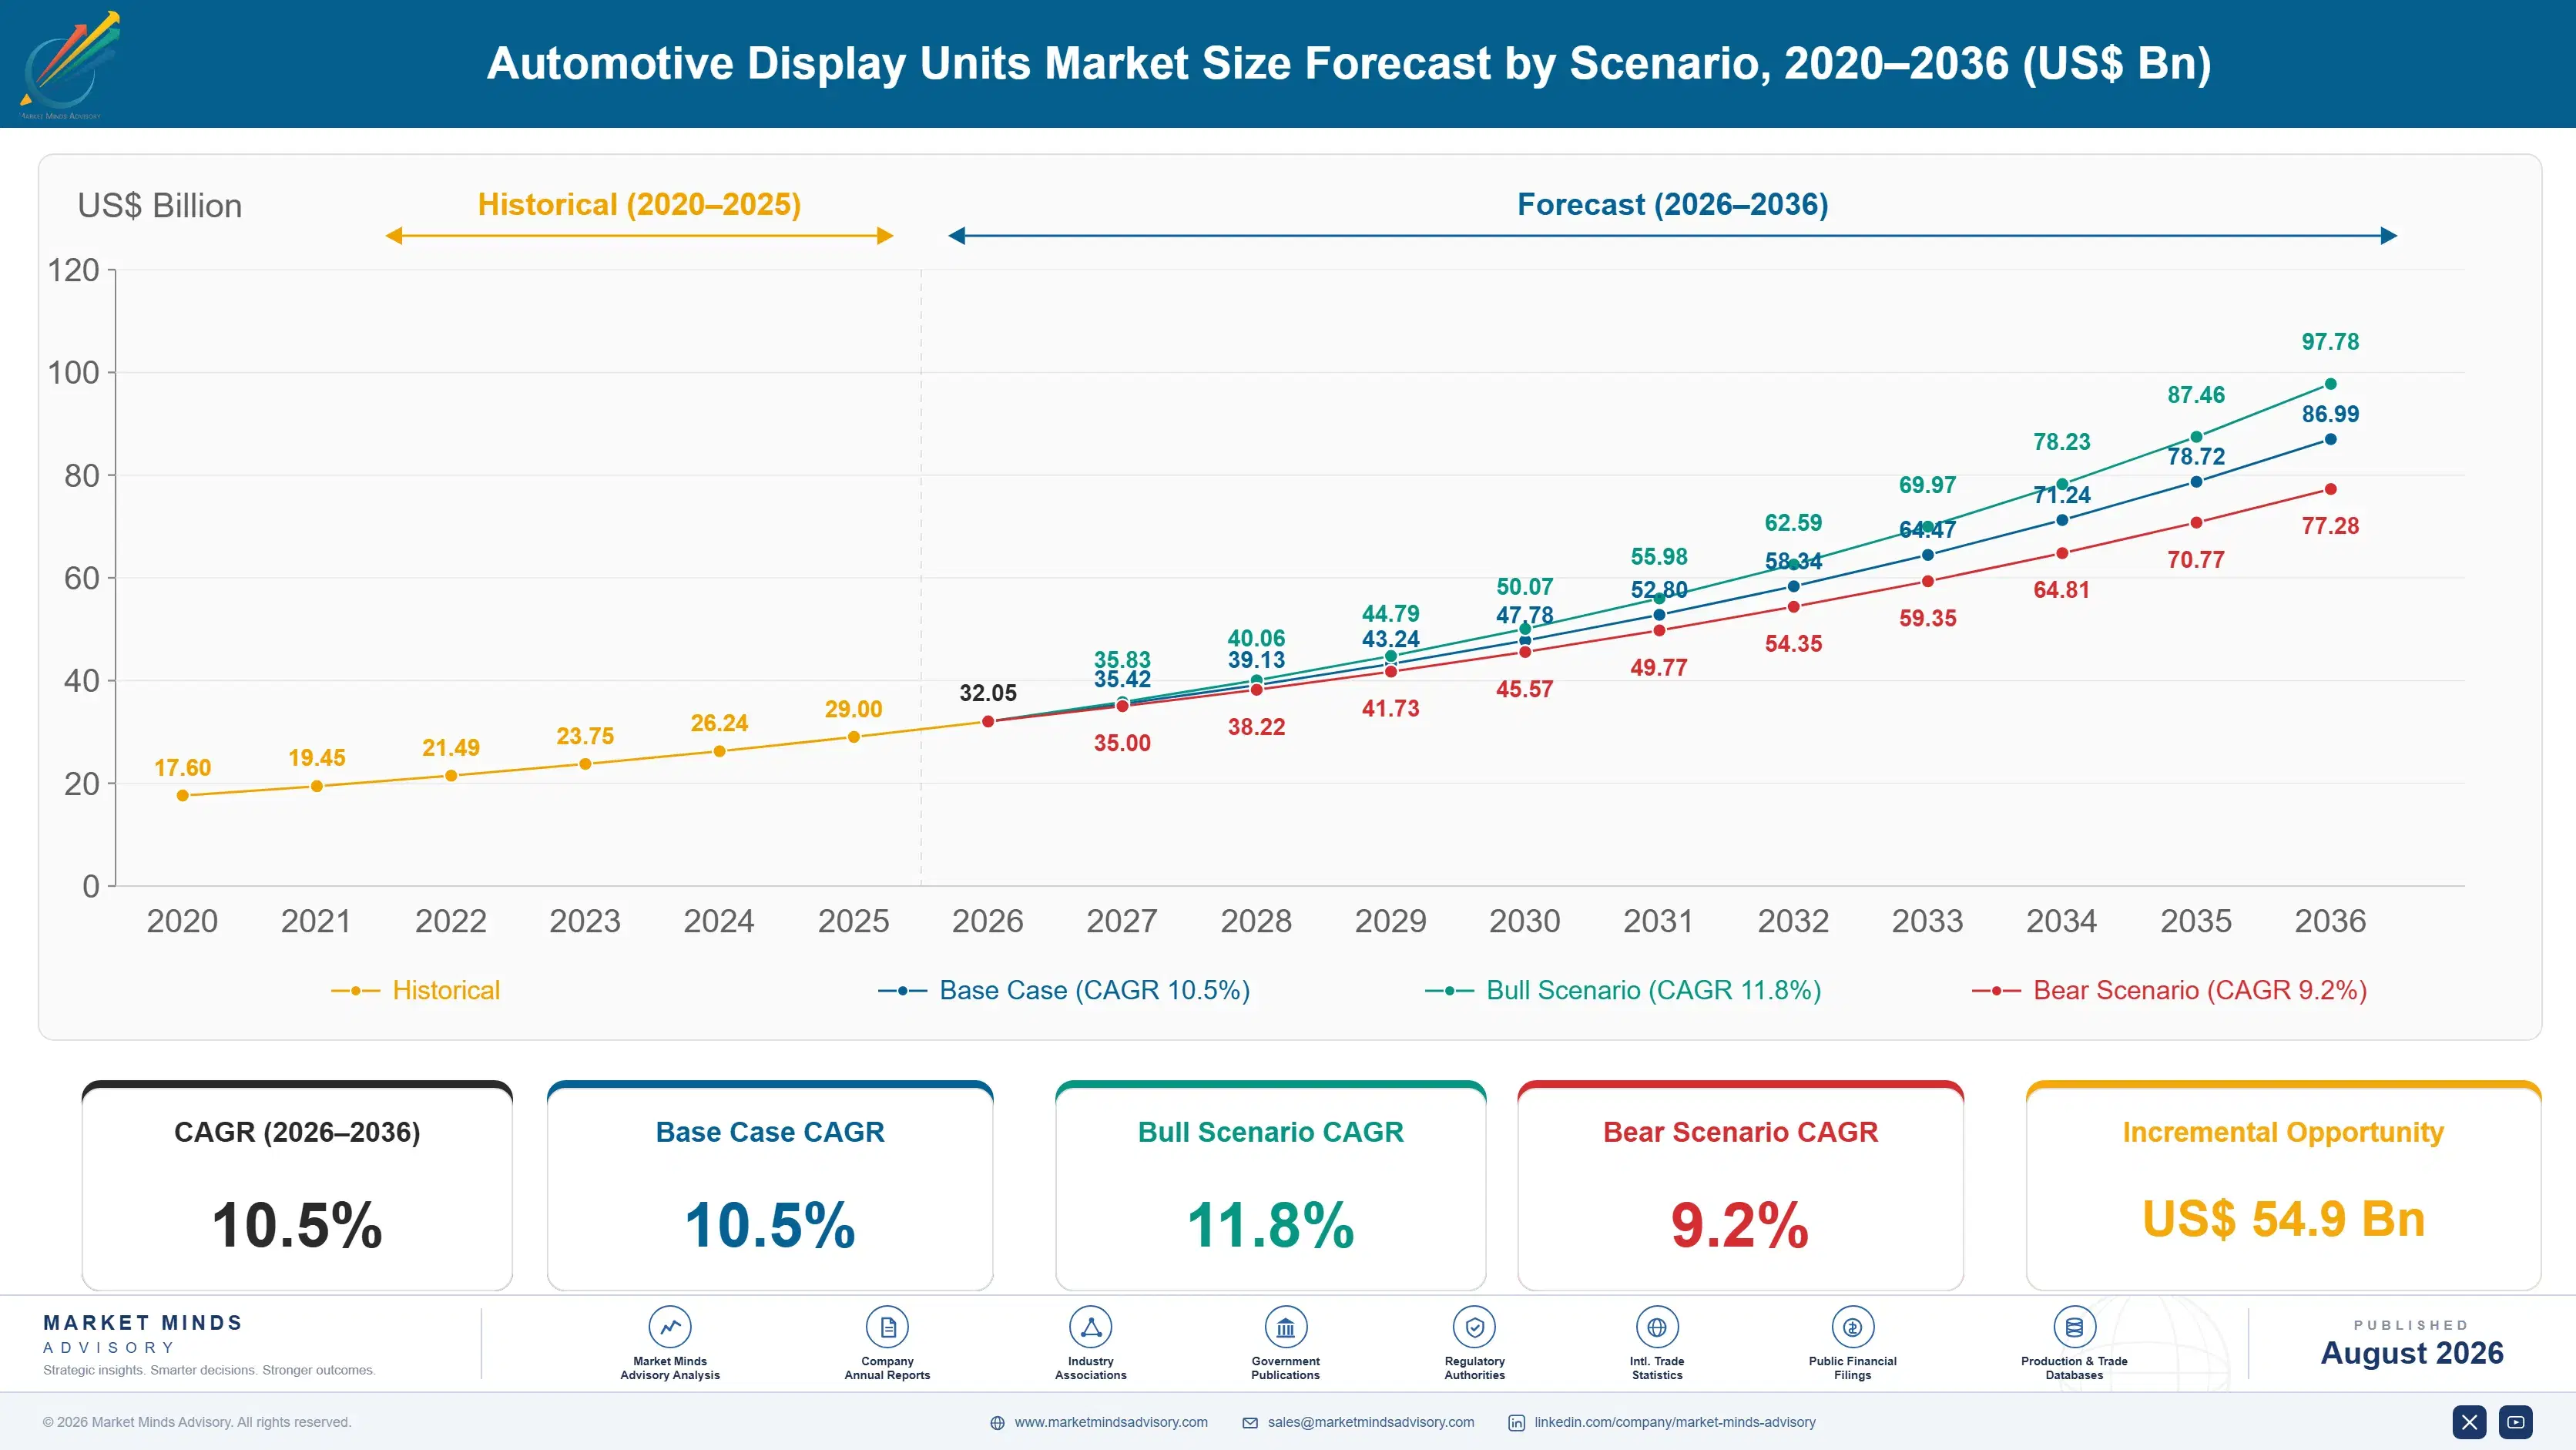
Between 2020 and 2025 display adoption accelerated steadily as touchscreen infotainment became a baseline expectation across nearly every price segment, though the shift to curved and pillar-to-pillar formats only began gaining real production volume in the final two years of that window. Supplier order books through that period show unit value rising faster than raw screen count.
The base case assumes continued growth in average screen count per vehicle, a steady technology mix shift from LCD toward OLED and mini-LED as cost curves fall, and expanding regulatory pressure in Europe and China for digital driver information displays that meet stricter visibility and glare standards. These three mechanisms together keep unit value rising even as vehicle production growth itself stays comparatively modest, widening the gap between display market and vehicle output growth.
The bull case rests on faster than expected OLED cost declines pulling premium display technology into mainstream vehicle trims ahead of schedule. The bear case is a prolonged consumer pushback against screen-heavy cockpits, reinforced by regulatory scrutiny over driver distraction, that stalls the multi-screen trend in mid-market vehicle segments specifically and pushes some automakers back toward simpler layouts.

Screen Count Economics and the Digital Cockpit Shift

Vehicle cockpits have shifted from a handful of discrete gauges to integrated glass surfaces spanning the full dashboard width, a transition automakers now treat as a brand signature rather than an optional feature. That shift compresses design cycles because software and display hardware must now be co-developed rather than sourced sequentially the way legacy instrument clusters once were. Few cockpit components carry comparable visibility to the customer.
MARKET CONCENTRATIONCR5 55%top five panel suppliers hold majority combined share
AVERAGE SELLING PRICE$142 per display unitblended average price across cluster and infotainment panels
LEADING PRODUCTION COUNTRYChina, 34% sharepanel fabrication concentrated near assembly and export hubs
CAPACITY UTILISATION71%automotive-grade OLED production lines still ramping upward steadily
DISPLAY COST SHARE6% of vehicle BOMcockpit electronics now a meaningful bill of materials line
TRADE INTENSITY58% cross-borderpanel fabrication and vehicle assembly rarely share a country
The market's commercial character splits between commodity LCD panels competing almost entirely on price and a smaller, faster-growing OLED and mini-LED segment competing on brightness, contrast, and curvature. Suppliers serving the two tiers increasingly operate as distinct businesses, since OLED automotive qualification requires reliability testing under thermal and vibration conditions that commodity consumer-electronics suppliers rarely have to meet. That qualification gap is becoming a genuine moat.
The next decade will be shaped by software-defined cockpit architecture that decouples the display panel from the user interface running on it, by continued OLED cost declines, and by regulatory pressure on driver distraction that could cap unchecked screen proliferation. Suppliers that control both panel and software layers together are positioned to capture disproportionate value as the architecture shift plays out.
"Automakers love adding screens because customers can see them on the showroom floor. What they cannot see is which supplier actually owns the software running underneath, and that is where the real margin is moving."
Director, Automotive Electronics Practice · MMA Automotive Electronics and Cockp

Market Trends

Pillar-to-Pillar Curved Displays Reaching Mainstream Trims

Curved, pillar-to-pillar display assemblies spanning the full dashboard width have moved from flagship EV concept cars into mainstream production trims since 2023, led by Chinese OEMs specifying the format on vehicles priced well below premium segments. At least eleven mass-market models launched globally since 2024 now offer a pillar-to-pillar configuration as a standard or low-cost optional feature, up from a handful of ultra-premium references in 2021. Suppliers report this format now commands roughly 35 percent higher unit value than a comparable set of discrete screens, making it the fastest-scaling revenue category in the broader display portfolio this decade.
Market Impact: Covers 80 percent of new registrati
Software-Defined Display Architecture Decoupling Hardware and UI

Automakers are increasingly specifying display hardware and user interface software from separate suppliers, a shift enabled by standardized middleware that lets the same physical panel run interfaces from multiple software vendors across a vehicle platform's lifecycle. This decoupling has already affected sourcing at four major automakers since 2024, who now run competitive software bids independent of the hardware supply contract. The shift threatens legacy display suppliers whose margin depended on bundling proprietary software with panel hardware, while creating an opening for software specialists with no prior automotive hardware business at all.
Market Impact: Increases screen area 40 percent

Market Opportunities and Growth Drivers

Regulatory Push for Digital Driver Information Displays

UN Regulation No. 121 and evolving EU General Safety Regulation provisions are pushing automakers toward digital instrument clusters capable of dynamically reconfiguring warning displays, a functional requirement analog gauges cannot meet at all. China's GB standards for driver information systems, tightened for 2026 model years, add similar digital display requirements across a fleet-average compliance threshold covering at least 80 percent of new registrations. Compliance timelines are compressing the window automakers have to phase out analog cluster options entirely, pulling forward digital cluster adoption by roughly two to three model years across multiple regions simultaneously.
Market Impact: Forces redesign on flagged 2026 mod

EV Platforms Using Screens to Replace Physical Switchgear

Electric vehicle platforms are removing physical buttons and switchgear at a faster rate than internal combustion platforms, consolidating climate, drive mode, and infotainment controls onto larger touchscreen surfaces to simplify wiring harness design and cut assembly cost. This consolidation has increased average screen surface area per EV by roughly 40 percent since 2021 relative to comparable combustion models from the same automaker. The economics favor the automaker even when the display bill of materials rises, since eliminated switchgear and simplified wiring harnesses save more in assembly cost than the added screen area costs to source.
Market Impact: Leaves OLED at 2.5x cost

Market Restraints and Challenges

Driver Distraction Regulation Threatens Unchecked Screen Growth

Euro NCAP's 2026 safety rating protocol penalizes vehicles that route core functions like hazard lights, wipers, and horn exclusively through touchscreen menus, a root cause tied to rising driver distraction incident data collected across multiple European markets since 2022. The commercial impact falls on automakers that had planned to eliminate physical controls entirely, forcing costly late-stage redesigns to reintroduce at least some tactile switchgear for safety-critical functions. Several automakers are now pursuing hybrid interfaces that keep a small number of physical controls alongside larger displays, limiting how far consolidation can go.
Market Impact: Adds 35 percent unit value premium

OLED Cost Premium Still Limits Mass-Market Penetration

Automotive-grade OLED panels still cost roughly 2.5 to 3 times comparable LCD panels once thermal and vibration qualification is included, a root cause tied to lower production yields on automotive-spec panels relative to high-volume consumer electronics lines. The commercial impact confines OLED to premium and flagship trims, leaving the large mid-market vehicle segment dependent on LCD even as consumer expectations set by smartphones push toward OLED-quality contrast and color. Panel makers are pursuing mini-LED as an intermediate mitigation path, offering LCD-adjacent cost with OLED-adjacent visual performance, with several programs targeting cost parity with premium LCD by 2028.
Market Impact: Shifts sourcing at 4 major automake
3 additional market trends, 4 additional growth drivers, and 3 additional restraints and challenges are covered in the full report. Contact sales@marketmindsadvisory.com to access the complete intelligence.

Segment CAGR and Growth Architecture

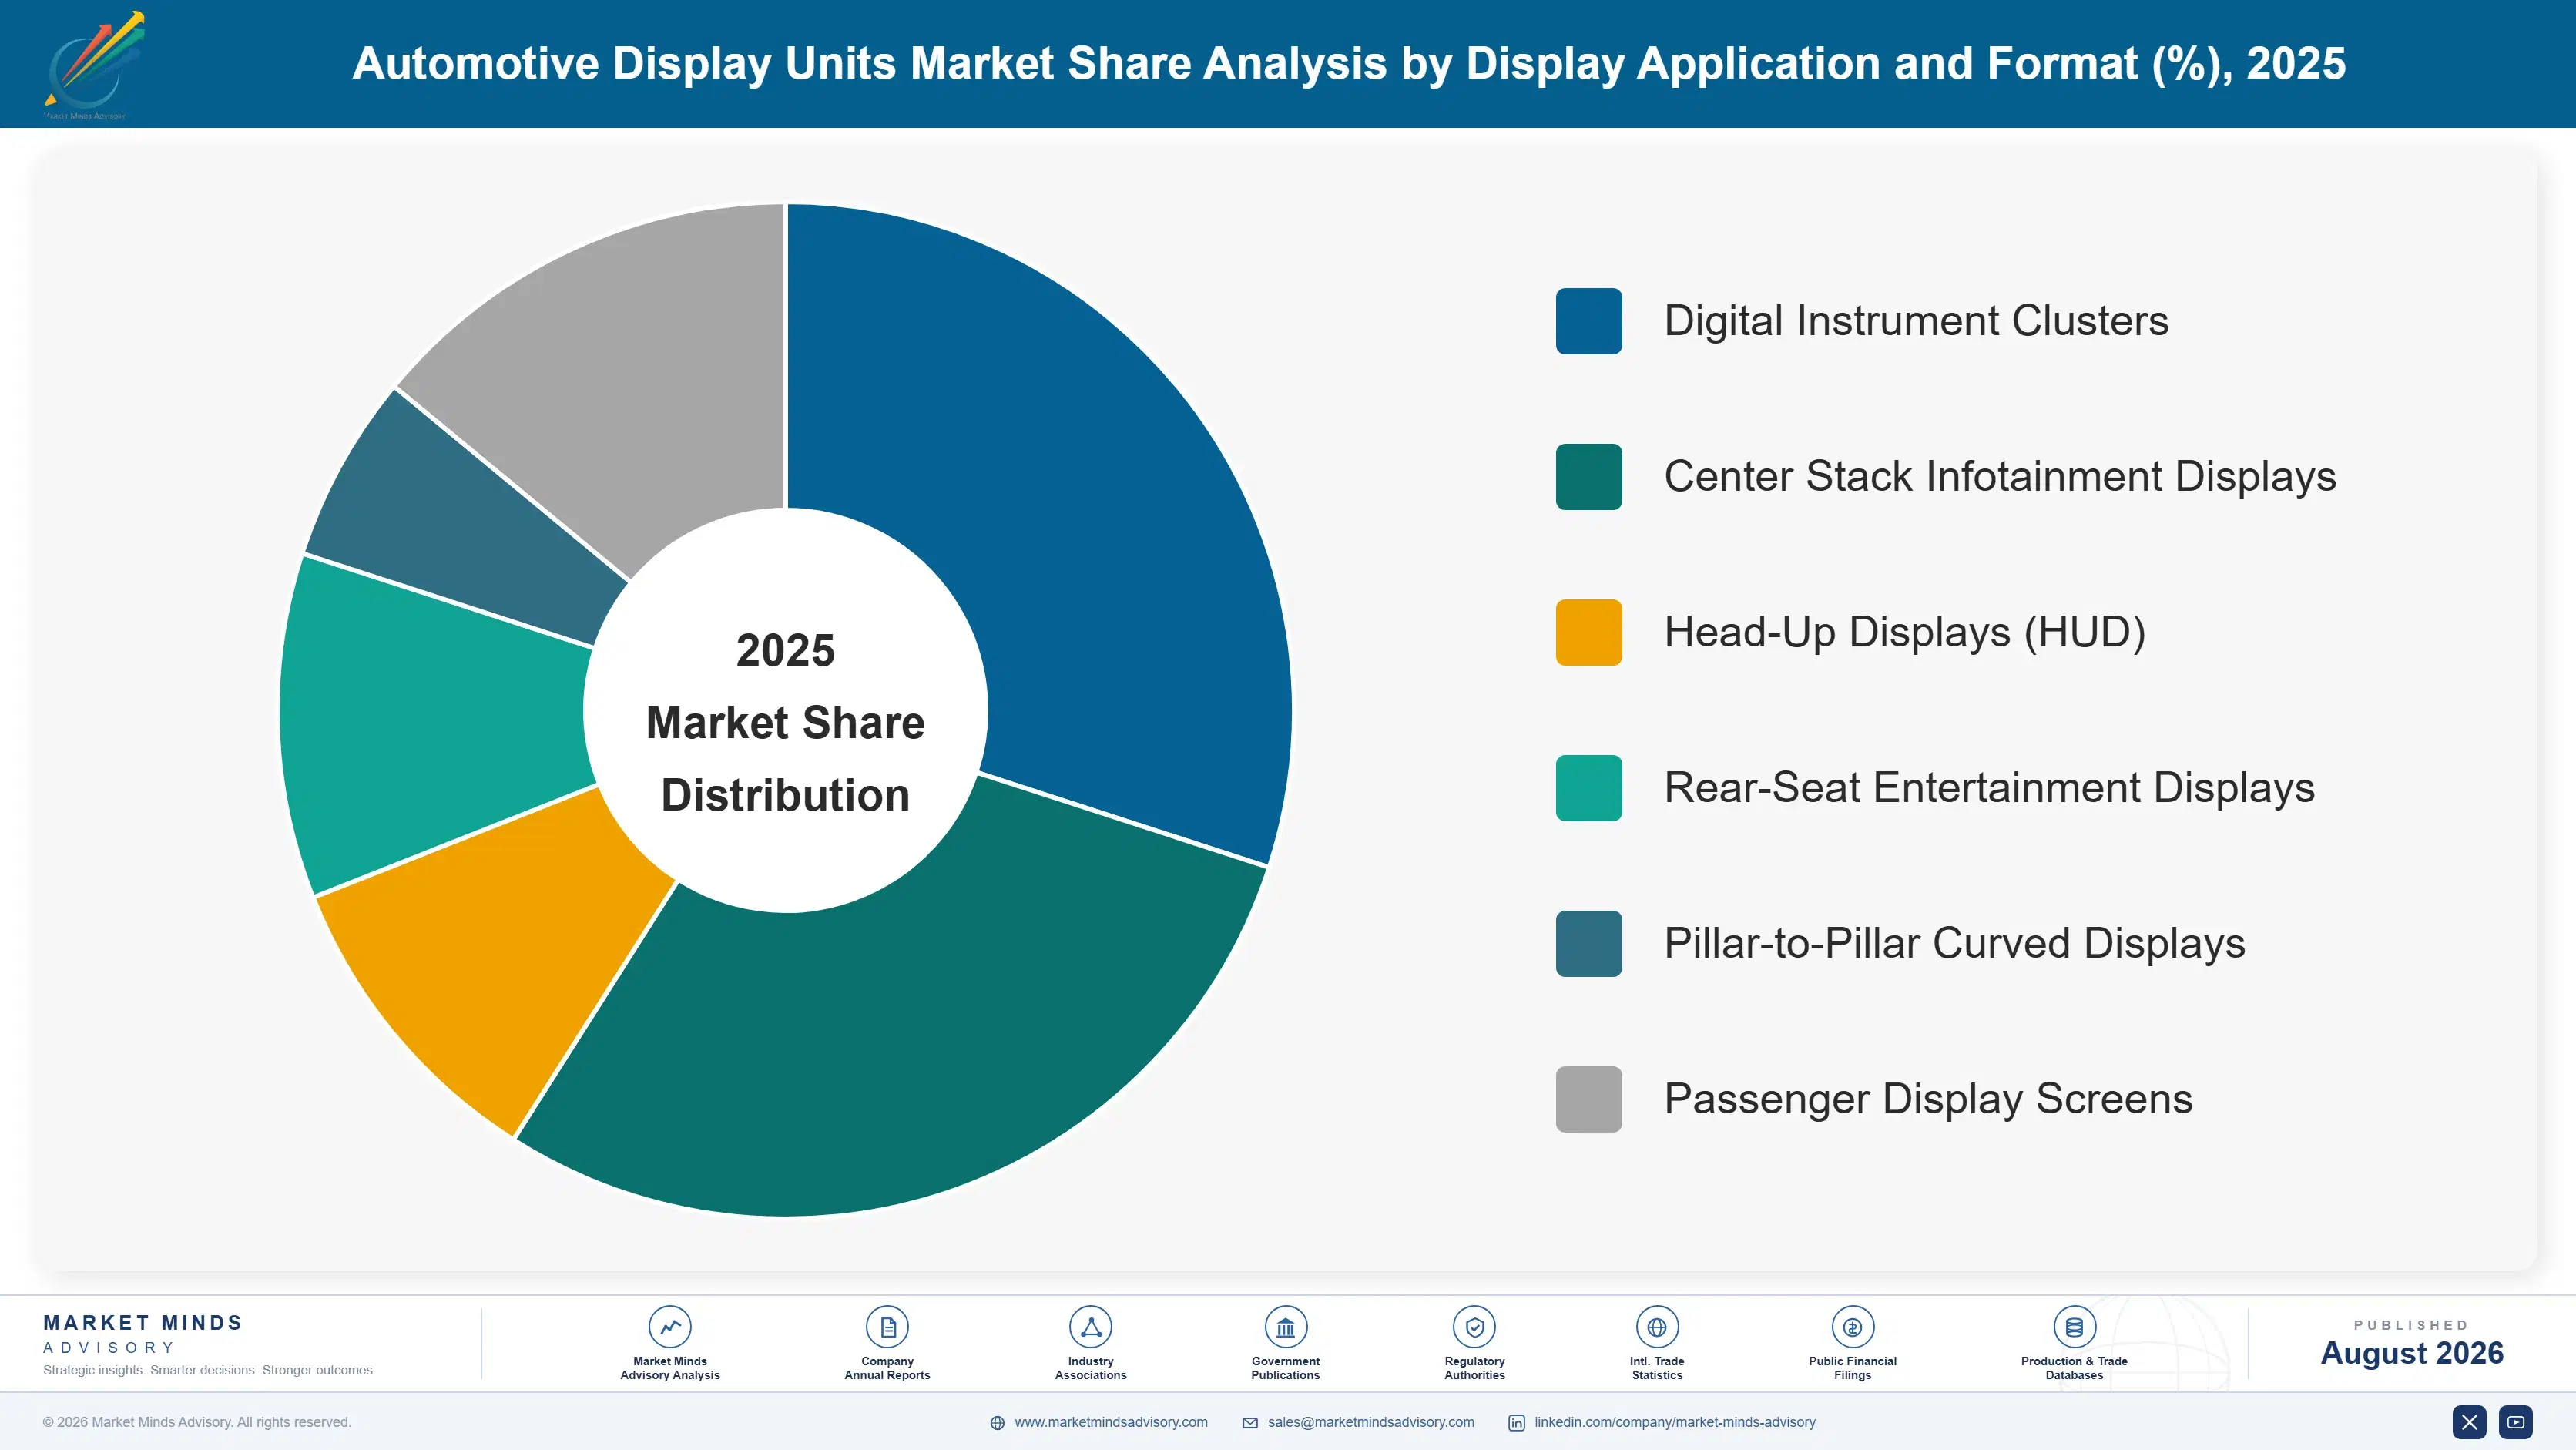
Segmentation follows display application and format rather than panel chemistry, since automakers specify displays by cockpit function first and negotiate the underlying panel technology afterward as a cost and performance tradeoff. This approach also matches how procurement teams structure supplier bidding and design review across a vehicle program's development cycle from concept through launch.
automotive-display-units-market-trends-market-share-analysis-1787314682425

Head-Up Displays (HUD)

Head-up displays are growing fastest as automakers use windshield or combiner-projected information to add functionality without increasing visible screen count on the dashboard, a differentiator that appeals particularly to premium buyers wary of cockpit clutter. Augmented-reality HUD systems that overlay navigation directly onto the road view are pulling the segment upmarket, commanding meaningfully higher unit pricing than first-generation monochrome HUD units sold a decade ago. Adoption is spreading from flagship models into upper-mid trims as optics module costs fall and windshield glass suppliers develop compatible substrates at greater production scale. The segment remains technically demanding enough that only a handful of suppliers can currently deliver automotive-qualified AR-HUD systems at production volume, keeping competitive intensity lower than in commodity display categories.
CAGR 13.5%

Pillar-to-Pillar Curved Displays

Pillar-to-pillar curved display assemblies combine what used to be separate cluster and infotainment screens into a single continuous glass surface, a format that Chinese EV makers popularized and are now pushing into mainstream price segments faster than Western competitors are matching. The format commands a substantial unit value premium over discrete screens while simplifying bezel and mounting hardware, which partly offsets the higher panel cost. Manufacturing curved glass at automotive volume remains a meaningful yield challenge, favoring suppliers with established curved-panel expertise transferred from premium smartphone and television production. Growth is concentrated in China and increasingly Europe, with North American adoption lagging as automakers there prioritize other differentiation strategies for now.
CAGR 12.0%
Full segment breakdown across 6 segments available in the complete report.

Regional Architecture and Country Demand Map

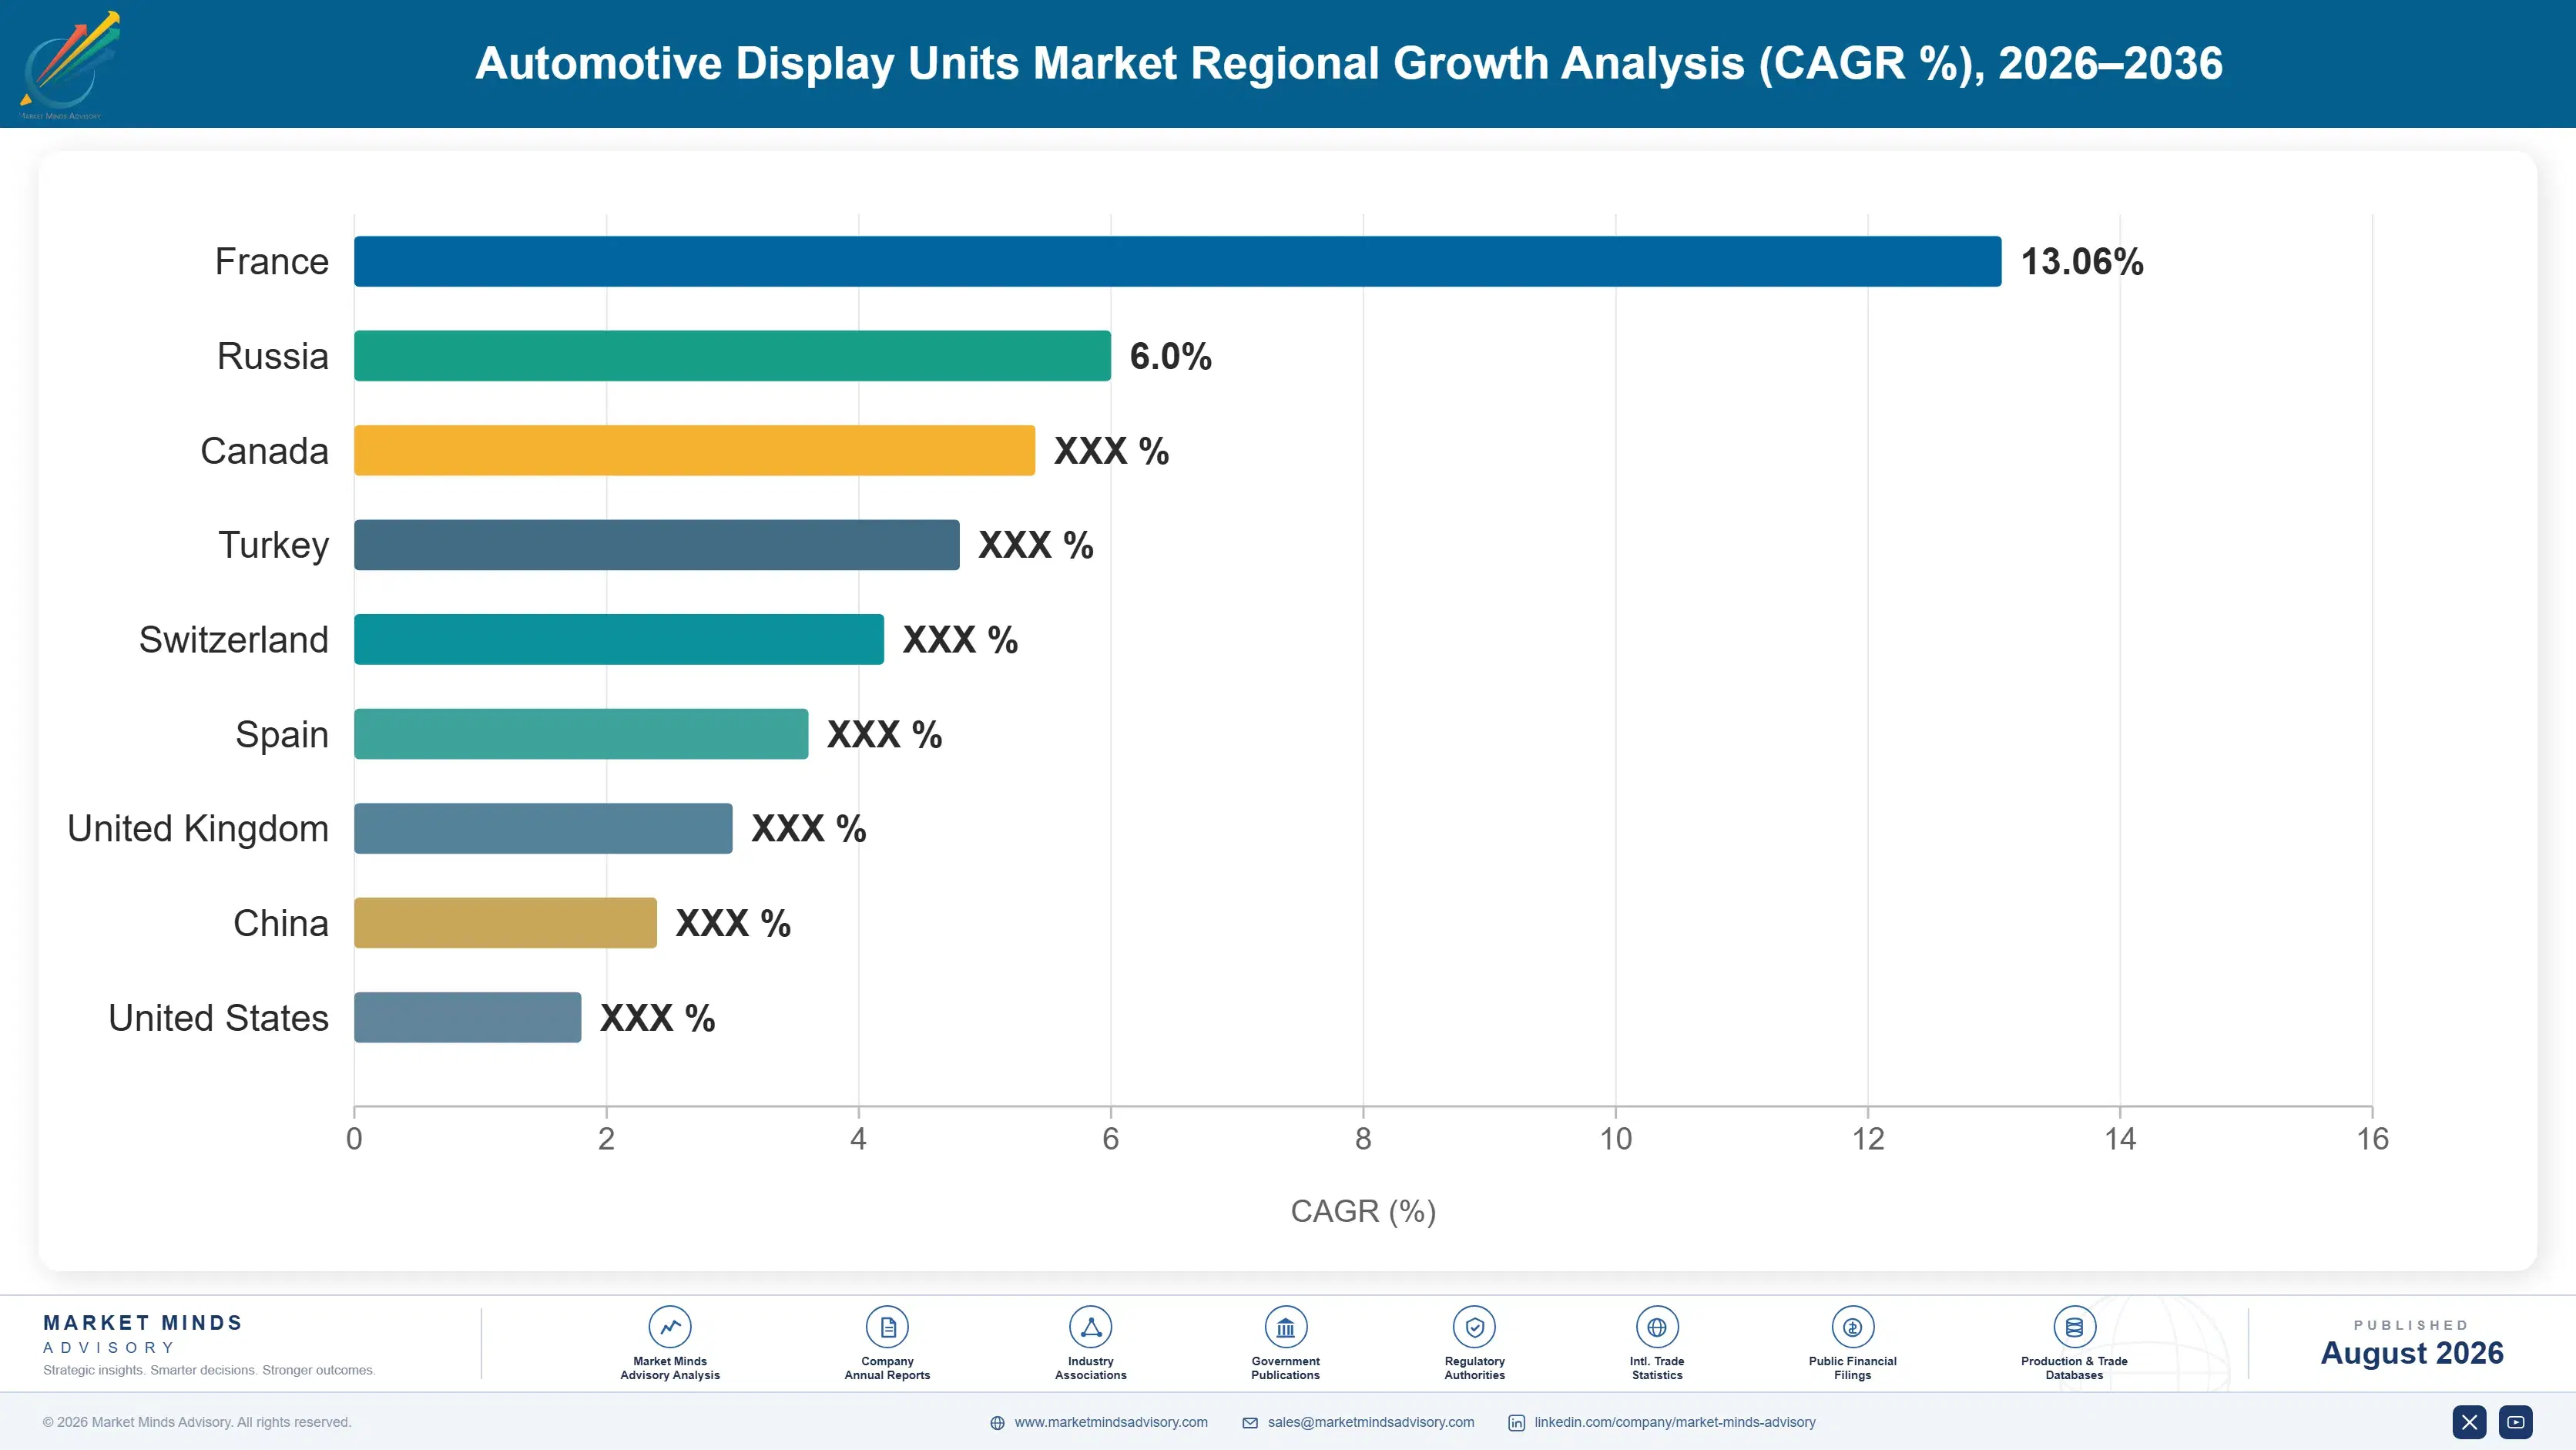
East Asia leads on the strength of both panel fabrication capacity and vehicle production volume, with China's EV makers driving the fastest format innovation while North America and Western Europe follow at a more measured, premium-trim-first adoption pace across most vehicle categories and price segments.

North America

The United States drives the bulk of regional demand, concentrated in premium and EV segments where automakers use display technology as a headline differentiator against competitors in a crowded showroom environment. Domestic automakers have been slower than Chinese peers to adopt pillar-to-pillar formats on mainstream trims, instead prioritizing incremental cluster and infotainment upgrades on existing platforms rather than wholesale cockpit redesigns. Canada contributes a modest share tied to the same vehicle platforms sold in the US market. Mexico's role centers on vehicle assembly rather than display fabrication, since panel manufacturing capacity sits overwhelmingly in East Asia. Regional growth trails the global average, reflecting a market that adopts new formats after they prove out elsewhere.
Share: 23% | CAGR: 9.7% (2026 to 2036)

Western Europe

Germany anchors regional demand through its premium automakers, who were early adopters of digital instrument clusters and head-up display technology well before the current wave of curved and pillar-to-pillar formats emerged from China. France, Italy, and the UK contribute meaningful volume across a broader range of price segments, though adoption of the newest curved display formats trails China by roughly two to three model years on average. The region's growth rate sits below the global average partly because its automakers are simultaneously managing Euro NCAP driver distraction requirements that constrain unchecked screen expansion in ways China's regulatory environment currently does not, creating a genuine tension between differentiation and compliance. Spain-based assembly plants increasingly source curved panels directly from Asian suppliers.
Share: 19% | CAGR: 9.0% (2026 to 2036)
Regional intelligence for 5 additional markets available in the complete report: East Asia, South Asia and Pacific, Latin America, Middle East and Africa, Eastern Europe. Contact sales@marketmindsadvisory.com.
automotive-display-units-market-trends-country-cagr-analysis-1787314682988

Where Display Suppliers Can Expand Margin

Four commercial levers separate suppliers capturing premium value from those competing purely on panel price, spanning format innovation, software integration, curved-glass manufacturing expertise, and aftermarket calibration services across the vehicle's operating life. Each lever pulls margin from a different point in the supply relationship. Suppliers that ignore any one of the four risk ceding ground to diversified competitors.

Move Up the Value Chain Into Curved Formats

Suppliers that master curved and pillar-to-pillar glass manufacturing capture a substantial unit value premium over discrete flat panels, since the format simplifies vehicle-side integration even though it raises panel-side manufacturing difficulty and yield risk considerably. Automakers are willing to pay this premium because curved formats reduce the total bill of materials for mounting hardware and bezels elsewhere in the cockpit assembly. Suppliers without curved-glass capability are increasingly locked out of the fastest-growing product category entirely, unable to bid competitively on the category's largest and fastest-growing programs. Curved formats now command roughly 35 percent higher pricing than flat-panel sets.
Market Impact: Captures roughly a 35 percent highe

Own the Software Layer, Not Just Hardware

Suppliers that control both display hardware and the underlying user interface software capture recurring revenue through over-the-air feature updates and licensing, rather than a single hardware sale at vehicle production, fundamentally changing the revenue profile of a supply relationship. This shift toward software-defined cockpits means suppliers who once competed purely on panel specifications now compete on user experience design and update cadence as well. Early movers are securing multi-year licensing agreements worth more over a vehicle's life than the original hardware contract provided. These agreements now run 15 to 20 percent higher in value than hardware-only deals.
Market Impact: Adds recurring revenue worth 15 to

Build Automotive-Grade OLED Qualification Capacity Lines

Suppliers investing in automotive-grade OLED production lines, distinct from consumer-electronics OLED capacity, are positioning to capture the premium segment as cost curves fall and mid-market automakers begin specifying OLED where only LCD was previously affordable. Automotive qualification requires reliability testing under extreme thermal and vibration conditions consumer-grade OLED lines cannot meet, a real technical barrier. Suppliers that cleared this qualification bar early are first in line for design wins as OLED volume grows roughly 3x over five years. Panel makers without dedicated automotive lines are already losing bids to competitors offering shorter qualification lead times.
Market Impact: Positions suppliers for a 3x OLED v

Offer Post-Sale Calibration and Update Services

Suppliers building out over-the-air software update infrastructure and dealer-network calibration services for advanced display systems are creating a services revenue stream that persists well beyond the original hardware sale, addressing automaker demand for cockpit features that improve throughout a vehicle's ownership life rather than staying static. This model mirrors how software companies monetize beyond initial licensing, giving suppliers a reason to maintain the customer relationship long after the vehicle leaves the factory floor. These services generate roughly 8 percent of original contract value annually. Automakers increasingly favor suppliers who can demonstrate this capability at initial contract award.
Market Impact: Adds a recurring 8 percent annual s

Who Controls the Margin Pool

CR5 sits at 55 percent, a meaningfully more concentrated market than most automotive component categories, reflecting the capital intensity of automotive-grade panel fabrication that keeps the supplier base narrow even as demand broadens across more vehicle segments and price tiers. That concentration is most visible in how few suppliers can currently deliver curved OLED at automotive qualification standards.
Current competitive activity centers on curved-glass manufacturing capacity expansion in China and South Korea, software licensing partnerships that decouple hardware supply from user interface development, and vertical integration moves where panel makers acquire software specialists to offer a combined hardware-software package automakers increasingly prefer over separately sourced components. These moves are reshaping vendor lists at nearly every major automaker simultaneously.

Emerging pressure comes from Chinese panel makers whose domestic scale and government-backed capacity investment are closing the technology gap with established Korean and Japanese OLED leaders faster than most incumbents anticipated just a few years ago. Software specialists entering from outside the traditional automotive supply base are also gaining ground, since automakers increasingly value interface design capability as much as panel manufacturing scale. Neither trend shows signs of reversing soon.
automotive-display-units-market-trends-company-positioning-matrix-1787314683525

Competitive Moat and Risk Dimensions

LG DISPLAY

Moat: OLED automotive qualification lead

LG Display holds one of the industry's most established automotive-grade OLED qualification records, built over roughly a decade of reliability testing investment, giving it a trust advantage with premium automakers that newer entrants cannot replicate quickly regardless of announced capacity. That reputation carries particular weight in safety-adjacent instrument cluster applications.
LG DISPLAY

Risk: Korean cost base versus China

Rising Chinese domestic OLED capacity is compressing the price premium LG Display has historically commanded, forcing a shift toward higher-value curved and AR-HUD applications where its qualification lead still matters more than raw unit manufacturing cost. That shift is already visible in recent design-win data from mid-tier automaker programs.
BOE TECHNOLOGY GROUP

Moat: Domestic scale and cost base

BOE operates at a manufacturing scale few global competitors can match, supported by Chinese government industrial policy investment, giving it a structural cost advantage on commodity LCD and increasingly on automotive-grade OLED lines as well across multiple facilities. That scale advantage is becoming harder for Korean and Japanese rivals to offset through technology alone.
BOE TECHNOLOGY GROUP

Risk: Automotive qualification track record

BOE's automotive-grade qualification history is shorter than Korean and Japanese incumbents, and several Western automakers still favor suppliers with longer reliability track records for safety-adjacent instrument cluster applications specifically, limiting BOE's premium-segment penetration for now. Several Western automakers still favor suppliers with longer track records for these safety-adjacent applications specifically.

Players Tracked

Prominent Players

LG Display
Samsung Display
BOE Technology Group
Continental AG
Visteon Corporation

Other Key Players

Japan Display Inc
Panasonic Automotive Systems
Denso Corporation
Harman International
Yazaki Corporation
Nippon Seiki
Kyocera Corporation
AU Optronics
Tianma Microelectronics
Innolux Corporation
Magna International
Marelli Holdings
Valeo SA
Aptiv PLC
Robert Bosch GmbH

Recent Developments

FEBRUARY 2025

BOE Commissions New Automotive OLED Line in Chengdu

BOE commissioned a new automotive-grade OLED production line at its Chengdu facility, adding dedicated capacity for curved and flexible automotive display panels to serve growing domestic EV demand. The line represents BOE's largest single automotive-focused capacity addition since entering the automotive display segment. The line adds curved-format capacity.
Signal: Confirms Chinese panel makers are closing
JUNE 2025

LG Display and a Global Automaker Sign Software Licensing Agreement

LG Display signed a multi-year agreement with a global automaker to jointly develop and license cockpit interface software alongside its hardware supply contract, structured as a licensing partnership rather than a joint venture or acquisition. The agreement covers multiple vehicle platforms through 2030. Terms were not fully disclosed.
Signal: Shows hardware suppliers moving into softw
NOVEMBER 2025

Visteon Acquires an Automotive HUD Optics Specialist

Visteon acquired a mid-sized European augmented-reality head-up display optics company, adding specialized waveguide and combiner technology to its existing cluster and infotainment display portfolio. The acquisition was Visteon's first dedicated move into AR-HUD optics ownership rather than component purchasing. Terms were not disclosed publicly. Integration completes in 2026.
Signal: Shows established display suppliers acquir

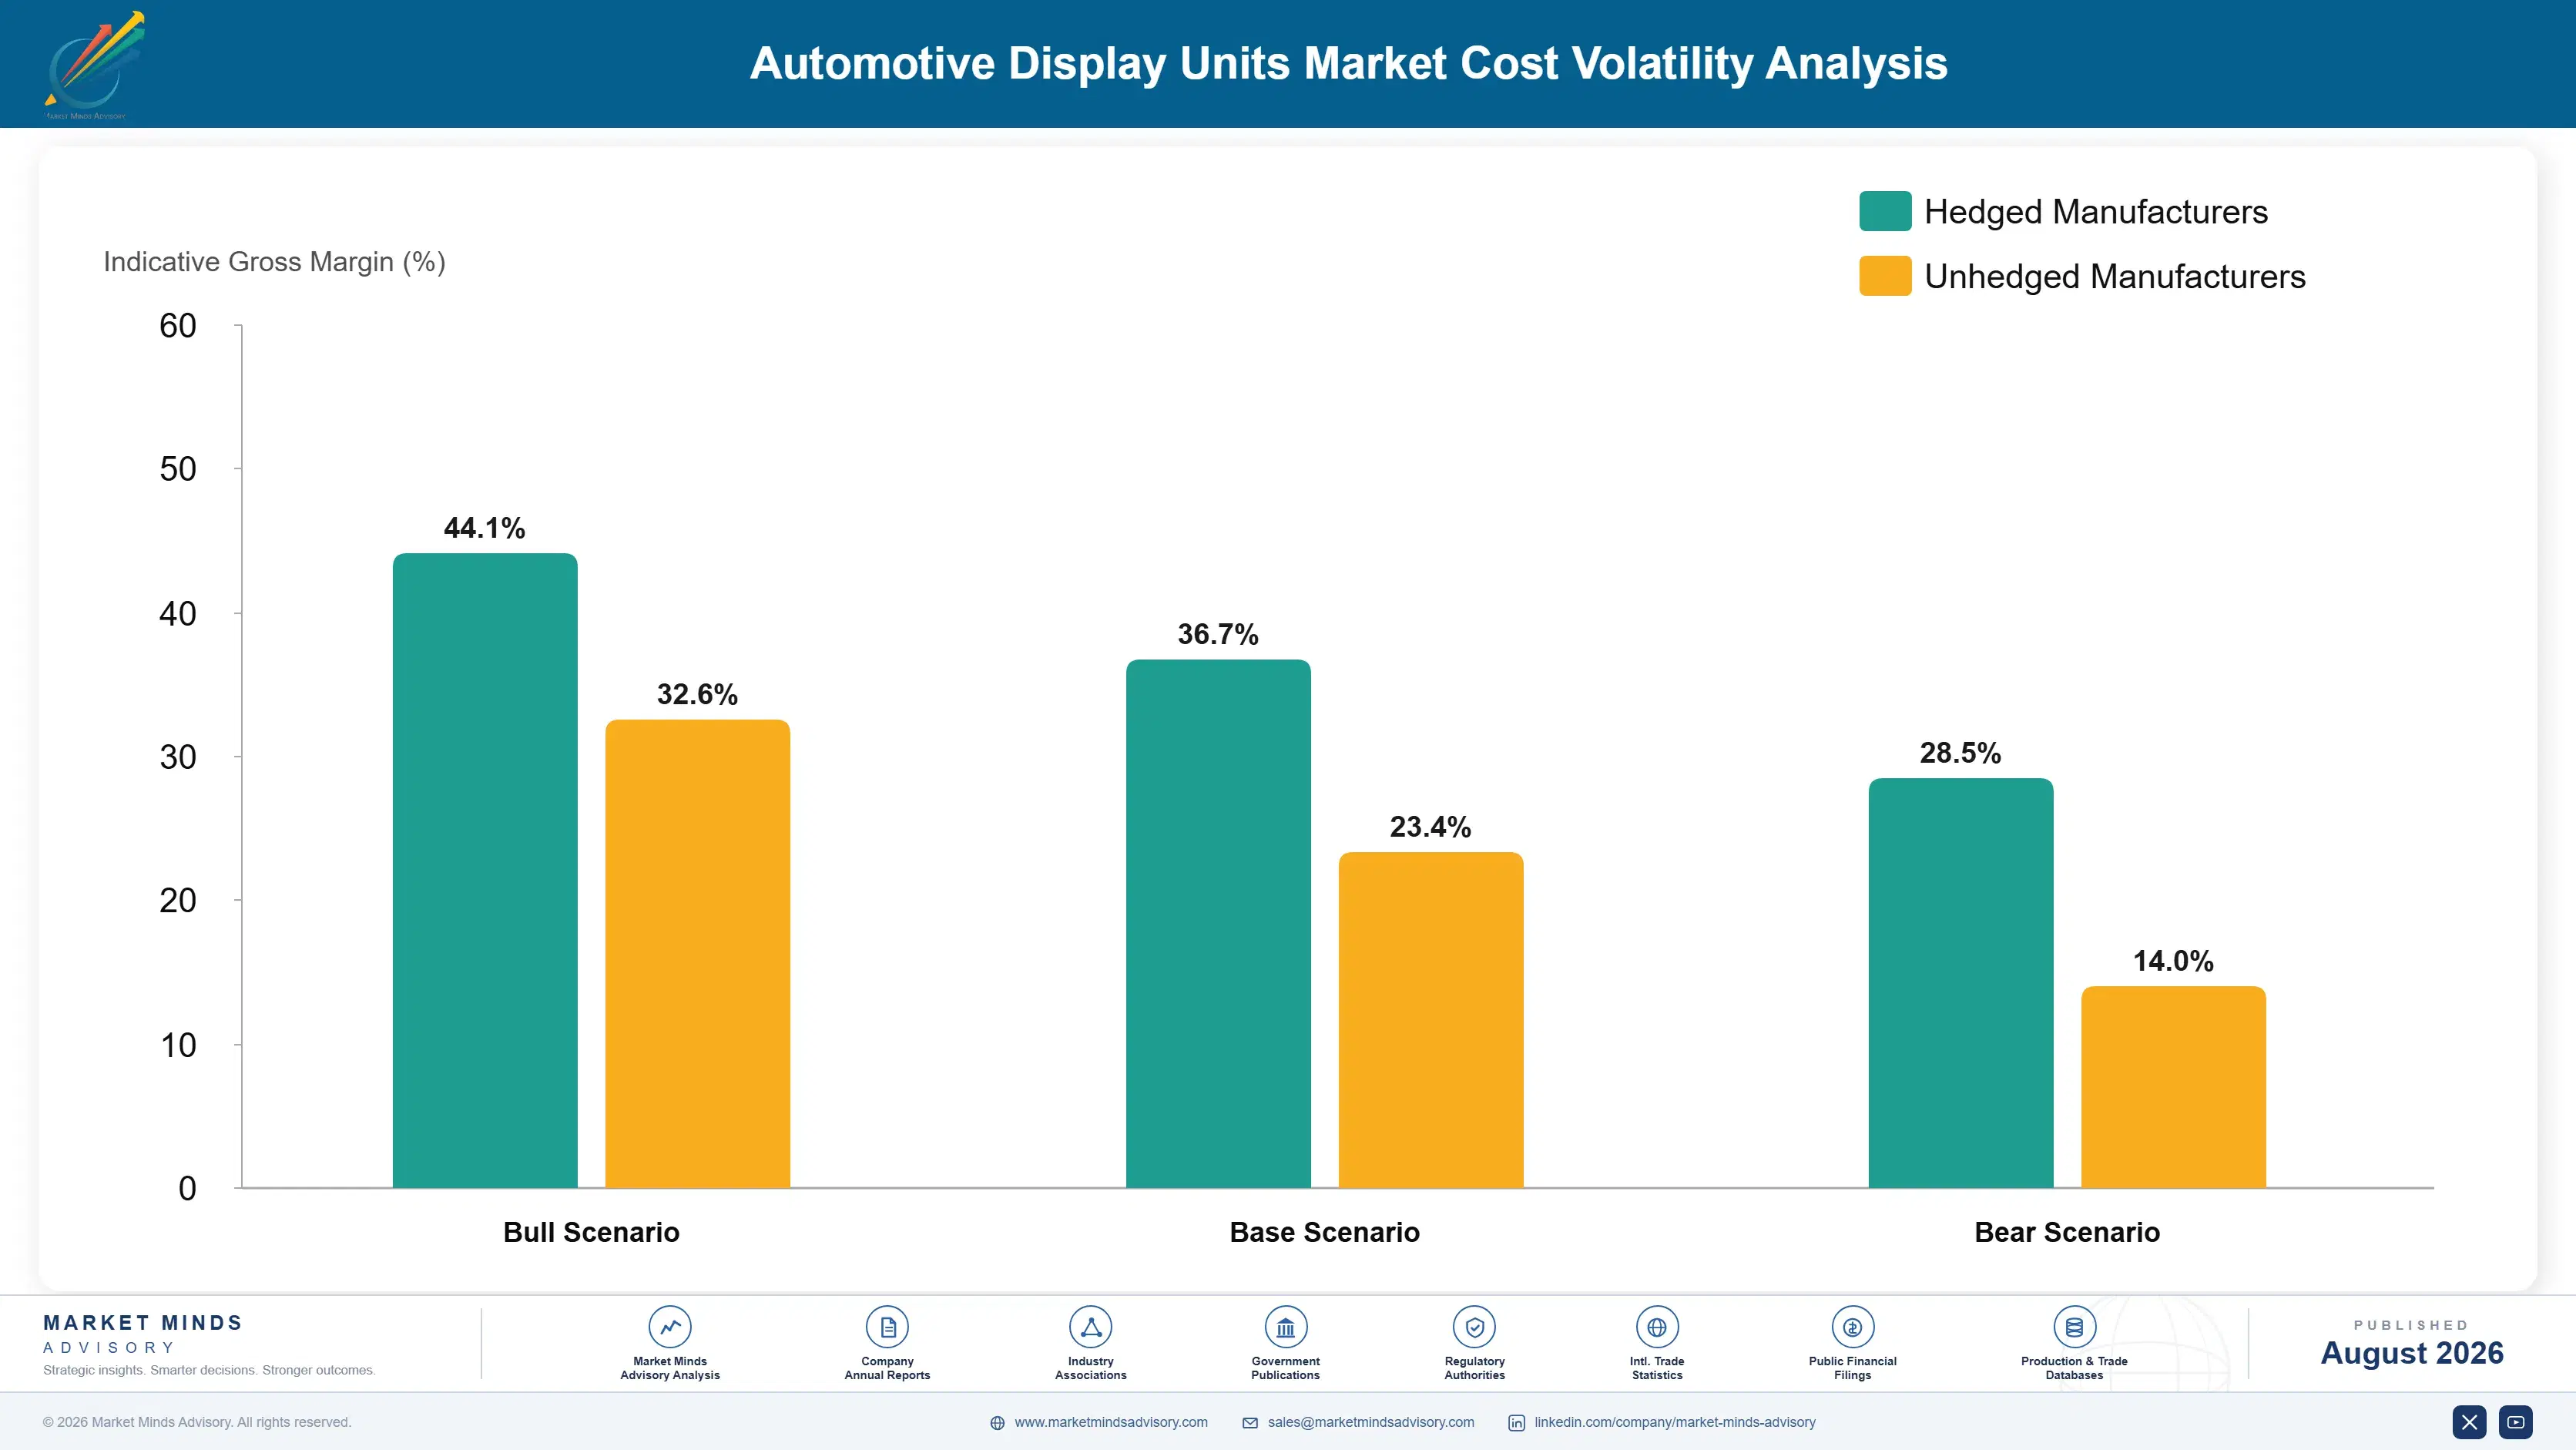
Panel and Driver IC Cost Exposure

Display panel glass and driver integrated circuits together account for roughly 45 percent of finished display unit cost, with automotive-grade semiconductor driver chips adding meaningful exposure to the same foundry capacity constraints affecting the broader automotive chip supply chain. Touch sensor films and backlight or OLED emissive layer materials make up most of the remainder of direct material cost.
The 2021 to 2022 global semiconductor shortage, documented extensively in company annual reports and industry disclosures, delayed display unit deliveries at multiple automakers by several months as driver IC allocation prioritized higher-volume consumer electronics customers over automotive suppliers. Several automakers reported production line idling directly attributable to display driver chip shortages during that period, a disruption still referenced in current supplier risk assessments. Automakers have since diversified allocation agreements to reduce recurrence risk.

The competitive disadvantage falls hardest on smaller display suppliers without long-term semiconductor foundry allocation agreements, since spot-market chip purchasing leaves them exposed to allocation cuts that larger, vertically integrated competitors with direct foundry relationships can partially avoid. Suppliers without foundry relationships of their own carry meaningfully higher earnings volatility from this exposure than integrated panel makers with in-house or contracted chip supply.
automotive-display-units-market-trends-cost-volatility-analysis-1787314683727

Long-Term Foundry Allocation Agreements

Larger display suppliers are locking in multi-year semiconductor foundry allocation agreements to reduce exposure to spot-market shortages, trading some cost flexibility for supply certainty that smaller competitors without negotiating scale cannot access on comparable terms. Several major suppliers signed new multi-year allocation agreements during 2024 specifically to address this exposure. making supply more predictable across future planning cycles.

Driver IC Design Simplification Programs

Suppliers are working with automakers to standardize driver IC specifications across vehicle platforms, reducing the number of distinct chip variants needed and making foundry capacity easier to secure and allocate efficiently during periods of tight supply. Fewer chip variants also shortens qualification cycles when automakers request mid-cycle feature updates. for both suppliers and their automaker customers.

Dual-Source Panel Component Qualification

Suppliers are qualifying display components from multiple regional sources rather than depending on a single supplier, reducing the risk that any one region's chip shortage or geopolitical disruption stalls production across the entire display assembly line. This approach has already reduced allocation risk exposure at several major display suppliers since 2023. keeping the overall assembly line running on schedule.

Portfolio Architecture for Margin Defence

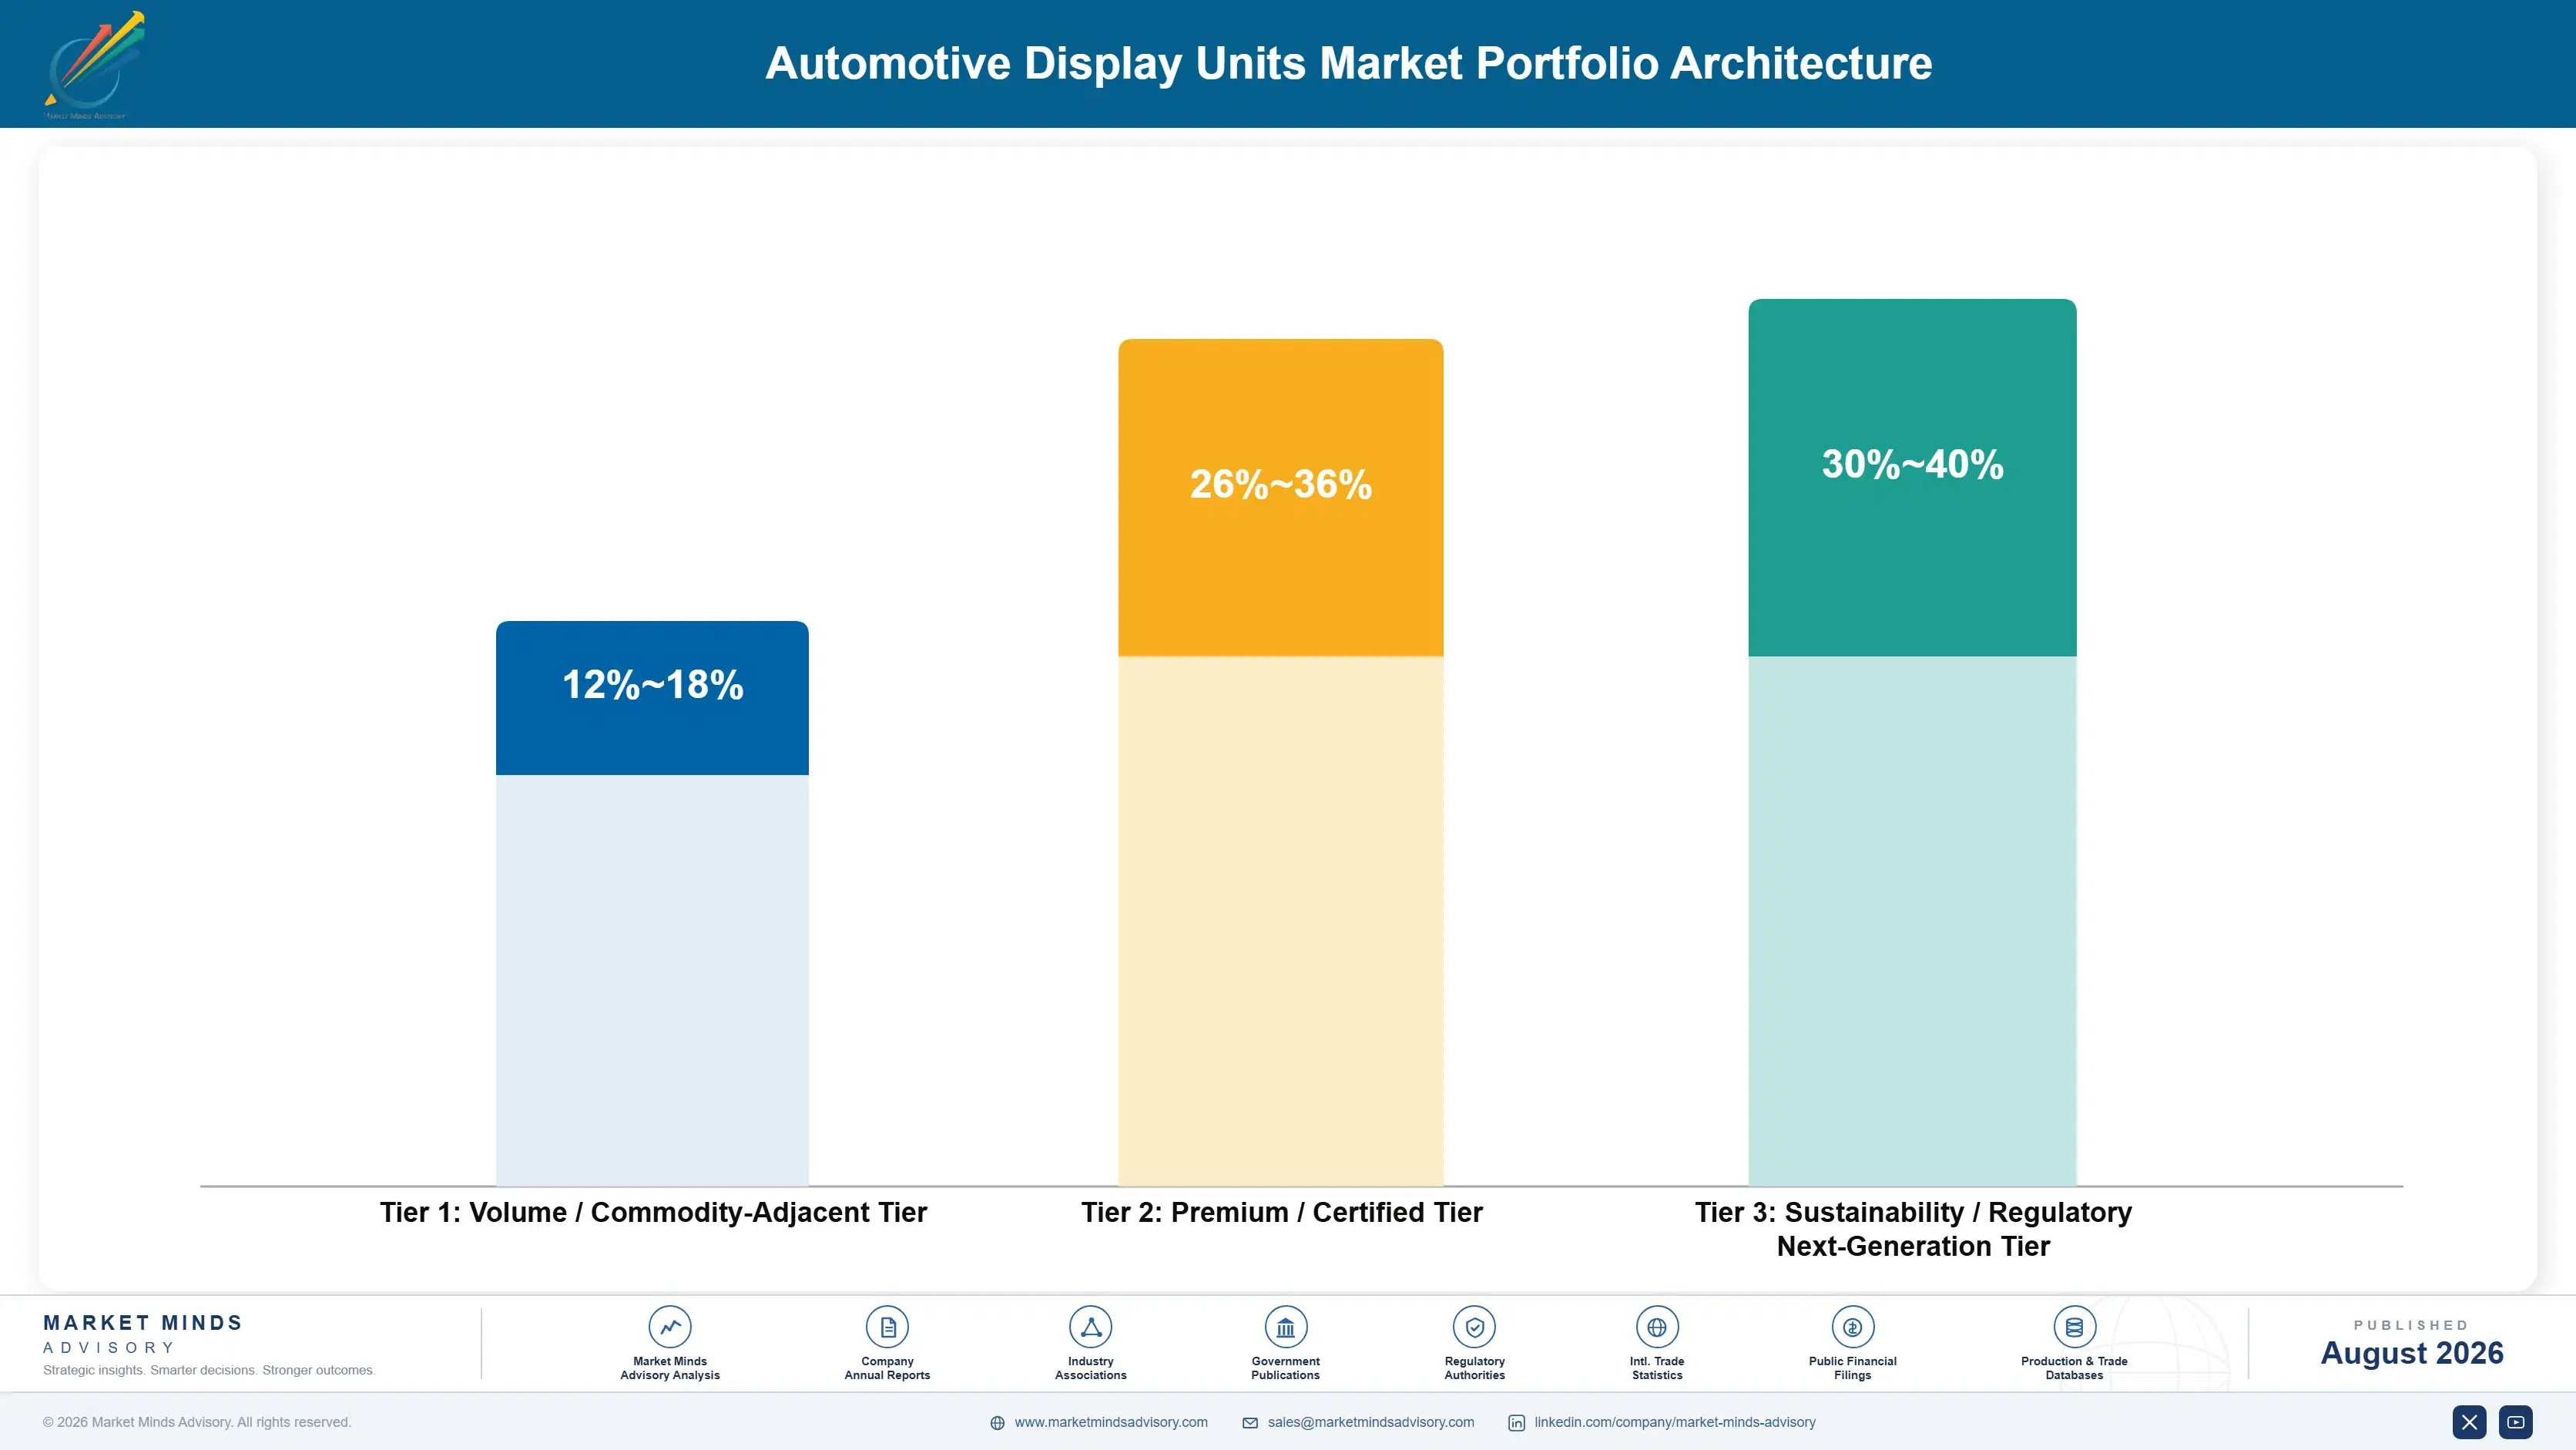
The portfolio splits into three tiers running on distinct economics: a volume tier built on commodity LCD panels sold near cost parity across competing suppliers, a premium tier of OLED and curved display assemblies carrying substantially higher margin, and an emerging next-generation tier built on AR-HUD and software-integrated cockpit systems that commands a technology premium rather than a pure format premium alone. Suppliers rarely compete meaningfully across more than one of these tiers at
The tension between volume and premium is not simply about margin, since automakers buying volume-tier LCD panels are extremely price-sensitive and will switch suppliers readily at the first sign of cost creep, while premium-tier buyers are paying for a differentiated cockpit experience and tolerate meaningfully less price sensitivity as long as the technology genuinely differentiates their vehicle. That difference in buyer behavior shapes how each supplier structures its sales and engineering teams.

High-value margin pools concentrate in AR-HUD systems and software-integrated curved displays, both of which combine technical differentiation with recurring software revenue that volume-tier commodity panels simply cannot generate, giving suppliers positioned in either pool meaningfully more pricing power than the broader market average would otherwise suggest.

Volume / Commodity-Adjacent Tier

Standard LCD instrument cluster and infotainment panels for entry and mid-trim vehicles, priced to compete directly against other commodity LCD suppliers on cost and delivery reliability. Competition here centers almost entirely on cost and delivery reliability.
Gross Margin: 12-18%

Premium / Certified Tier

OLED and curved pillar-to-pillar display assemblies meeting automotive reliability qualification, sold into premium and EV flagship trims at a substantial margin premium over commodity panels. Suppliers here compete on reliability and visual performance.
Gross Margin: 26-36%

Sustainability / Regulatory / Next-Generation Tier

AR-HUD and software-integrated cockpit systems combining hardware and licensed interface software, commanding a technology premium as automakers race to differentiate cockpit experience. This tier draws the strongest interest from premium and EV-focused automakers.
Gross Margin: 30-40%
automotive-display-units-market-trends-portfolio-architecture-1787314684228

High-value Sub-segments and Strategic Watch-out

AR Head-Up Display Systems

Combines the fastest growth rate in the market with premium technology pricing, making it the single most valuable pool for suppliers with waveguide optics and automotive qualification expertise built up over several years. Few competitors currently hold both optics and automotive qualification capability at once.
Gross Margin: 32-40%

Curved OLED Cockpit Displays

Growing rapidly as Chinese EV makers push curved formats into mainstream trims, offering suppliers with curved-glass manufacturing expertise a durable unit value premium over discrete flat panel competitors. Suppliers without curved-glass expertise are increasingly locked out of this category entirely. Chinese suppliers currently lead this category by volume.
Gross Margin: 26-34%

Standard LCD Instrument Clusters

The steady volume core of the market, growing roughly in line with overall vehicle production and offering predictable but noticeably thinner margin than either the AR-HUD or curved OLED tiers above. It remains the segment most exposed to continued price-based Chinese competition. Margin compression here has been gradual but persistent.
Gross Margin: 12-18%

Legacy Monochrome Display Modules

A strategic watch-out segment facing steep decline as automakers phase out basic monochrome trip computer displays in favor of full-color digital clusters even in entry-level trim configurations across most markets. Suppliers still reliant on this category should plan for continued volume decline. Volume has fallen sharply since 2022.
Gross Margin: 8-14%

From Design Win to Platform Refresh

Display supply contracts behave closer to annuities than one-off transactional sales once a supplier wins a platform design slot, since requalifying an alternative display supplier mid-program disrupts both hardware integration and software validation work that automakers are reluctant to repeat within a single platform generation. Automakers treat a display design win as effectively locked in once validation testing is complete.
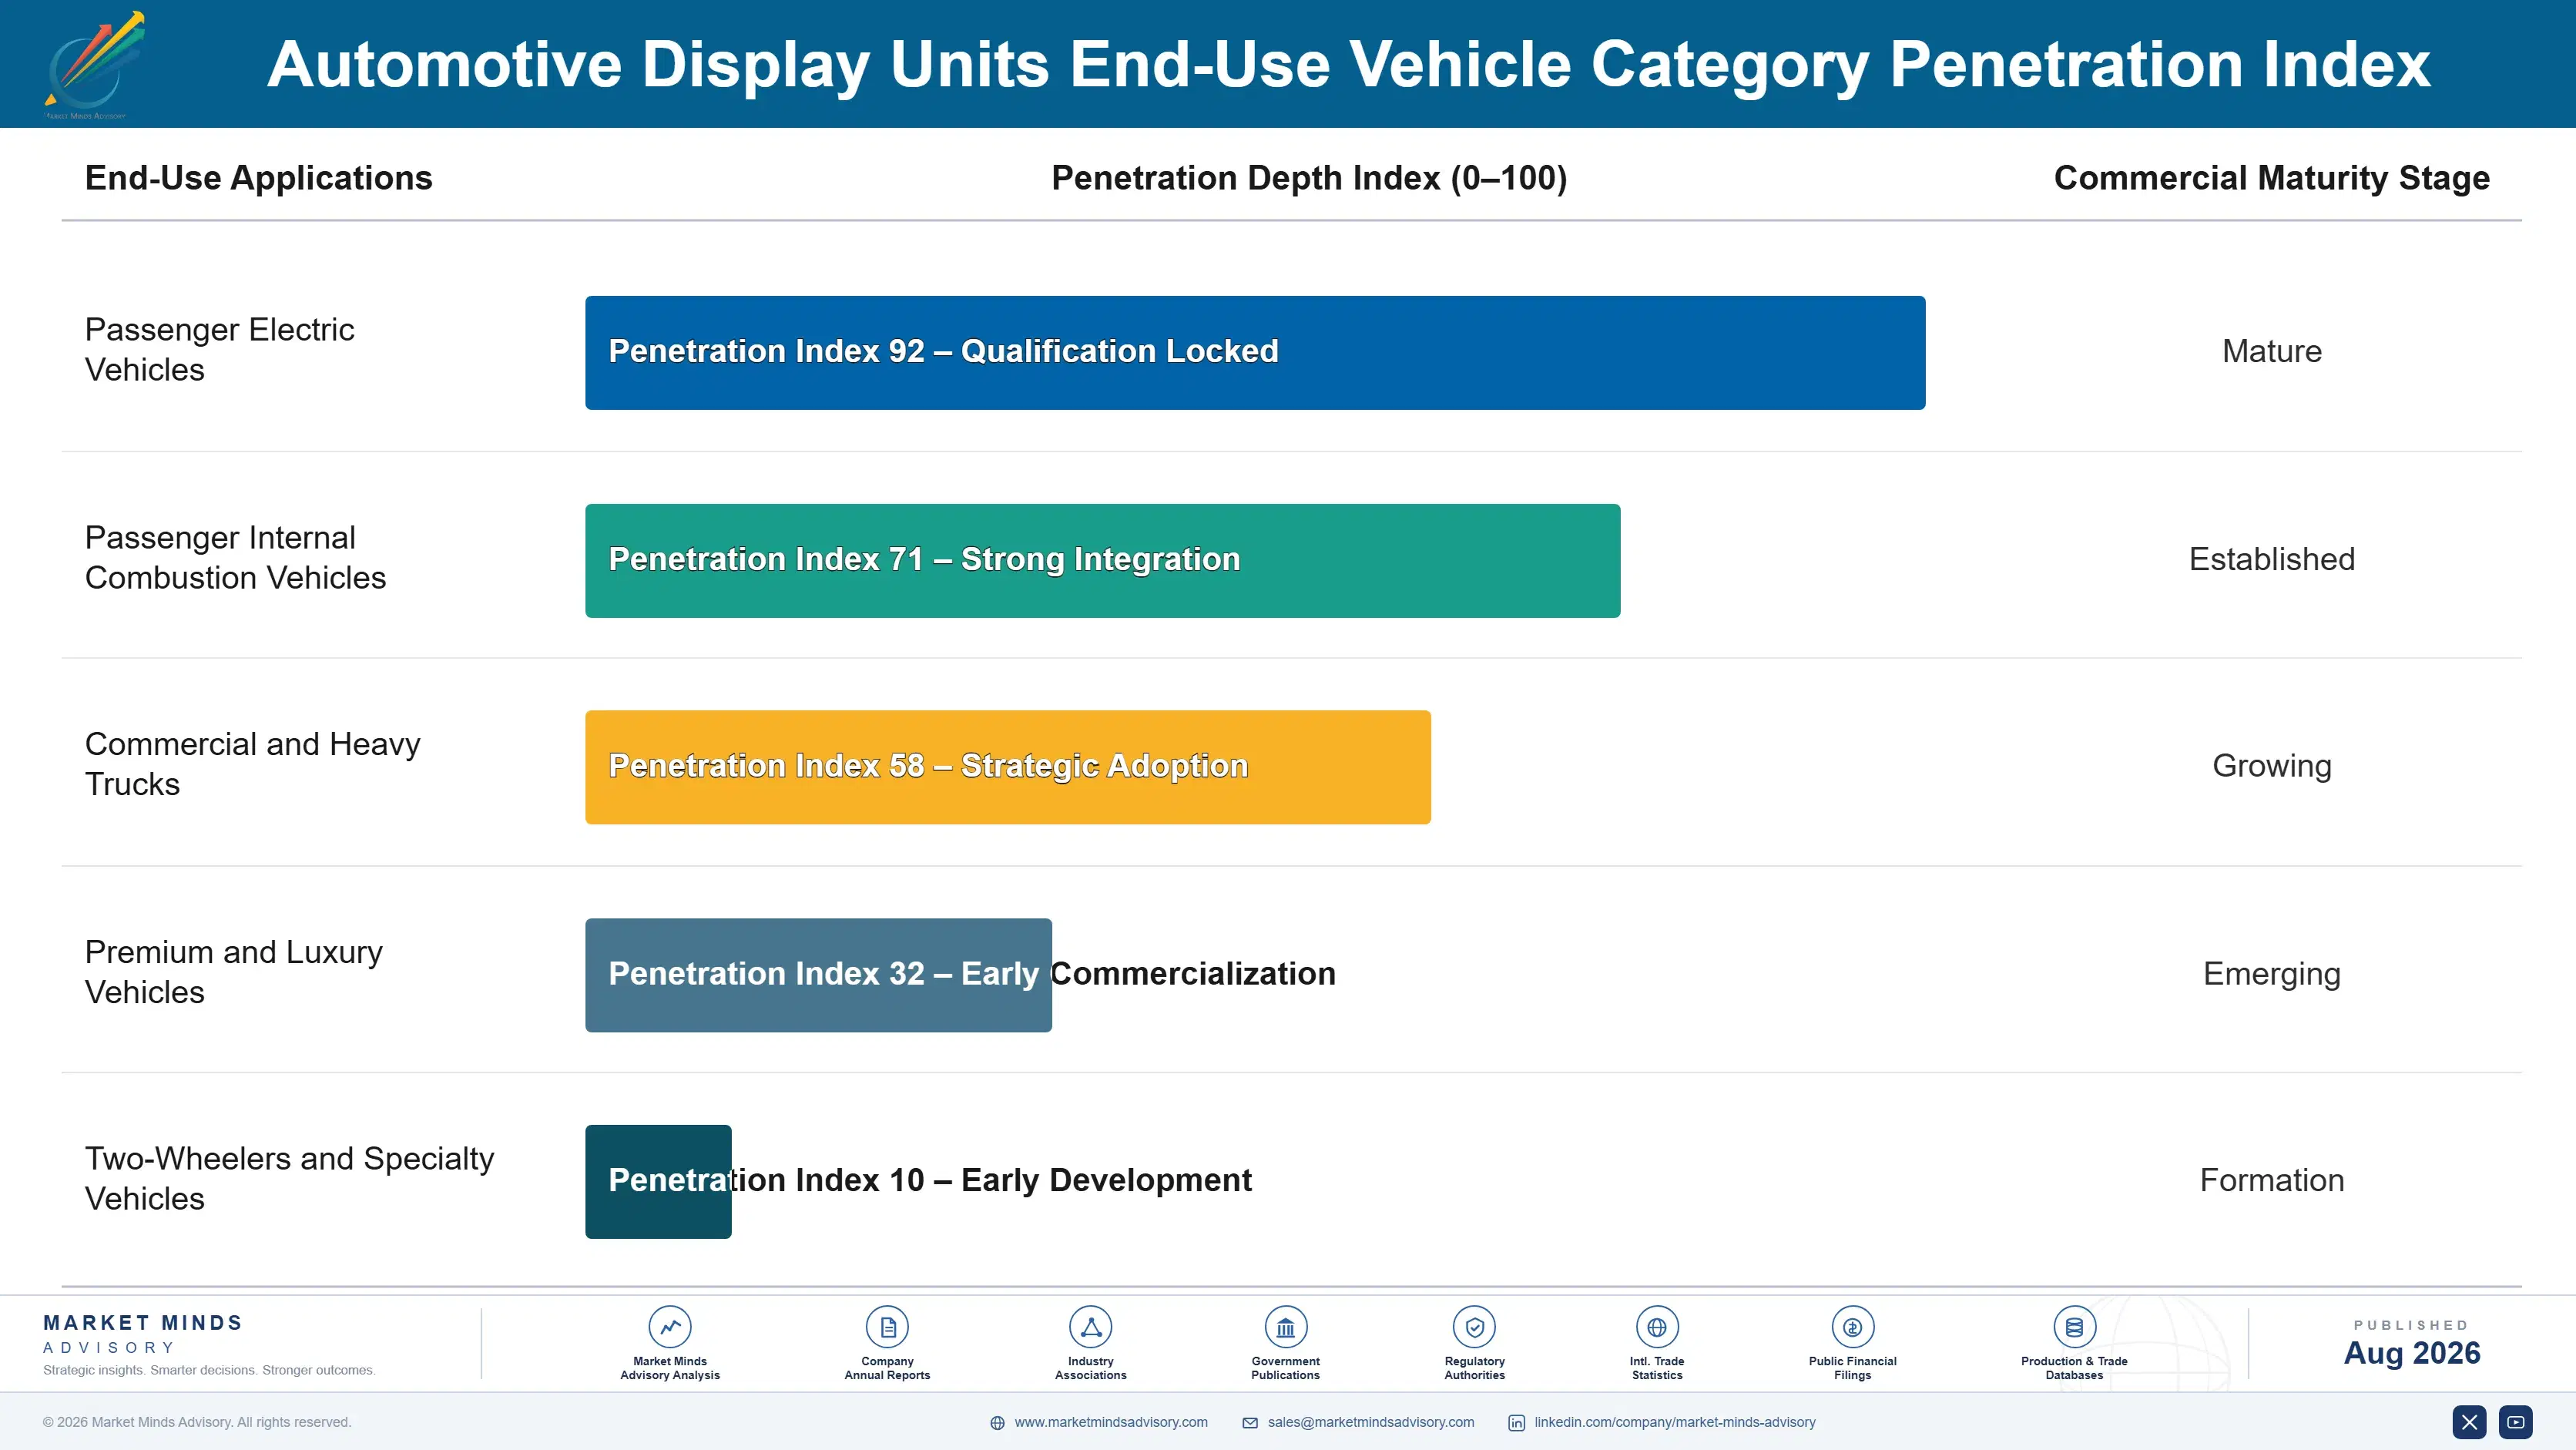
Adoption depth varies sharply by end-use vertical: premium and EV flagship programs have pushed curved OLED and AR-HUD deep into standard trim configurations, while mainstream mid-market vehicles still largely rely on commodity LCD with only modest format upgrades. Commercial vehicle and heavy truck programs lag furthest behind, prioritizing display durability and glare visibility over the aesthetic curvature that passenger vehicle buyers increasingly expect as standard.

A generational shift is underway in buyer expectations as younger consumers, shaped by smartphone interface familiarity, treat large, responsive touchscreens as a baseline requirement rather than a premium feature, a change that is pulling display specification downmarket faster than automakers originally planned for their mainstream trim levels. Suppliers slow to adapt risk losing relevance with the exact buyers driving the category's fastest growth.
automotive-display-units-market-trends-end-use-penetration-index-1787314684718

Software Layer Decides the Next Decade

These are among the four positions where our research anticipates prominent divergence between winners and laggards over the coming forecast period. Each is grounded in the demand model, the regulatory perimeter, and the announced capacity pipeline.
01 / FORMAT STRATEGY FOCUS

Prioritize curved-glass manufacturing capability now

Curved and pillar-to-pillar formats carry a substantial unit value premium over discrete flat panels and require specialized manufacturing expertise that only a handful of suppliers currently possess at automotive production scale. Suppliers without this capability are increasingly locked out of the fastest-growing product category as Chinese EV makers push the format into mainstream trim levels. Suppliers should direct capital toward curved-glass yield improvement and automotive qualification rather than expanding flat-panel capacity that offers shrinking long-term differentiation against faster-moving Chinese competitors.
02 / SOFTWARE INTEGRATION STRATEGY

Build software licensing capability alongside hardware

Automakers are increasingly decoupling display hardware from interface software, and suppliers without software development capability will be relegated to commodity hardware margins regardless of panel technology quality. Early movers building interface design and over-the-air update infrastructure are securing multi-year licensing revenue streams that hardware-only competitors have no realistic way to capture at all. Building or acquiring software capability now positions suppliers ahead of a shift that is already reshaping how automakers structure display supply contracts across every major vehicle platform.
03 / GEOGRAPHIC POSITIONING STRATEGY

Expand automotive OLED capacity in East Asia

East Asia combines the fastest regional growth with the deepest concentration of both panel fabrication capacity and EV assembly volume, giving suppliers with automotive OLED capacity there a cost and lead-time advantage over more distant competitors. This is a materially different calculus than a decade ago when Korean and Japanese suppliers alone defined the technology frontier. Suppliers still concentrated in legacy Western fabrication footprints should evaluate East Asian capacity additions as a near-term priority rather than deferring the decision further.
04 / SUPPLY CHAIN RISK MANAGEMENT

Secure long-term semiconductor foundry allocation

Driver IC and semiconductor foundry capacity remain the largest source of supply disruption risk across the industry, and suppliers without long-term foundry allocation agreements are structurally disadvantaged relative to vertically integrated competitors with direct capacity access. The 2021 to 2022 chip shortage demonstrated how quickly this exposure can halt production for unhedged suppliers regardless of their panel technology strength. Suppliers should prioritize locking in multi-year foundry agreements before the next allocation crunch arrives without warning across the broader semiconductor supply chain.

Engagement Snapshot From the Field

A live engagement with an industry participant carrying material or product regulatory and market exposure ahead of a defining policy shift, showing how our research translates into a defensible multi-year portfolio strategy.
MARKET MINDS ADVISORY · CLIENT ENGAGEMENT SUMMARY
Automotive Display Units Producer Strategic Portfolio Review and Transition Roadmap 2026·Investment Scenario on Automotive Display Units Exposure Evaluation 2025-26
CLIENT PROFILE
The client was a global Tier-1 cockpit electronics supplier with roughly $3.1 billion in annual revenue (client-reported, unverified by MMA), supplying instrument cluster and infotainment displays to four major automakers across North America and Europe, seeking to reposition its product portfolio toward curved and software-integrated display formats. The client had never won a curved-display design slot before this engagement began.
STRATEGIC CHALLENGE
The client's commodity LCD business faced sustained margin compression as Chinese suppliers undercut pricing on standard panels, while two competitors had already begun winning curved-display design slots the client lacked manufacturing capability to bid on competitively across its existing platforms. Leadership set a two-year window to reverse the trend before losing further platform allocations.
MMA APPROACH
MMA conducted a competitive technology capability assessment against curved-display and AR-HUD leaders, modeled the capital investment case for curved-glass manufacturing against projected design-win volume, and benchmarked software licensing models used by leading suppliers to identify a realistic path to margin recovery. MMA also reviewed the client's internal software team capacity against licensing models used by competitors.
KEY FINDINGS
  1. Curved display design slots carried roughly 2.2 times the margin of the client's existing commodity LCD portfolio, based on comparable disclosed program economics.
  2. Curved-glass manufacturing investment payback fell within two platform generations given the client's existing automaker relationships and production footprint. under realistic production ramp assumptions provided by the client.
  3. The client's software development team, though underutilized, had capability that could support a licensing model competitors lacked internally. that competitors would need years to replicate internally.
  4. Entry-level AR-HUD partnerships could generate incremental margin without the full capital cost of building in-house optics manufacturing capacity. without requiring the client to build in-house optics manufacturing capacity.
CLIENT PROFILE
The client was a global Tier-1 cockpit electronics supplier with roughly $3.1 billion in annual revenue (client-reported, unverified by MMA), supplying instrument cluster and infotainment displays to four major automakers across North America and Europe, seeking to reposition its product portfolio toward curved and software-integrated display formats. The client had never won a curved-display design slot before this engagement began.
STRATEGIC CHALLENGE
The client's commodity LCD business faced sustained margin compression as Chinese suppliers undercut pricing on standard panels, while two competitors had already begun winning curved-display design slots the client lacked manufacturing capability to bid on competitively across its existing platforms. Leadership set a two-year window to reverse the trend before losing further platform allocations.
MMA APPROACH
MMA conducted a competitive technology capability assessment against curved-display and AR-HUD leaders, modeled the capital investment case for curved-glass manufacturing against projected design-win volume, and benchmarked software licensing models used by leading suppliers to identify a realistic path to margin recovery. MMA also reviewed the client's internal software team capacity against licensing models used by competitors.
KEY FINDINGS
  1. Curved display design slots carried roughly 2.2 times the margin of the client's existing commodity LCD portfolio, based on comparable disclosed program economics.
  2. Curved-glass manufacturing investment payback fell within two platform generations given the client's existing automaker relationships and production footprint. under realistic production ramp assumptions provided by the client.
  3. The client's software development team, though underutilized, had capability that could support a licensing model competitors lacked internally. that competitors would need years to replicate internally.
  4. Entry-level AR-HUD partnerships could generate incremental margin without the full capital cost of building in-house optics manufacturing capacity. without requiring the client to build in-house optics manufacturing capacity.
RECOMMENDED STRATEGY
Phase 1: Phase 1 (0-9 months): Build curved-glass pilot production line and complete automotive qualification testing. while securing initial automaker interest. ahead of the next design-award cycle. Phase 2: Phase 2 (9-24 months): Bid curved display programs on two upcoming premium platform awards using new capability. to establish a credible track record. Phase 3: Phase 3 (24-42 months): Launch software licensing division leveraging existing interface development team capacity. to diversify beyond hardware sales alone.
OUTCOME
The client won curved display design slots on two of three platform bids within eighteen months of qualification completion, adding an estimated $210 million in annual contracted revenue (client-reported, unverified by MMA) at materially higher margin than its legacy commodity LCD business had generated. A second engagement on software licensing strategy followed within the year.

Frequently Asked Questions

Foundational context covering the market sizes, CAGR, scope, country, region and competition that inform every finding below. This section is provided to cover basics and most often pre-purchase conversations, answered from the MMA Primary Research Dataset.

What is the current size of the Automotive Display Units Market?

The global automotive display units market is valued at approximately $29.0 billion in 2025, spanning instrument clusters, infotainment screens, head-up displays, and curved cockpit display assemblies.

How large will the Automotive Display Units Market be by 2036?

The market is projected to reach approximately $87.0 billion by 2036, driven primarily by rising screen count per vehicle and the shift toward curved and OLED display formats.

What is the CAGR for the Automotive Display Units Market 2026 to 2036?

The market is projected to grow at a compound annual rate of 10.5 percent between 2026 and 2036, with head-up displays growing fastest within that total figure.

Which segment is growing fastest?

Head-up displays are growing fastest at 13.5 percent annually, roughly 1.29 times the overall market rate, driven by premium differentiation and AR navigation features. AR navigation features are pulling the segment further upmarket.

Who are the major companies in the Automotive Display Units Market?

LG Display, Samsung Display, BOE Technology Group, Continental AG, and Visteon lead the market by disclosed shipment volume, alongside fifteen other significant global suppliers. Fifteen additional suppliers round out the competitive field.

Which country is growing fastest?

China is growing fastest among major markets at 12.8 percent annually, supported by aggressive EV cockpit differentiation and rapidly expanding domestic OLED panel capacity. Domestic EV makers are the primary demand driver there.

Report Segmentation Architecture

The full report scope spans multiple orthogonal segmentation dimensions, with cross-tabulated demand data provided for each dimension pair. Coverage extends further to regional breakdowns, trend trajectories, and the competitive detail needed to support segment-level decision-making.

By Display Application and Format

  • Digital Instrument Clusters
  • Center Stack Infotainment Displays
  • Head-Up Displays (HUD)
  • Rear-Seat Entertainment Displays
  • Pillar-to-Pillar Curved Displays
  • Passenger Display Screens

By End-Use Vehicle Category

  • Passenger Electric Vehicles
  • Passenger Internal Combustion Vehicles
  • Commercial and Heavy Trucks
  • Premium and Luxury Vehicles
  • Two-Wheelers and Specialty Vehicles

By Panel Technology

  • TFT-LCD
  • OLED
  • Mini-LED and Micro-LED

By Region

  • North America
  • Western Europe
  • East Asia
  • South Asia and Pacific
  • Latin America
  • Middle East and Africa
  • Eastern Europe

Scope, Methodology, and Coverage

Every figure in this report is reproducible from documented input assumptions. The scope below maps the historical period, the forecast horizon, the segmentation dimensions, and the countries covered, alongside the underlying primary and qualitative methodology.
Historical Period
2020 to 2025
Forecast Period
2026 to 2036
Base Year
2025 (USD billions; MMA Primary Research Dataset, August 2026)
Market Definition
This report covers digital instrument clusters, center stack infotainment screens, head-up displays, rear-seat entertainment panels, and curved or pillar-to-pillar display assemblies sold into passenger and commercial vehicles. It excludes aftermarket screens, standalone navigation devices not integrated into the vehicle electrical architecture, and consumer tablets mounted as accessories.
Quantitative Units
USD billions (current prices); million display units shipped where applicable
Segmentation Dimensions
By Display Application and Format; By End-Use Vehicle Category; By Panel Technology; By Region
Regions Covered
North America, Western Europe, East Asia, South Asia and Pacific, Latin America, Middle East and Africa, Eastern Europe
Countries Covered
USA, China, Germany, France, UK, Japan, South Korea, India, Australia, Canada, Brazil, Mexico, Indonesia, Vietnam, Thailand, Malaysia, UAE, Saudi Arabia, South Africa, Nigeria, Turkey, Poland, Netherlands, Italy, Spain, Sweden, Switzerland, Argentina, Colombia, Singapore, and additional markets relevant to this sector
Key Companies Profiled
LG Display, Samsung Display, BOE Technology Group, Continental AG, Visteon Corporation, Japan Display Inc, Panasonic Automotive Systems, Denso Corporation, Harman International, Yazaki Corporation, Nippon Seiki, Kyocera Corporation, AU Optronics, Tianma Microelectronics, Innolux Corporation, Magna International, Marelli Holdings, Valeo SA, Aptiv PLC, Robert Bosch GmbH
Quantitative Methodology
Primary survey, n=3,800 respondents, Q4 2025, six countries; demand-side model with trade association cross-validation
Qualitative Methodology
47 expert interviews, Q4 2025; applied to validate demand model assumptions, identify emerging dynamics, and assess competitive positioning
Report Format
PDF and XLSX data workbook (Word format preview document)
Publisher
Market Minds Advisory
Report Code
MMA-2026-AUT-102
Published
August 2026
Contact
sales@marketmindsadvisory.com | www.marketmindsadvisory.com

Purchase the full Automotive Display Units Market Report (2026 to 2036).

The full Automotive Display Units Market report delivers a complete quantitative and qualitative assessment across all six application segments, seven regions, and twenty profiled companies operating in this space. It includes detailed sizing and forecast models through 2036, competitive benchmarking on shipment volume, and a full technology tracker covering OLED, mini-LED, and AR-HUD development timelines. Buyers receive segment-level and country-level data tables supporting the full analysis presented throughout this report. It also includes a dedicated section on curved-display manufacturing yield benchmarks across leading suppliers. Analysts update the underlying dataset each quarter to reflect the latest supplier disclosures.
Segment-level sizing across six display application types
Country-level forecast data for thirty markets
Competitive benchmarking on shipment volume basis
Technology tracker for OLED, mini-LED, and AR-HUD
Curved display adoption curves by vehicle platform
Twenty-company competitive profile database, updated quarterly

Built For The People Who Decide

From boardroom strategy to bench-side execution, this report is read cover-to-cover by leaders shaping the next decade of their industry, turning demand scenarios, market dynamics and valuation benchmarks into decisions.
CXOs/ Presidents/ VPs/ Managers
M&A and Corporate Development
Strategy Teams and R&D Heads
Procurement and Product Directors
Regulatory and Compliance Leaders
Investor Relations and Equity Analysts