Market Minds Advisory
Automatic Fire Suppression System (AFSS) Market

Automatic Fire Suppression System (AFSS) Market: Agent Phase-Outs, Battery Fires, And Systems Nobody Tests

A suppression system spends its whole life doing nothing, and the only test that matters is one nobody schedules. Meanwhile the agents in half the installed base are being phased out of existence.

Lead Analyst

David Horsley

Published

September 2026

Make Smarter Decisions with Customized Research Insights

Request a free sample report and evaluate market opportunities, growth trends, and competitive dynamics relevant to your business needs.

2025 MARKET VALUE$18.6BMarket Size 2025
2036 FORECAST VALUE$38.4BBase Case , 2026 to 2036
CAGR 2026 TO 20366.8 %Bull 8.1% / Bear 5.5%
INCREMENTAL OPPORTUNITY$18.5BNet 10- year value creation
EXPANSION MULTIPLE1.93x2036 value over 2026 base
Strategic Levers
M&A Pipeline
Regional Outlook
Country Rankings
Competitive Intelligence
Segmental Deep-dive
Call-Us : 91 93563 13602

Executive Snapshot and Market Trajectory

A suppression system does nothing for decades and then has to work once, which is a difficult product to sell and an easy one to neglect. Regulation rather than risk drives almost every purchase. The market reaches USD 18.6 billion in 2025 and grows at 6.8%. Nobody wants one.
Clean agent gaseous systems grow fastest at 11.2%, about 1.65 times the market rate, because fluorinated agents are being phased out under global treaty and every installation using them faces replacement on a published timetable. North America holds 30% of value and Western Europe 23%, both on retrofit rather than new build. East Asia takes 24% on construction volume instead. Retrofit and new build behave nothing alike.
Concentration sits at 39%, lower than the size of the leading suppliers suggests, because installation and service are local trades and thousands of contractors hold the customer relationship. Competition turns on agent portfolio, approval listings, and service network density rather than on hardware. Service and inspection already carry 47% of category revenue, and battery energy storage has created a hazard the existing agent set handles badly. That hazard is currently unclaimed by anybody.
Market Definition
The automatic fire suppression system market covers fixed systems that detect and suppress fire without human intervention, including the detection, control, agent storage, and discharge equipment installed as one system. It spans water sprinkler and mist systems, clean agent gaseous systems, inert gas systems, foam and wet chemical systems, and dry and condensed aerosol suppression. Portable extinguishers, fire alarm systems sold without suppression, passive fire protection, and firefighting vehicles are excluded.
Base Year Value
$18.6B in 2025 (MMA Primary Research Dataset, August 2026)
Forecast Period
2026 to 2036, eleven discrete annual values
CAGR
6.8% base case. Bull 8.1%. Bear 5.5%.
Fastest Growth Segment
Clean Agent Gaseous Systems: 11.2% CAGR
Fastest Growth Country
India: 10.1% CAGR
Fastest Growth Region
South Asia and Pacific: 9.0% CAGR
Largest Region
North America: 30% of 2025 global value
Market Leaders
Johnson Controls, Carrier, Honeywell, Siemens, Minimax Viking. Source: MMA Primary Research Dataset, July 2026.
Primary Survey
n=3,800 procurement and R&D decision-makers, Q4 2025, six countries
Methodology
Demand-side build-up, cross-validated against public data, 47 expert interviews

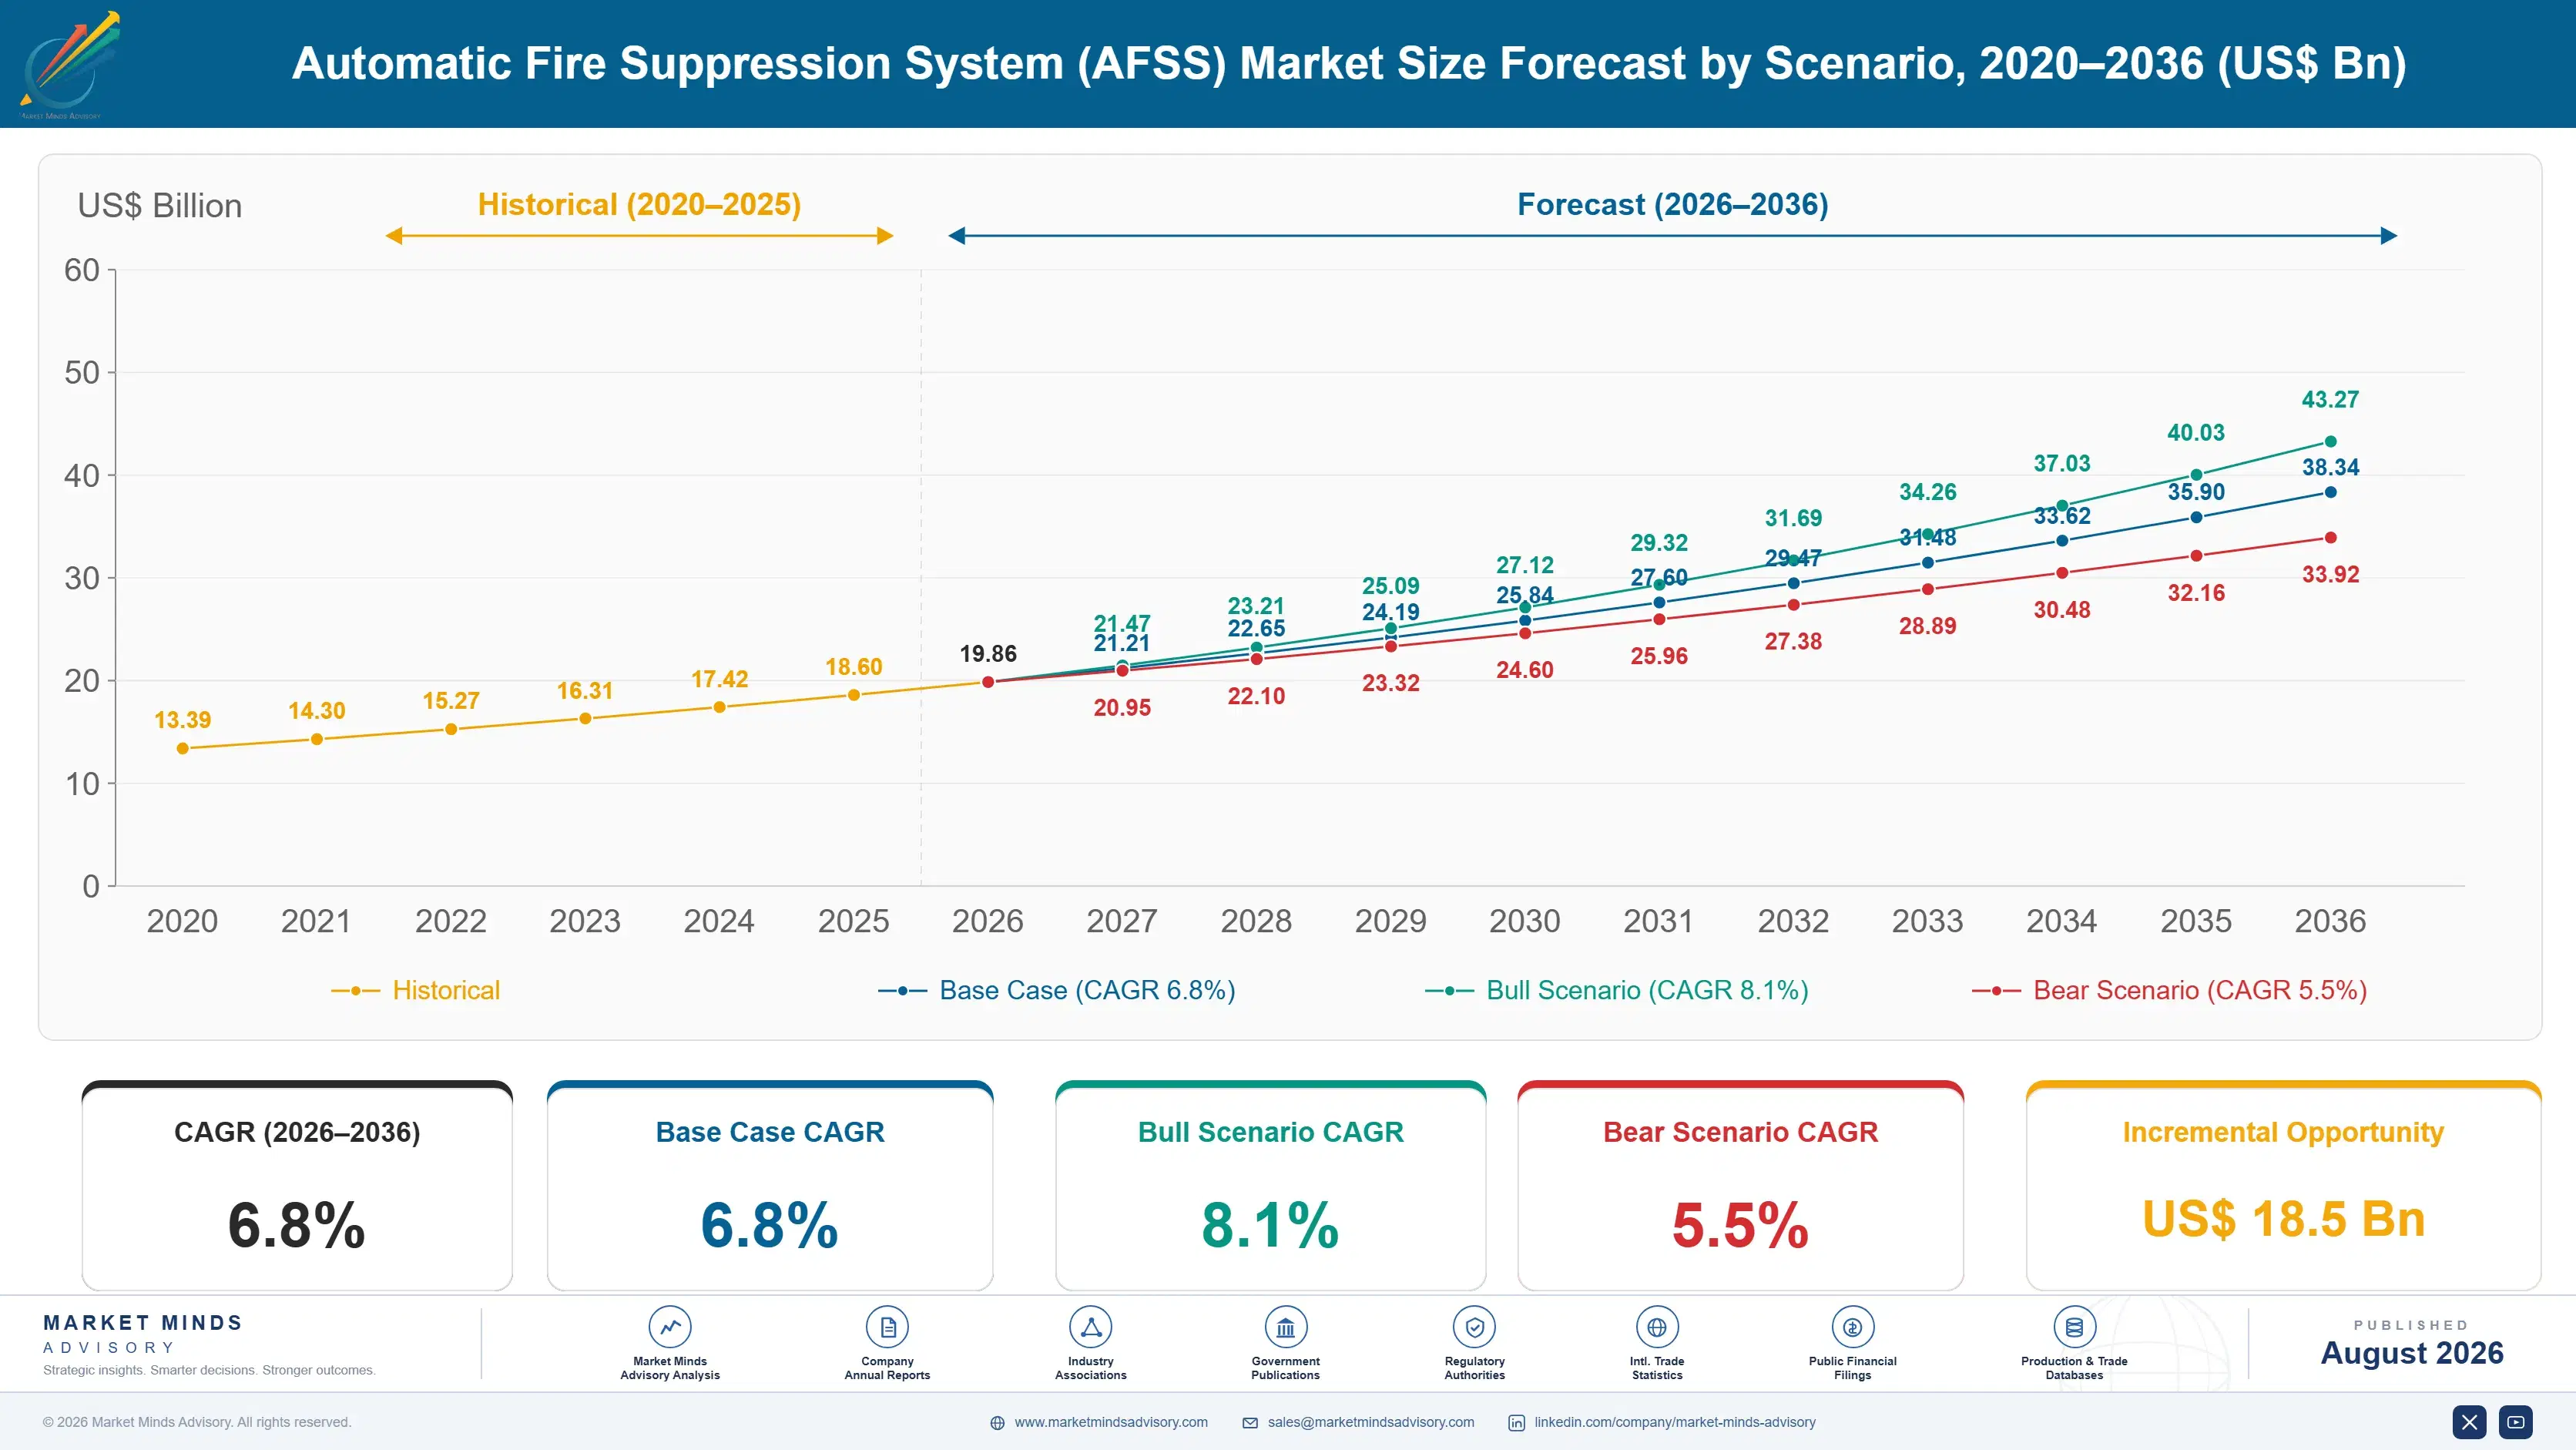
Automatic Fire Suppression System (AFSS) Market Forecast Scenarios

automatic-fire-suppression-system-afss-market-size-forecast-scenario-1787333448554
Between 2020 and 2025 the market grew on two things nobody in the industry chose. Data centre construction expanded faster than any building category, and each hall specifies gaseous or mist suppression with detection to match. At the same time fluorinated agent phase-down schedules began forcing replacement in installations that were working perfectly well. A 5.6% historical CAGR combines a construction boom with a regulatory one.
Three mechanisms carry the 6.8% base case. Fluorinated agent phase-down under global treaty is the largest, because it converts a working installation into a scheduled replacement with a date nobody can negotiate. Data centre and semiconductor construction is the second, since those buildings specify suppression at densities and standards ordinary commercial work never approaches. And battery energy storage keeps adding installations that existing agents suppress poorly, which forces both new products and new standards.
The 8.1% bull case turns on battery storage standards mandating suppression approaches the current agent set cannot deliver, which would create a replacement cycle across an installed base built in the past five years. The 5.5% bear case is commercial construction weakness reaching new installation demand, though service and phase-down replacement continue regardless. Regulation carries this market in either direction.

Equipment Judged Only On A Day Nobody Plans

Nobody buys a suppression system because they want one. It gets bought because a code requires it, an insurer demands it, or an authority will not sign an occupancy certificate without it. That makes the specification a compliance exercise and the purchase a reluctant one, which is why price pressure is constant even on equipment protecting assets worth many multiples of its cost. Life safety spending is reluctant spending almost everywhere.
TOP FIVE CONCENTRATION39%Local installation and service trades hold the customer relationship
AVERAGE SYSTEM VALUEUSD 42,000Typical installed system value across commercial and industrial buildings
SERVICE REVENUE SHARE47%Inspection, testing, and maintenance beyond the original installation
SYSTEM SERVICE LIFE25 to 40 yearsOperating years before a fixed system requires full replacement
PHASE-DOWN EXPOSURE38%Share of gaseous installations using agents on a phase-down schedule
LEADING PRODUCER SHARE33%Manufacturing concentrates where approval listings originated and remain strongest
Service is the business rather than the sale. Inspection, testing, and maintenance carry 47% of category revenue across a system life of 25 to 40 years, and the contractor holding that contract renews it almost indefinitely because switching means a new party taking responsibility for somebody else's installation. That is why the leading manufacturers all bought service networks and why concentration sits at only 39%. Renting that relationship is an expensive habit.
The agents are the immediate problem. Roughly 38% of gaseous installations use fluorinated agents facing phase-down under global treaty, which converts working equipment into scheduled replacement. Owners discover this when a service contractor mentions it, not when a regulator writes to them, and the replacement lands in a capital budget nobody prepared.
"Every other building system announces when it fails. The lift stops, the chiller trips, the lights go out. A suppression system that will not work looks exactly like one that will, right up until the morning it matters. That is the entire commercial problem in one sentence."
Director, Fire and Life Safety Practice · MMA Construction and Industrial Equipm

Market Trends

Fluorinated Agent Phase-Down Forces Replacement On A Timetable

Clean agents based on hydrofluorocarbons are being phased down under the Kigali Amendment and reinforced by European and American regulation, which puts a published schedule against roughly 38% of gaseous installations. The equipment works, the owner is satisfied, and it has to be replaced anyway. Alternatives exist in fluoroketones, inert gas blends, and water mist, but each has different room integrity, space, and cost implications that make substitution a design exercise rather than a cylinder swap. Suppliers who mapped their own installed base know exactly where that demand sits and when it arrives.
Market Impact: Density runs 5 times commercial nor
Battery Energy Storage Outruns The Existing Agent Set

A lithium cell in thermal runaway generates its own oxygen and reignites after apparent extinguishment, which defeats gaseous agents that work by displacing oxygen or absorbing heat. Water applied in sufficient volume and duration is currently the most effective response, and that conflicts with everything else in an electrical room. Standards bodies are still writing the requirements while installations are being built at pace, which means a large population of storage sites carries protection nobody has fully validated. Whoever solves this properly gets a category that barely existed five years ago.
Market Impact: Premiums shift by 20% on compliance

Market Opportunities and Growth Drivers

Data Centre Construction Specifies Suppression At Unusual Density

A data hall protects equipment worth far more per square metre than the building around it, cannot tolerate water damage, and must stay operating through and after any event, which pushes specification toward clean agent, inert gas, or high pressure mist with very early detection throughout. Construction across this category is expanding faster than any other building type and each facility carries suppression content several times ordinary commercial density. The specification is written by engineers who read approval listings carefully and buy on performance rather than on price. Approval listings decide who can even bid.
Market Impact: Functional tests occur under 2 perc

Insurance Requirements Reach Buildings Codes Do Not

Property insurers increasingly require suppression in occupancies where building codes do not, particularly warehousing with high piled storage, lithium battery handling, and older industrial premises where a claim history exists. An insurer setting a premium condition moves faster than any code revision and reaches the owner directly rather than through a design process. That produces retrofit demand in buildings nobody was planning to touch, on timescales set by policy renewal. Suppliers who work with insurance risk engineers find a specification channel most competitors ignore entirely. Most competitors ignore that channel completely and always have.
Market Impact: Contractors decide 74% of replaceme

Market Restraints and Challenges

Nobody Verifies That An Installed System Still Works

Inspection regimes check pressure gauges, physical condition, and paperwork, and only rarely confirm that a system would actually discharge and suppress. The root cause is that a genuine functional test discharges expensive agent and disrupts the protected space, so it almost never happens after commissioning. Commercially this means degraded systems stay in service and replacement demand arrives only through regulation or after an incident. Suppliers are mitigating with connected monitoring of cylinder pressure and valve status, room integrity testing services, and inspection reporting that documents what was not verified. Degradation stays invisible until it matters.
Market Impact: Phase-down affects 38% of installat

Local Service Contractors Hold The Customer Relationship

Installation and maintenance are performed by thousands of local contractors who hold the building relationship, specify replacement equipment, and decide which manufacturer's product goes in. The root cause is that fire protection is a licensed trade with local approval requirements that a manufacturer cannot bypass. Commercially it means the manufacturer is frequently invisible to the building owner and competes for contractor loyalty rather than end user preference. Suppliers are mitigating by acquiring service businesses outright, by building contractor training and certification programmes, and by improving parts availability. The manufacturer is frequently invisible to the owner entirely.
Market Impact: Runaway reignites after 4 hours
3 additional market trends, 4 additional growth drivers, and 2 additional restraints and challenges are covered in the full report. Contact sales@marketmindsadvisory.com to access the complete intelligence.

Segment CAGR and Growth Architecture

Segmentation follows suppression agent and delivery method, because the agent determines the hazards a system can address, the room integrity it requires, the regulatory exposure it carries, and the space its storage consumes. Occupancy type, detection technology, and service model are handled in the framework and commentary rather than as segments here. Nothing else divides this market so cleanly.
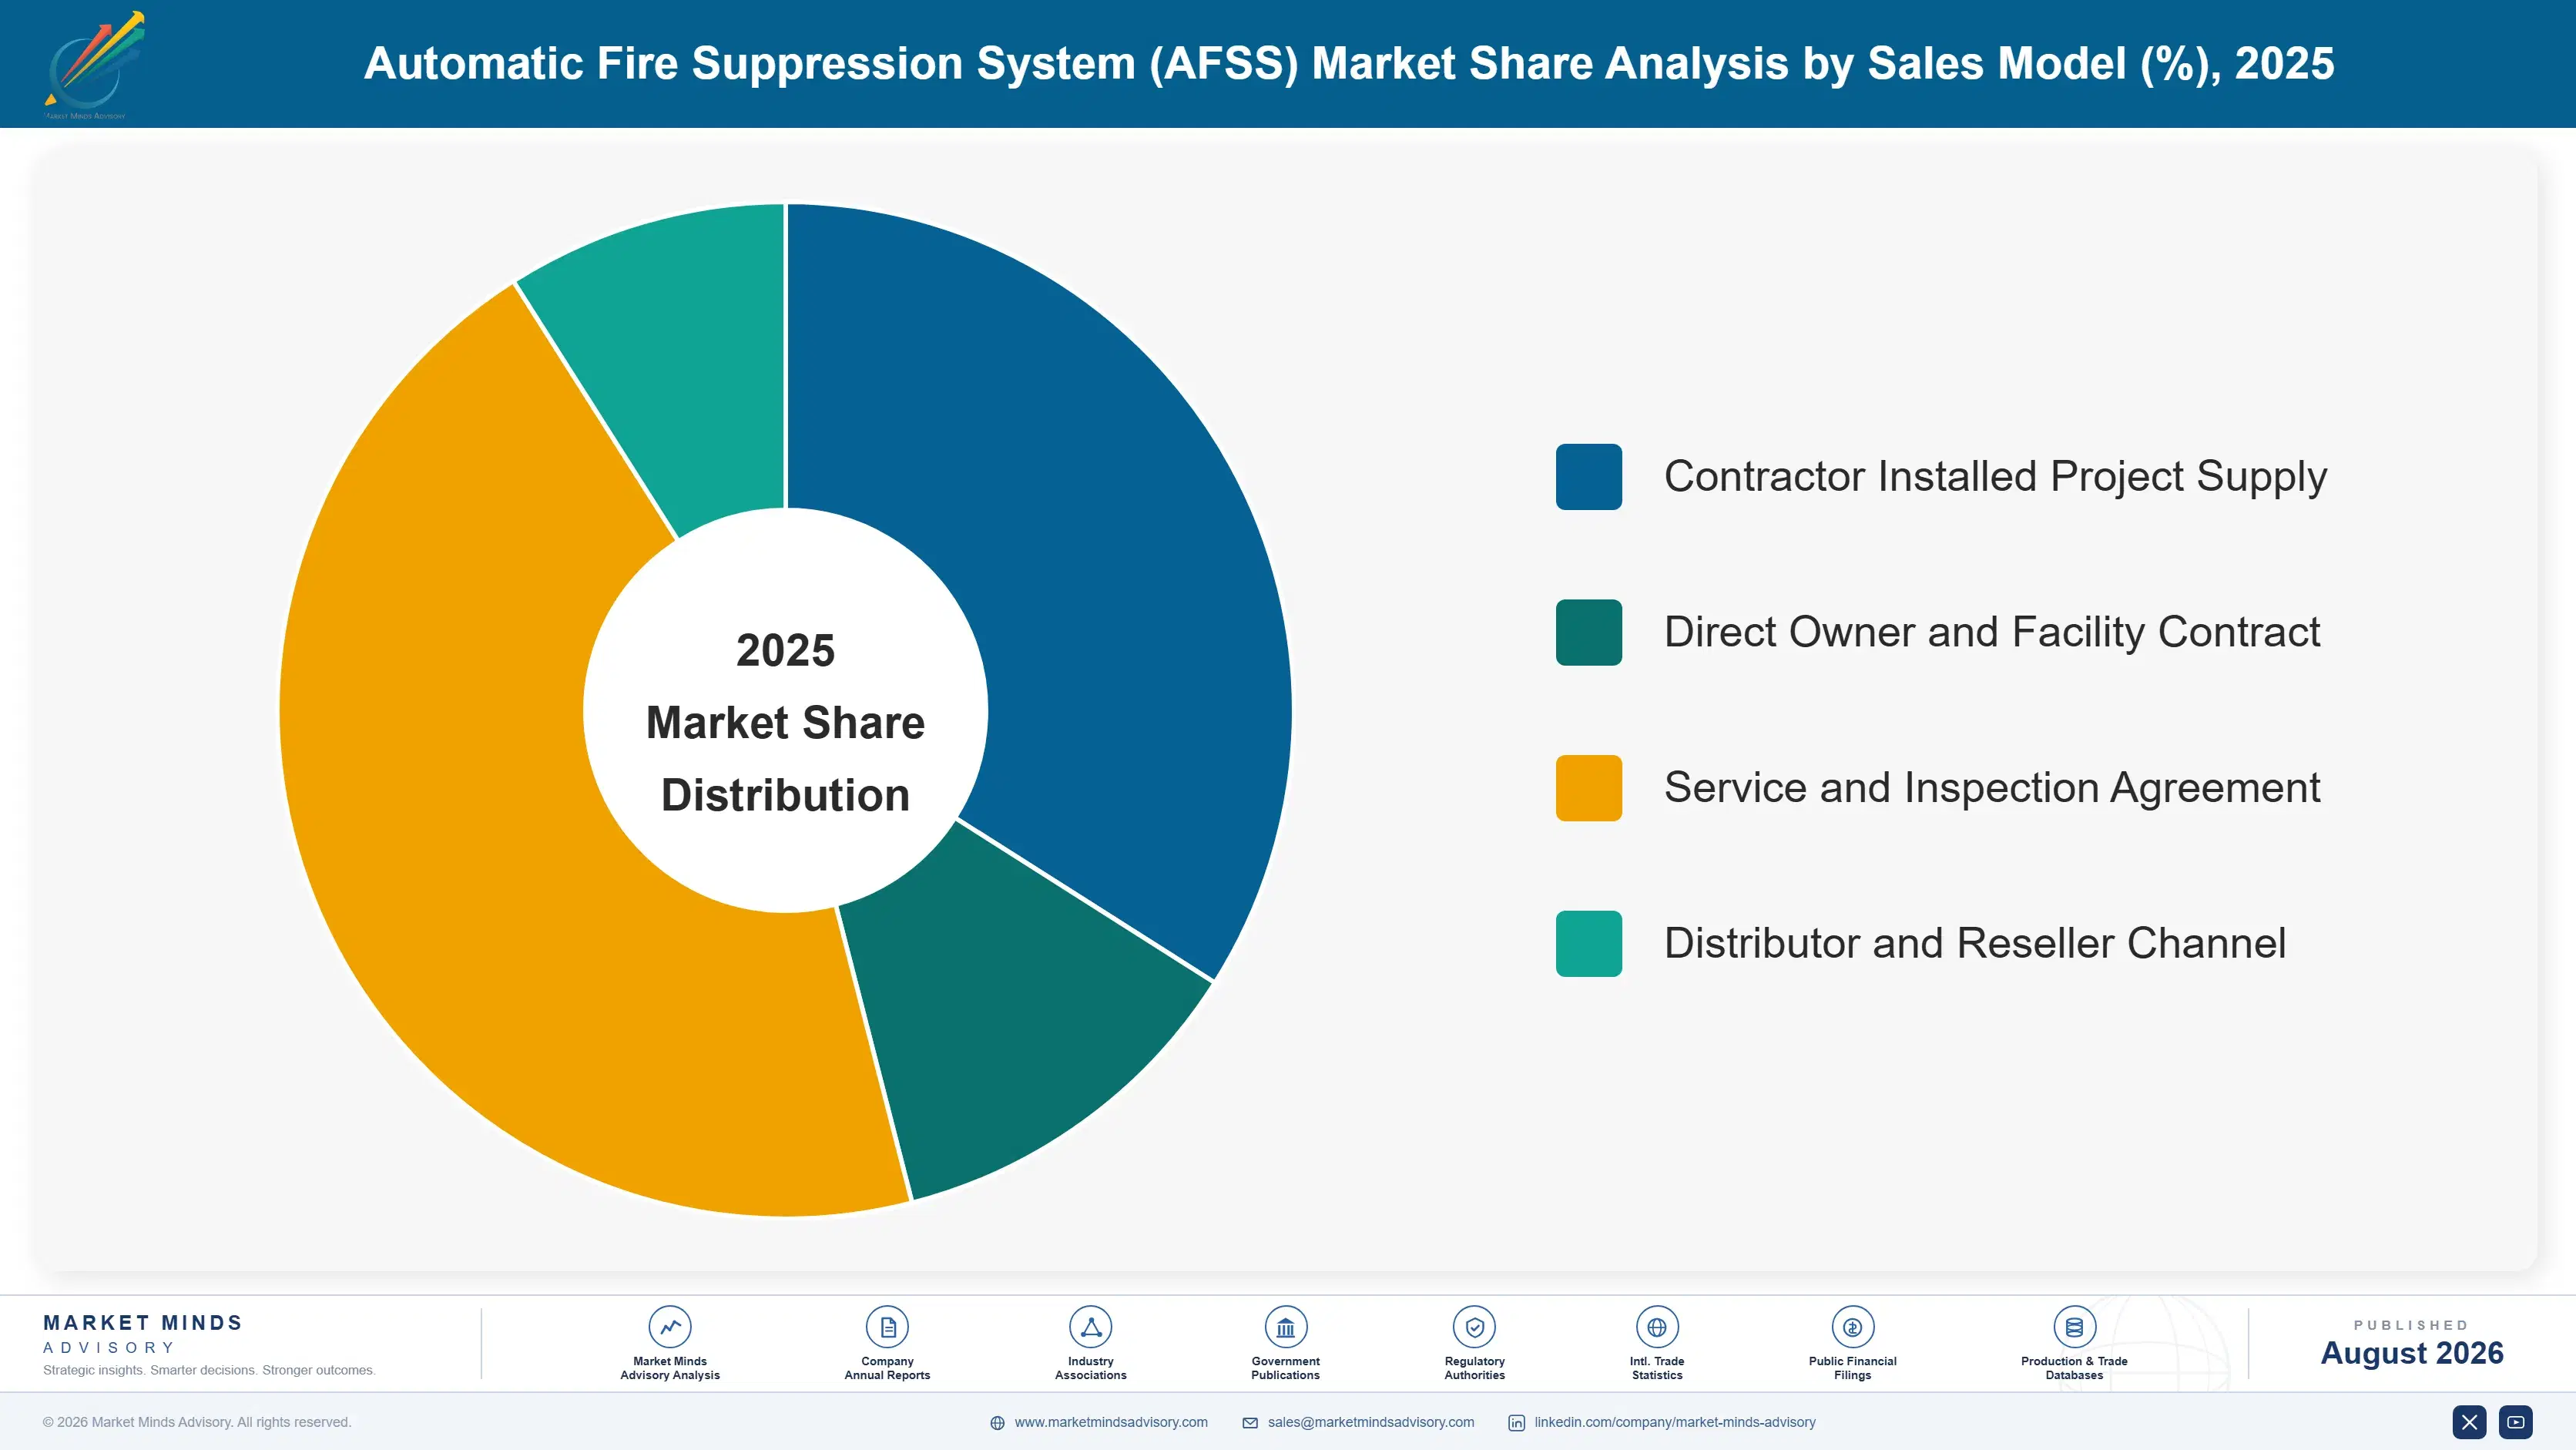
automatic-fire-suppression-system-afss-market-market-share-analysis-1787333449095

Clean Agent Gaseous Systems

Clean agent systems grow fastest at 11.2%, about 1.65 times the market rate, and regulation rather than demand explains most of it. Fluorinated agents protecting roughly 38% of gaseous installations are being phased down under the Kigali Amendment and reinforced by European and American rules, which turns working equipment into scheduled replacement on a published timetable. Fluoroketone alternatives and synthetic blends exist, but each carries different concentration, room integrity, and storage volume requirements, so substitution is a design exercise rather than a cylinder change. Data centre and electronics construction adds genuine new demand alongside the replacement wave. Suppliers who mapped their own installed base know precisely where that revenue sits and when it arrives.
CAGR 11.2%

Water Mist Systems

Water mist grows at 9.4% by solving problems both sprinklers and gaseous agents handle badly. Very fine droplets absorb heat and displace oxygen locally using a fraction of the water a sprinkler discharges, which limits damage in spaces where water is nearly as unwelcome as fire. Machinery spaces, turbine halls, historic buildings, and cabin protection on ships and rail all specify it for that reason. It needs no room integrity and faces no agent phase-down exposure at all, which is becoming its strongest commercial argument. High pressure pump skids and nozzle qualification make the engineering demanding, and approval listings for specific hazards are what limit who can actually bid. Listings rather than engineering limit the field.
CAGR 9.4%
Full segment breakdown across 7 segments available in the complete report.

Regional Architecture and Country Demand Map

Regional shares follow building codes and insurance practice rather than construction volume alone, since a suppression system is fitted because a rule requires it. Retrofit dominates the mature regions and new installation dominates the growing ones, and the two behave nothing alike. Retrofit and new build barely resemble each other.

North America

North America holds 30% of value, the largest share anywhere, on a combination of prescriptive codes, active insurer involvement, and the densest data centre construction programme in the world. Sprinkler requirements reach further into ordinary occupancies here than in most of Europe, which produces a very large installed base needing inspection and testing on a fixed cycle. Agent phase-down under American regulation is proceeding on a firm schedule and affects a substantial gaseous population. Property insurers set suppression conditions in warehousing and battery handling that codes have not yet caught up with. Growth at 6.4% sits close to the global rate, carried by data centres and agent replacement rather than by any expansion in commercial building volume.
Share: 30% | CAGR: 6.4% (2026 to 2036)

East Asia

Construction volume gives East Asia 24% of value, and the demand profile is almost entirely new installation rather than retrofit. Chinese commercial, industrial, and data centre building continues at a scale no other region approaches, and fire code enforcement has tightened considerably after several high-profile incidents. Domestic manufacturers supply most sprinkler and foam volume at prices international suppliers cannot match, while clean agent and mist systems still favour imported product on approval listings. Japanese and Korean demand is replacement-weighted and technically demanding, with semiconductor fabrication driving unusually high specification. Growth at 7.9% exceeds the global rate on construction volume, and domestic supply keeps taking a larger share of it every year.
Share: 24% | CAGR: 7.9% (2026 to 2036)
Regional intelligence for 5 additional markets available in the complete report: Western Europe, South Asia and Pacific, Latin America, Middle East and Africa, Eastern Europe. Contact sales@marketmindsadvisory.com.
automatic-fire-suppression-system-afss-market-country-cagr-analysis-1787333449607

Where Suppression Revenue Actually Sits

Four levers matter here, and hardware performance is barely among them. Installed base intelligence, service contract capture, contractor loyalty, and battery hazard capability decide outcomes, because the customer relationship sits with a local trade and the demand arrives on a regulatory calendar. A manufacturer competing on discharge performance is arguing about something nobody in the chain evaluates.

Map Your Own Installed Base Before The Phase-Down

Roughly 38% of gaseous installations use agents on a published phase-down schedule, which means a very large replacement demand exists at known addresses on known dates. A manufacturer who has catalogued its own installed base by agent, quantity, and site knows exactly which owners face replacement and when, and can approach them before the service contractor does. Most manufacturers have no such register because installation records sit with contractors. Building one costs administrative effort against demand that is already legislated into existence and cannot go anywhere else. The demand is legislated and cannot go anywhere else.
Market Impact: Phase-down now covers 38% of all ga

Own The Service Contract, Not Just The Equipment

Inspection, testing, and maintenance carry 47% of category revenue across a 25 to 40 year system life, and the holder renews almost indefinitely because switching means a new party accepting responsibility for somebody else's installation. That contract also decides which manufacturer's equipment goes in at replacement. Acquiring service businesses is expensive and unglamorous against product development, which is why the leading suppliers spent years doing exactly that. A manufacturer selling equipment into contractors it does not own is renting its own customer relationships. Owning the contract owns the replacement decision too.
Market Impact: Service already carries 47% of all

Solve Battery Storage Before The Standard Is Written

Lithium thermal runaway generates its own oxygen and reignites hours after apparent extinguishment, which defeats agents that work by oxygen displacement and leaves water as the only reliable answer in an electrical room where water is unwelcome. Standards bodies are still writing requirements while installations are being built at pace. A supplier with tested capability and published evidence ahead of the standard shapes what the standard requires, which is the most valuable position in any regulated category and is currently unclaimed. Runaway reignites up to 4 hours after apparent extinguishment.
Market Impact: Reignition can occur up to 4 hours

Sell The Verification Nobody Currently Performs

Functional discharge testing happens on under 2 percent of installed systems after commissioning, because it costs agent and disrupts the protected space, so a degraded system looks identical to a working one indefinitely. Connected monitoring of cylinder pressure and valve position, room integrity testing, and inspection reporting that documents what was not verified all convert an invisible risk into a documented one. Owners who see the documentation fund remediation they would never otherwise consider, and the supplier producing the evidence is the obvious source. Evidence is what opens a remediation budget.
Market Impact: Under 2 percent of systems receive

Who Controls the Margin Pool

Concentration sits at 39% for the top five, lower than the scale of the leading suppliers implies, because installation and maintenance are licensed local trades and thousands of contractors hold the building relationship. The gap between leaders and challengers is agent portfolio breadth, approval listings, and owned service capacity rather than equipment performance. All participants here are assessed on one basis, revenue from fixed suppression systems and the service contracts attached to th
Competition runs on four lines. Agent portfolio decides who can offer an alternative when a phase-down forces replacement. Approval listings decide which hazards a system may legally protect. Owned service capacity decides whether a manufacturer keeps the customer or rents it from a contractor. Price decides commodity sprinkler components, where regional manufacturers set the level.

Two pressures will shift positions. Agent phase-down is redistributing a very large installed base toward whoever holds credible alternatives and knows where the affected systems are. Meanwhile battery storage has created a hazard the existing agent set addresses badly and no standard yet defines. Positions favour whoever combines a full agent portfolio with owned service reach, and few suppliers genuinely hold both.
automatic-fire-suppression-system-afss-market-company-positioning-matrix-1787333450133

Competitive Moat and Risk Dimensions

JOHNSON CONTROLS

Moat: Agent breadth and owned service

Johnson Controls carries the widest suppression portfolio in the industry across sprinkler, clean agent, foam, and detection, alongside an owned service organisation reaching buildings directly rather than through third parties. That combination means a phase-down replacement stays inside the company rather than going to a competitor's alternative. Approval listings across hazards and jurisdictions took decades to accumulate.
JOHNSON CONTROLS

Risk: Exposure to legacy agent portfolio

A large installed base using agents facing phase-down is an opportunity only if the customer converts to a company alternative rather than to a competitor's, and service contractors influence that choice heavily. Portfolio breadth also spreads engineering attention across many product lines competing for capital. Litigation exposure around legacy firefighting foam chemistry remains a material overhang on the business.
CARRIER

Moat: Clean agent and mist depth

Carrier holds strong positions in clean agent and water mist through brands with approval listings across data centre, marine, and machinery hazards where specification is technical. Water mist in particular faces no agent phase-down exposure at all, which is becoming a genuine commercial advantage. Detection and controls integration reaches the same specifier through one relationship.
CARRIER

Risk: Thinner owned service network

Service reach is less complete than the leading competitor holds, which leaves more of the customer relationship with independent contractors who decide replacement equipment. Portfolio restructuring has consumed management attention across recent years. Sprinkler and foam positions are weaker than the clean agent business suggests, which limits the ability to serve a whole building from one supplier.

Players Tracked

Prominent Players

Johnson Controls
Carrier
Honeywell
Siemens
Minimax Viking

Other Key Players

Halma
Hochiki
Bosch
Gielle
Fike
Amerex
Firetrace International
Rotarex Firetec
Reliable Sprinkler
Victaulic
NAFFCO
Nittan
Securiton
WAGNER Group
HD Fire Protect

Recent Developments

MARCH 2025

Fluorinated agent phase-down schedules tighten across major markets

European and American regulators confirmed tightened phase-down steps for fluorinated suppression agents, narrowing the window in which existing installations may be maintained and recharged. These were regulatory confirmations rather than commercial events, and they convert working gaseous systems into scheduled replacements with dates owners cannot negotiate.
Signal: A phase-down date creates demand at known
OCTOBER 2024

Battery storage suppression standards remain unresolved as installations grow

Standards bodies continued developing fire protection requirements for lithium battery energy storage while installations were commissioned at pace under interim guidance. These were standards processes rather than commercial transactions, and they leave a large installed population protected by approaches nobody has fully validated against thermal runaway behaviour.
Signal: Building faster than the standard is writt
JUNE 2024

Insurers extend suppression conditions to lithium handling occupancies

Property insurers extended suppression requirements to warehousing and logistics occupancies handling lithium batteries, imposing conditions well ahead of the building code revisions in most jurisdictions. These were underwriting decisions taken by insurers rather than commercial transactions, and they reach building owners directly on policy renewal timescales instead.
Signal: An insurer condition moves an owner faster

Steel, Agents, Electronics, And Labour

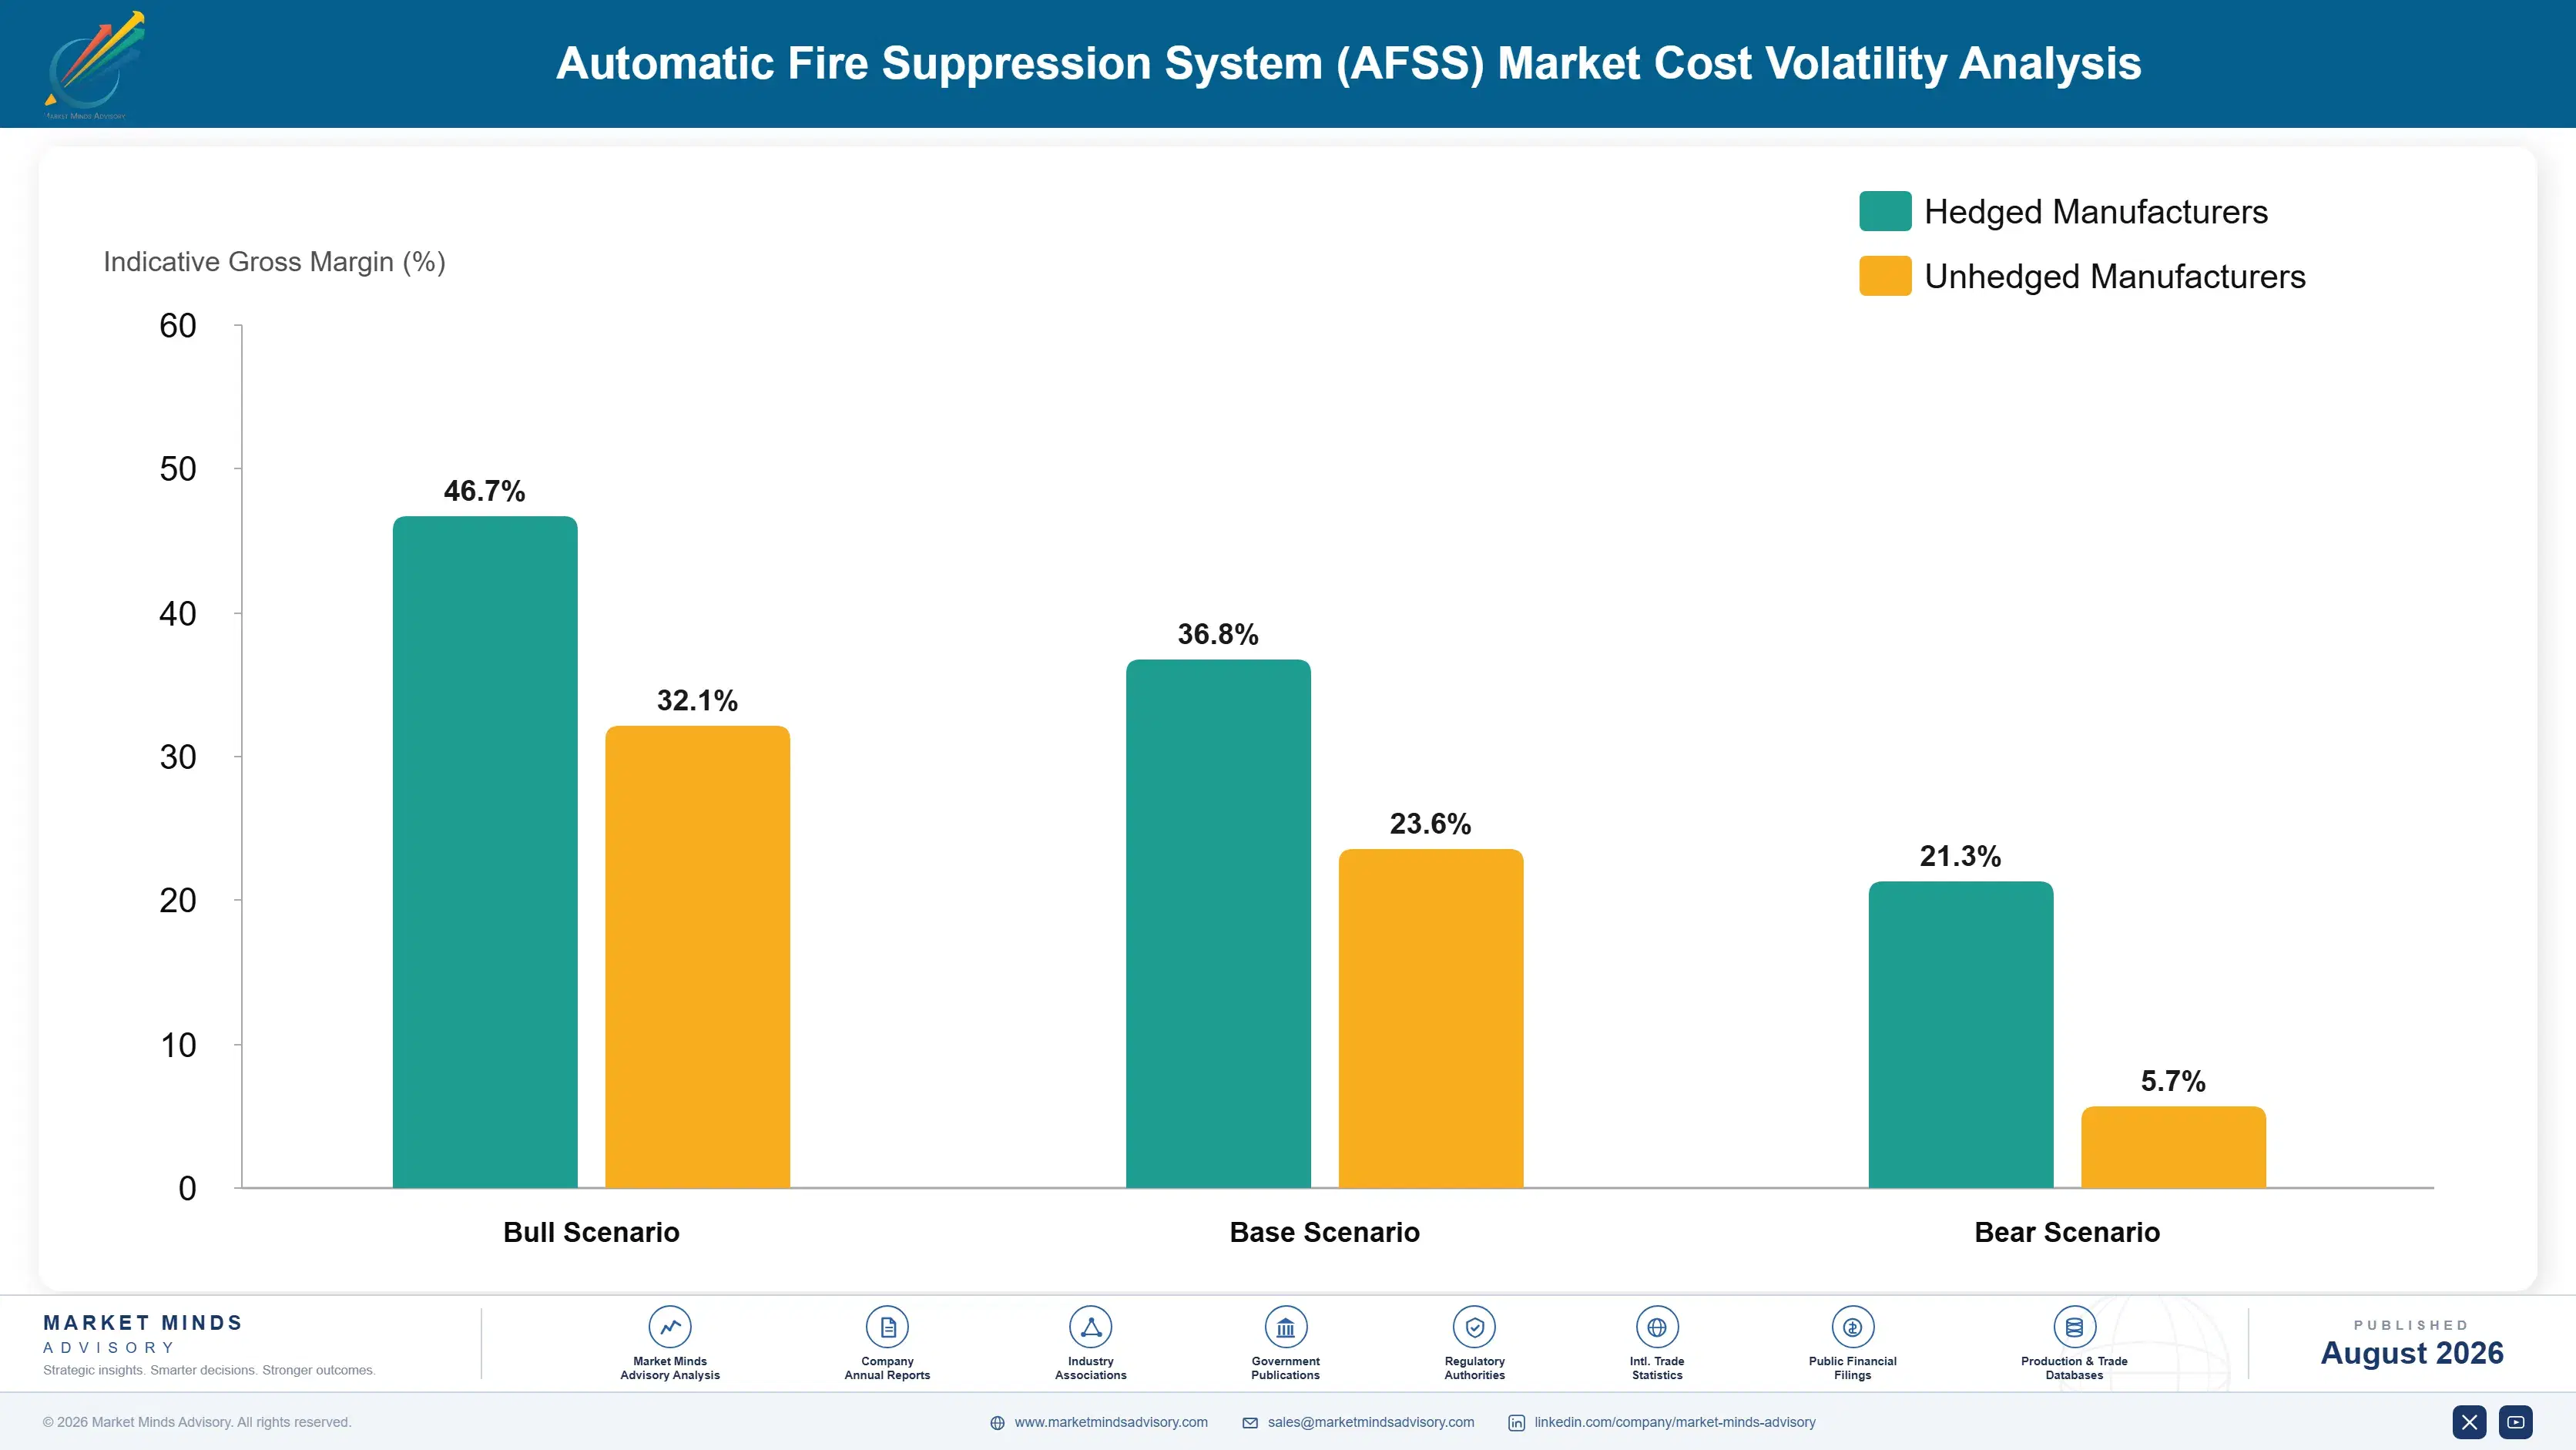
Cost structure separates completely by system type. Steel pipe, fittings, and valves carry 38% to 52% of a sprinkler installation, priced against regional benchmarks. Suppression agent runs 26% to 40% on a clean agent system, from a narrow chemical base with phase-down exposure attached. Detection and controls add 12% to 20%. Installation labour is the largest line on most projects and varies by market.
Fluoroketone and synthetic agent pricing rose sharply as phase-down schedules tightened supply of legacy agents and demand shifted to alternatives, while steel and electronics moved through 2021 and 2022 under energy and semiconductor pressure. The IEA documented the underlying industrial energy constraint. Johnson Controls and Carrier both disclosed input cost pressure across that period. Contractors on fixed-price installation contracts absorbed most of it, since a project quoted one year is installed the next.

Each range above exceeds three points because a sprinkler installation and a clean agent system share almost no components. Exposure separates by system mix. A sprinkler-weighted supplier carries steel risk it can index against published benchmarks. A gaseous supplier carries agent exposure to a narrow chemical base under regulatory pressure it cannot influence. Labour cost separates markets more than any manufactured input.
automatic-fire-suppression-system-afss-market-cost-volatility-analysis-1787333450330

Contract alternative agent supply ahead of the phase-down

Replacement agents come from a narrow chemical supplier base that is about to face demand from every installation converting off legacy chemistry at broadly the same time. A supplier without contracted volume becomes a residual customer just as its own base needs converting. Multi-year agreements cost commitment against demand that is legislated rather than forecast, which is unusually low risk.

Index installation contracts to steel and labour

Steel carries up to 52% of a sprinkler installation and labour more than either, while contracts are frequently quoted a year before the work is done. That gap is a commodity and wage position taken without intending to. Indexation on both costs a concession at award and removes exposures that already erased contracting margin.

Standardise detection and control across system types

Detection and control electronics carry 12% to 20% of cost and are largely common across sprinkler, gaseous, and mist systems if a supplier designs them that way. Most portfolios grew by acquisition instead, leaving several control platforms nobody consolidated. Rationalising costs a development cycle and permanently improves purchasing scale, spares holding, and the training burden on service technicians together.

Portfolio Architecture for Margin Defence

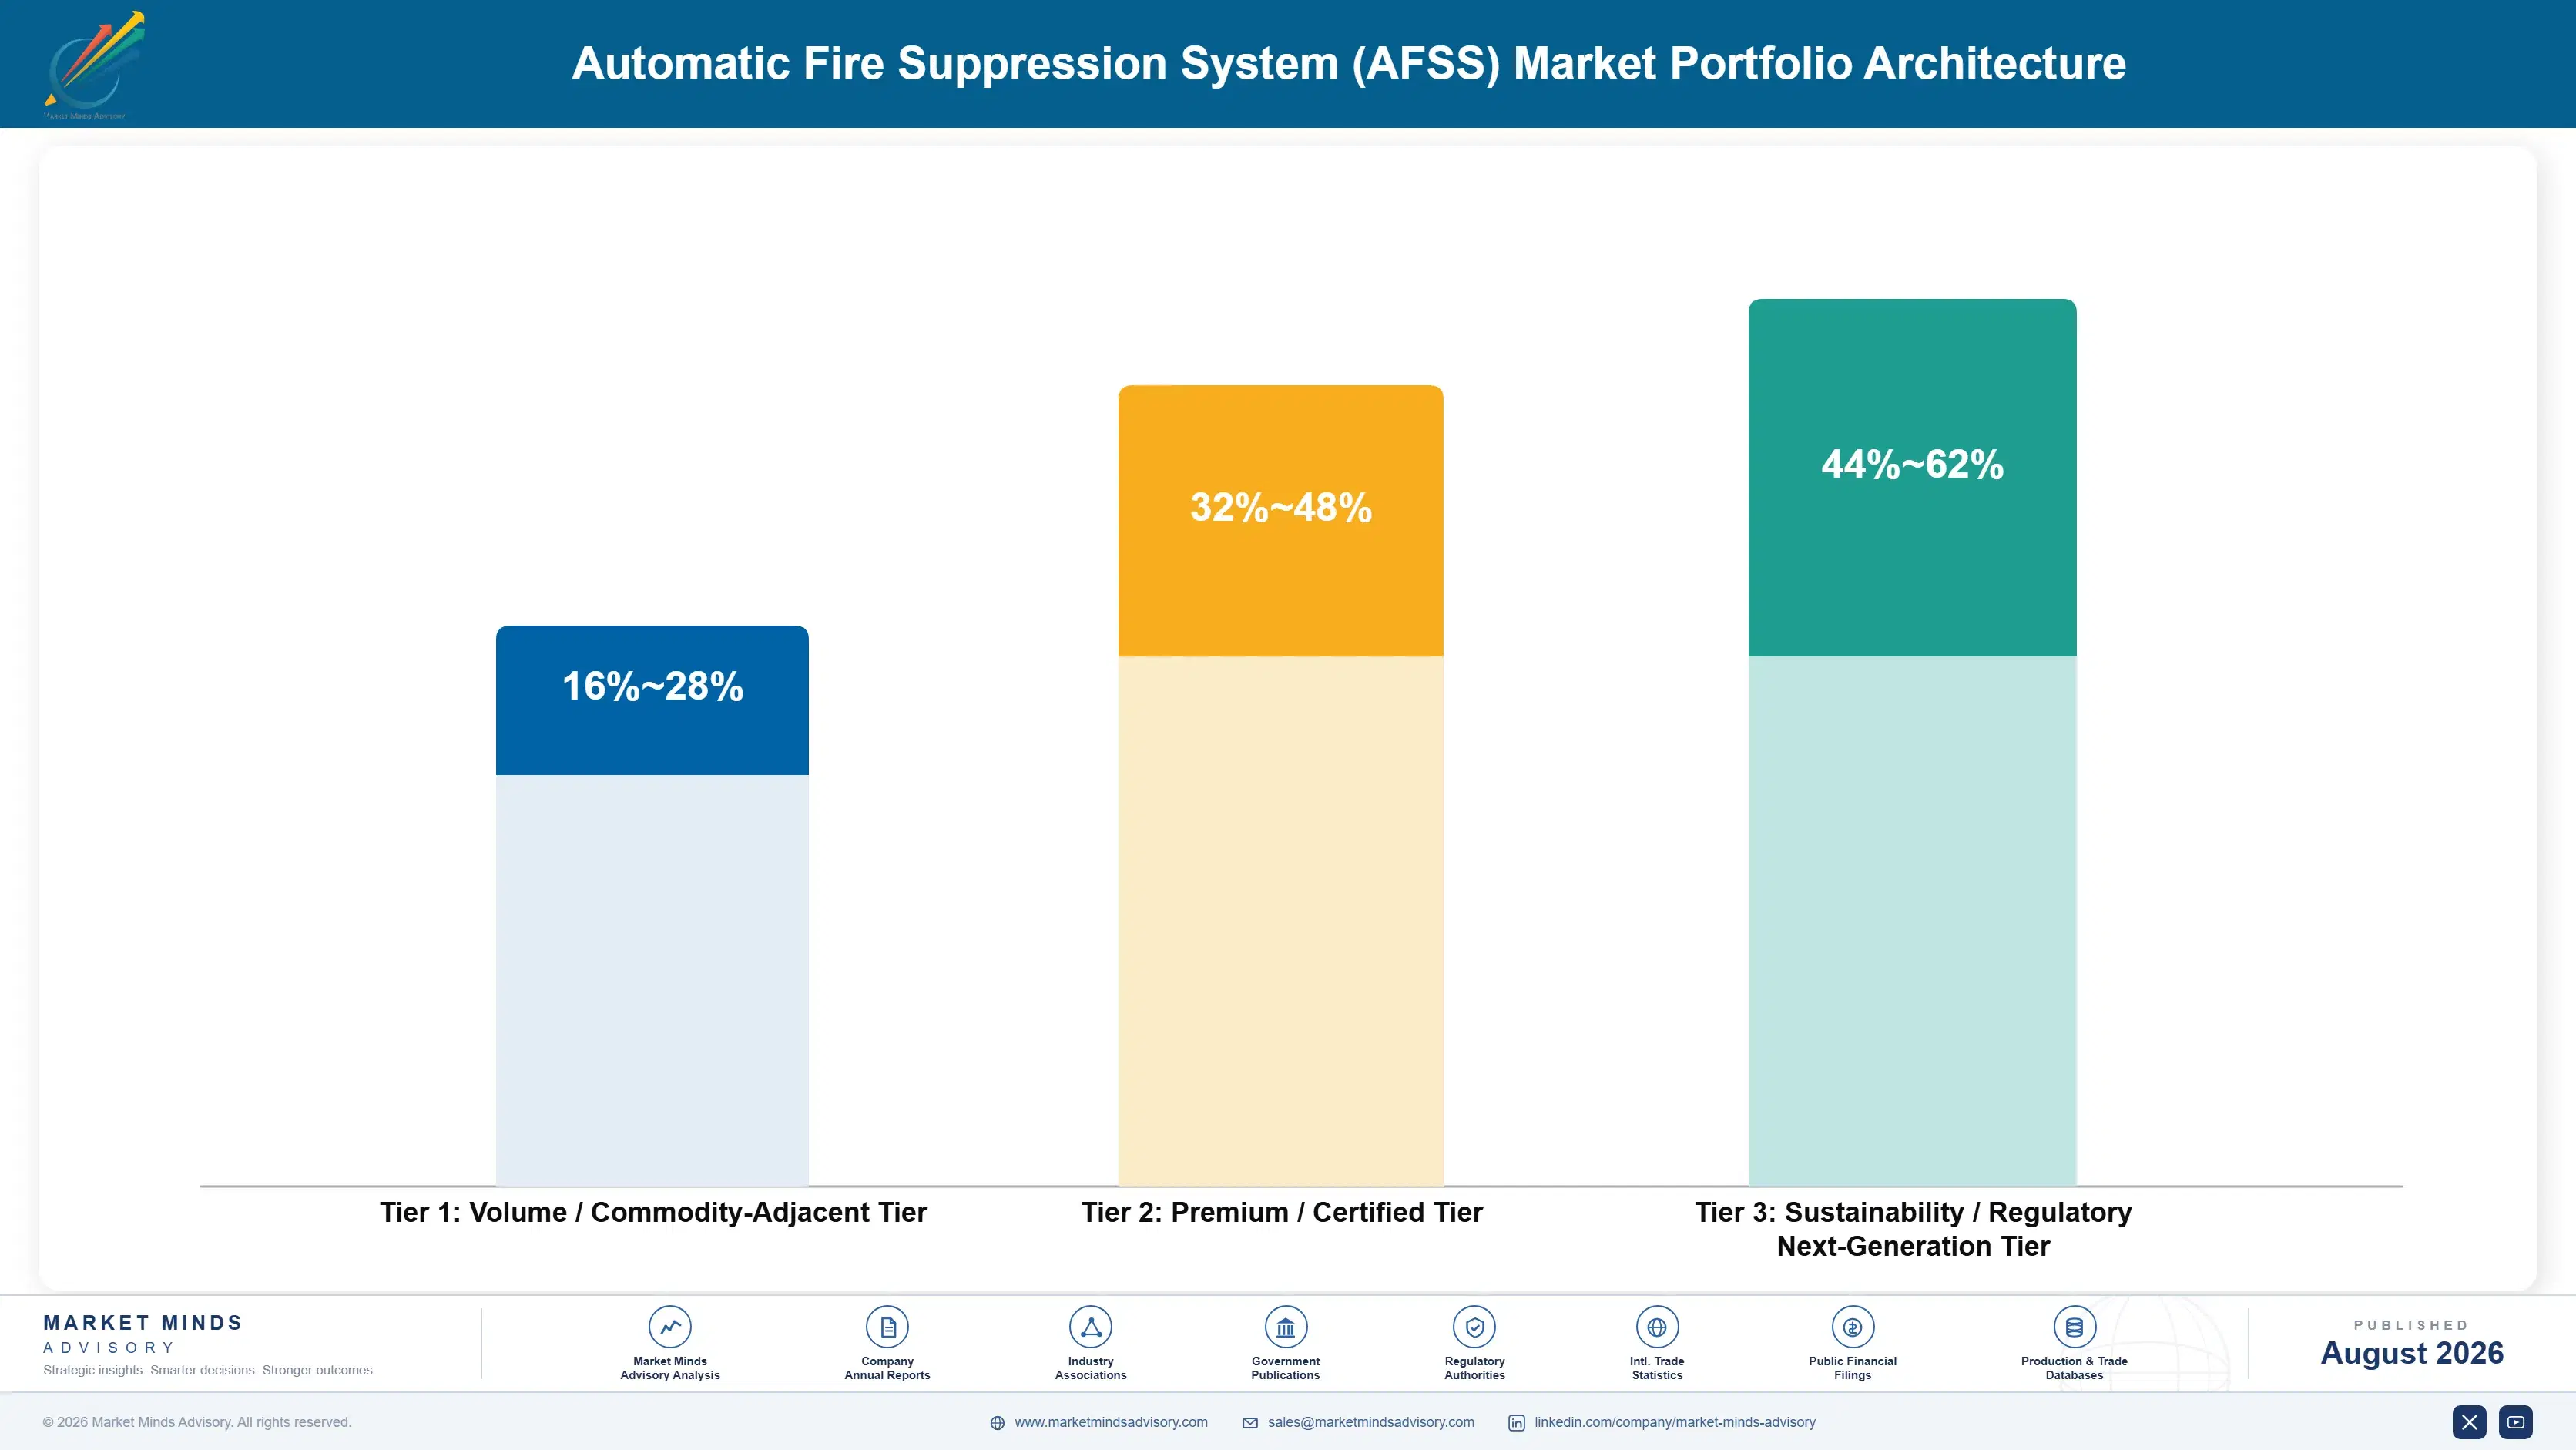
Three tiers sit inside this category and the agent draws most of the lines. Water sprinkler systems form the volume tier, where components are commoditised and installation labour is the real cost. Clean agent, inert gas, and mist systems earn more, because approval listings and design content limit who can supply them. Service contracts, monitoring, and agent conversion price highest and carry the most dependable revenue in the business.
The tension is between installation revenue that arrives once and service revenue that arrives forever. An installation is a project with a competitive tender and thin margin. The service contract behind it renews for decades at margins the project never approached, and it decides what equipment goes in at replacement. Manufacturers selling equipment through independent contractors capture the first and rent the second.

High-value pools concentrate where approval or access limits competition: clean agent conversions on a known installed base, water mist in hazards nothing else addresses, battery storage protection ahead of any standard, and owned service contracts on systems the supplier installed. The commodity end is sprinkler pipe, heads, and valves, where regional manufacturing sets the price and nobody defends anything.

Volume / Commodity-Adjacent Tier

Sprinkler heads, pipe, valves, and standard components supplied into contractor installations. The range is wide because regional manufacturing cost positions and branded approval listings produce different economics on functionally comparable parts.
Gross Margin: 16-28%

Premium / Certified Tier

Clean agent, inert gas, and water mist systems carrying approval listings for specific hazards and occupancies. The range is wide because listing breadth decides which projects a supplier can bid and gaps only appear when a specification is lost.
Gross Margin: 32-48%

Sustainability / Regulatory / Next-Generation Tier

Service contracts, connected monitoring, agent conversion programmes, and battery hazard protection. The range is wide because recurring service carries very different margin from a one-off conversion on the same installed system.
Gross Margin: 44-62%
automatic-fire-suppression-system-afss-market-portfolio-architecture-1787333450837

High-value Sub-segments and Strategic Watch-out

Clean Agent Gaseous Systems

High value and high growth at 11.2%, the fastest segment, because phase-down converts 38% of gaseous installations into scheduled replacements owners cannot defer. Substitution is a design exercise rather than a cylinder change, which favours suppliers holding a full alternative agent portfolio already. Portfolio breadth wins this.
Gross Margin: 32-48%

Water Mist Systems

High value with strong growth at 9.4%, solving hazards where water damage is nearly as unwelcome as fire and gaseous agents cannot be used. No agent phase-down exposure at all is becoming its strongest argument, and hazard-specific approval listings decide who can bid. No phase-down exposure at all.
Gross Margin: 32-48%

Water Sprinkler Systems

The volume core by value at 5.4%, carrying the overwhelming majority of protected floor area worldwide and the least differentiated product in the category. Installation labour dominates cost, components are commoditised, and the service contract is worth more than the installation was. Labour dominates everything here.
Gross Margin: 16-28%

Foam and Wet Chemical Systems

The strategic watch-out at 5.1%, holding kitchen, fuel, and flammable liquid hazards while legacy foam chemistry carries litigation and environmental exposure suppliers are still working through. Fluorine-free replacements perform differently and requalification across listings is slow and expensive. Requalification across listings is slow, expensive, and still incomplete.
Gross Margin: 32-48%

How Suppression Demand Actually Repeats

Demand commits at building design or code compliance and then repeats as inspection, testing, and eventual replacement across 25 to 40 years. A system installed in a building becomes a documented compliance record tied to specific equipment, and whoever services it holds the relationship and decides replacement. That is why service carries 47% of category revenue and why every major manufacturer bought service capacity. The installation is best understood as the entry price.
Stickiness varies with how documented the compliance obligation is. Pharmaceutical, data centre, and marine installations stick hardest, since changing anything means revisiting approvals and validations nobody volunteers to reopen. Industrial and warehouse systems stick nearly as hard through insurer conditions attached to specific arrangements. Commercial office sticks moderately. Small retail and hospitality sticks least, because the owner retenders inspection on price each cycle.

The buyer has moved from a facilities manager to a corporate risk function and, increasingly, an insurer's risk engineer. Twenty years ago a building manager renewed an inspection contract. Now a risk team sets requirements across a property portfolio and an underwriter attaches conditions to the policy. Suppliers still selling to individual buildings are competing for decisions taken somewhere else entirely.
automatic-fire-suppression-system-afss-market-end-use-penetration-index-1787333451334

Our Call On Fire Suppression

These are among the four positions where our research anticipates prominent divergence between winners and laggards over the coming forecast period. Each is grounded in the demand model, the regulatory perimeter, and the announced capacity pipeline.
01 / INSTALLED BASE INTELLIGENCE

Know where your own agents are sitting

Roughly 38% of gaseous installations use agents on a published phase-down schedule, which means a very large replacement demand exists at specific addresses on specific dates and is legislated rather than forecast. A manufacturer holding a register of its own installed base by agent, quantity, and site can reach those owners before the service contractor suggests a competitor's alternative. Most manufacturers have no such register because installation records sit with contractors, which is an administrative failure with a commercial cost nobody has measured.
02 / SERVICE CONTRACT OWNERSHIP

The install is entry, the service is the business

Inspection, testing, and maintenance carry 47% of category revenue across a system life of 25 to 40 years, and the contract holder renews almost indefinitely because switching means a new party accepting responsibility for equipment somebody else installed. That same contract decides which manufacturer supplies the replacement when the time comes. Suppliers selling through independent contractors capture the installation margin once and then effectively rent the customer relationship from whoever holds the service agreement, which is why every major manufacturer eventually bought service capacity outright.
03 / BATTERY HAZARD POSITIONING

Shape the standard before it is written

Lithium thermal runaway generates its own oxygen and reignites hours after apparent extinguishment, defeating agents that work by oxygen displacement and leaving water as the only reliable answer in rooms where water is deeply unwelcome. Standards bodies are still drafting requirements while installations are commissioned at pace under interim guidance. A supplier with tested capability and published evidence ahead of the standard influences what the standard demands, which is the most valuable and currently least contested position in this whole category.
04 / VERIFICATION AS PRODUCT

Document the test nobody ever performs

Functional discharge testing occurs on under 2 percent of systems after commissioning because it consumes agent and disrupts the protected space, which means a degraded installation looks exactly like a working one for decades. Connected pressure and valve monitoring, room integrity testing, and inspection reports documenting what was not verified all convert an invisible risk into a written one an owner has to answer for. Owners who see that documentation fund remediation they would otherwise never have considered at all.

Engagement Snapshot From the Field

A live engagement with an industry participant carrying material or product regulatory and market exposure ahead of a defining policy shift, showing how our research translates into a defensible multi-year portfolio strategy.
MARKET MINDS ADVISORY · CLIENT ENGAGEMENT SUMMARY
Automatic Fire Suppression System (AFSS) Producer Strategic Portfolio Review and Transition Roadmap 2026·Investment Scenario on Automatic Fire Suppression System (AFSS) Exposure Evaluation 2025-26
CLIENT PROFILE
A European fire suppression manufacturer with roughly USD 290 million in annual revenue engaged MMA as fluorinated agent phase-down deadlines approached across its largest markets (client-reported, unverified by MMA). The company had supplied gaseous systems for three decades, held credible alternative agents, and had no reliable record of where its own installed systems were or what they contained.
STRATEGIC CHALLENGE
Sales wanted to promote the alternative agent range through the contractor channel. Product management wanted to develop a battery storage offering. Nobody could say how many installations were affected by phase-down, where they were, or when each one had to convert. The board needed to allocate a conversion investment before the first deadline passed.
MMA APPROACH
MMA reconstructed the client's installed base from three decades of shipment records, contractor registrations, and service call history, which had never been assembled into one register. We modelled conversion demand by agent, market, and deadline. We then compared three routes: a contractor-channel promotion, a direct owner conversion programme against the register, and a battery storage development investment.
KEY FINDINGS
  1. The reconstructed register identified affected installations representing several years of revenue at conversion values, most of which the client had no current contact with (client-reported, unverified by MMA).
  2. Around 60% of those systems were serviced by contractors who also carried a competitor's alternative agent, which meant conversion would default away without intervention.
  3. A direct owner conversion programme modelled far ahead of contractor promotion, because the owner rather than the contractor faces the compliance deadline.
  4. Battery storage development modelled attractively on a longer horizon but competed for exactly the same engineering resource that the conversion programme itself required.
CLIENT PROFILE
A European fire suppression manufacturer with roughly USD 290 million in annual revenue engaged MMA as fluorinated agent phase-down deadlines approached across its largest markets (client-reported, unverified by MMA). The company had supplied gaseous systems for three decades, held credible alternative agents, and had no reliable record of where its own installed systems were or what they contained.
STRATEGIC CHALLENGE
Sales wanted to promote the alternative agent range through the contractor channel. Product management wanted to develop a battery storage offering. Nobody could say how many installations were affected by phase-down, where they were, or when each one had to convert. The board needed to allocate a conversion investment before the first deadline passed.
MMA APPROACH
MMA reconstructed the client's installed base from three decades of shipment records, contractor registrations, and service call history, which had never been assembled into one register. We modelled conversion demand by agent, market, and deadline. We then compared three routes: a contractor-channel promotion, a direct owner conversion programme against the register, and a battery storage development investment.
KEY FINDINGS
  1. The reconstructed register identified affected installations representing several years of revenue at conversion values, most of which the client had no current contact with (client-reported, unverified by MMA).
  2. Around 60% of those systems were serviced by contractors who also carried a competitor's alternative agent, which meant conversion would default away without intervention.
  3. A direct owner conversion programme modelled far ahead of contractor promotion, because the owner rather than the contractor faces the compliance deadline.
  4. Battery storage development modelled attractively on a longer horizon but competed for exactly the same engineering resource that the conversion programme itself required.
RECOMMENDED STRATEGY
Phase 1: Phase 1 (0 to 9 months): Complete the installed base register and contact affected owners directly ahead of their conversion deadlines. Phase 2: Phase 2 (9 to 24 months): Run the conversion programme with contractor partners on agreed terms rather than through open channel promotion. Phase 3: Phase 3 (24 to 42 months): Fund battery storage development once conversion revenue is running and able to fund it.
OUTCOME
The board funded the register and the direct conversion programme, which the sales director resisted as channel conflict and later accepted. Conversion enquiries rose materially once owners were contacted directly ahead of deadlines, and the client reports retaining systems it had assumed were lost (client-reported, unverified by MMA). Battery storage development remains scheduled rather than started.

Frequently Asked Questions

Foundational context covering the market sizes, CAGR, scope, country, region and competition that inform every finding below. This section is provided to cover basics and most often pre-purchase conversations, answered from the MMA Primary Research Dataset.

What is the current size of the Automatic Fire Suppression System (AFSS) Market?

The global market is valued at USD 18.6 billion in 2025, covering sprinkler, mist, clean agent, inert gas, foam, and aerosol suppression systems with their detection and control. Portable extinguishers are excluded.

How large will the Automatic Fire Suppression System (AFSS) Market be by 2036?

The market is forecast to reach USD 38.37 billion by 2036 in the base case, about 1.93 times the 2026 level. That represents incremental value of roughly USD 18.50 billion.

What is the CAGR for the Automatic Fire Suppression System (AFSS) Market 2026 to 2036?

The market grows at a 6.8% CAGR in the base case, with bull and bear scenarios at 8.1% and 5.5%. The spread turns on battery storage standards and on commercial construction.

Which segment is growing fastest?

Clean agent gaseous systems grow fastest at 11.2%, about 1.65 times the overall rate, because agent phase-down forces replacement of working installations. Water mist systems follow at 9.4%.

Who are the major companies in the Automatic Fire Suppression System (AFSS) Market?

Leading participants include Johnson Controls, Carrier, Honeywell, Siemens, and Minimax Viking. Concentration sits at roughly 39%, because installation and service are licensed local trades holding the customer relationship.

Which country is growing fastest?

India grows fastest at a 10.1% CAGR, driven by commercial and data centre construction alongside materially stronger fire code enforcement. China follows on continued building volume.

Report Segmentation Architecture

The full report scope spans multiple orthogonal segmentation dimensions, with cross-tabulated demand data provided for each dimension pair. Coverage extends further to regional breakdowns, trend trajectories, and the competitive detail needed to support segment-level decision-making.

By Suppression Agent and Delivery

  • Clean Agent Gaseous Systems
  • Water Mist Systems
  • Inert Gas Systems
  • Water Sprinkler Systems
  • Foam and Wet Chemical Systems

By End-Use Industry

  • Data Centres and Telecom Facilities
  • Commercial and Institutional Buildings
  • Industrial and Manufacturing Plant
  • Warehousing and Logistics
  • Marine Transport and Energy Assets

By Sales Model

  • Contractor Installed Project Supply
  • Direct Owner and Facility Contract
  • Service and Inspection Agreement
  • Distributor and Reseller Channel

By Region

  • North America
  • East Asia
  • Western Europe
  • South Asia and Pacific
  • Latin America
  • Middle East and Africa
  • Eastern Europe

Scope, Methodology, and Coverage

Every figure in this report is reproducible from documented input assumptions. The scope below maps the historical period, the forecast horizon, the segmentation dimensions, and the countries covered, alongside the underlying primary and qualitative methodology.
Historical Period
2020 to 2025
Forecast Period
2026 to 2036
Base Year
2025 (USD billions; MMA Primary Research Dataset, August 2026)
Market Definition
The automatic fire suppression system market comprises the supply of fixed systems that detect and suppress fire without human intervention, valued at manufacturer and system supplier selling prices to installing contractors, building owners, engineering firms, and facility operators, and including the recurring inspection, testing, and maintenance agreements attached to installed systems. It spans wet and dry water sprinkler systems, low and high pressure water mist, clean agent gaseous systems using fluoroketone and synthetic chemistries, inert gas systems using nitrogen, argon, and carbon dioxide blends, low and high expansion foam systems, wet chemical kitchen suppression, and dry and condensed aerosol suppression, together with the detection devices, control panels, agent storage cylinders, valves, piping, nozzles, and discharge hardware supplied as part of one engineered system. Portable and wheeled fire extinguishers, fire alarm and detection systems sold without any suppression function, passive fire protection including fire doors, dampers, and intumescent coatings, firefighting vehicles and municipal apparatus, personal protective equipment, and standalone smoke control and ventilation systems are excluded. Fire risk assessment and consultancy sold independently sit outside scope.
Quantitative Units
USD billions (current prices); volume in thousands of systems installed
Segmentation Dimensions
By Suppression Agent and Delivery; By End-Use Industry; By Sales Model; By Region
Regions Covered
North America, East Asia, Western Europe, South Asia and Pacific, Latin America, Middle East and Africa, Eastern Europe
Countries Covered
USA, Canada, Mexico, China, Japan, South Korea, Taiwan, Germany, UK, France, Italy, Spain, Netherlands, Sweden, Norway, Denmark, Switzerland, India, Australia, Singapore, Malaysia, Thailand, Indonesia, Vietnam, Brazil, Mexico, Chile, Colombia, Argentina, Saudi Arabia, United Arab Emirates, Qatar, Egypt, South Africa, Turkey, Poland, Czechia, Romania, Hungary, and additional markets relevant to this sector
Key Companies Profiled
Johnson Controls, Carrier, Honeywell, Siemens, Minimax Viking, Halma, Hochiki, Bosch, Gielle, Fike, Amerex, Firetrace International, Rotarex Firetec, Reliable Sprinkler, Victaulic, NAFFCO, Nittan, Securiton, WAGNER Group, HD Fire Protect
Quantitative Methodology
Primary survey, n=3,800 respondents, Q4 2025, six countries; demand-side model with trade association cross-validation
Qualitative Methodology
47 expert interviews, Q4 2025; applied to validate demand model assumptions, identify emerging dynamics, and assess competitive positioning
Report Format
PDF and XLSX data workbook (Word format preview document)
Publisher
Market Minds Advisory
Report Code
MMA-2026-CON-519
Published
August 2026
Contact
sales@marketmindsadvisory.com | www.marketmindsadvisory.com

Purchase the full Automatic Fire Suppression System (AFSS) Market Report (2026 to 2036).

The full MMA Automatic Fire Suppression System report sizes the market across five agent and delivery classes, five end-use segments, four sales models, and seven regions through 2036. It profiles 20 participants on a consistent basis of fixed suppression system and service revenue, scoring each on agent portfolio breadth, approval listing coverage, owned service capacity, and battery hazard capability. Scenario models quantify how agent phase-down schedules, battery storage standards, and construction cycles move both volume and achievable margin. The report also includes phase-down exposure sizing by agent and region, approval listing coverage benchmarking, service contract capture rates by supplier, and battery storage protection practice assessment.
Five-agent and four-channel market sizing to 2036
Twenty-participant benchmark on system and service revenue
Phase-down exposure sizing by agent, region, and deadline
Approval listing coverage benchmarking across hazards and jurisdictions
Service contract capture rate benchmarking by supplier
Battery storage protection practice assessment across installations

Built For The People Who Decide

From boardroom strategy to bench-side execution, this report is read cover-to-cover by leaders shaping the next decade of their industry, turning demand scenarios, market dynamics and valuation benchmarks into decisions.
CXOs/ Presidents/ VPs/ Managers
M&A and Corporate Development
Strategy Teams and R&D Heads
Procurement and Product Directors
Regulatory and Compliance Leaders
Investor Relations and Equity Analysts