Market Minds Advisory
Automatic Distillation Analyzer Market

Automatic Distillation Analyzer Market: The Method Decides The Market

The instrument is a commodity and the method is not: a distillation analyzer is worth exactly what its correlation to the reference apparatus is worth, and a standards committee decides that.

Lead Analyst

Published

September 2026

Make Smarter Decisions with Customized Research Insights

Request a free sample report and evaluate market opportunities, growth trends, and competitive dynamics relevant to your business needs.

2025 MARKET VALUE$0.3BMarket Size 2025
2036 FORECAST VALUE$0.5BBase Case , 2026 to 2036
CAGR 2026 TO 20365.6 %Bull 6.8% / Bear 4.4%
INCREMENTAL OPPORTUNITY$0.2BNet 10- year value creation
EXPANSION MULTIPLE1.74x2036 value over 2026 base
Strategic Levers
M&A Pipeline
Regional Outlook
Country Rankings
Competitive Intelligence
Segmental Deep-dive
Call-Us : 91 93563 13602

Executive Snapshot and Market Trajectory

Nobody buys a distillation analyzer to measure distillation. They buy it to remove an operator from a refinery laboratory that has been shedding headcount for 15 years, and the accuracy argument is what justifies a purchase already decided on staffing grounds. Vendors rarely say this part aloud.
East Asia holds 33% of value because Chinese and Indian refining capacity additions account for most new laboratories built anywhere. Micro-method analyzers grow at 8.4%, half again the market rate of 5.6%, using 6 millilitres instead of 100 and finishing in minutes rather than an hour. Whether their correlated result is accepted on a certificate of analysis is the question that decides the segment.
Concentration is unusually high at 62% for five suppliers, because correlation data takes years to build and a refinery will not accept an unproven instrument on a product release test. Biofuel blending mandates broke the assumptions the classic method was written under, since ethanol and fatty acid methyl ester blends distil in ways the original apparatus never anticipated. Method revision followed, and with it a replacement cycle nobody had budgeted for. Vendors did not complain.
Market Definition
The market covers laboratory and process instruments that automate the determination of distillation characteristics of petroleum products and organic liquids under recognised test methods, including atmospheric, vacuum, micro-method, multi-method and online configurations. Manual glassware distillation apparatus, gas chromatographic simulated distillation systems, flash point testers and viscometers are excluded. Consumables, calibration services and laboratory information systems fall outside scope.
Base Year Value
$0.3B in 2025 (MMA Primary Research Dataset, August 2026)
Forecast Period
2026 to 2036, eleven discrete annual values
CAGR
5.6% base case. Bull 6.8%. Bear 4.4%.
Fastest Growth Segment
Micro-Method Distillation Analyzers: 8.4% CAGR
Fastest Growth Country
India: 8.8% CAGR
Fastest Growth Region
South Asia and Pacific: 7.8% CAGR
Largest Region
East Asia: 33% of 2025 global value
Market Leaders
Anton Paar, PAC, Koehler Instrument Company, Normalab, Tanaka Scientific. Source: MMA Analysis based on installed instrument base, company disclosures 2025.
Primary Survey
n=3,800 procurement and R&D decision-makers, Q4 2025, six countries
Methodology
Demand-side build-up, cross-validated against public data, 47 expert interviews

Automatic Distillation Analyzer Market Forecast Scenarios

automatic-distillation-analyzer-market-size-forecast-scenario-1787676799314
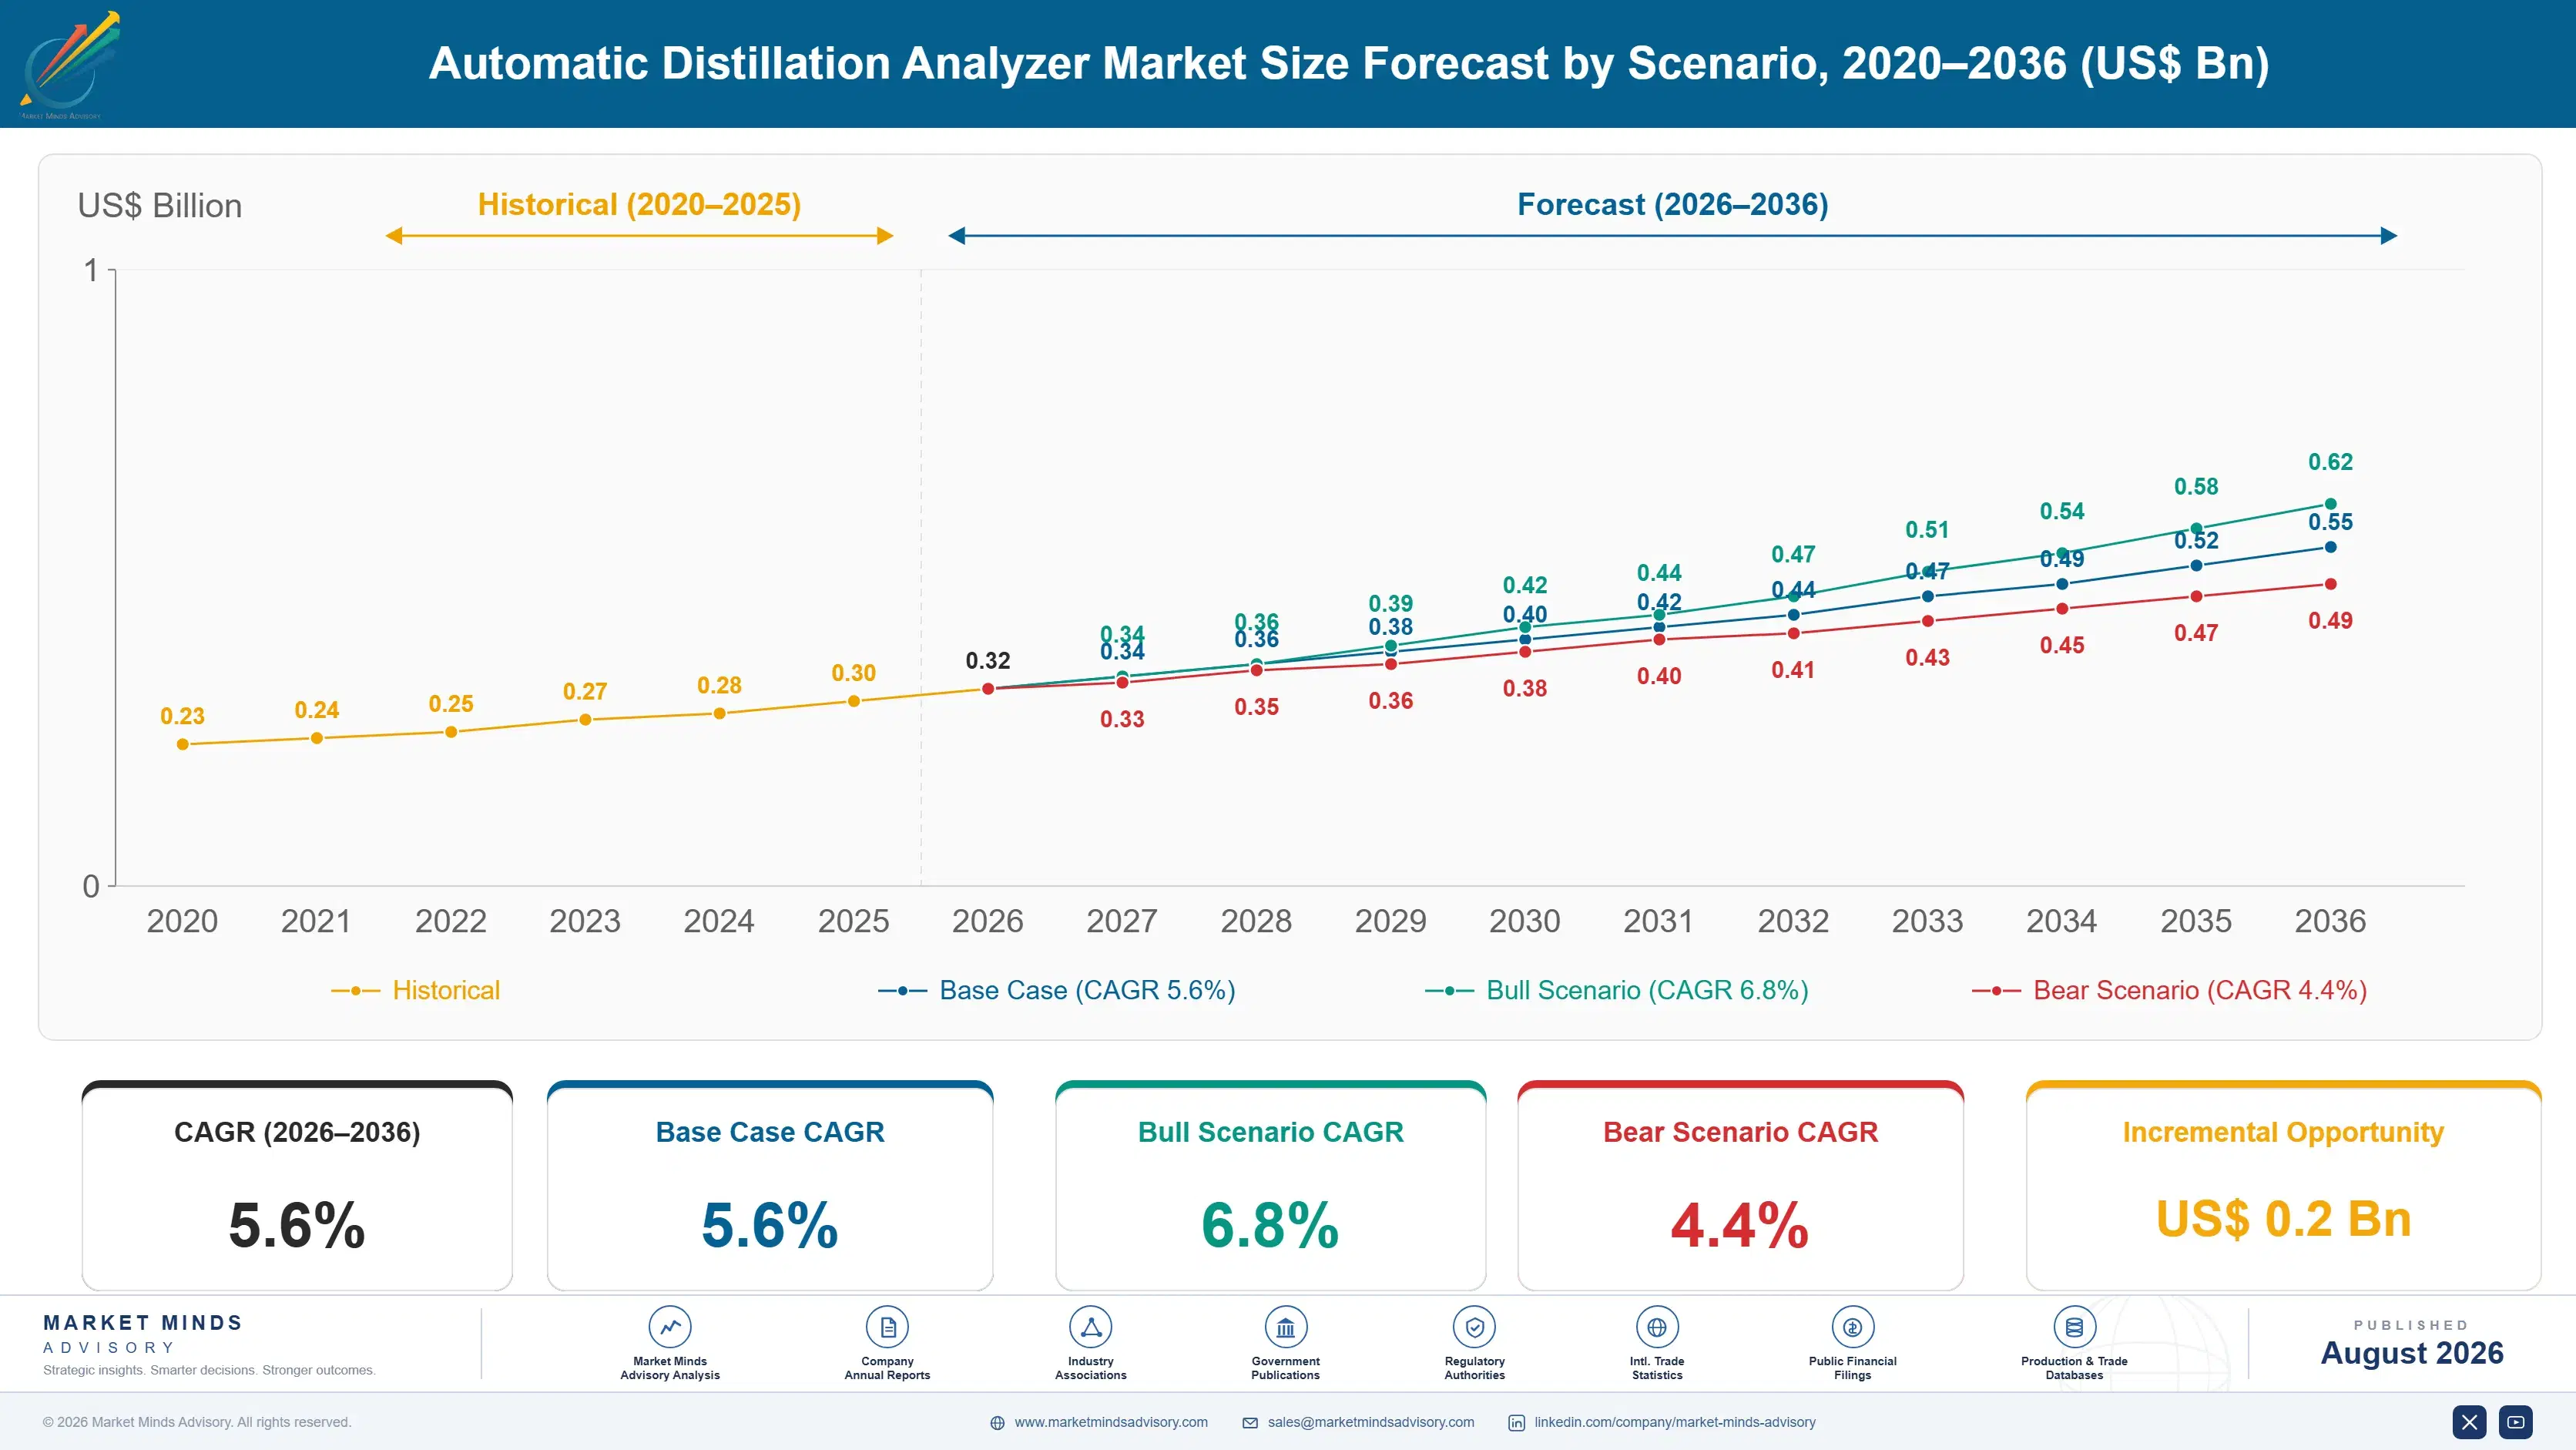
The 2020 to 2025 period compounded at 4.4% and the drivers were unusual for an instrument market. Refinery capital spending fell through 2020 and recovered unevenly, but laboratory automation purchases held up because they were justified on headcount rather than on throughput. Method revisions covering biofuel blends then forced replacements at sites that had no plan to buy anything.
The 5.6% base case rests on three mechanisms. Refining capacity keeps shifting toward Asia and the Middle East, and every new complex builds a laboratory that buys a full method suite at once. Fuel quality regulation continues tightening in markets that previously had none, which converts distillation testing from optional to statutory. And renewable and sustainable aviation fuel blending creates specification work that did not exist five years ago, at sites that are not refineries and have never owned an analyzer.
The bull case at 6.8% turns on micro-method results gaining acceptance for certificate of analysis use, which would open replacement demand across an entire installed base. The bear case at 4.4% is Western refinery closures accelerating faster than Asian additions arrive, since each closure removes a laboratory permanently rather than relocating it. Both are running now.

The Method Decides What The Instrument Is Worth

A distillation test is defined by its apparatus. The classic method specifies flask dimensions, heating rate and condenser geometry, which means an automated instrument is not measuring the same thing so much as producing a number that correlates with what the reference apparatus would have produced. That distinction sounds academic until a cargo is rejected on a specification, at which point it becomes the only thing anyone cares about.
FIVE-FIRM CONCENTRATION62%Share of installed analyzer base held by leading suppliers
AVERAGE INSTRUMENT PRICE$48,000Typical purchase cost for an automated atmospheric analyzer
TOP PRODUCING COUNTRYGermany 29%German share of global analyzer manufacturing output by value
INSTRUMENT REPLACEMENT CYCLE12 yearsMedian service life before a laboratory replaces an analyzer
SERVICE REVENUE SHARE34%Portion of supplier revenue from calibration and maintenance contracts
SAMPLE VOLUME REDUCTION94%Cut in test sample required by micro-method instruments
Concentration at 62% is high for an instrument market and entirely explained by that fact. Building correlation data across product types takes years of round-robin testing and standards committee participation, and a refinery quality manager has no reason to gamble a release test on a supplier without it. New entrants can build a better instrument and still not sell one.
Biofuel blending is what disturbed a very settled market. Ethanol and fatty acid methyl ester blends behave differently under heat than the hydrocarbons the method assumed, producing azeotropic effects and end-point behaviour the original apparatus was never designed to handle. Standards committees revised the methods. Laboratories that had run the same instrument for a decade discovered it no longer covered what they were testing.
"Refiners will pay for an instrument that agrees with the glassware. They will not pay for one that is more accurate than the glassware, which is a strange thing to explain to an engineer."
Director, Analytical Instrumentation Practice · MMA Industrial Equipment Practice · August 2026

Market Trends

Micro-Method Analyzers Challenge The Reference Apparatus

A micro-method instrument runs a distillation on 6 millilitres instead of 100 and finishes in around 10 minutes rather than an hour, using optical detection rather than a condenser and receiving cylinder. Throughput improves dramatically and sample handling gets safer. The obstacle is acceptance: a correlated result satisfies process control everywhere and satisfies certificate of analysis requirements only where a customer or regulator has agreed to it. Suppliers are working that acceptance through standards committees rather than through sales calls, which is slower and the only route that works. Committee work is the actual sales channel.
Market Impact: Removes 1.4 laboratory shifts weekly
Sustainable Fuel Blending Creates Laboratories Outside Refineries

Sustainable aviation fuel and renewable diesel get blended at terminals, airports and dedicated plants that historically had no analytical capability at all. Those sites need specification testing because the blend leaving them carries a certificate, and the blend arriving was tested by somebody else. That produces demand for instruments in places where no distillation analyzer has ever been installed, from buyers with no relationship to any supplier and no institutional preference. Suppliers whose channel runs through refinery procurement are missing these accounts entirely, and terminal operators buy differently. That difference is worth studying.
Market Impact: Specifies 8 instruments per complex

Market Opportunities and Growth Drivers

Refinery Laboratory Headcount Falls Every Budget Cycle

Refinery laboratories have been shrinking for years through retirement, hiring freezes and the general difficulty of attracting analytical chemists to industrial sites. Automation is bought to cover that gap rather than to improve data quality, and the business case a plant manager signs is a headcount case with an accuracy paragraph attached. This matters commercially because it changes who decides: the purchase is approved by operations rather than by the laboratory, and operations values unattended running time far above analytical elegance. Suppliers selling on precision to an audience buying on staffing consistently lose.
Market Impact: Blocks entry for 4 years

Asian Refining Capacity Additions Build Complete Laboratories

New refining complexes in China, India and the Middle East arrive with laboratories specified as part of the engineering package, which means a full method suite gets bought at once rather than instrument by instrument. The engineering contractor makes the selection, not the eventual operator, and contractor preference follows previous projects far more than technical evaluation. Getting specified on one large project therefore carries into the next several. Suppliers with engineering contractor relationships in Seoul, Milan and Chennai win work that never reaches a competitive tender at all. That channel is worth more than any product.
Market Impact: Removes 34 laboratories since 2020

Market Restraints and Challenges

Correlation Data Requirements Block Every New Entrant

An instrument without published correlation to the reference method cannot be used for a product release test, and generating that data means round-robin studies across product types with participating laboratories. Root cause is liability: a refiner rejecting a cargo needs a defensible number, and a defensible number means an accepted method. The commercial effect is a barrier that has nothing to do with engineering quality, so a superior instrument from a new supplier sells to process control and never reaches the quality laboratory. Entrants mitigate by partnering with established suppliers, which usually ends in acquisition.
Market Impact: Cuts sample volume by 94%

Western Refinery Closures Remove Laboratories Permanently

Every European or North American refinery that closes takes a fully equipped laboratory with it, and the instruments do not relocate because the replacement capacity is in a different hemisphere with different suppliers already specified. Root cause is how closures happen rather than instrument economics: sites shut on refining margin, and nobody is buying second-hand analyzers when a new complex has a capital budget. The commercial impact falls on service revenue as much as on new sales, since each closure ends a maintenance contract. Suppliers mitigate by following the capacity rather than the customer.
Market Impact: Adds 1,900 new testing sites
3 additional market trends, 4 additional growth drivers, and 2 additional restraints and challenges are covered in the full report. Contact sales@marketmindsadvisory.com to access the complete intelligence.

Segment CAGR and Growth Architecture

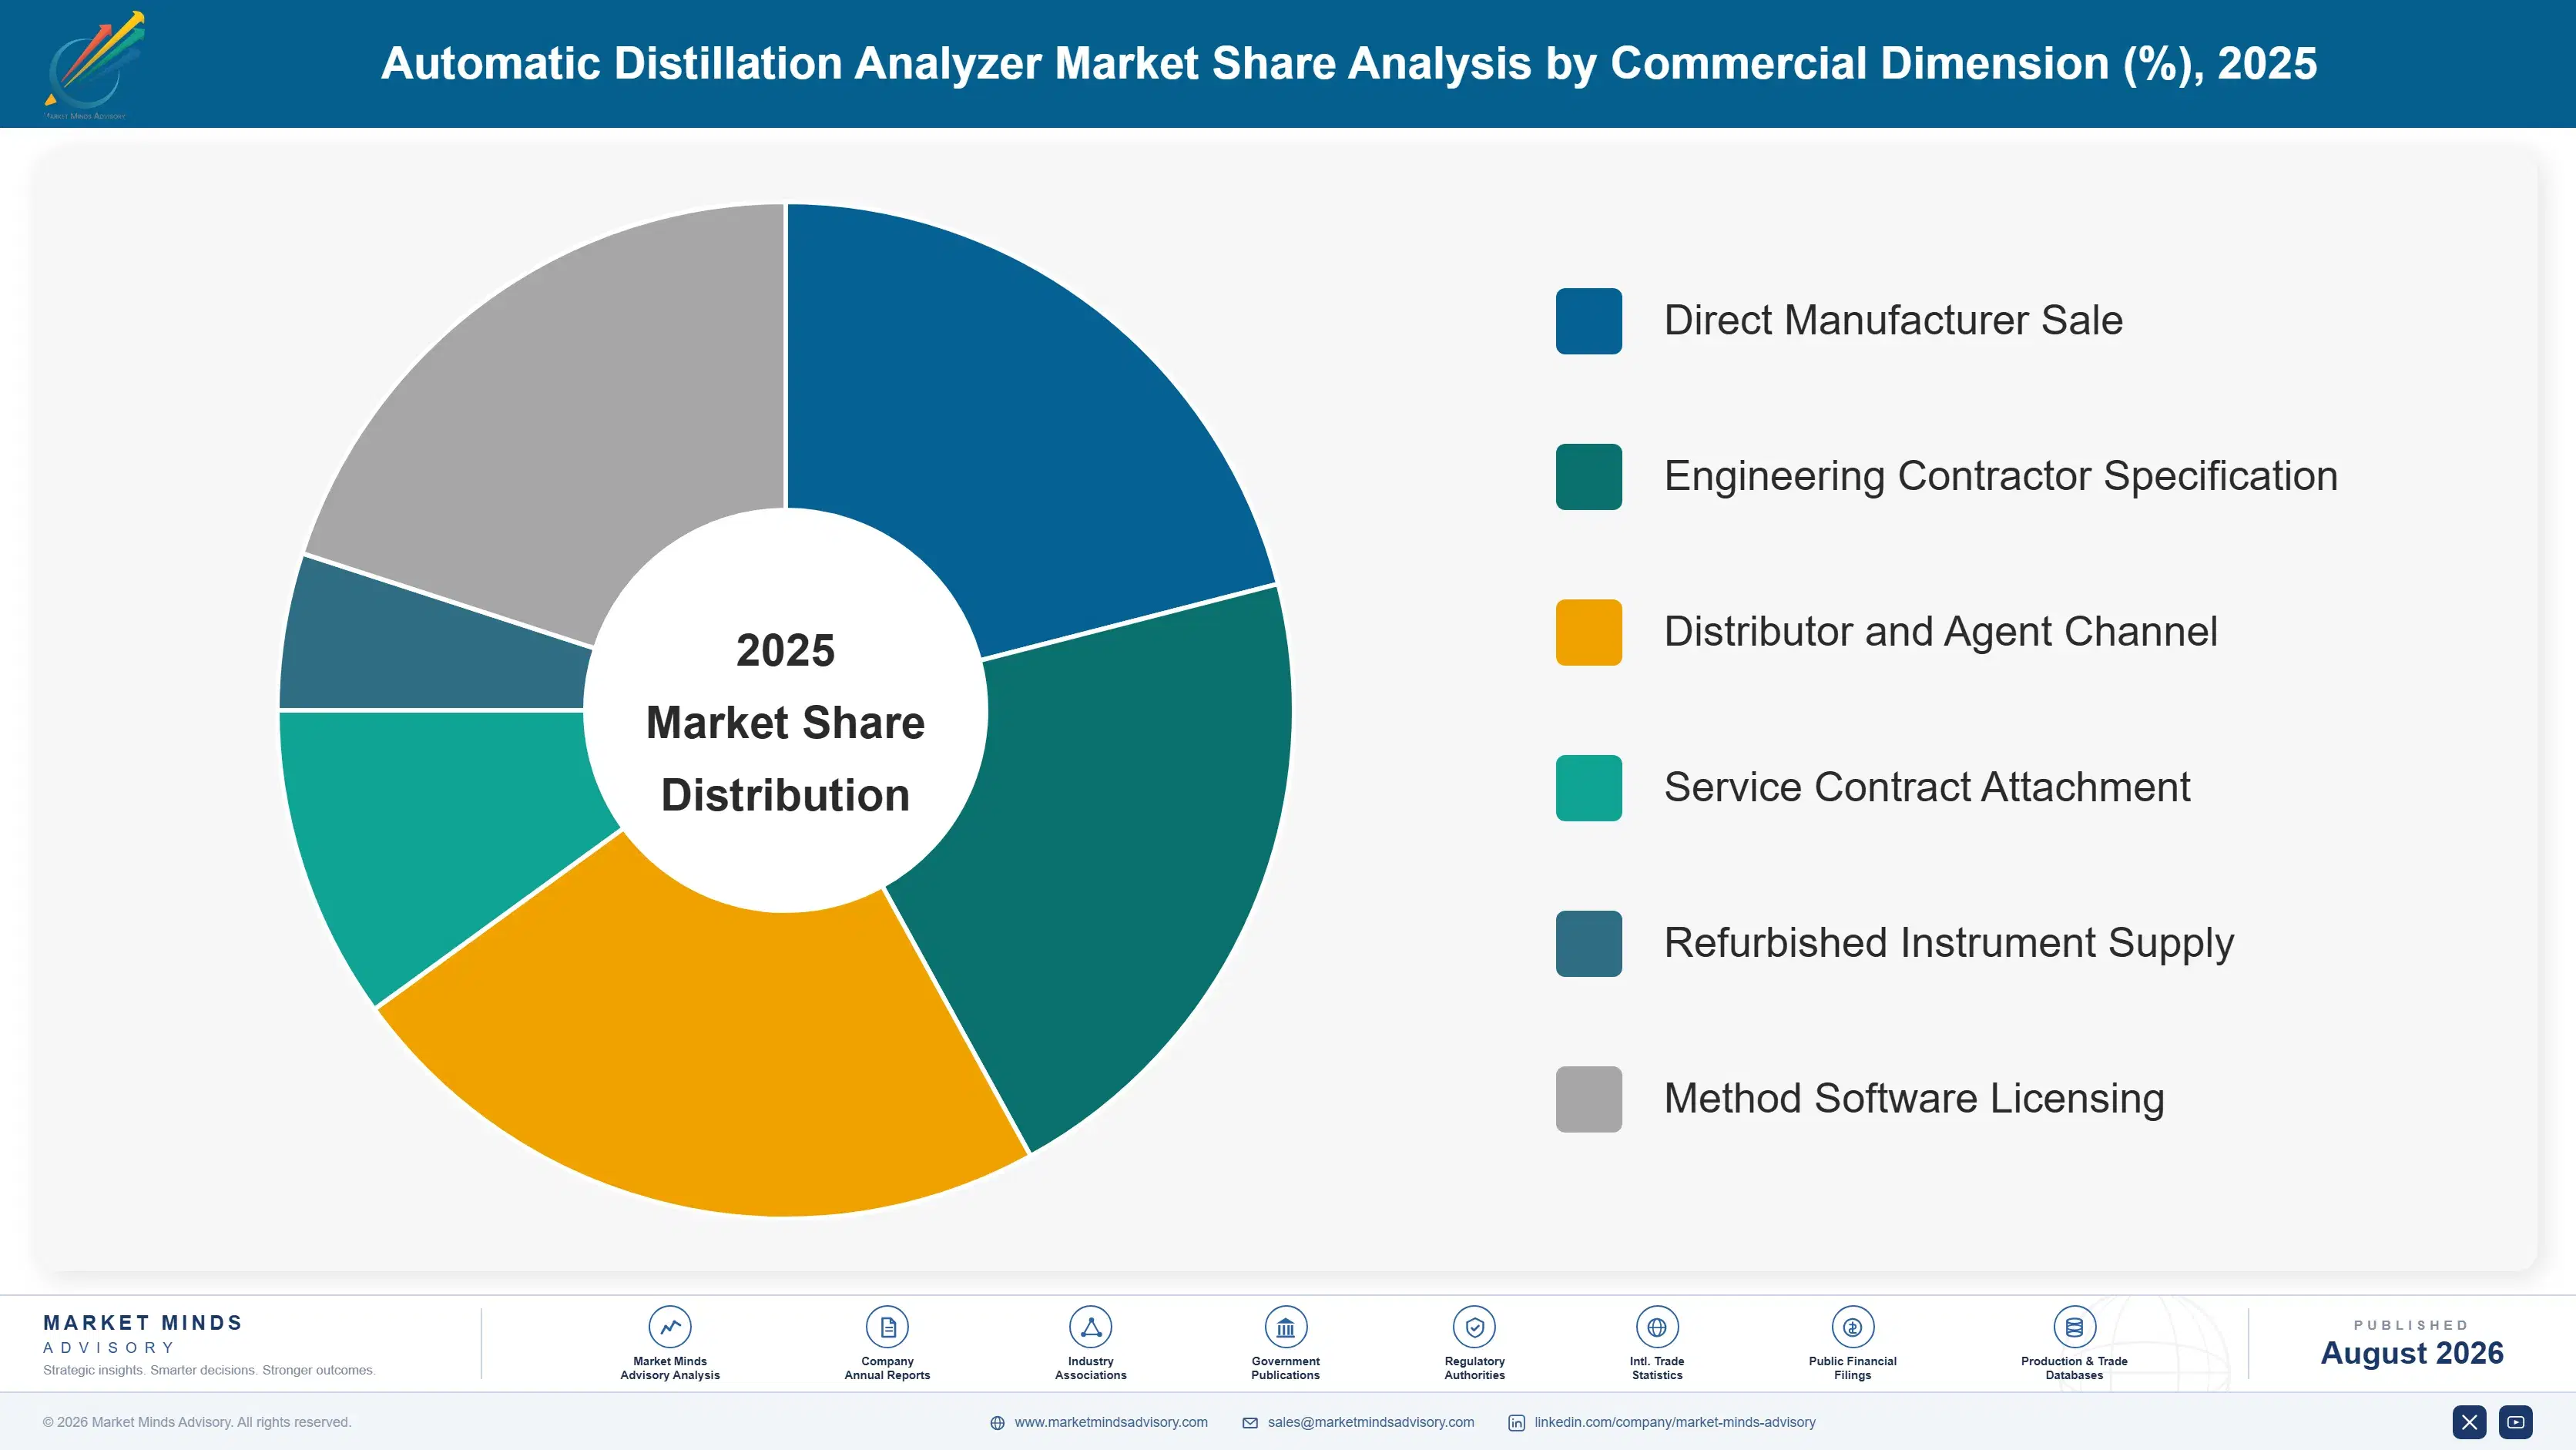
Segmentation follows analyzer configuration: how the instrument performs the determination and under which method family, rather than which product it tests or who operates it. Six configurations cover the market without overlap, from atmospheric units through to online process analyzers. End-use industry and purchase channel are treated separately, because both cut across every configuration. The split holds cleanly.
automatic-distillation-analyzer-market-market-share-analysis-1787676799893

Micro-Method Distillation Analyzers

Growth at 8.4%, half again the market rate of 5.6%, comes from throughput and safety rather than from accuracy. A 6 millilitre sample instead of 100 means less flammable liquid on a bench, less waste to dispose of and a determination finished in around 10 minutes. Process control laboratories adopted these first and enthusiastically, because nobody there needs a certificate. The quality laboratory is the contested ground, and acceptance there depends on standards committee decisions rather than on instrument performance. Suppliers are investing in correlation studies accordingly, and the segment's eventual size is being decided in committee rooms rather than in the market. That is an unusual place for a market to be settled.
CAGR 8.4%

Automated Multi-Method Combination Analyzers

A single platform running atmospheric and vacuum determinations, and sometimes flash point alongside, appeals to laboratories short of both bench space and staff. Growth at 7.2% tracks new refinery construction closely, because engineering contractors specify combination units to reduce the equipment count in a package they have to install and commission. Existing laboratories replace piecemeal and rarely consolidate, since the instruments they own were bought in different years and fail in different years. The commercial attraction for suppliers is obvious: one sale instead of two, at a higher price and with a single service contract covering both. The engineering compromise is that a shared heating and detection system serves neither method optimally.
CAGR 7.2%
Full segment breakdown across 6 segments available in the complete report.

Regional Architecture and Country Demand Map

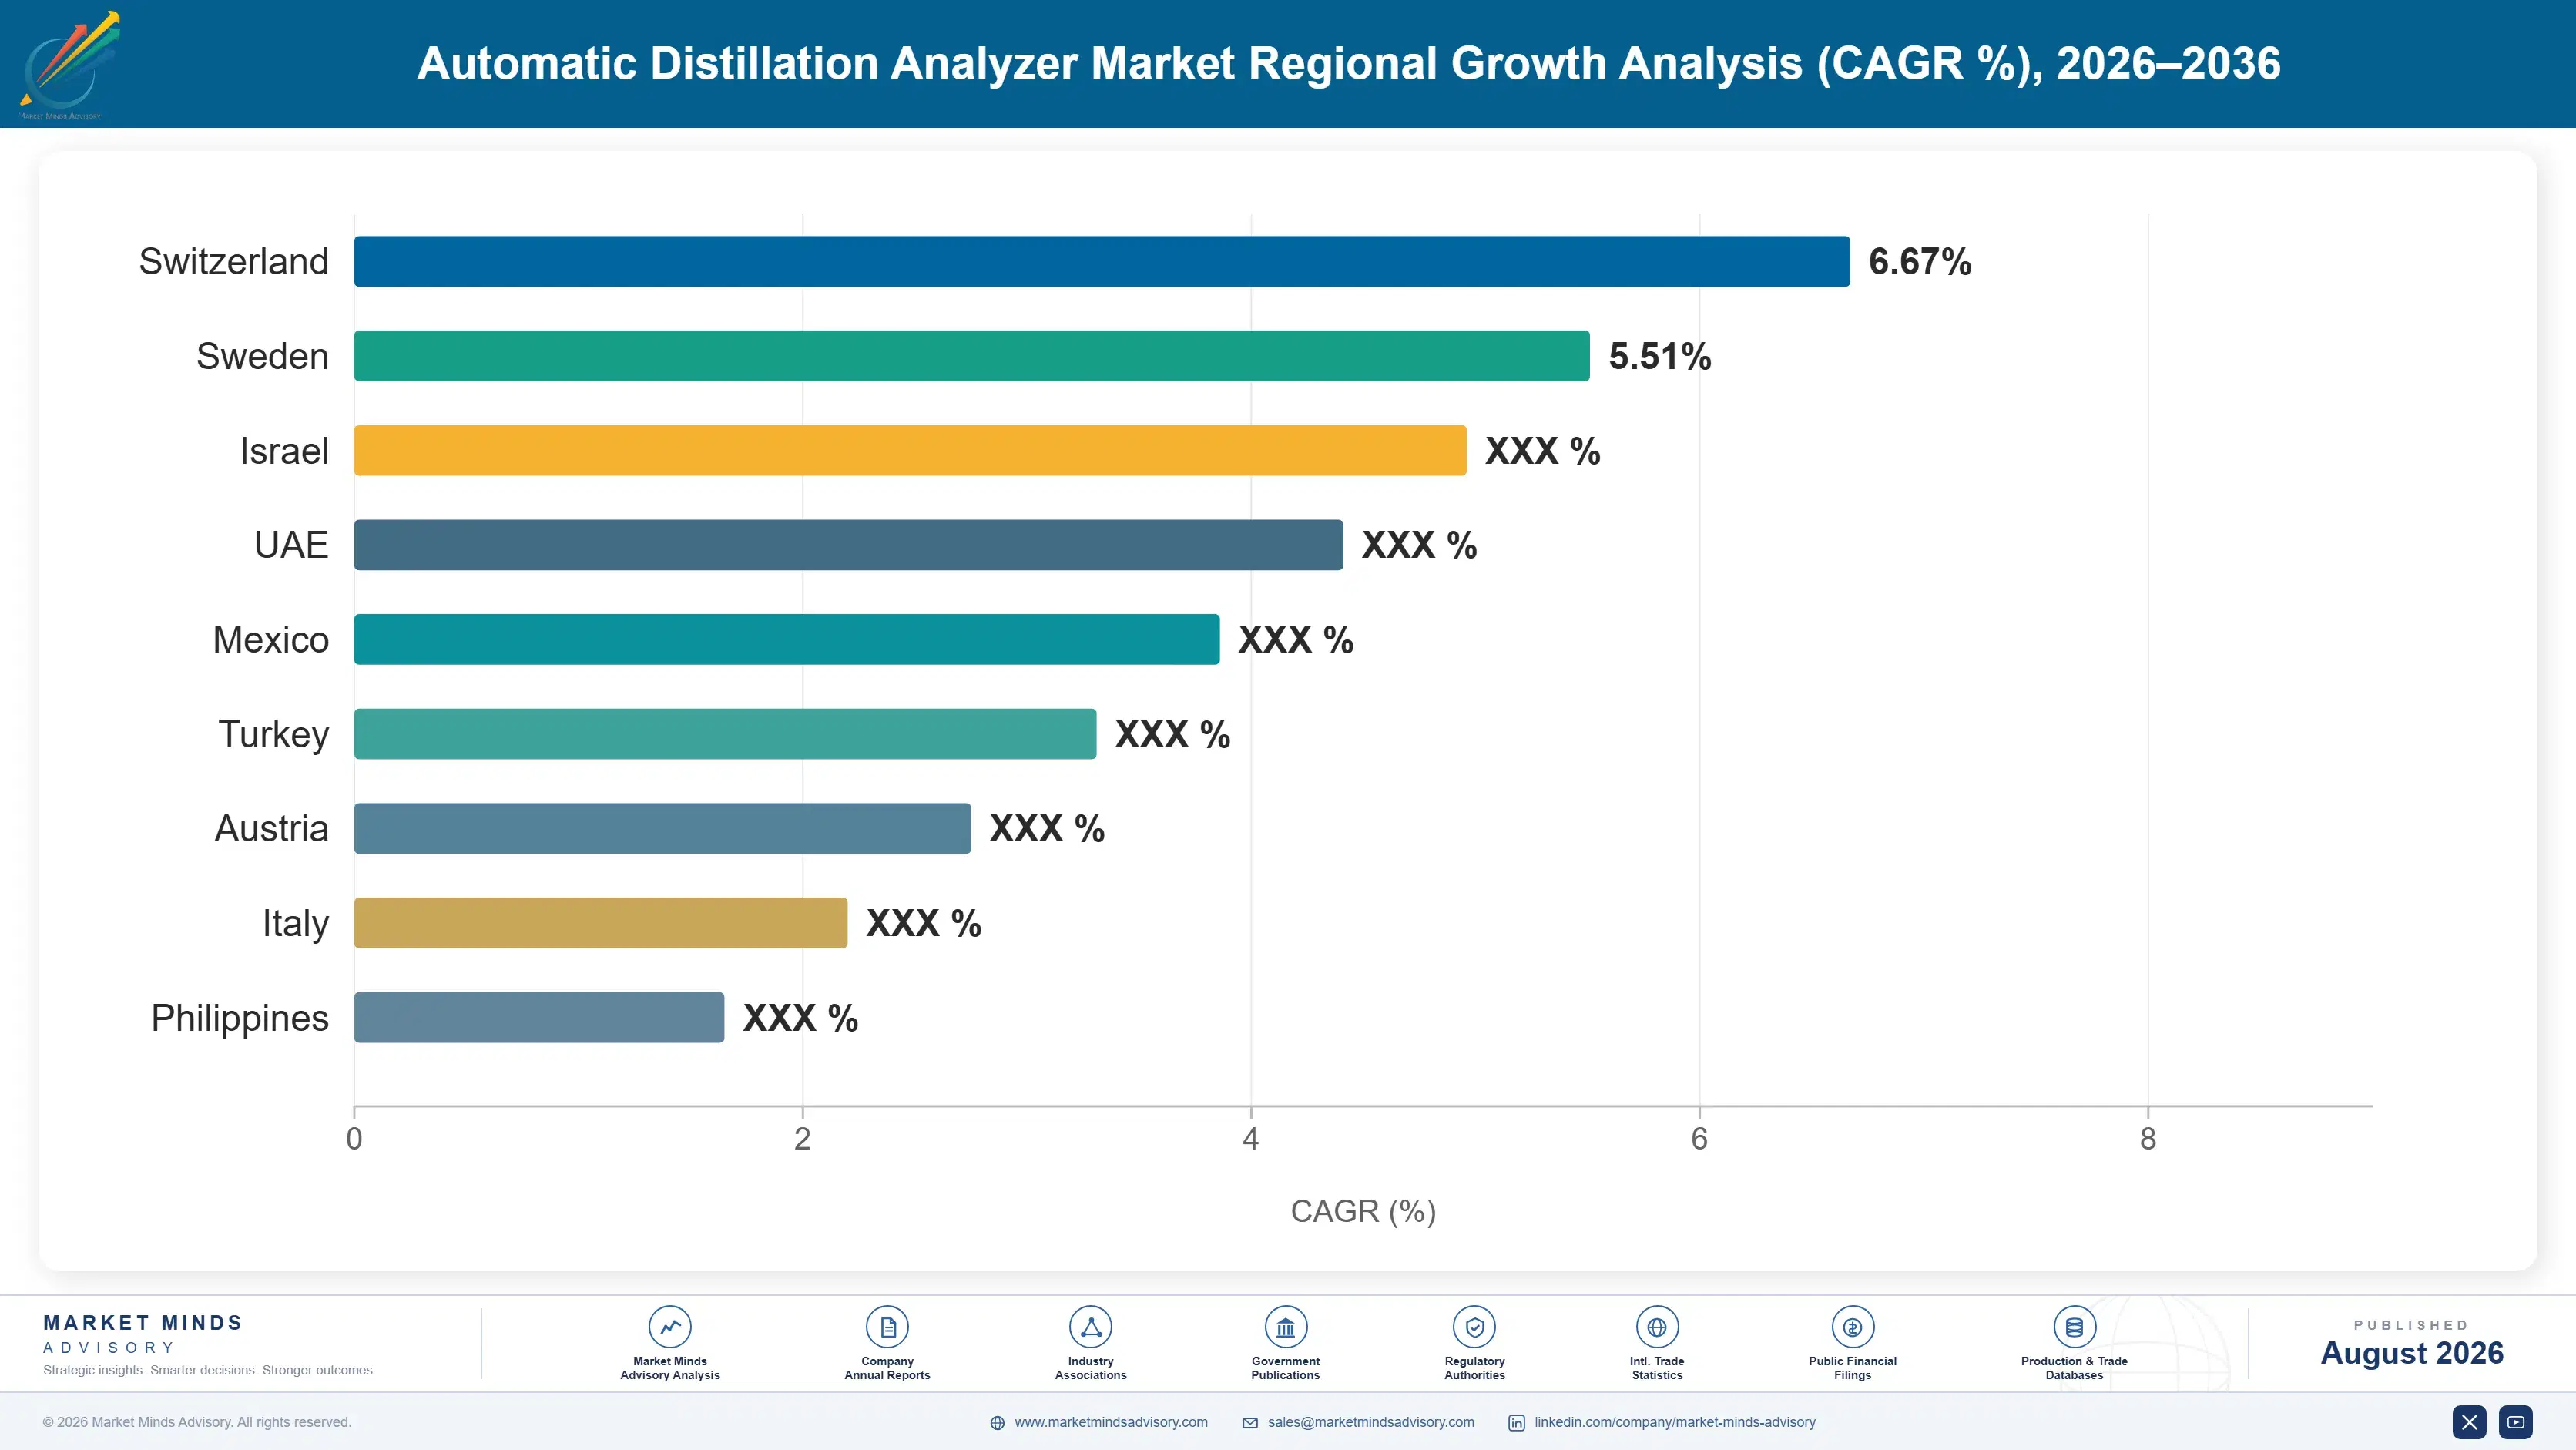
Geography follows refining capacity and, increasingly, fuel blending infrastructure that sits outside refineries entirely. East Asia leads on new complex construction in China and India. Western Europe and North America decline as sites close, while the Middle East grows on export refinery investment. Capacity moves and laboratories follow.

North America

American refining is consolidating rather than growing, and each closure removes a laboratory that never gets rebuilt. What holds regional demand up is replacement of an installed base that dates largely from the 1990s and 2000s, plus renewable diesel conversions that need new method coverage at sites that were refineries and now are not quite. Canadian demand centres on Alberta upgrading operations with unusual product slates. Mexican refining investment has been substantial and state-directed, with procurement running through engineering contractors rather than plant laboratories. Fuel terminal blending capacity across the region is the quiet growth area nobody has a channel into. Whoever builds that channel first will own it. Nobody has tried yet.
Share: 22% | CAGR: 4.6% (2026 to 2036)

Western Europe

European refining has been closing for two decades and the pace has not slowed, which makes this the only region where the installed base is shrinking outright. What offsets it partly is regulation: European fuel quality directives and biofuel blending mandates are the strictest anywhere, and they force method coverage that laboratories cannot avoid buying. German manufacturing supplies a large share of world instrument production regardless of where demand sits. Dutch and Belgian terminal operations around Rotterdam and Antwerp buy heavily, since blending and storage there dwarf domestic refining. French and Italian laboratories replace slowly and specify conservatively. The region now exports far more instruments than it installs anywhere. That reversal happened quietly.
Share: 18% | CAGR: 3.8% (2026 to 2036)
Regional intelligence for 5 additional markets available in the complete report: East Asia, South Asia and Pacific, Latin America, Middle East and Africa, Eastern Europe. Contact sales@marketmindsadvisory.com.
automatic-distillation-analyzer-market-country-cagr-analysis-1787676800484

Selling The Method, Not The Box

The instrument itself is comparable and increasingly commoditised, which is why margin sits everywhere except the hardware. Four levers move revenue toward correlation credibility, service annuities and channel position, and each requires investment in something that never appears on a product specification sheet. Committee work is the least glamorous of them. It is also the most valuable.

Fund Standards Committee Participation As Sales Investment

A method revision decides what an instrument may be used for, and revisions are written by committees whose members are largely supplier employees. Participation costs travel, technical staff time and roughly 3 years before any commercial effect appears. What it buys is a product designed against a method the supplier helped shape, and awareness of changes competitors learn about on publication. Firms treating this as a technical courtesy rather than as commercial investment consistently arrive late to method transitions and spend the following two years catching up on correlation data.
Market Impact: Takes 3 years and shapes the whole method

Convert Calibration Into Contracted Annual Service Revenue

An analyzer needs calibration verification, consumable replacement and periodic requalification whether or not anyone sells a contract for it. Suppliers who left that work to the customer's own staff gave away revenue equal to roughly 34% of what the instrument itself earned across its life. Contracted service also produces something more valuable than the margin: an engineer inside the laboratory annually, who sees which instruments are failing and which budgets are forming. That visibility wins replacement sales before a tender is written, which is worth more than the service fee.
Market Impact: Adds service revenue worth 34% of instrument value

Get Specified By Engineering Contractors, Not Operators

New refinery laboratories are specified in the engineering package years before an operator hires a laboratory manager, and that specification typically covers 8 instruments bought at once. The contractor makes the choice, usually by repeating whatever worked on the previous project. Suppliers with relationships inside the engineering firms in Seoul, Milan and Chennai win work that never reaches competitive tender. Building those relationships means technical support to people who are not the end customer and will never operate the instrument, which most sales organisations find difficult to justify internally. The ones who justified it are winning.
Market Impact: Captures 8 instrument specifications at each new complex

Reach Terminal And Blending Operators Before Competitors Do

Sustainable aviation fuel and renewable diesel blending happens at roughly 1,900 sites that have never bought an analytical instrument and have no supplier preference of any kind. They are not refineries, they do not employ analytical chemists, and they buy through operations budgets rather than laboratory ones. Suppliers whose entire channel runs through refinery procurement cannot see these accounts. Reaching them means a different sales motion, simpler instruments and support that assumes the operator has no analytical background, which is a genuine product decision rather than a marketing one. Nobody has built that product properly yet.
Market Impact: Opens roughly 1,900 sites with no incumbent supplier

Who Controls the Margin Pool

Measured on installed instrument base, the five largest suppliers hold a CR5 of 62%, which is high even for a specialist instrument market. The reason is not scale but correlation history: a laboratory releasing product on a test result will not experiment. Anton Paar and PAC sit ahead of the challenger group through the breadth of methods they cover and the depth of published correlation behind each one.
Three contests define the market. Method coverage is the first, where suppliers compete to support every determination a laboratory needs so the customer buys one relationship rather than four. Engineering contractor position is the second and is largely invisible from outside, since it decides new complex specifications before any tender exists. Service network reach is the third, because a refinery in Nigeria or Kazakhstan will not buy an instrument nobody can service within a week. Product performance decides remarkably little.

Pressure is arriving from Chinese instrument manufacturers with credible hardware and no correlation history. They are winning process control and independent refiner business on price while premium certificate work stays with incumbents. Rankings shift whenever a Chinese standards body accepts correlation data that Western committees have not yet reviewed.
automatic-distillation-analyzer-market-company-positioning-matrix-1787676801029

Competitive Moat and Risk Dimensions

ANTON PAAR

Moat: Method Breadth And Correlation

Anton Paar covers more petroleum test methods than any competitor and publishes correlation data behind each, which lets a laboratory consolidate onto one supplier for a whole method suite. That breadth took decades and continuous standards committee participation to assemble. A competitor with one excellent instrument still faces a customer who would rather buy everything from one place.
ANTON PAAR

Risk: Declining Western Installed Base

A large share of Anton Paar's installed base sits in European and North American laboratories that are closing rather than replacing. Each closure removes both a future instrument sale and an annual service contract, and the replacement capacity is in regions where engineering contractors decide. The company is following that capacity, and the transition costs more than the arithmetic suggests.
PAC

Moat: Refinery Process Integration Depth

PAC sells both laboratory and online process analyzers, which lets it place instruments in the control room as well as the quality laboratory and connect the two. Refiners running the same measurement in both places get consistency that separate suppliers cannot promise. That position is difficult to attack, because winning it requires credibility in process instrumentation and in laboratory correlation.
PAC

Risk: Portfolio Ownership Cycle Exposure

PAC sits inside a diversified industrial group where analytical instruments compete for capital against businesses with different growth profiles and shorter payback periods. Standards committee participation and correlation studies produce returns over years, which is a hard case to make in an annual capital review. Specialist competitors face no such internal argument and can fund the long work continuously.

Players Tracked

Prominent Players

Anton Paar
PAC
Koehler Instrument Company
Normalab
Tanaka Scientific

Other Key Players

AMETEK Grabner Instruments
Stanhope-Seta
Cannon Instrument Company
Ayalytical Instruments
Linetronic Technologies
Lauda Scientific
Bruker
Shimadzu
Metrohm
Yokogawa Electric
Emerson Electric
ABB
Modcon Systems
Bartec Group
Beijing Beifen-Ruili Analytical Instrument

Recent Developments

MARCH 2025

Anton Paar expands petroleum instrument service network across the Middle East

Anton Paar expanded its service and calibration network across Gulf markets, an organic investment rather than an acquisition. The company linked the decision to new export refinery capacity in Saudi Arabia, Oman and Kuwait, where instrument purchases increasingly depend on demonstrable local service response rather than on product specification alone.
Signal: Service network reach has become a purchase criterion in new refining regions, not an after-sales consideration.
JULY 2025

Standards committee publishes revised distillation method covering renewable blends

A revision to the atmospheric distillation method extended its scope to cover renewable diesel and higher biofuel blend levels, following round-robin studies across participating laboratories. This was a standards decision rather than a commercial event, and it obliges laboratories testing those products to demonstrate their instruments meet the revised requirements.
Signal: Method revisions create replacement demand nobody budgeted for, which is why suppliers fund committee participation so carefully.
OCTOBER 2025

PAC introduces combined atmospheric and vacuum distillation platform

PAC launched a combined platform performing atmospheric and vacuum distillation determinations on one instrument, developed organically rather than through acquisition. The company positioned it for new refinery laboratories where bench space and staffing are constrained, and where engineering contractors specify equipment counts before an operator is appointed.
Signal: Combination instruments are designed for the contractor specification stage rather than for the laboratory that eventually runs them.

What Builds A Distillation Analyzer

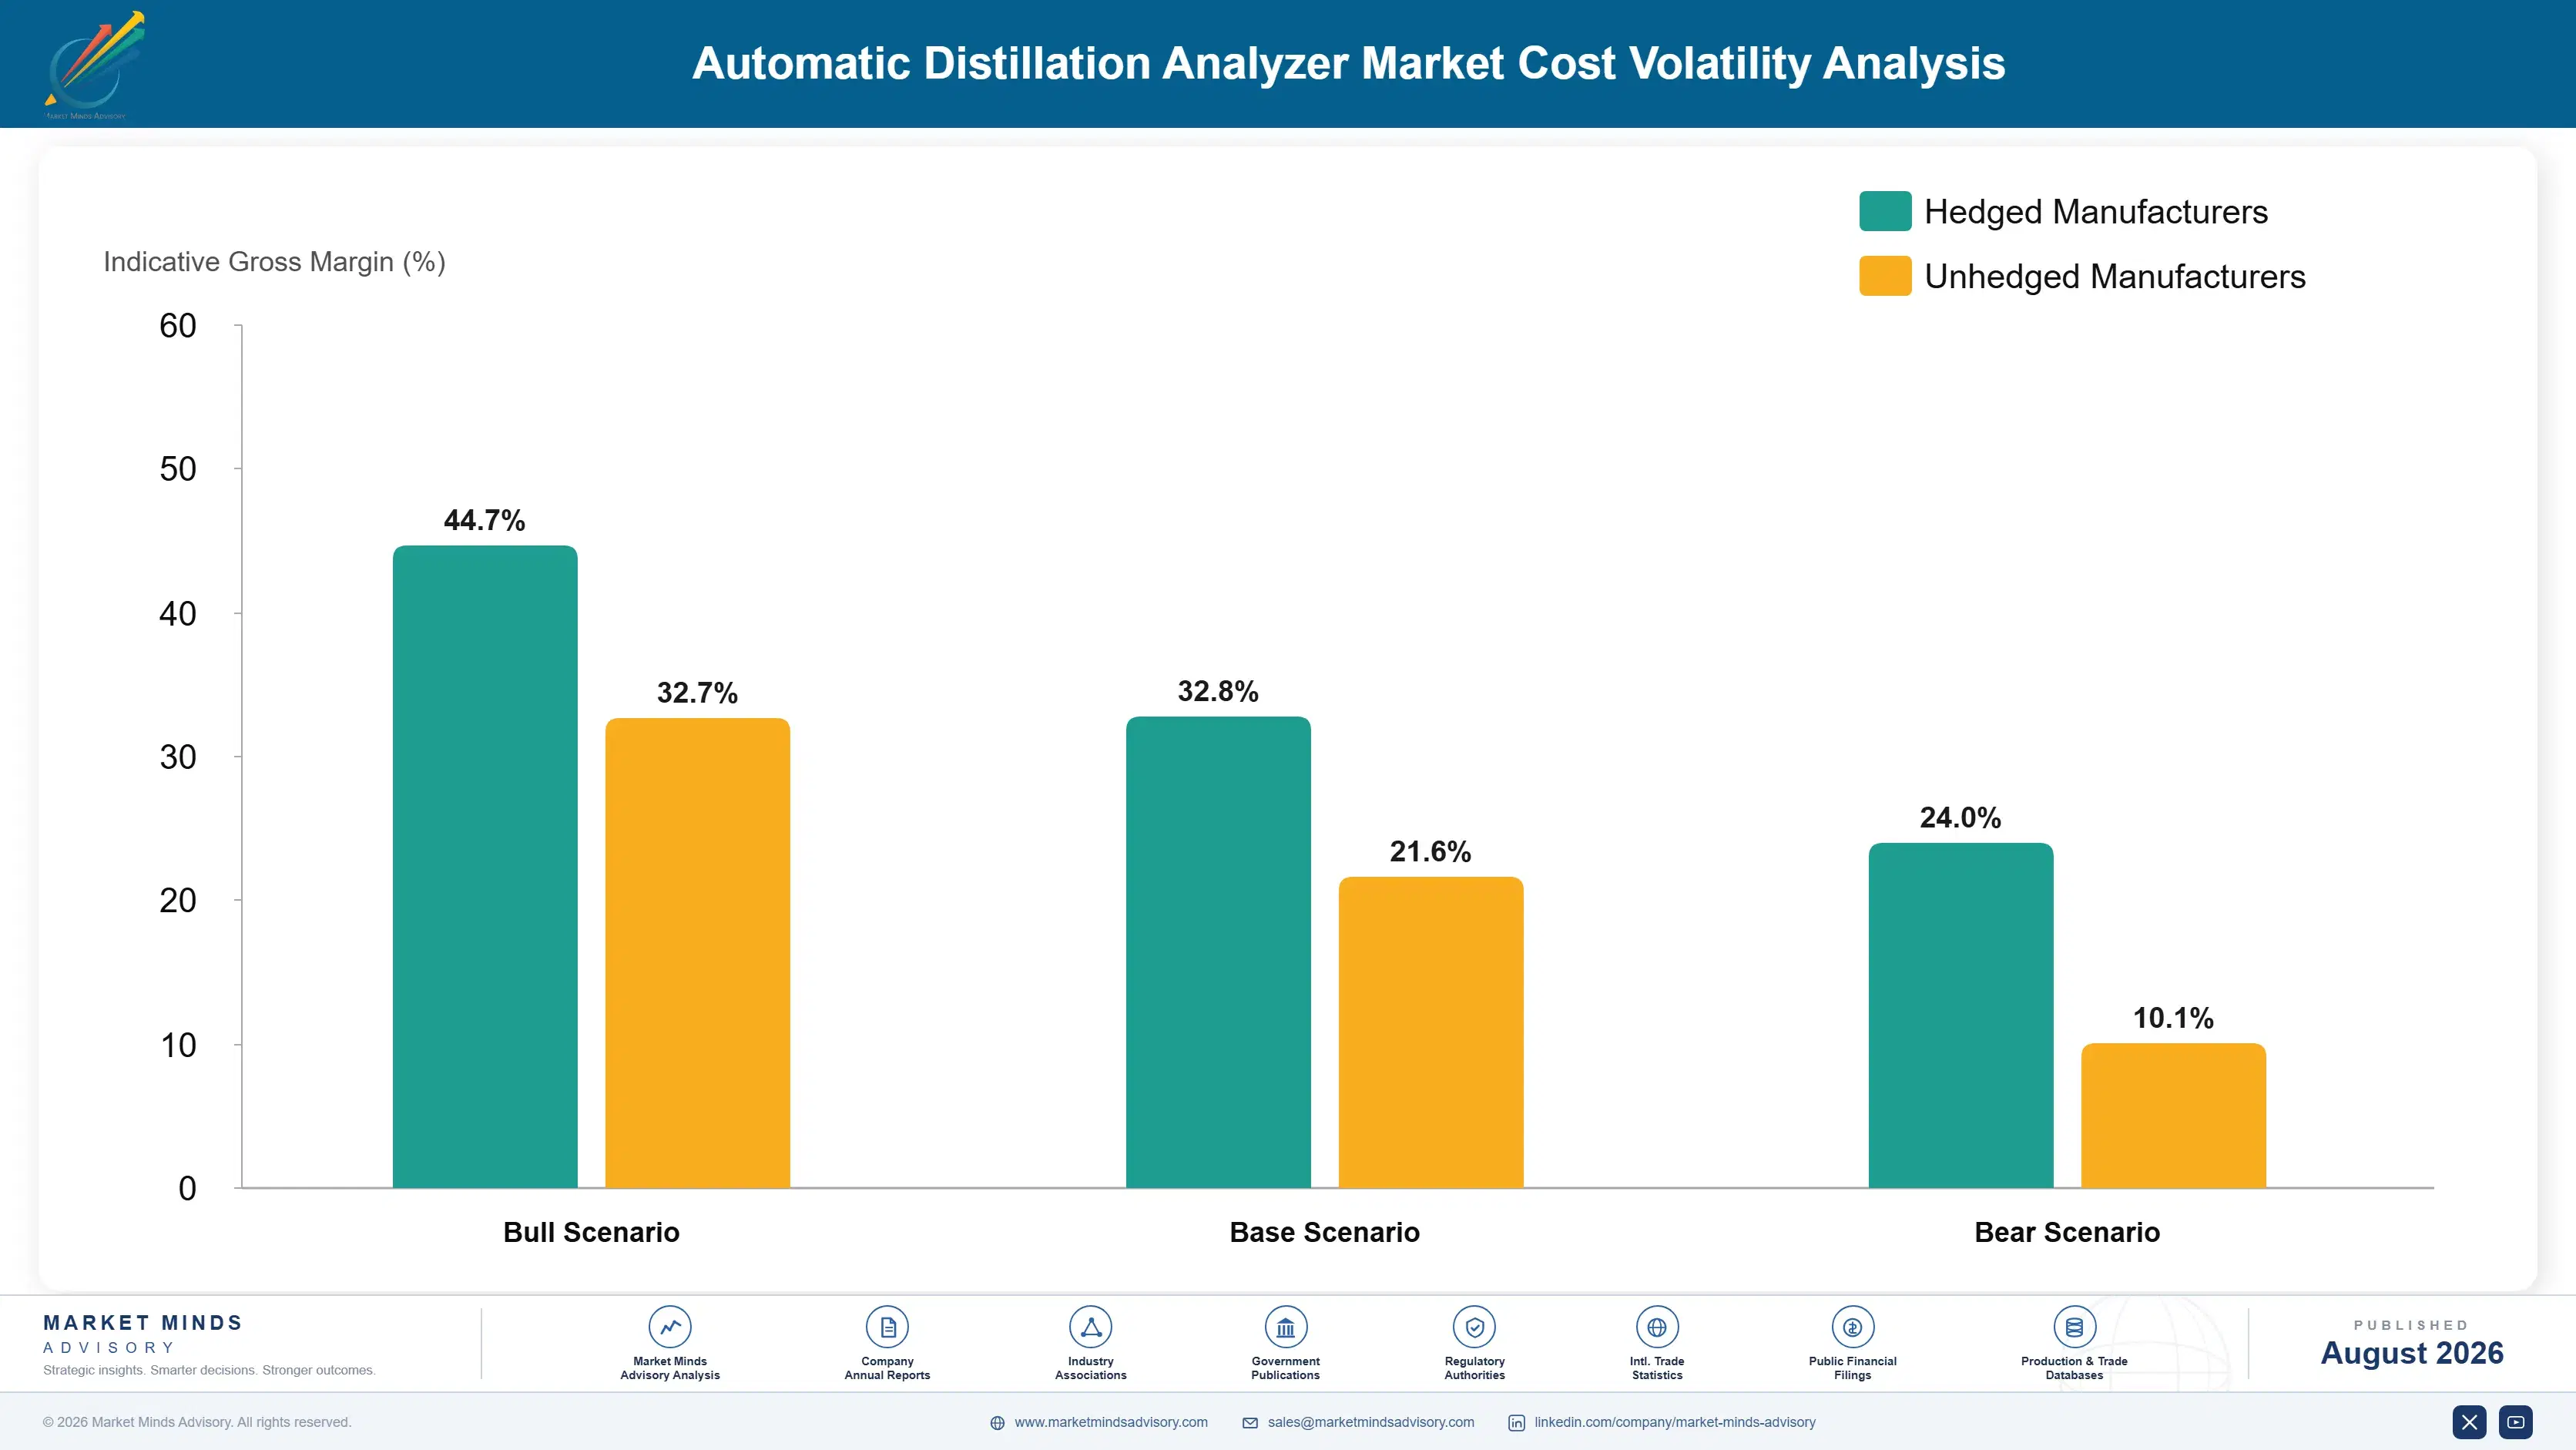
Electronics and precision components dominate. Temperature sensors, optical detection assemblies, control boards and precision heating elements together run 41 to 44% of manufacturing cost, sourced from European and Japanese specialty suppliers with long qualification histories. Machined metalwork and glassware add roughly 17%. Software development is capitalised separately and carries a share of its own that grows with every method revision.
The 2021 to 2023 semiconductor shortage hit this market harder than its size suggests. Control boards use industrial microcontrollers ordered in quantities too small to command allocation priority, and lead times ran past a year at several suppliers. AMETEK and Bruker annual reports for the period describe instrument delivery delays traced to component availability. Manufacturers redesigned boards around whatever silicon they could obtain, which required requalification of instruments already carrying published correlation data.

Exposure runs by order volume rather than by company size. Instrument makers ordering components in hundreds sit at the back of every allocation queue, behind automotive and consumer buyers ordering in millions. Larger diversified groups can aggregate demand across divisions and get seen. Specialist manufacturers cannot, and several lost a full year of deliveries because nobody had any reason to return the call.
automatic-distillation-analyzer-market-cost-volatility-analysis-1787676801229

Design control boards around widely available industrial silicon

Choosing a microcontroller because it performs marginally better creates a dependency on a part nobody else buys. Designing around widely used industrial silicon costs a little performance and removes most allocation risk, since the part remains in production long after a specialist alternative is discontinued. Requalification after a forced redesign costs far more than the performance ever earned.

Hold multi-year inventory of qualified critical components

An instrument carrying published correlation data cannot change its detection assembly casually, because the correlation was established on that hardware. Holding several years of critical components ties up working capital and protects the one thing that cannot be resourced quickly. The discipline is selectivity: stock what carries qualification exposure and let generic parts run lean as normal.

Shift revenue mix toward service and software subscriptions

Hardware carries component cost exposure and service does not. Every point of revenue moved toward calibration contracts, method software updates and remote diagnostics reduces sensitivity to component pricing while improving margin at the same time. The barrier is organisational rather than technical: service businesses need field engineers, dispatch systems and a commercial model most instrument makers have never built.

Portfolio Architecture for Margin Defence

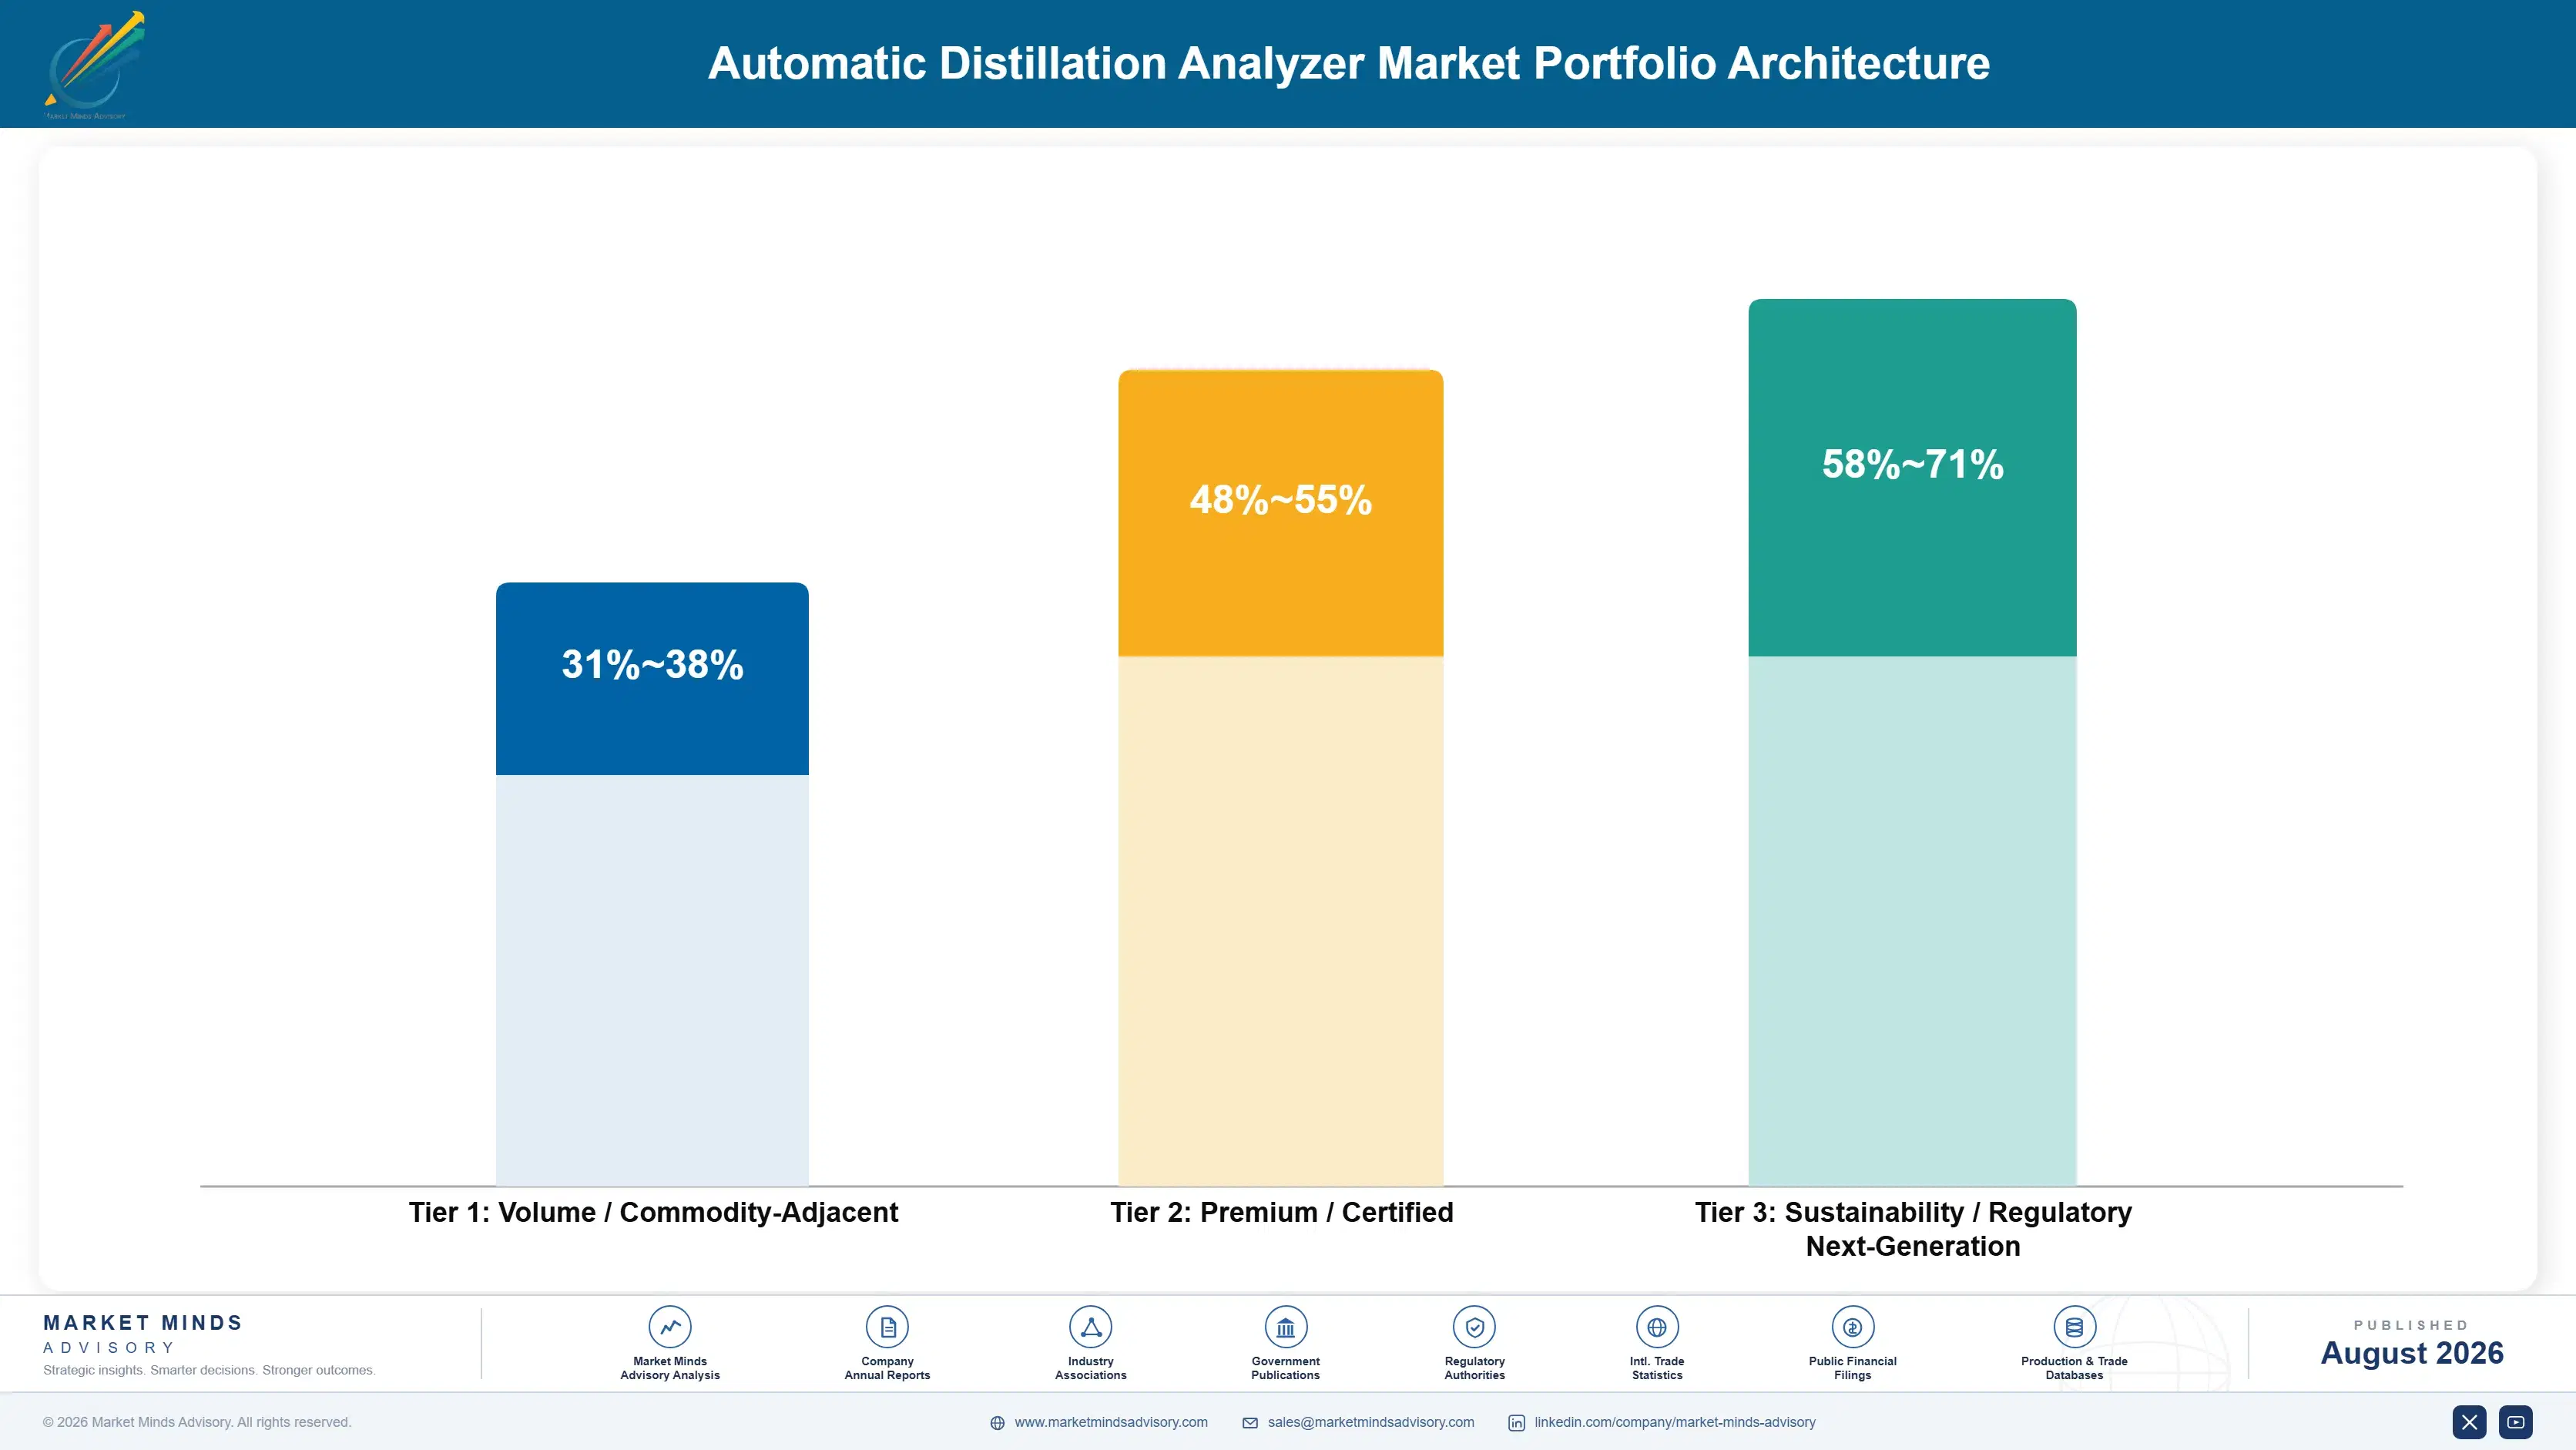
Margin follows correlation credibility rather than engineering content. A basic atmospheric analyzer sold against three comparable competitors earns instrument margins that barely justify the development cost. The same hardware carrying published correlation across renewable blends, sold into a laboratory that has no accepted alternative, earns considerably more. The physical difference between the two is often a software module.
The tension is that a laboratory buys instruments and service in one negotiation, usually from a procurement function measured on capital cost. Suppliers discounting hardware to win the placement then find service contracts benchmarked against that same expectation, which destroys the annuity before it starts. Firms that price service separately at the outset, and decline to bundle it away, hold margins that competitors bidding a total package cannot. That discipline costs some placements and it is the correct trade.

High-value pools sit in three places. Method software modules, where a correlation package costs almost nothing to reproduce and sells for real money. Contracted service and calibration, which produces annuity revenue with no component cost exposure. And online process analyzers, where the customer is buying uptime rather than a measurement and prices accordingly. None of them is the hardware.

Volume / Commodity-Adjacent

Basic atmospheric distillation analyzers and semi-automatic units sold against direct competitors on capital cost. The 7-point range separates established suppliers with service networks from importers selling on price alone. Chinese manufacturers are competing hardest at this level.
Gross Margin: 31-38%

Premium / Certified

Vacuum, multi-method and fully automated analyzers carrying published correlation across a wide product range. The 7-point spread separates instruments with broad method coverage from those qualified for a narrower set. Correlation credibility rather than hardware capability holds this pricing in place.
Gross Margin: 48-55%

Sustainability / Regulatory / Next-Generation

Micro-method instruments, renewable blend method modules and online process analyzers. The 13-point range is unusually wide because software method packages carry almost no marginal cost while online analyzers carry substantial hardware and installation content, and both sit in this tier.
Gross Margin: 58-71%
automatic-distillation-analyzer-market-portfolio-architecture-1787676801729

High-value Sub-segments and Strategic Watch-out

Renewable Blend Method Modules

Highest value and fastest growth, sold as software packages carrying correlation data for fuels the original methods never covered. Marginal cost is close to zero and the customer has no alternative source. The risk is that method revisions eventually make this coverage standard rather than optional, which removes the premium.
Gross Margin: 67-70%

Contracted Calibration And Service

High value with steady growth, producing annuity revenue that carries no component cost exposure. The engineer inside the laboratory each year sees failing instruments and forming budgets before any competitor does. The constraint is field service coverage, which is expensive to build in regions where refining capacity is growing.
Gross Margin: 52-55%

Standard Atmospheric Analyzers

The volume core, carrying most units shipped and the least differentiation between suppliers. Chinese manufacturers with credible hardware compete hardest here, and correlation history matters least in process control applications. Most established suppliers run this line to hold laboratory relationships that carry higher-value work alongside it.
Gross Margin: 33-36%

Western Refinery Installed Base

The strategic watch-out. This base carries substantial service revenue and replacement potential, and it shrinks with every European or North American refinery closure since laboratories do not relocate. The risk is planning service network investment around an installed base that is disappearing faster than the replacement capacity arrives.
Gross Margin: 44-47%

Why The Installed Base Pays

An analyzer sold once generates revenue for 12 years afterward through calibration, consumables, method software updates and eventual replacement. Service alone runs to roughly 34% of what the instrument earned, and it arrives predictably regardless of refinery capital cycles. Suppliers who measure themselves on instrument sales are counting the smaller half of their own business.
Stickiness varies by what the result is used for. A quality laboratory releasing product on a certificate essentially never changes instrument supplier mid-method, because the correlation and the audit history belong to that hardware. Process control laboratories switch readily, since nobody outside the plant sees the number. Research laboratories buy on capability and change often. Terminal and blending operators have no habits at all yet, which is precisely why they are worth reaching first.

The buyer has changed profession and nobody adjusted the sales approach. 20 years ago a laboratory manager with an analytical chemistry background chose the instrument. Now an operations manager approves it on a headcount case, procurement runs the tender on capital cost, and the chemist who will use it is consulted late. Suppliers still presenting precision data to people who are buying unattended running hours lose without understanding why.
automatic-distillation-analyzer-market-end-use-penetration-index-1787676802223

Where The Instrument Money Is

These are among the four positions where our research anticipates prominent divergence between winners and laggards over the coming forecast period. Each is grounded in the demand model, the regulatory perimeter, and the announced capacity pipeline.
01 / STANDARDS COMMITTEE INVESTMENT

Fund method committee work as a sales channel

A method revision decides what an instrument may legally be used for, and those revisions are written by committees whose members are overwhelmingly supplier employees rather than customers. Participation costs technical staff time and roughly 3 years before any revenue appears, which is exactly why competitors underfund it and treat it as a technical courtesy. Firms that fund it properly design products against methods they helped shape and learn about transitions on the drafting floor rather than on publication day, and the resulting head start on correlation data is decisive.
02 / SERVICE ANNUITY CAPTURE

Price service separately and refuse to bundle it

Calibration, consumables and method updates run to roughly 34% of what an instrument earns across a 12 year life, and suppliers who let procurement bundle that into a capital negotiation destroy the annuity before it begins. Priced separately from the outset, service also puts an engineer inside the laboratory annually, seeing which instruments are failing and which budgets are forming before any competitor learns a tender exists. The discipline costs some placements to competitors quoting a total package, and it is the correct trade in every case.
03 / CONTRACTOR CHANNEL BUILDING

Sell to engineering firms, not refinery laboratories

New refining complexes specify laboratories in the engineering package years before an operator appoints a laboratory manager, and each specification typically covers 8 instruments purchased together. The contractor chooses, usually by repeating whatever worked on the previous project, which means one win carries forward into several more without any competitive tender. Building relationships inside engineering firms means funding technical support for people who will never operate the instrument, and that is precisely the expenditure most sales organisations decline to justify internally.
04 / BLENDING SITE ACCESS

Build a product for buyers who are not chemists

Renewable and sustainable aviation fuel blending happens at roughly 1,900 sites that have never owned an analytical instrument, employ no analytical chemists and buy through operations budgets rather than laboratory ones. Suppliers whose entire channel runs through refinery procurement cannot see these accounts, and the incumbents there are nobody, which is a rare position in a market this concentrated. Reaching them requires simpler instruments, support written for non-specialists and a different sales motion, and that is a product decision rather than a marketing one.

Engagement Snapshot From the Field

A live engagement with an industry participant carrying material or product regulatory and market exposure ahead of a defining policy shift, showing how our research translates into a defensible multi-year portfolio strategy.
MARKET MINDS ADVISORY · CLIENT ENGAGEMENT SUMMARY
Automatic Distillation Analyzer Producer Strategic Portfolio Review and Transition Roadmap 2026·Investment Scenario on Automatic Distillation Analyzer Exposure Evaluation 2025-26
CLIENT PROFILE
A European analytical instrument manufacturer producing petroleum test equipment across four method families, with instrument revenue reported at 94 million euros (client-reported, unverified by MMA). Roughly 81% came from hardware sales and the remainder from service. Its installed base was concentrated in Western European and North American refineries, and unit volumes had declined for three consecutive years without any loss of competitive position.
STRATEGIC CHALLENGE
Sales leadership attributed the decline to Chinese competition and proposed a lower-cost product line. The commercial data did not support that: win rates had held steady wherever the company bid. The problem was that fewer bids existed, because refineries in its territories were closing and new capacity elsewhere was being specified by engineering contractors nobody in the company had ever met.
MMA APPROACH
MMA rebuilt the addressable market by counting laboratories rather than refineries, then traced how each new complex commissioned since 2018 had selected its analytical suppliers. Fifteen expert interviews with engineering contractors in Korea, Italy and India established how those specifications are actually made. The analysis treated bid access, not bid outcome, as the variable that explained the decline.
KEY FINDINGS
  1. The company had been invited to bid on 11 of the 47 new refinery laboratories commissioned globally since 2018, and had won 7 of those 11.
  2. Three engineering contractors specified 61% of all new laboratory equipment worldwide, and the company had no relationship with any of them at all.
  3. Service revenue at 19% of the total sat well below what the installed base could support, because contracts were sold reactively rather than at instrument purchase.
  4. A lower-cost product line would have competed against the company's own instruments in its existing markets while doing nothing about bid access elsewhere (client-reported, unverified by MMA).
CLIENT PROFILE
A European analytical instrument manufacturer producing petroleum test equipment across four method families, with instrument revenue reported at 94 million euros (client-reported, unverified by MMA). Roughly 81% came from hardware sales and the remainder from service. Its installed base was concentrated in Western European and North American refineries, and unit volumes had declined for three consecutive years without any loss of competitive position.
STRATEGIC CHALLENGE
Sales leadership attributed the decline to Chinese competition and proposed a lower-cost product line. The commercial data did not support that: win rates had held steady wherever the company bid. The problem was that fewer bids existed, because refineries in its territories were closing and new capacity elsewhere was being specified by engineering contractors nobody in the company had ever met.
MMA APPROACH
MMA rebuilt the addressable market by counting laboratories rather than refineries, then traced how each new complex commissioned since 2018 had selected its analytical suppliers. Fifteen expert interviews with engineering contractors in Korea, Italy and India established how those specifications are actually made. The analysis treated bid access, not bid outcome, as the variable that explained the decline.
KEY FINDINGS
  1. The company had been invited to bid on 11 of the 47 new refinery laboratories commissioned globally since 2018, and had won 7 of those 11.
  2. Three engineering contractors specified 61% of all new laboratory equipment worldwide, and the company had no relationship with any of them at all.
  3. Service revenue at 19% of the total sat well below what the installed base could support, because contracts were sold reactively rather than at instrument purchase.
  4. A lower-cost product line would have competed against the company's own instruments in its existing markets while doing nothing about bid access elsewhere (client-reported, unverified by MMA).
RECOMMENDED STRATEGY
Phase 1: Phase one: abandon the lower-cost product proposal and redirect that development budget toward engineering contractor technical support from this year. Phase 2: Phase two: place technical staff with the three dominant engineering contractors, supporting their design work rather than selling to their eventual clients. Phase 3: Phase three: sell a service contract with every instrument at the point of purchase rather than attempting to sell one afterward.
OUTCOME
Bid invitations on new complexes rose from 11 over seven years to 6 in the first 18 months of contractor engagement. Service revenue climbed from 19% to 27% of total within two years, with attachment at purchase running above 70% (client-reported, unverified by MMA). The lower-cost product line was never developed.

Frequently Asked Questions

Foundational context covering the market sizes, CAGR, scope, country, region and competition that inform every finding below. This section is provided to cover basics and most often pre-purchase conversations, answered from the MMA Primary Research Dataset.

What is the current size of the Automatic Distillation Analyzer Market?

The market was worth 0.26 billion dollars in 2025, covering atmospheric, vacuum, micro-method, multi-method and online distillation analyzers. It reaches 0.27 billion dollars in 2026 on current forecasts.

How large will the Automatic Distillation Analyzer Market be by 2036?

MMA forecasts 0.47 billion dollars by 2036, an increase of 0.2 billion dollars over the 2026 base. That represents an expansion multiple of 1.74 times across the forecast period.

What is the CAGR for the Automatic Distillation Analyzer Market 2026 to 2036?

The base case compounds at 5.6% annually. MMA's bull case reaches 6.8% if micro-method results gain certificate of analysis acceptance, while the bear case sits at 4.4% on faster Western refinery closures.

Which segment is growing fastest?

Micro-method distillation analyzers, at 8.4%, half again the market rate of 5.6%. They use 6 millilitres instead of 100 and finish in minutes rather than an hour.

Who are the major companies in the Automatic Distillation Analyzer Market?

Anton Paar, PAC, Koehler Instrument Company, Normalab and Tanaka Scientific lead on installed instrument base. AMETEK Grabner Instruments, Stanhope-Seta, Cannon Instrument Company, Shimadzu and Metrohm compete strongly in specific configurations.

Which country is growing fastest?

India at 8.8%, driven by refining capacity expansion and Bharat Stage fuel quality standards that forced method coverage older laboratories lacked. China follows on new complex construction.

Report Segmentation Architecture

The full report scope spans multiple orthogonal segmentation dimensions, with cross-tabulated demand data provided for each dimension pair. Coverage extends further to regional breakdowns, trend trajectories, and the competitive detail needed to support segment-level decision-making.

By Analyzer Configuration

  • Atmospheric Distillation Analyzers
  • Vacuum Distillation Analyzers
  • Micro-Method Distillation Analyzers
  • Automated Multi-Method Combination Analyzers
  • Online Process Distillation Analyzers
  • Manual-Assist and Semi-Automatic Units

By End-Use Industry

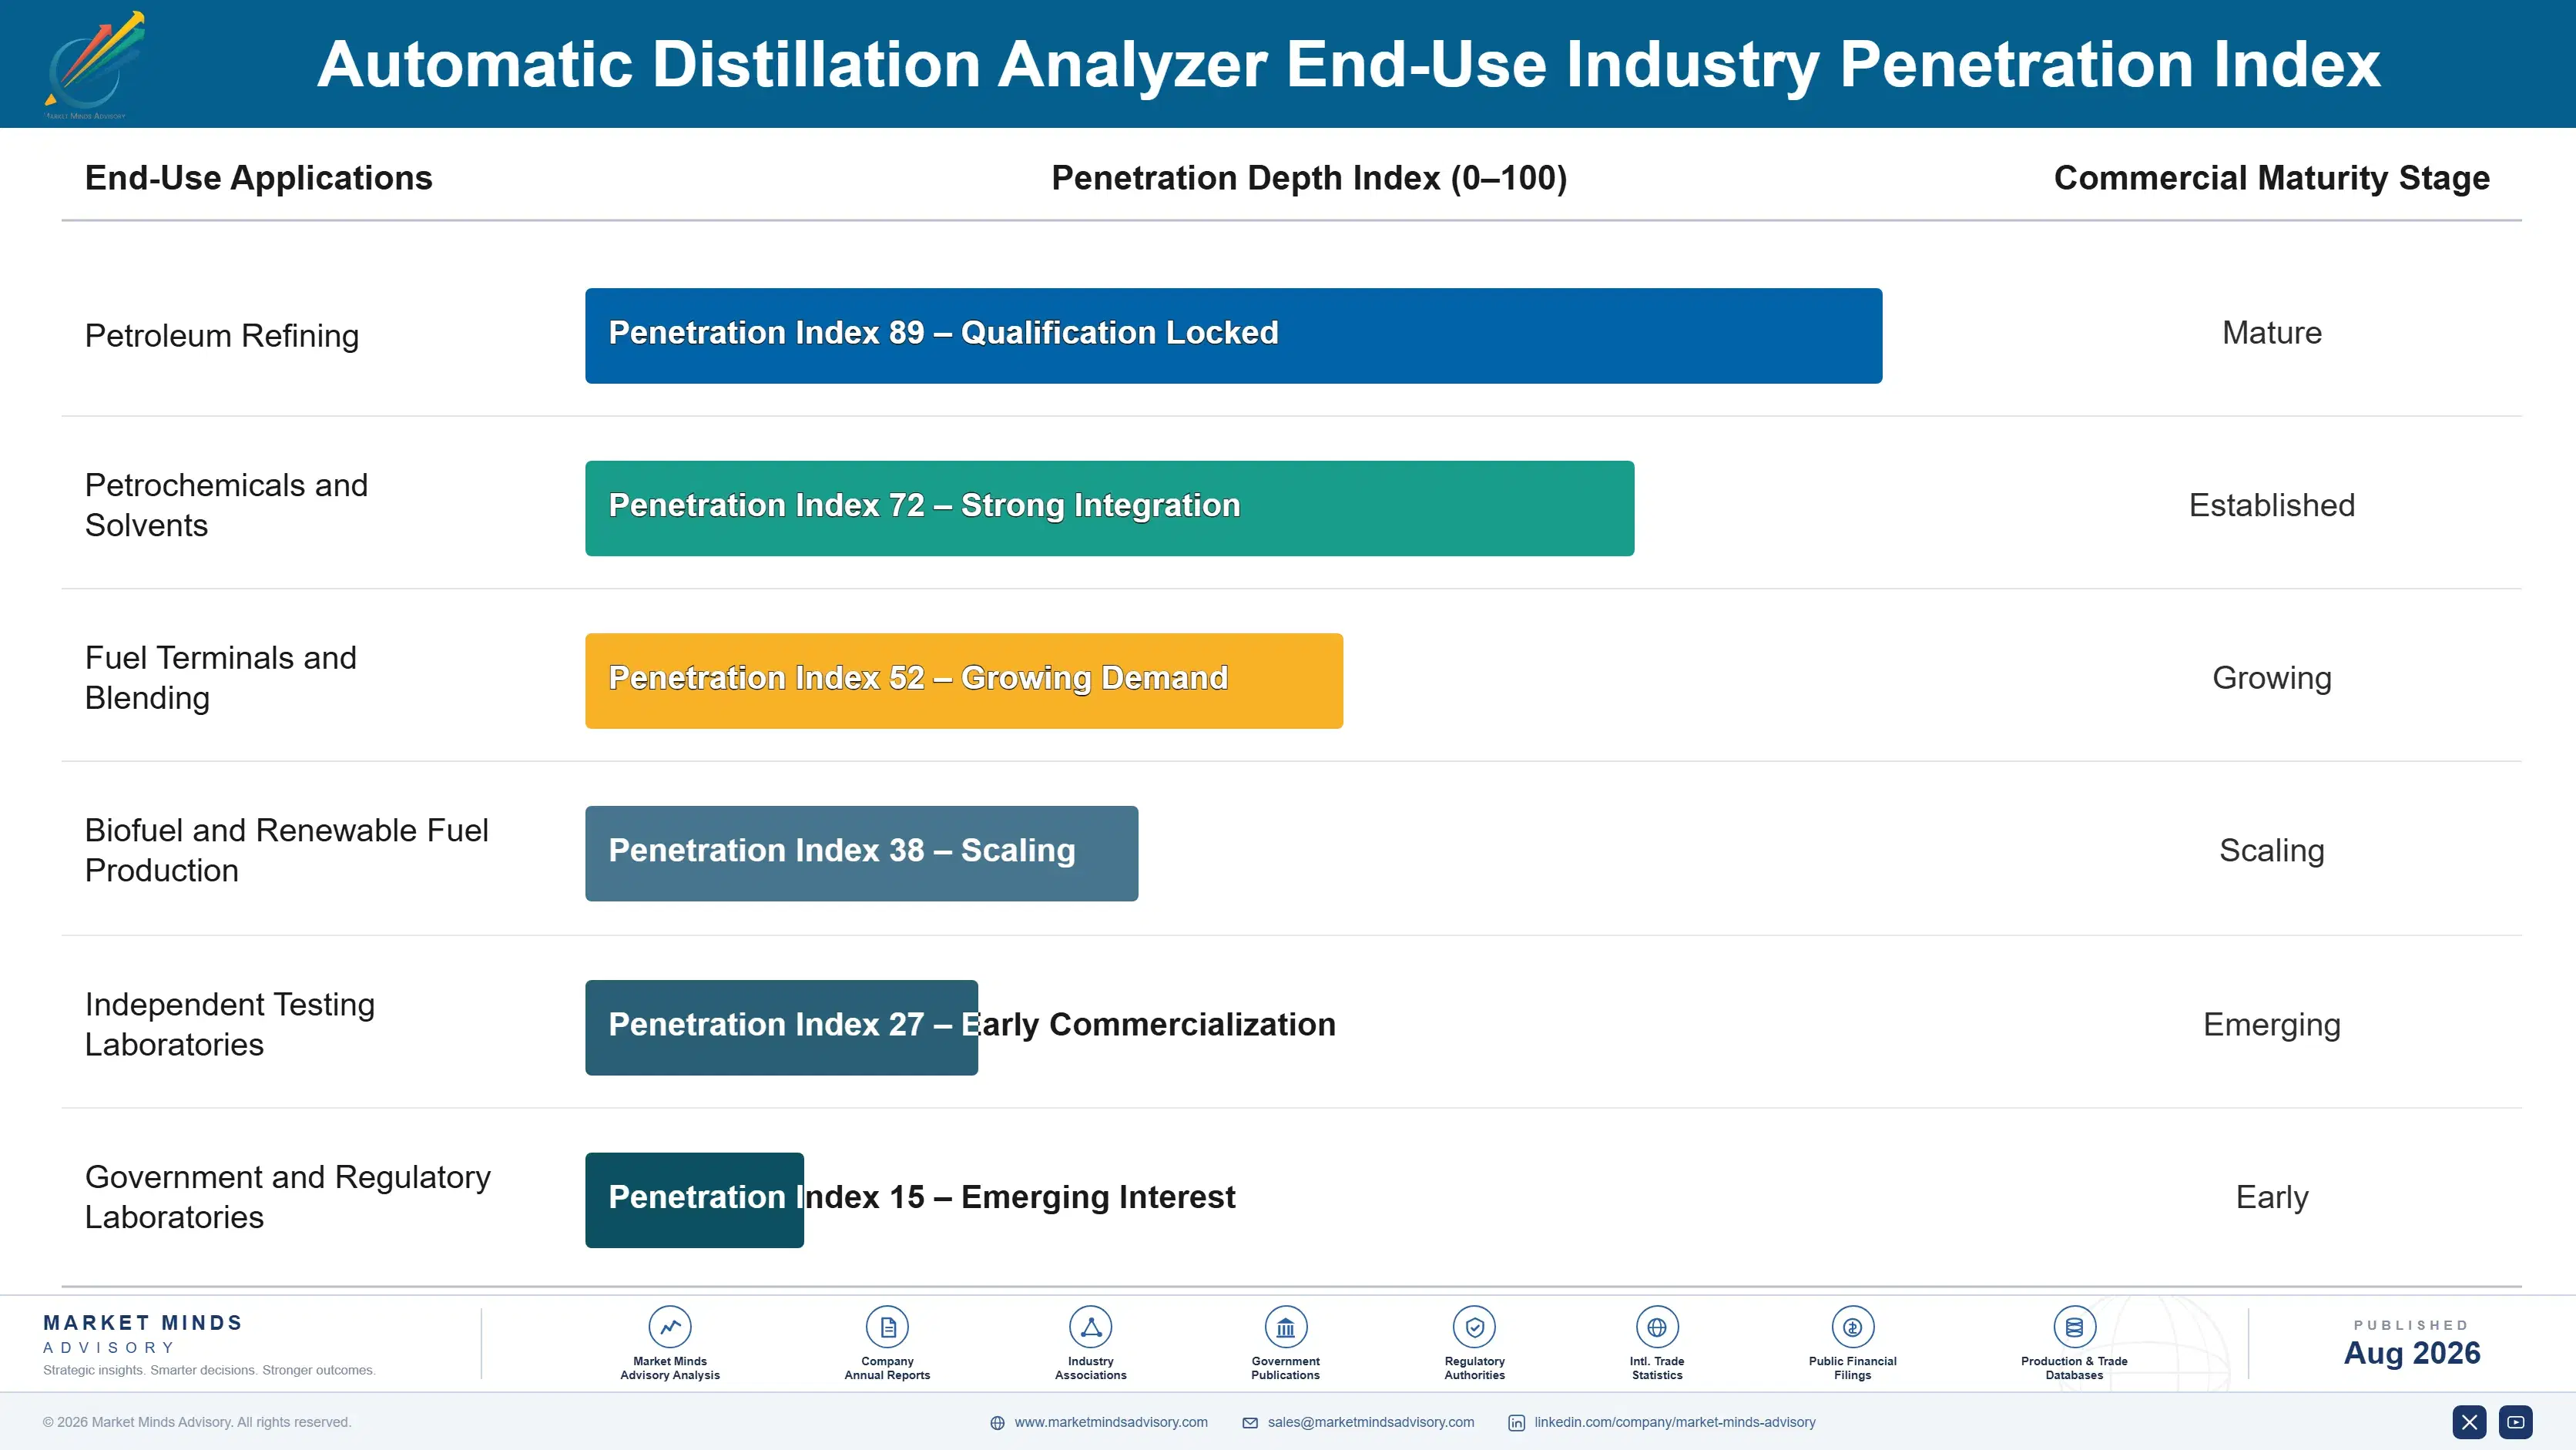
  • Petroleum Refining
  • Petrochemicals and Solvents
  • Fuel Terminals and Blending
  • Biofuel and Renewable Fuel Production
  • Independent Testing Laboratories
  • Government and Regulatory Laboratories

By Commercial Dimension

  • Direct Manufacturer Sale
  • Engineering Contractor Specification
  • Distributor and Agent Channel
  • Service Contract Attachment
  • Refurbished Instrument Supply
  • Method Software Licensing

By Region

  • North America
  • Western Europe
  • East Asia
  • South Asia and Pacific
  • Latin America
  • Middle East and Africa
  • Eastern Europe

Scope, Methodology, and Coverage

Every figure in this report is reproducible from documented input assumptions. The scope below maps the historical period, the forecast horizon, the segmentation dimensions, and the countries covered, alongside the underlying primary and qualitative methodology.
Historical Period
2020 to 2025
Forecast Period
2026 to 2036
Base Year
2025 (USD billions; MMA Primary Research Dataset, August 2026)
Market Definition
Scope covers instruments that automate the determination of distillation characteristics for petroleum products and organic liquids under recognised test standards, spanning atmospheric, vacuum, micro-method, multi-method combination, online process and semi-automatic configurations, together with the method software packages that accompany them. Manual glassware apparatus, gas chromatographic simulated distillation, flash point testers and viscometers are excluded. Consumables, third-party calibration services and laboratory information management systems fall outside the boundary.
Quantitative Units
USD billions (current prices); instruments shipped; installed base; laboratories served; service contract attachment rate
Segmentation Dimensions
By Analyzer Configuration; By End-Use Industry; By Commercial Dimension; By Region
Regions Covered
North America, Western Europe, East Asia, South Asia and Pacific, Latin America, Middle East and Africa, Eastern Europe
Countries Covered
USA, China, Germany, France, UK, Japan, South Korea, India, Brazil, Mexico, Italy, Spain, Poland, Saudi Arabia, South Africa
Key Companies Profiled
Anton Paar, PAC, Koehler Instrument Company, Normalab, Tanaka Scientific, AMETEK Grabner Instruments, Stanhope-Seta, Cannon Instrument Company, Ayalytical Instruments, Linetronic Technologies, Lauda Scientific, Bruker, Shimadzu, Metrohm, Yokogawa Electric, Emerson Electric, ABB, Modcon Systems, Bartec Group, Beijing Beifen-Ruili Analytical Instrument
Quantitative Methodology
Primary survey, n=3,800 respondents, Q4 2025, six countries; demand-side model with trade association cross-validation
Qualitative Methodology
47 expert interviews, Q4 2025; applied to validate demand model assumptions, identify emerging dynamics, and assess competitive positioning
Report Format
PDF and XLSX data workbook (Word format preview document)
Publisher
Market Minds Advisory
Report Code
MMA-2026-CON-123
Published
August 2026
Contact
sales@marketmindsadvisory.com | www.marketmindsadvisory.com

Purchase the full Automatic Distillation Analyzer Market Report (2026 to 2036).

The full report runs to 165 pages and covers all six analyzer configuration segments, seven regions and 20 profiled companies in detail. It includes the complete segment CAGR set, regional installed base and laboratory count data, and method coverage comparison across the principal test standards. Company profiles carry evaluation on installed instrument base, with moat and risk assessment for the top five suppliers. The competitive section extends to 14 tracked corporate developments across 2024 and 2025, each with commercial interpretation. Primary research inputs include a quantitative survey of 3,800 respondents and 47 expert interviews conducted in Q4 2025.
Six analyzer configuration segments with individual CAGR forecasts
Seven regional markets with installed base and laboratory counts
Twenty company profiles on consistent installed base evaluation
Fourteen tracked corporate developments with commercial interpretation notes
Method coverage comparison across principal petroleum test standards
Service attachment and annuity analysis by supplier

Built For The People Who Decide

From boardroom strategy to bench-side execution, this report is read cover-to-cover by leaders shaping the next decade of their industry, turning demand scenarios, market dynamics and valuation benchmarks into decisions.
CXOs/ Presidents/ VPs/ Managers
M&A and Corporate Development
Strategy Teams and R&D Heads
Procurement and Product Directors
Regulatory and Compliance Leaders
Investor Relations and Equity Analysts