Market Minds Advisory
Automated Window Blinds Market

Automated Window Blinds Market: Automated Window Blinds Market: The Retrofit Opportunity Is Twenty-Three Times Larger, The Protocol Dies First, And The Installer Causes The Failure, 2026 to 2036

Existing window openings outnumber annual new build installations by roughly 23 to one. Home automation protocols support for about six years while a motorised blind lasts fifteen or more. Installers cause 44% of warranty claims.

Lead Analyst

Published

September 2026

Make Smarter Decisions with Customized Research Insights

Request a free sample report and evaluate market opportunities, growth trends, and competitive dynamics relevant to your business needs.

2025 MARKET VALUE$3.4BMarket Size 2025
2036 FORECAST VALUE$8.9BBase Case , 2026 to 2036
CAGR 2026 TO 20369.2 %Bull 10.5% / Bear 7.9%
INCREMENTAL OPPORTUNITY$5.2BNet 10- year value creation
EXPANSION MULTIPLE2.41x2036 value over 2026 base
Strategic Levers
M&A Pipeline
Regional Outlook
Country Rankings
Competitive Intelligence
Segmental Deep-dive
Call-Us : 91 93563 13602

Executive Snapshot and Market Trajectory.

Almost every window in the world already has a blind on it. Motorising what is already fitted is an opportunity roughly 23 times larger than new build installation, and most manufacturers still design as though the specification arrives with a building. Dealers do not serve that channel.
Retrofit motorisation kits grow at 13.8%, half again the market rate of 9.2%, and carry the thinnest margins in the category because nobody engineered properly for them. Commercial automated shading follows at 11.7% on a cooling load reduction near 18% that almost nobody sells it on. Hardwired AC systems grow slowest of the six architectures at 6.2%. Battery claims are stated under specified blind weight by about 8% of products.
East Asia holds 33% of demand and manufactures nearly all tubular motors and drives, with Chinese growth of 14.8% leading every market covered. Home automation protocols hold support for a median of about six years while a motorised blind lasts fifteen or more, which strands installed bases on a schedule nobody in this industry controls. About 44% of warranty claims trace to installation rather than product defect, so manufacturers absorb cost for another party's work.
Market Definition
This market covers motorised and automated interior window covering systems, including battery-powered motorised shades, hardwired AC motorised systems, solar-charged motorised blinds, motorised curtain and drapery track systems, retrofit motorisation kits for existing blinds, and commercial automated shading systems. It excludes manual window coverings, exterior awnings and shutters, architectural and electrochromic glazing, non-motorised curtain track, and building management software sold separately.
Base Year Value
$3.4B in 2025 (MMA Primary Research Dataset, September 2026)
Forecast Period
2026 to 2036, eleven discrete annual values
CAGR
9.2% base case. Bull 10.5%. Bear 7.9%.
Fastest Growth Segment
Retrofit Motorisation Kits: 13.8% CAGR
Fastest Growth Country
China: 14.8% CAGR
Fastest Growth Region
South Asia and Pacific: 11.2% CAGR
Largest Region
East Asia: 33% of 2025 global value
Market Leaders
Somfy, Hunter Douglas, Lutron Electronics, Nice Group, and Springs Window Fashions lead the field. Source: MMA Primary Research Dataset, July 2026.
Primary Survey
n=3,800 procurement and R&D decision-makers, Q4 2025, six countries
Methodology
Demand-side build-up, cross-validated against public data, 47 expert interviews

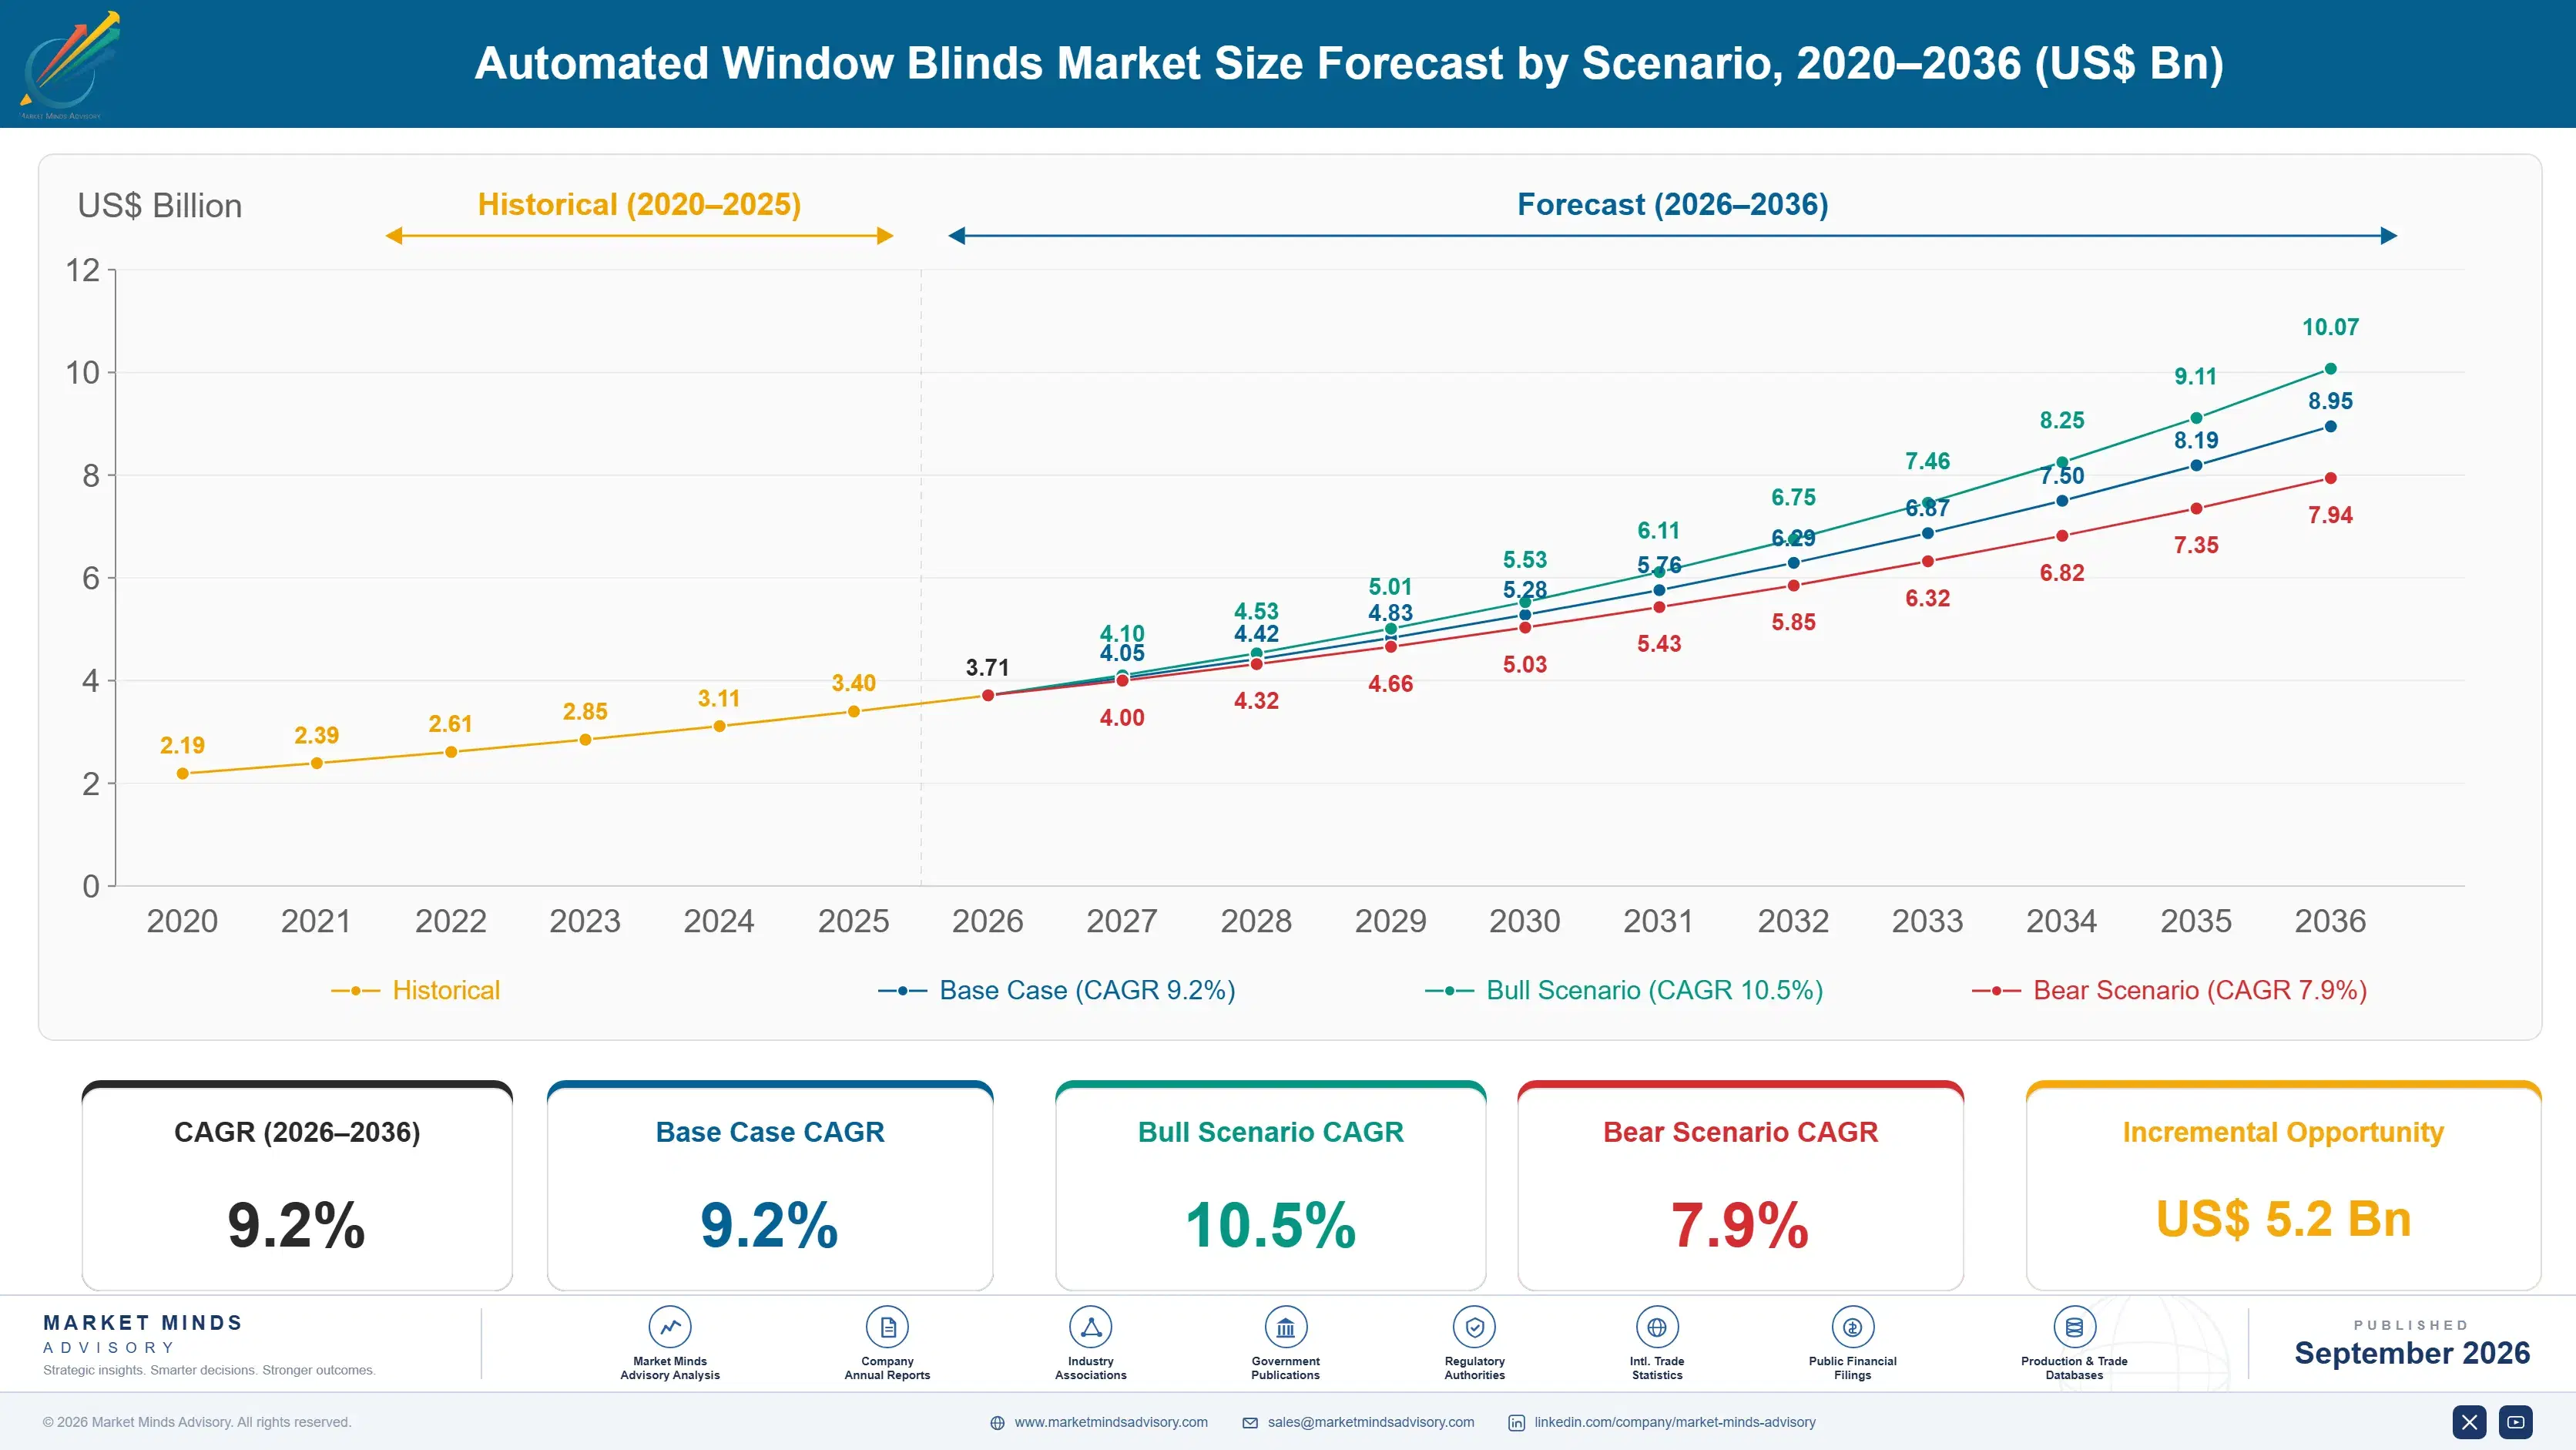
Automated Window Blinds Market Forecast Scenarios

automated-window-blinds-market-size-forecast-scenario-1790020298814
Growth from 2020 to 2025 ran at 8.0% and came from residential smart home adoption rather than from commercial specification. Battery motor costs fell far enough to make a motorised blind an ordinary consumer purchase rather than a custom installation, and retrofit kits arrived to serve windows that already had coverings. Commercial shading grew steadily on energy performance requirements in new construction.
The base case at 9.2% rests on three mechanisms. Retrofit motorisation keeps expanding into an installed base far larger than new construction can offer. Chinese motor manufacture and domestic smart home adoption grow together, with country growth at 14.8% leading every market covered. And commercial automated shading grows as cooling load requirements tighten in building codes across most regulated markets. None of the three assumes protocol support life lengthens during the period.
The bull case at 10.5% depends on protocol stability improving enough that buyers stop treating motorised blinds as a technology purchase with an obsolescence date. The bear case at 7.9% is installation: about 44% of warranty claims trace to installation rather than product defect, and a reputation for unreliability spreads faster than any single manufacturer can correct it.

Where The Windows Already Are

The addressable market for this category is not new buildings. Existing window openings outnumber annual new build installations by roughly 23 to one, and every one of them already has some form of covering that could in principle be motorised. Retrofit kits grow at 13.8% for exactly that reason, and carry the thinnest margins in the category.
TOP FIVE CONCENTRATION38%Share of category revenue held by the leading manufacturers
RETROFIT ADDRESSABLE MULTIPLE23 timesExisting window openings against annual new build installations
BATTERY CLAIM LOAD BASIS8%Products stating battery life under specified blind weight and cycles
PROTOCOL SUPPORT LIFE6 yearsMedian home automation protocol support against blind service life
COOLING LOAD REDUCTION18%Measured commercial cooling demand reduction from automated shading
INSTALLER ATTRIBUTED FAILURES44%Warranty claims traced to installation rather than to product defect
The obsolescence problem is the one buyers eventually discover. A motorised blind is a building product with a service life of fifteen years or more, and it is being sold with a radio protocol whose median support life runs about six. When a hub is discontinued or a platform changes direction, a functioning motor becomes a manual blind with a dead battery in it. Very few manufacturers offer a fallback that does not depend on somebody else's software.
The commercial argument is the strongest one in this market and almost nobody makes it. Automated shading reduces measured cooling demand by around 18% in buildings where it is properly commissioned, which is a payback calculation a facilities manager can verify. The industry sells smart buildings instead. Meanwhile about 44% of warranty claims trace to installation rather than to the product itself.
"The whole industry is chasing new construction while twenty-three times as many windows sit there with a manual blind on them. And the thing they are selling has a fifteen year motor bolted to a six year protocol, which is a problem the customer discovers on their own schedule."
Practice Director, Building Products and Automation · MMA Construction and Building Products Practice · September 2026

Market Trends

Retrofit Overtakes The Specification Channel Entirely

Retrofit motorisation kits grow at 13.8%, fastest of the six architectures, against an installed base roughly 23 times larger than annual new construction. The commercial difficulty is that products designed for factory fitting into a new blind do not transfer cleanly onto whatever is already hanging in a window, and the kits that do work are engineered down to a price rather than up to a standard. Manufacturers treating retrofit as a lower tier of the same product are ceding the fastest growing part of their market to purpose-built entrants.
Market Impact: Country grows at 14.8%

Protocol Life Runs Shorter Than Product Life

Home automation protocols hold support for a median of about six years while a motorised blind is a building product lasting fifteen or more. A discontinued hub or a platform change turns a working motor into a manual blind, and buyers who have experienced that once become considerably harder to sell to afterwards. Manufacturers offering local control fallback that works without any cloud or hub dependency are addressing the objection directly. Very few currently do, and the ones that do rarely say so clearly. The capability costs a physical control interface and firmware discipline rather than any new hardware.
Market Impact: Reduces cooling demand 18%

Market Opportunities and Growth Drivers

Chinese Motor Manufacture Sets The Whole Cost Base

China grows at 14.8%, faster than any country covered, as tubular motor manufacture and domestic smart home adoption expand together. East Asia holds 33% of world demand and produces nearly all of the world's tubular motors and drives, which means every brand in this category buys the same core component from broadly the same supply base. Differentiation therefore comes from control software, fabric systems, and installation capability rather than from the motor. Chinese brands increasingly sell finished systems directly. Retrofit kits reached mass consumer pricing there first and continue to set the world price floor.
Market Impact: Installation causes 44% of claims

Cooling Load Requirements Pull Commercial Specification

Commercial automated shading grows at 11.7% as building codes tighten cooling load requirements across most regulated markets and designers look for measures that reduce demand rather than adding plant capacity. Properly commissioned automated shading reduces measured cooling demand by around 18%, which is verifiable rather than modelled. That is a considerably stronger argument than convenience and it reaches a facilities and engineering buyer rather than an architect. Most manufacturers still lead with the architect. Commissioning is where these projects fail, since a system installed without solar position programming gets manually overridden and then disabled by the occupants working under it.
Market Impact: Only 8% state load

Market Restraints and Challenges

Installation Rather Than Product Causes Most Failures

About 44% of warranty claims trace to installation rather than to product defect, and the root cause is that a motor fighting a misaligned bracket or an out of square opening draws current continuously and burns out. Commercially this damages manufacturer reputation for problems installers created, and it makes warranty cost unpredictable. Manufacturers respond with installer certification programmes, with self-diagnosing motors that report abnormal current draw, and with mounting systems tolerant of imperfect openings. Self-diagnosis converts a warranty dispute into a documented fact before the product has actually failed at all.
Market Impact: Retrofit grows at 13.8%

Battery Claims Ignore Blind Weight And Cycles

Around 8% of products state battery life under specified blind weight and daily cycle count, and the root cause is that a headline figure measured on a small light shade at low cycles reads far better than one measured on a large blackout roller. Commercially this produces disappointment recorded as product failure. Manufacturers respond by publishing runtime against stated weight and cycles, by offering solar charging on larger units, and by sizing batteries to the blind rather than to the price point. Solar charging on larger units removes the problem rather than managing it.
Market Impact: Protocols last 6 years
3 additional market trends, 4 additional growth drivers, and 2 additional restraints and challenges are covered in the full report. Contact sales@marketmindsadvisory.com to access the complete intelligence.

Segment CAGR and Growth Architecture

Segmentation follows system architecture and installation class across six categories: battery-powered motorised shades, hardwired AC motorised systems, solar-charged motorised blinds, motorised curtain and drapery track systems, retrofit motorisation kits, and commercial automated shading systems. Control protocol, building type, and channel are treated as separate dimensions. Manual coverings, exterior shutters, and electrochromic glazing fall outside the defined scope entirely.
automated-window-blinds-market-market-share-analysis-1790020299355

Retrofit Motorisation Kits

Retrofit motorisation kits grow at 13.8%, half again the market rate of 9.2%, on an installed base of existing window openings roughly 23 times larger than annual new construction can supply. The engineering problem is genuine: a kit has to drive whatever chain, cord, or tube is already fitted, in an opening nobody measured for it, without the mounting reference a factory-fitted motor assumes. Products doing this properly are more expensive to develop than a standard motorised blind and sell for less. Purpose-built entrants have taken most of the growth while established manufacturers treated retrofit as a downgraded version of their existing range. Mounting tolerance rather than motor quality decides who wins here.
CAGR 13.8%

Commercial Automated Shading Systems

Commercial automated shading grows at 11.7% on an energy argument that is measurable, verifiable, and largely unspoken. Properly commissioned systems reduce measured cooling demand by around 18%, which lets a facilities manager calculate a payback period rather than accept a convenience claim. Building codes tightening cooling load requirements pull the specification further. The commissioning is where projects fail: a system installed without solar position programming and without occupant override behaviour simply gets disabled by the people working under it. Manufacturers selling commissioning as part of the system rather than as an optional service hold these installations far longer. Building codes tightening cooling load requirements pull the specification further each year.
CAGR 11.7%
Full segment breakdown across 6 segments available in the complete report.

Regional Architecture and Country Demand Map

Regional shares reflect where automated window covering systems are installed rather than where motors are manufactured. Two regions sit outside the standard bands, for reasons named in their own paragraphs and summarised below for operator review. Solar gain, code requirements, and channel structure vary sharply between them.

East Asia

At 33% this sits above the standard band, and the justification is that the region manufactures nearly all of the world's tubular motors and drives while Chinese domestic smart home adoption has become the largest single national market. Chinese growth of 14.8% leads every country covered. Japanese and Korean demand skews toward integrated residential systems in high specification apartment construction. Chinese brands increasingly sell finished systems directly rather than supplying motors to Western assemblers. Retrofit kits reached mass consumer pricing here first and continue to set the world price floor for them. Every brand in the category buys its core drive from the same regional supply base, which limits differentiation.
Share: 33% | CAGR: 10.2% (2026 to 2036)

North America

Residential smart home adoption drove the category here and continues to carry most regional volume, with retrofit kits reaching consumers through electronics and online channels rather than through window covering dealers. Growth of 8.4% runs a little under the world rate. Commercial automated shading is well established in high specification office construction, though it is specified on daylighting and appearance more often than on the cooling load reduction that would justify it better. Installer quality varies widely and warranty attribution disputes are common across the dealer network. Retrofit demand reaches consumers through electronics and online channels that window covering dealers do not serve at all, which is the clearest channel gap in the category anywhere.
Share: 24% | CAGR: 8.4% (2026 to 2036)
Regional intelligence for 5 additional markets available in the complete report: Western Europe, South Asia and Pacific, Latin America, Middle East and Africa, Eastern Europe. Contact sales@marketmindsadvisory.com.
automated-window-blinds-market-country-cagr-analysis-1790020299883

Where Blind Makers Build Position

Four commercial moves matter in a category chasing the smaller half of its own market, bolting a fifteen year product to a six year protocol, and absorbing warranty cost for failures somebody else caused. Each addresses a fact the industry knows and its product planning does not reflect. None of the four requires a better motor than already exists.

Engineer Retrofit Properly Rather Than Downgrading

Existing window openings outnumber annual new build installations by roughly 23 to one, and retrofit kits grow at 13.8% while carrying the thinnest margins in the category. Manufacturers engineering purpose-built retrofit systems rather than downgrading factory products report share capture 2.7 times greater in the segment. The engineering problem is harder than a standard motorised blind and the price point is lower, which is why incumbents avoided it and purpose-built entrants took the growth. The channel is different too, running through electronics and online retail rather than through window covering dealers.
Market Impact: Raises segment share capture to 2.7 times greater

Guarantee Local Control Without Any Hub

Home automation protocols hold support for a median of about six years while a motorised blind lasts fifteen or more, which strands installed bases on somebody else's schedule. Manufacturers offering local control fallback independent of cloud or hub dependency report specification wins 2.3 times higher with commercial buyers who understand building product lifecycles. The capability costs a physical control interface and firmware discipline. Buyers who have been stranded once become extremely difficult to sell to afterwards. Proprietary control relocates the dependency rather than removing it, which buyers increasingly notice and ask about directly.
Market Impact: Raises specification win rates to 2.3 times higher

Sell Commercial Shading On Measured Cooling Reduction

Properly commissioned automated shading reduces measured cooling demand by around 18%, which is a payback a facilities manager can verify rather than a benefit an architect assumes. Manufacturers leading with energy performance rather than with smart building language report commercial win rates 3.1 times higher. The energy buyer holds a larger budget and decides faster than the design buyer does. Selling convenience into a cooling load problem reaches entirely the wrong person in the organisation. Commissioning has to be included rather than offered, because an uncommissioned system gets overridden and then disabled within weeks of handover.
Market Impact: Raises commercial win rates to 3.1 times higher

Certify Installers And Instrument The Motor

About 44% of warranty claims trace to installation rather than to product defect, which means manufacturers absorb cost and reputational damage for work they did not perform. Manufacturers running certification programmes and fitting motors that report abnormal current draw report warranty cost 2.8 times lower alongside far cleaner attribution. Self-diagnosis also converts a dispute into a documented fact. Mounting systems tolerant of out of square openings address the underlying cause rather than only the evidence. Instrumentation also identifies which installers need retraining rather than leaving a manufacturer to guess from claim patterns across a whole network.
Market Impact: Cuts warranty cost to 2.8 times lower overall

Who Controls the Margin Pool

Concentration is moderate. Five manufacturers hold 38% of category revenue, measured consistently on that basis across all participants, and the field divides between motorisation specialists supplying drives across the industry, integrated window covering manufacturers, building controls groups entering through automation, and Chinese producers increasingly selling finished systems rather than components. The leader to challenger gap is wide in commercial shading and narrow in residential retrofit.
Competition currently turns on three dimensions: retrofit engineering, which addresses the larger half of the market that incumbents largely conceded; control architecture independence, which decides whether an installed base survives a protocol change; and commissioning capability in commercial work, where an uncommissioned system gets disabled by occupants. Price decides in online retrofit, which is the fastest growing part of the market where incumbents hold the least share.

Pressure builds from two directions at once. Chinese manufacturers hold the motor cost base and are moving into finished systems. Purpose-built retrofit entrants have taken the fastest growing segment. Rankings will shift toward manufacturers holding retrofit capability and control independence rather than dealer network breadth. Manufacturers holding only dealer distribution face the most exposed position in the field, since the growth arrives elsewhere entirely.
automated-window-blinds-market-company-positioning-matrix-1790020300417

Competitive Moat and Risk Dimensions

SOMFY

Moat: Motorisation Depth And Installer Network

Drive and control engineering supplied across the industry combined with a trained installer network addresses both the technical and the installation halves of this market. That network is expensive to build, slow to replicate, and directly reduces the warranty attribution problem that damages competitors relying on general trades.
SOMFY

Risk: Dealer Model Misses Retrofit

A dealer and specification model reaches buyers who are already commissioning window coverings, while retrofit demand arrives through electronics and online channels from people who already have blinds. That segment grows fastest and the existing channel structure does not touch it at all. Building that channel means competing with its own dealers.
LUTRON ELECTRONICS

Moat: Control Architecture And Commercial Position

Control system depth and an established commercial building position give access to projects where commissioning quality decides whether the installation performs and survives occupant contact. Proprietary control also insulates the installed base from third party protocol discontinuation in a way platform-dependent competitors cannot match. Commissioning quality decides whether occupants leave it running.
LUTRON ELECTRONICS

Risk: Proprietary Control Cuts Both Ways

Proprietary architecture protects an installed base from third party obsolescence and makes the manufacturer the single point of dependency instead. Buyers increasingly ask what happens if the vendor changes direction, and the honest answer is the same stranding risk relocated rather than removed. Buyers increasingly ask that question during specification.

Players Tracked

Prominent Players

Somfy
Hunter Douglas
Lutron Electronics
Nice Group
Springs Window Fashions

Other Key Players

Coulisse
Rollease Acmeda
Vertilux
Legrand
Warema Renkhoff
Draper Inc
Ningbo Dooya Mechanic and Electronic Technology
Jiangsu Xinhai Electric
A-OK Motors
Zemismart
Wonderlabs
Inter IKEA Group
Serge Ferrari
Griesser
Schenker Storen

Recent Developments

FEBRUARY 2026

Somfy Launches Purpose-Built Retrofit Motorisation Range

Somfy introduced a retrofit motorisation range engineered for existing chain and cord blinds rather than derived from its factory-fitted products. Mounting tolerance for out of square openings was the stated design priority throughout. Distribution runs through electronics and online retail rather than through the dealer network.
Signal: Retrofit is finally being engineered rather than downgraded from new build. The channel matters as much as the engineering here.
SEPTEMBER 2025

Lutron Adds Local Control Fallback Independent Of Any Hub

Lutron Electronics introduced guaranteed local control operating without cloud or hub dependency across its motorised shading range. The capability addresses protocol support life running far shorter than the service life of a building product. A physical control interface is fitted on every unit in the range.
Signal: A fifteen year product bolted to a six year protocol is a solvable problem. Obsolescence is a design decision here.
MAY 2025

Nice Group Acquires Commercial Shading Commissioning Specialist

Nice Group completed an acquisition of a commissioning and solar position programming specialist for commercial shading. The transaction was an outright acquisition rather than a joint venture or minority stake, with installation performance cited as the rationale. Commissioning engineers transferred with the business under the agreed terms.
Signal: Uncommissioned systems get disabled by the people working under them. Commissioning is being bought because it cannot be sold optionally.

What An Automated Blind Costs

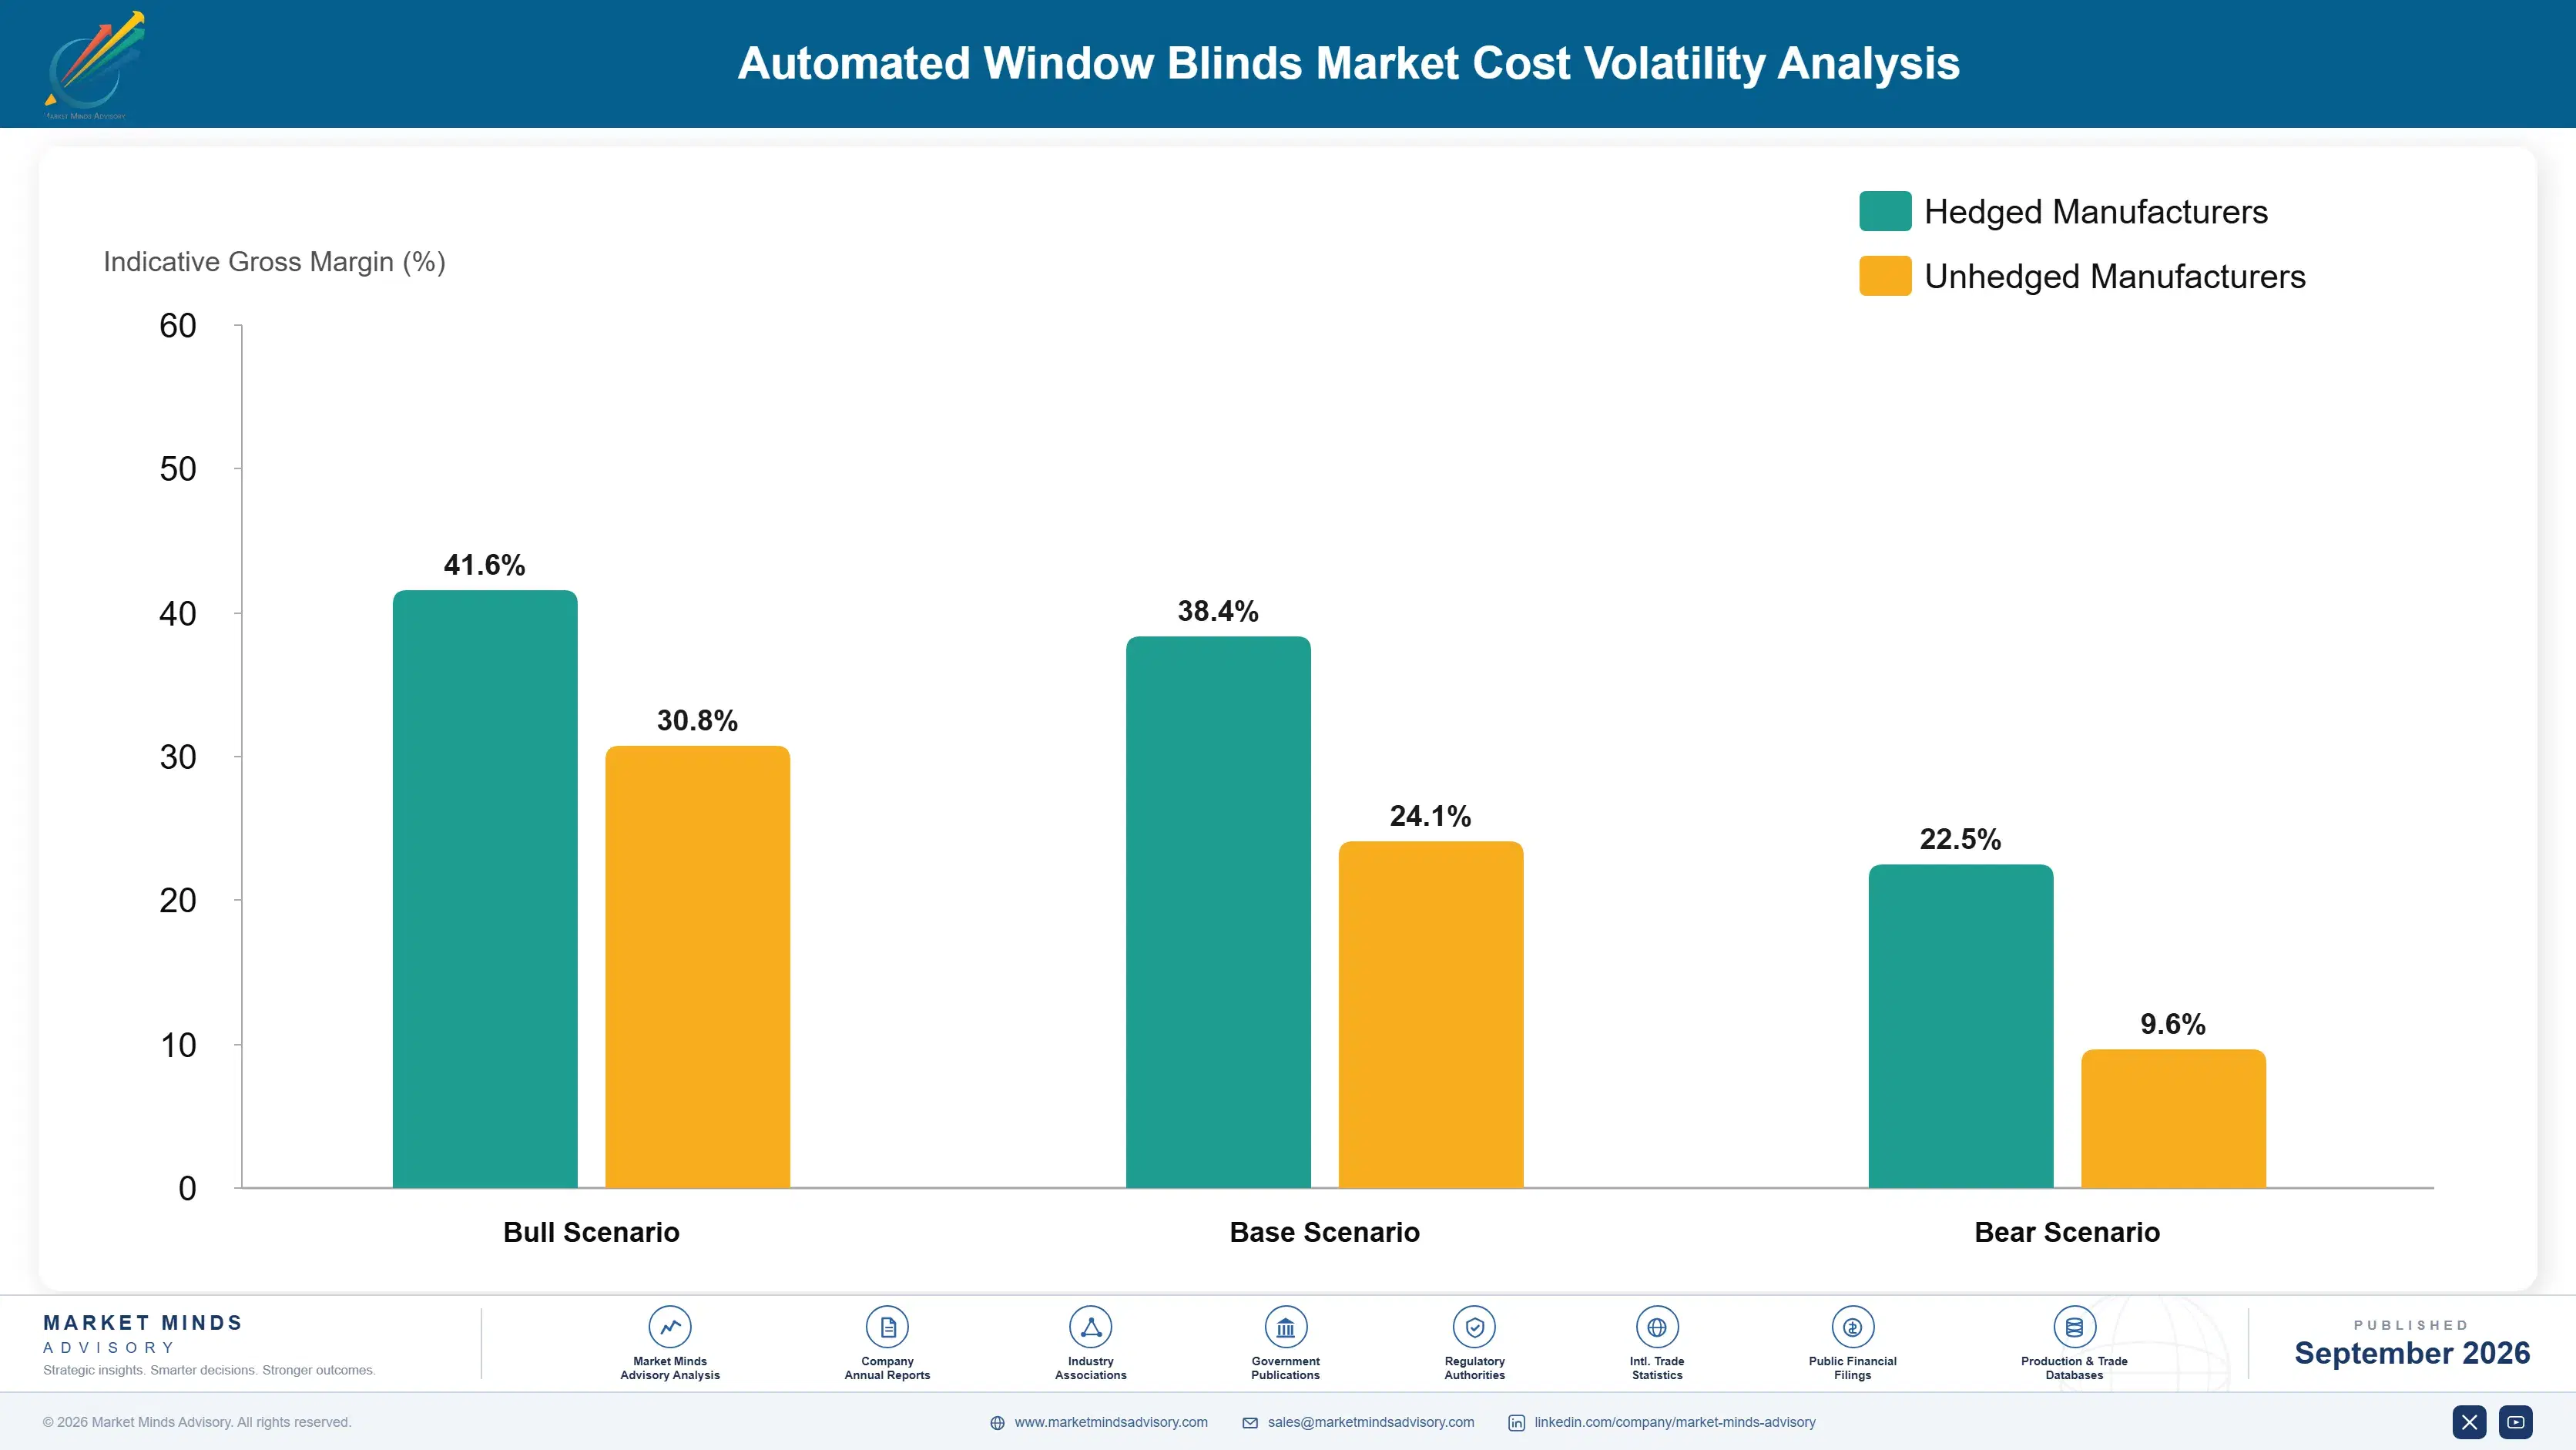
Three cost groups dominate. Tubular motor, drive, and control electronics run 34% to 42% of cost of goods sold, and the eight-point range separates instrumented self-diagnosing drives from basic units. Fabric, tube, brackets, and hardware take 26% to 34%, rising for commercial systems with wider spans. Battery and power systems account for 18% to 26%, and solar charging adds cost that larger blinds recover through fewer service visits.
Copper, aluminium, and lithium cell pricing moved through 2024 and 2025 on industrial demand and freight together, and United States Geological Survey mineral commodity summaries documented the metal movements. Several manufacturers described battery cell cost as the line that did not fall in their annual reports. Control electronics costs declined across the same window on volumes from unrelated connected device categories. The three exposures moved independently across the period.

The competitive disadvantage mechanism runs through warranty attribution rather than through component cost. A manufacturer absorbing installation-caused failures pays for work it did not perform, and around 44% of claims fall into that group. Exposure therefore varies by installer certification and motor instrumentation rather than by scale, and manufacturers selling through general trades carry it most heavily of anybody in the field.
automated-window-blinds-market-cost-volatility-analysis-1790020300614

Instrument Motors To Attribute Failures Correctly

A motor reporting abnormal current draw during commissioning converts a warranty dispute into a documented installation fault before the product ever fails. The electronics cost is trivial against the claims it reallocates, and it also lets a manufacturer identify which installers need retraining rather than guessing from claim patterns. Guessing from claim patterns across a network does not work.

Specify Control Electronics At Connected Device Volumes

Radio and control component costs are falling because unrelated connected device categories consume them at volumes window coverings never will approach. Specifying parts already at scale in those applications rather than commissioning bespoke modules captures a cost curve this industry contributes nothing to and can otherwise only watch. Bespoke modules forfeit a curve this industry does not drive.

Size Batteries To The Blind Not The Price Point

A battery sized to hit a retail price rather than to lift the blind it is fitted to produces short runtime, frequent service, and complaints recorded as product failure. Sizing to stated weight and cycle count costs more per unit and removes a support cost that recurs for the whole service life of the installation.

Portfolio Architecture for Margin Defence

Margin follows control independence and commissioning capability rather than motor specification. Basic battery retrofit kits compete close to commodity terms against Chinese finished systems. Residential integrated systems earn moderately on fabric and design. Commercial shading earns well where commissioning is included rather than optional, and systems guaranteeing local control independent of any platform earn most, because they remove the objection every experienced buyer now raises.
The tension between volume and premium runs through what the buyer is protecting against. A consumer buying a retrofit kit online is solving a convenience problem and comparing on price and app quality. A commercial specifier installing across a building is buying a fifteen year asset and asking what happens when the protocol changes, who commissions it, and who is liable when a motor burns out against a crooked bracket.

High-value pools concentrate in commercial systems sold with commissioning included, in control architectures guaranteeing hub-independent operation, and in purpose-built retrofit engineered for openings nobody measured. Where the product is a battery retrofit kit sold online on price and app screenshots, Chinese finished systems hold the cost position and there is very little else available to compete on.

Volume / Commodity-Adjacent

Basic battery retrofit kits and entry motorised shades sold online on price and application features. The ten-point range reflects motor sourcing and channel cost rather than any engineering a buyer could evaluate before installing it.
Gross Margin: 22% to 32%

Premium / Certified

Residential integrated systems and motorised curtain track sold through dealers with fabric selection and fitting included. The twelve-point range separates genuine installation capability from dealers assembling components with general trades doing the fitting.
Gross Margin: 38% to 50%

Sustainability / Regulatory / Next-Generation

Commercial shading with commissioning included, and systems guaranteeing local control independent of any external platform. The sixteen-point range reflects commissioning depth and control architecture, neither of which can be assembled quickly.
Gross Margin: 56% to 72%
automated-window-blinds-market-portfolio-architecture-1790020301117

High-value Sub-segments and Strategic Watch-out

Commissioned Commercial Shading Systems

Highest value in the category, sold on a measured cooling reduction near 18% that a facilities manager can verify against a bill. The sixteen-point range reflects commissioning capability, since an uncommissioned system gets disabled by occupants. Extension across a portfolio follows a successful first building.
Gross Margin: 58% to 74%

Hub-Independent Control Architectures

High value because they remove the obsolescence objection that every experienced building product buyer now raises. The fourteen-point range reflects firmware discipline and physical control provision rather than anything in the motor itself. Proprietary control merely relocates the dependency rather than removing it at all.
Gross Margin: 48% to 62%

Purpose-Built Retrofit Systems

Volume core addressing an installed base roughly 23 times larger than annual new construction can offer anybody. The twelve-point range reflects mounting tolerance engineering, which is harder than a factory-fitted product and sells for less. Purpose-built entrants took this growth while the incumbents watched it happen.
Gross Margin: 36% to 48%

Basic Online Battery Kits

The strategic watch-out. Chinese finished systems hold the cost base, battery claims are unqualified, and the app is the only differentiator on offer. The ten-point range reflects sourcing and channel position with nothing else defending it. App quality is a poor foundation for a fifteen year product.
Gross Margin: 20% to 30%

How This Demand Repeats

Residential demand repeats on protocol rather than on product. A motorised blind survives fifteen years mechanically and gets replaced when the platform running it stops working, which means the replacement cycle is set by somebody else's software roadmap rather than by wear. Manufacturers offering hub-independent control are lengthening that cycle deliberately, which reduces replacement revenue and improves retention considerably more. That is an unusual trade to make deliberately.
Commercial demand repeats on building cycles and on commissioning quality. A properly commissioned system stays in automatic operation for years and gets extended into further floors and further buildings within the same portfolio. An uncommissioned one gets manually overridden within weeks, disabled shortly afterwards, and never generates a second order from that customer regardless of how good the hardware was. Portfolio extension is where the commercial money actually sits.

The buyer is shifting from architects and interior specifiers toward facilities and energy managers as cooling load requirements tighten. That buyer asks for measured performance, commissioning scope, and lifecycle support rather than fabric samples, and holds a considerably larger budget. Manufacturers organised around design specification reach very few of them and are selling convenience into an energy conversation.
automated-window-blinds-market-end-use-penetration-index-1790020301610

Where This Market Rewards

These are among the four positions where our research anticipates prominent divergence between winners and laggards over the coming forecast period. Each is grounded in the demand model, the regulatory perimeter, and the announced capacity pipeline.
01 / RETROFIT ENGINEERING INVESTMENT

Twenty-three times more windows exist

Existing window openings outnumber annual new build installations by roughly 23 to one, and retrofit kits grow at 13.8% while carrying the thinnest margins anywhere in this category. Manufacturers engineering purpose-built retrofit systems rather than downgrading factory products report share capture 2.7 times greater in the segment. The engineering is harder than a standard motorised blind and the price is lower, which is exactly why incumbents conceded it, and the channel is different too, running through electronics retail rather than covering dealers.
02 / CONTROL INDEPENDENCE GUARANTEE

Fifteen year motor, six year protocol

Home automation protocols hold support for a median of about six years while a motorised blind is a building product lasting fifteen or more years mechanically. Manufacturers offering local control fallback independent of cloud or hub dependency report specification wins 2.3 times higher with commercial buyers who understand building product lifecycles. Buyers who have been stranded once by a discontinued platform become extremely difficult to sell anything to afterwards, and proprietary control merely relocates the dependency rather than removing it for anybody.
03 / COOLING PERFORMANCE SELLING

Eighteen per cent, verifiable, unspoken

Properly commissioned automated shading reduces measured cooling demand by around 18%, which is a payback a facilities manager can verify against an energy bill rather than a benefit an architect assumes. Manufacturers leading with energy performance rather than smart building language report commercial win rates 3.1 times higher than the field. The energy buyer holds a larger budget and decides faster than the design buyer ever does, and commissioning has to be included rather than offered, or occupants disable the system.
04 / INSTALLATION ATTRIBUTION CONTROL

Forty-four per cent is the installer

About 44% of warranty claims trace to installation rather than to product defect, which means manufacturers absorb cost and reputational damage for work performed by somebody else entirely. Manufacturers running certification programmes and fitting motors that report abnormal current draw report warranty cost 2.8 times lower alongside far cleaner attribution. Self-diagnosis converts a dispute into a documented fact before the product has actually failed, and instrumentation also identifies precisely which installers need retraining rather than leaving it to guesswork across a network.

Engagement Snapshot From the Field

A live engagement with an industry participant carrying material or product regulatory and market exposure ahead of a defining policy shift, showing how our research translates into a defensible multi-year portfolio strategy.
MARKET MINDS ADVISORY · CLIENT ENGAGEMENT SUMMARY
Automated Window Blinds Producer Strategic Portfolio Review and Transition Roadmap 2026·Investment Scenario on Automated Window Blinds Exposure Evaluation 2025-26
CLIENT PROFILE
A window covering manufacturer with motorised product revenue near USD 148 million (client-reported, unverified by MMA) across North America and Western Europe. Motorised revenue was growing well below the category rate while warranty cost had risen for three consecutive years, and management had proposed extending the dealer network further. Warranty claims had never been inspected at root cause.
STRATEGIC CHALLENGE
The dealer network reached buyers already commissioning new window coverings, which is the smaller half of the market, and nobody had assessed the retrofit demand arriving through channels the business did not serve. Warranty claims were being absorbed without any attribution analysis at all. Growth below the category rate was read as a share problem.
MMA APPROACH
MMA sized retrofit against new build demand in the client's markets, analysed warranty claims by root cause through returned unit inspection, tested the client's products against purpose-built retrofit competitors, and modelled dealer expansion against retrofit engineering and installer certification. Returned units were inspected rather than assessed from claim descriptions, so attribution rested on evidence rather than on whatever the installer had reported.
KEY FINDINGS
  1. Retrofit demand in the client's own markets exceeded new build installation demand by a wide margin, and the business sold nothing that could be fitted to an existing blind.
  2. Inspection attributed a large majority of warranty claims to installation faults, principally motors drawing continuous current against misaligned brackets rather than any component defect.
  3. Purpose-built retrofit competitors were winning on mounting tolerance rather than on motor quality, which the client's factory-derived products could not match at all.
  4. Commercial customers surveyed raised protocol obsolescence unprompted, and no product in the range offered control that worked without the manufacturer's hub. Nobody had been asked before.
CLIENT PROFILE
A window covering manufacturer with motorised product revenue near USD 148 million (client-reported, unverified by MMA) across North America and Western Europe. Motorised revenue was growing well below the category rate while warranty cost had risen for three consecutive years, and management had proposed extending the dealer network further. Warranty claims had never been inspected at root cause.
STRATEGIC CHALLENGE
The dealer network reached buyers already commissioning new window coverings, which is the smaller half of the market, and nobody had assessed the retrofit demand arriving through channels the business did not serve. Warranty claims were being absorbed without any attribution analysis at all. Growth below the category rate was read as a share problem.
MMA APPROACH
MMA sized retrofit against new build demand in the client's markets, analysed warranty claims by root cause through returned unit inspection, tested the client's products against purpose-built retrofit competitors, and modelled dealer expansion against retrofit engineering and installer certification. Returned units were inspected rather than assessed from claim descriptions, so attribution rested on evidence rather than on whatever the installer had reported.
KEY FINDINGS
  1. Retrofit demand in the client's own markets exceeded new build installation demand by a wide margin, and the business sold nothing that could be fitted to an existing blind.
  2. Inspection attributed a large majority of warranty claims to installation faults, principally motors drawing continuous current against misaligned brackets rather than any component defect.
  3. Purpose-built retrofit competitors were winning on mounting tolerance rather than on motor quality, which the client's factory-derived products could not match at all.
  4. Commercial customers surveyed raised protocol obsolescence unprompted, and no product in the range offered control that worked without the manufacturer's hub. Nobody had been asked before.
RECOMMENDED STRATEGY
Phase 1: Phase one: halt dealer expansion and develop a purpose-built retrofit range engineered for out of square openings and existing chain systems. Phase 2: Phase two: certify installers and fit current-monitoring motors so warranty attribution becomes documented rather than disputed. Report attribution to the network quarterly. Phase 3: Phase three: add guaranteed local control operating without any hub dependency across the commercial range. Fit a physical control interface on every unit.
OUTCOME
Warranty cost fell by roughly a third within three quarters of the instrumented motors shipping (client-reported, unverified by MMA). The retrofit range reached profitability in its first year. Dealer expansion was not resumed. Commercial specification wins improved after local control shipped. Attribution disputes with installers fell sharply.

Frequently Asked Questions

Foundational context covering the market sizes, CAGR, scope, country, region and competition that inform every finding below. This section is provided to cover basics and most often pre-purchase conversations, answered from the MMA Primary Research Dataset.

What is the current size of the Automated Window Blinds Market?

The market was worth USD 3.4 billion in 2025 and stands at USD 3.7 billion in 2026. Value covers motorised and automated interior window covering systems at manufacturer selling price.

How large will the Automated Window Blinds Market be by 2036?

MMA forecasts USD 8.9 billion by 2036, an increase of USD 5.2 billion across the forecast period. That represents 2.41 times the 2026 base of USD 3.7 billion.

What is the CAGR for the Automated Window Blinds Market 2026 to 2036?

The base case compound annual growth rate is 9.2%, with a bull case at 10.5% and a bear case at 7.9%. Historical growth from 2020 to 2025 ran at 8.0%.

Which segment is growing fastest?

Retrofit motorisation kits grow at 13.8%, half again the market rate of 9.2%. Existing window openings outnumber annual new build installations by roughly twenty-three to one.

Who are the major companies in the Automated Window Blinds Market?

Somfy, Hunter Douglas, Lutron Electronics, Nice Group and Springs Window Fashions lead the field. Together they hold 38% of category revenue, with Chinese producers now selling finished systems.

Which country is growing fastest?

China grows at 14.8%, as tubular motor manufacture and domestic smart home adoption expand together. The region produces nearly all of the world's motors and drives.

Report Segmentation Architecture

The full report scope spans multiple orthogonal segmentation dimensions, with cross-tabulated demand data provided for each dimension pair. Coverage extends further to regional breakdowns, trend trajectories, and the competitive detail needed to support segment-level decision-making.

By System Architecture

  • Battery-Powered Motorised Shades
  • Hardwired AC Motorised Systems
  • Solar-Charged Motorised Blinds
  • Motorised Curtain and Drapery Track Systems
  • Retrofit Motorisation Kits
  • Commercial Automated Shading Systems

By End-Use Industry

  • Single Family Residential
  • Multifamily and Apartment Construction
  • Commercial Office Buildings
  • Hospitality and Leisure Facilities
  • Healthcare and Education Buildings
  • Retail and Public Spaces

By Commercial Dimension

  • Window Covering Dealer Networks
  • Architectural Specification Channel
  • Direct to Consumer Online
  • Electronics and Home Improvement Retail
  • Commercial Contractor Supply
  • Facilities Management Service Contracts

By Region

  • East Asia
  • North America
  • Western Europe
  • South Asia and Pacific
  • Latin America
  • Middle East and Africa
  • Eastern Europe

Scope, Methodology, and Coverage

Every figure in this report is reproducible from documented input assumptions. The scope below maps the historical period, the forecast horizon, the segmentation dimensions, and the countries covered, alongside the underlying primary and qualitative methodology.
Historical Period
2020 to 2025
Forecast Period
2026 to 2036
Base Year
2025 (USD billions; MMA Primary Research Dataset, September 2026)
Market Definition
This market covers motorised and automated interior window covering systems, across battery-powered motorised shades, hardwired AC motorised systems, solar-charged motorised blinds, motorised curtain and drapery track systems, retrofit motorisation kits for existing blinds, and commercial automated shading systems. It excludes manual window coverings, exterior awnings and shutters, architectural and electrochromic glazing, non-motorised curtain track, and building management software sold separately.
Quantitative Units
USD billions, revenue at manufacturer selling price
Segmentation Dimensions
System architecture, building type, commercial dimension, region
Regions Covered
East Asia, North America, Western Europe, South Asia and Pacific, Latin America, Middle East and Africa, Eastern Europe
Countries Covered
China, Japan, South Korea, Taiwan, United States, Canada, Mexico, Germany, France, Switzerland, United Kingdom, Netherlands, Italy, Spain, Sweden, Poland, Czechia, India, Indonesia, Thailand, Vietnam, Australia, Brazil, Argentina, Colombia, Chile, Saudi Arabia, United Arab Emirates, Qatar, South Africa
Key Companies Profiled
Somfy, Hunter Douglas, Lutron Electronics, Nice Group, Springs Window Fashions, Coulisse, Rollease Acmeda, Vertilux, Legrand, Warema Renkhoff, Draper Inc, Ningbo Dooya Mechanic and Electronic Technology, Jiangsu Xinhai Electric, A-OK Motors, Zemismart, Wonderlabs, Inter IKEA Group, Serge Ferrari, Griesser, Schenker Storen
Quantitative Methodology
Primary survey, n=3,800 respondents, Q4 2025, six countries; demand-side model with trade association cross-validation
Qualitative Methodology
47 expert interviews, Q4 2025; applied to validate demand model assumptions, identify emerging dynamics, and assess competitive positioning
Report Format
PDF and XLSX data workbook (Word format preview document)
Publisher
Market Minds Advisory
Report Code
MMA-2026-CON-701
Published
September 2026
Contact
sales@marketmindsadvisory.com | www.marketmindsadvisory.com

Purchase the full Automated Window Blinds Market Report (2026 to 2036).

The full report sizes the automated window blinds market across six system architectures, seven regions, and thirty countries, with forecasts to 2036 under base, bull, and bear cases. It compares retrofit addressable demand against new build installation, measures protocol support life against product service life, and quantifies the cooling load reduction commercial shading actually delivers. Competitive analysis covers twenty participants evaluated consistently on category revenue, with detailed treatment of retrofit engineering and control architecture independence. Warranty attribution and commissioning practice are analysed throughout. Primary research includes 3,800 survey responses and 47 expert interviews.
Six system architectures sized and forecast separately
Twenty participants evaluated on category revenue consistently
Retrofit addressable demand compared against new build installation
Protocol support life measured against product service life
Cooling load reduction quantified from commissioned installations
Warranty claims attributed between installation and product defect

Built For The People Who Decide

From boardroom strategy to bench-side execution, this report is read cover-to-cover by leaders shaping the next decade of their industry, turning demand scenarios, market dynamics and valuation benchmarks into decisions.
CXOs/ Presidents/ VPs/ Managers
M&A and Corporate Development
Strategy Teams and R&D Heads
Procurement and Product Directors
Regulatory and Compliance Leaders
Investor Relations and Equity Analysts