Market Minds Advisory
Automated Parcel Delivery Terminals Market

Automated Parcel Delivery Terminals Market: Utilisation Decides Everything, And It Is Low

Networks keep being counted in terminals installed, when the number that actually matters is compartments used. Average utilisation sits near a third, and carrier exclusivity is very largely the reason why.

Lead Analyst

David Horsley

Published

September 2026

Make Smarter Decisions with Customized Research Insights

Request a free sample report and evaluate market opportunities, growth trends, and competitive dynamics relevant to your business needs.

2025 MARKET VALUE$1.8BMarket Size 2025
2036 FORECAST VALUE$5.5BBase Case , 2026 to 2036
CAGR 2026 TO 203610.6 %Bull 11.9% / Bear 9.3%
INCREMENTAL OPPORTUNITY$3.5BNet 10- year value creation
EXPANSION MULTIPLE2.74x2036 value over 2026 base
Strategic Levers
M&A Pipeline
Regional Outlook
Country Rankings
Competitive Intelligence
Segmental Deep-dive
Call-Us : 91 93563 13602

Executive Snapshot and Market Trajectory

Everybody counts terminals installed. The number that decides whether a network makes any money at all is compartments actually occupied, and that sits near 34% across most deployments. The market reaches USD 1.8 billion in 2025 and compounds at 10.6% across the forecast period.
Temperature-controlled terminals grow fastest at 15.8%, roughly 1.49 times the market rate, as grocery and pharmacy fulfilment pushes into a channel that was built for dry goods. East Asia holds 36% of value, well above the band this framework applies, because Chinese locker networks are larger than every other market in the world combined. Eastern Europe takes 9%, also above band, on Polish density no other country approaches.
Concentration sits at 41% across the top five, split between European engineering specialists and Chinese volume manufacturers who price their hardware very differently indeed. Competition turns on cost per compartment, on software able to handle several carriers at once, and on the quality of the siting decisions behind each unit. The commercial problem is that the carriers each build their own separate network, which effectively guarantees the low utilisation that everybody complains about.
Market Definition
The automated parcel delivery terminals market covers unattended self-service lockers and terminals for parcel handover, collection, and returns, spanning outdoor standalone, indoor retail-sited, residential building, temperature-controlled, and mobile relocatable configurations, together with the access control, network software, and maintenance contracts supplied with them. Staffed parcel shops, warehouse automation and sortation, vending machines, left-luggage lockers, and the parcel delivery services themselves are excluded.
Base Year Value
$1.8B in 2025 (MMA Primary Research Dataset, August 2026)
Forecast Period
2026 to 2036, eleven discrete annual values
CAGR
10.6% base case. Bull 11.9%. Bear 9.3%.
Fastest Growth Segment
Temperature-Controlled Terminals: 15.8% CAGR
Fastest Growth Country
India: 14.2% CAGR
Fastest Growth Region
South Asia and Pacific: 12.8% CAGR
Largest Region
East Asia: 36% of 2025 global value
Market Leaders
KEBA, Cleveron, Quadient, Bell and Howell, Zhilai Technology. Source: MMA Primary Research Dataset, July 2026.
Primary Survey
n=3,800 procurement and R&D decision-makers, Q4 2025, six countries
Methodology
Demand-side build-up, cross-validated against public data, 47 expert interviews

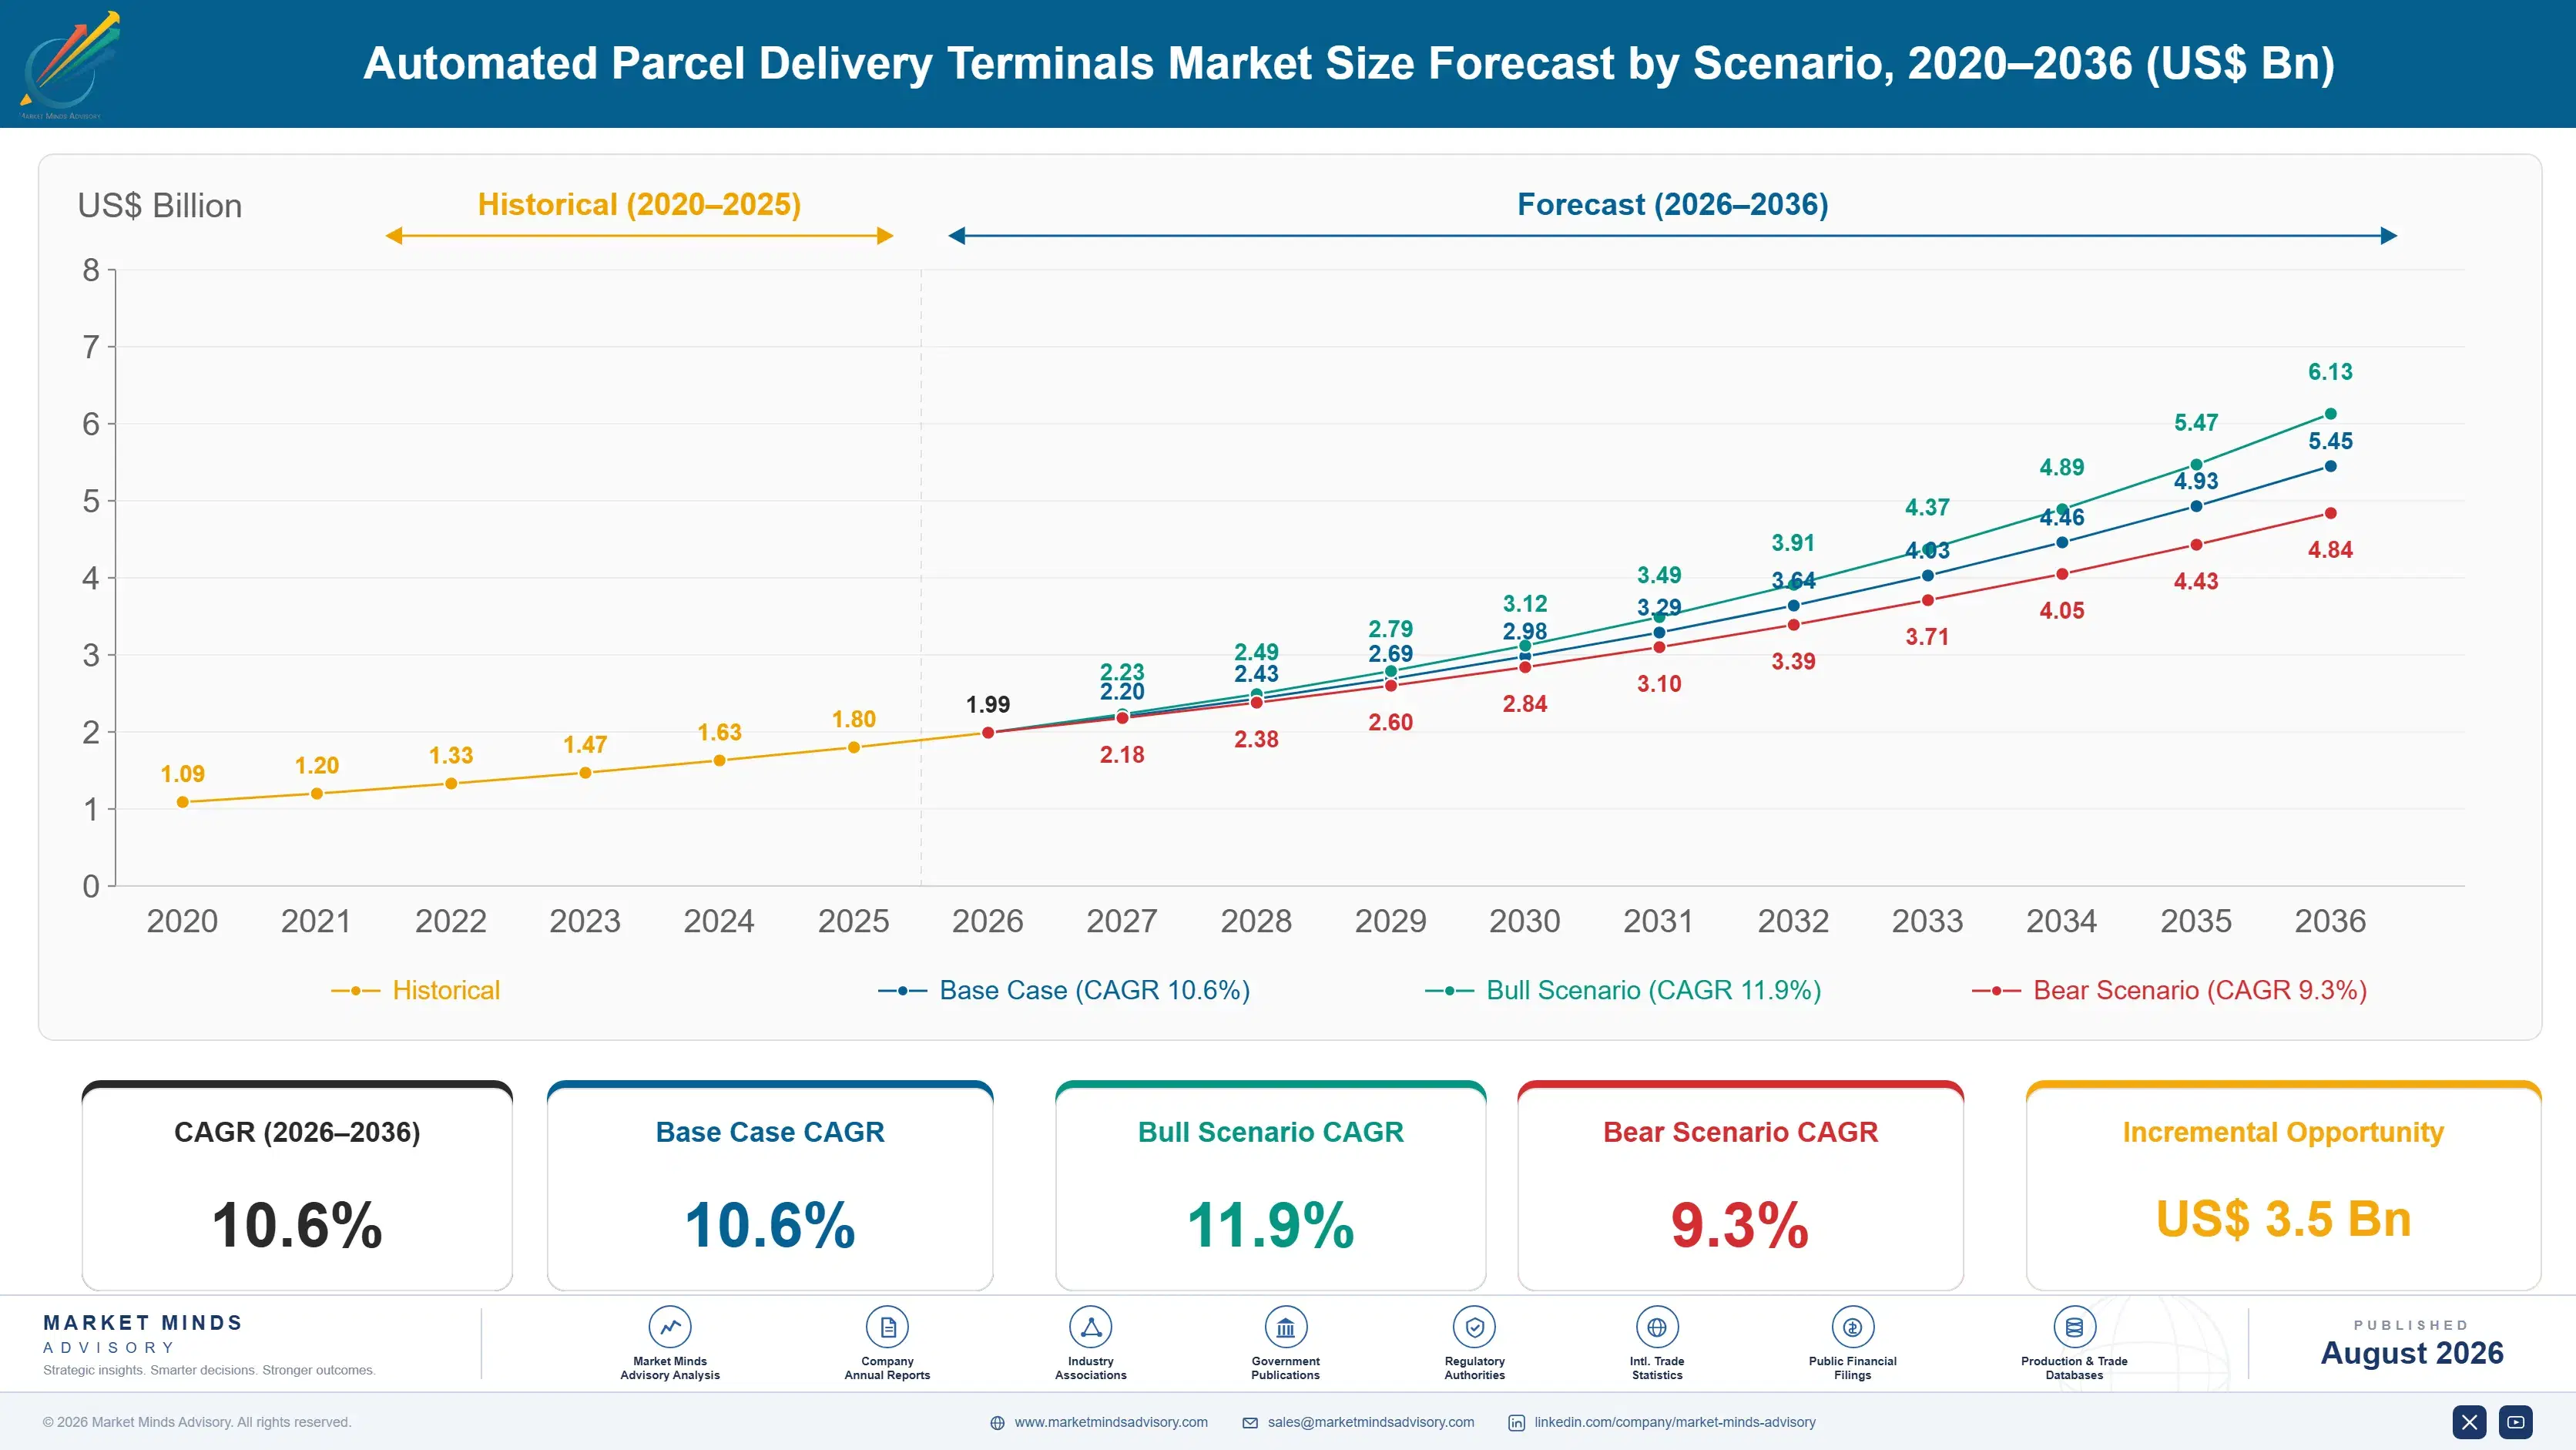
Automated Parcel Delivery Terminals Market Forecast Scenarios

automated-parcel-delivery-terminals-market-size-forecast-scenario-1787333414596
Between 2020 and 2025 the market grew fast and learned an expensive lesson. Pandemic parcel volumes justified aggressive deployment, and networks expanded on the assumption that a terminal anywhere would fill. Many did not, and several operators wrote down or relocated significant estates from 2023 onward. A 9.4% historical CAGR conceals a build-out phase followed by a more disciplined one focused on siting.
Three mechanisms carry the 10.6% base case. Returns volume is the largest, since a locker handles a return without any staff time and retailers are pushing hard to move returns out of stores. Grocery and pharmacy fulfilment is the second, requiring temperature-controlled compartments that command far higher prices. And failed first delivery costs keep rising with driver wages, which is what makes a terminal cheaper than a second attempt. Terminals win that comparison every year wages rise.
The 11.9% bull case depends on carrier-agnostic open networks reaching scale, which would fix the utilisation problem and make deployment economics work in locations that currently cannot justify a terminal. The 9.3% bear case is continued carrier exclusivity, which caps utilisation near current levels and limits deployment to the dense urban sites where even a third-full locker still pays.

Counting Terminals Instead Of Counting Parcels

A parcel locker is a simple thing sold into a complicated economic problem. The hardware costs around USD 420 per compartment installed, it lasts a decade, and it removes the single most expensive event in last-mile delivery, which is a driver arriving at a door with nobody behind it. On that arithmetic every terminal ought to pay for itself quickly enough.
TOP FIVE CONCENTRATION41%Manufacturing splits between European specialists and Chinese volume producers
COMPARTMENT UTILISATION34%Share of locker doors occupied at any given moment
COST PER COMPARTMENTUSD 420Installed hardware cost for each individual locker door
FAILED DELIVERY RATE3%Parcels needing a second attempt after terminal deposit fails
TERMINAL PAYBACK PERIOD4 yearsYears before a deployed unit recovers its full installed cost
CARRIER-AGNOSTIC SHARE28%Terminals open to more than one delivery operator today
Most of them do not, because they are not full. Average compartment utilisation across deployed networks runs near 34%, which means two thirds of the capital is sitting idle at any given moment. Siting explains part of it, since operators expanded very fast during the pandemic into locations that never developed the footfall originally assumed in the business case.
The larger cause is that carriers each build their own network. A parcel from one operator cannot go into another operator's locker, so a street with four terminals ends up with four separately underused estates rather than one well-used one. Everybody understands this. Nobody wants to hand a competitor the collection relationship, which is why open networks keep being announced and rarely reach any scale.
"The industry measures itself in terminals installed, which is the one metric that flatters everyone and tells you nothing. Show me compartments turned per week and I will tell you which networks survive the next funding round."
Director, Last Mile Logistics Practice · MMA Technology Practice ·<

Market Trends

Returns Traffic Overtakes Outbound As Primary Driver

Retailers have been pushing returns out of stores and away from staffed counters, and a locker handles a return with no labour at all beyond the periodic collection. Apparel and footwear return rates run high enough that returns now generate a substantial share of terminal throughput in mature markets, and in several networks they exceed outbound deliveries. That changes siting logic, because a returns-heavy terminal needs to be where shoppers already are rather than where they live. It also improves utilisation, since returns cycle faster than collections do. Networks weighted toward returns show noticeably better economics.
Market Impact: Locker delivery costs 40% less

Temperature Control Opens Grocery And Pharmacy Volume

Chilled and ambient-separated compartments let a terminal handle grocery orders, meal kits, and dispensed medicines, all of which were previously excluded from a channel built for dry goods. The hardware costs considerably more per compartment and consumes power continuously, so utilisation matters even more than it does elsewhere. Pharmacy dispensing in particular suits the format, since collection is time-critical and identity verification is already built into the access control. This is the fastest-growing part of the market at 15.8% and the only segment where terminals command genuine price premiums. Nothing else here supports a premium at all.
Market Impact: Compartment cost fell 35 percent

Market Opportunities and Growth Drivers

Driver Wage Inflation Makes Doorstep Attempts Expensive

The cost of a delivery attempt is mostly driver time, and wages across developed markets have risen faster than parcel prices for several years. A failed first attempt doubles that cost immediately, and in residential areas failure rates on doorstep delivery remain stubbornly high. A locker converts many stops into one, and the parcel waits without anybody being paid to hold it. That arithmetic improves every year wages rise, which is why carriers keep deploying even where utilisation disappoints them. Utilisation is the only thing standing against that logic. Wages are not going back down.
Market Impact: Utilisation stuck near 34%

Chinese Network Scale Drives Hardware Cost Down Globally

Chinese locker operators run networks numbering in the hundreds of thousands of units, and the manufacturing base built to supply them produces at costs European makers cannot match on hardware alone. Those units now reach Southeast Asia, the Middle East, and Latin America at prices that make deployment viable in markets where European equipment never would have been. Cost per compartment has fallen substantially over five years as a direct result. European manufacturers have responded by competing on software, integration, and serviceability instead. Hardware price is no longer the barrier it once was.
Market Impact: Site negotiation takes 9 months

Market Restraints and Challenges

Carrier Exclusivity Guarantees Low Compartment Utilisation

Each major carrier builds and operates its own terminal estate, so a parcel from one cannot be deposited in another's locker even when it stands empty on the same street. The root cause is commercial rather than technical: the collection moment is a customer touchpoint nobody will share with a competitor. Commercially this locks average utilisation near 34% and confines deployment to dense sites where even a third-full terminal pays. Participants are mitigating through neutral third-party networks, retailer-owned open estates, and software that lets one terminal serve several carriers under separate branding.
Market Impact: Returns exceed 30% of throughput

Siting Rights Are Slow, Fragmented, And Expensive

A terminal needs a location with footfall, power, permission, and often planning consent, and every one of those is negotiated separately with a different party. The root cause is that nobody owns the pavement in a way that makes this simple, and retail landlords increasingly understand what the space is worth. Commercially it slows rollout, raises site costs annually, and makes network expansion far less predictable than the hardware supply chain. Mitigation runs toward framework agreements with retail chains and fuel forecourts, relocatable units, and revenue-share models that lower the landlord's risk.
Market Impact: Chilled units cost 3 times more
2 additional market trends, 3 additional growth drivers, and 4 additional restraints and challenges are covered in the full report. Contact sales@marketmindsadvisory.com to access the complete intelligence.

Segment CAGR and Growth Architecture

Segmentation follows terminal configuration, because the physical form of the unit decides which siting options are available, the installed cost per compartment, the goods a given unit can accept, and who ends up paying for the thing. Ownership model, carrier relationship, and end-use are handled in the framework and commentary rather than as segments here.
automated-parcel-delivery-terminals-market-market-share-analysis-1787333415130

Temperature-Controlled Terminals

Temperature-controlled terminals grow fastest at 15.8%, roughly 1.49 times the market rate, and they are the only configuration commanding a genuine price premium. Chilled and ambient-separated compartments let a locker accept grocery orders, meal kits, and dispensed medicines that a standard unit cannot handle at all. Hardware costs around three times a dry compartment and draws power continuously, so poor utilisation hurts far more here than elsewhere. Pharmacy dispensing suits the format particularly well, since collection is time-critical and identity verification already sits inside the access control. Grocery retailers are the more aggressive deployers of the two. Utilisation matters more here than anywhere else in the market, because the power bill runs whether or not the compartment is full.
CAGR 15.8%

Outdoor Standalone Terminals

Outdoor standalone units grow at 12.4% and remain the backbone of every large network, because they can be sited without negotiating access to somebody's building and they operate around the clock. Weather sealing, vandal resistance, and independent power or connectivity all raise cost against an indoor unit, and planning consent is frequently required. What justifies that is availability: a collection at eleven at night is possible only from a terminal that needs nobody to open the building. Polish and Chinese networks are built overwhelmingly on this configuration, and it is the format most commonly chosen when a carrier is building density rather than convenience. Planning consent remains the slowest part of every rollout.
CAGR 12.4%
Full segment breakdown across 7 segments available in the complete report.

Regional Architecture and Country Demand Map

Regional shares here track locker network density rather than parcel volume or overall population size. Deployment has concentrated wherever apartment living, high parcel volumes, and a carrier willing to fund the infrastructure all happen to coincide together, and that particular combination is very unevenly distributed.

East Asia

East Asia takes 36% of value against a 30% ceiling in this framework, and Chinese network scale explains the entire breach. Chinese operators run locker estates numbering in the hundreds of thousands of units, larger than every other market in the world combined, deployed into an apartment housing stock that suits the format better than detached suburbs ever will. Domestic manufacturers supply almost all of that hardware at costs European producers cannot approach. Japanese and Korean networks are smaller but very densely sited around transit stations and convenience stores. Growth at 11.2% exceeds the global rate on continued Chinese densification and on export volume. Density in the largest cities is close to saturation already.
Share: 36% | CAGR: 11.2% (2026 to 2036)

Eastern Europe

Eastern Europe holds 9% of value against a 5% ceiling, and one country accounts for most of it. Poland has the highest parcel locker density anywhere in the world, built by an operator that made lockers the default delivery option rather than an alternative to the door, and Polish consumers now choose them for the majority of e-commerce parcels. Czech, Slovak, Baltic, and Romanian networks have followed the same pattern at smaller scale. Hardware is sourced from both European specialists and Chinese suppliers. Growth at 9.4% trails the global rate simply because Polish density is already close to saturation. No other region has made lockers the default rather than the alternative.
Share: 9% | CAGR: 9.4% (2026 to 2036)
Regional intelligence for 5 additional markets available in the complete report: Western Europe, North America, South Asia and Pacific, Latin America, Middle East and Africa. Contact sales@marketmindsadvisory.com.
automated-parcel-delivery-terminals-market-country-cagr-analysis-1787333415661

Where Terminal Suppliers Actually Make Money

Hardware margin on a locker is thin and Chinese manufacturing will keep it that way permanently. What earns money is the software that lets one terminal serve several carriers, the service contract running across a decade of outdoor operation, and selling temperature-controlled compartments to buyers who have no cheaper way of solving their problem.

Licence The Multi-Carrier Access Software Layer

Carrier exclusivity holds utilisation near 34%, and the only thing that fixes it is software allowing one physical terminal to serve several operators under separate branding and separate access rules. Licensing that layer annually rather than bundling it with hardware creates recurring revenue worth 8% to 14% of installed value each year at software margins. It also makes the supplier's terminals the ones a neutral network operator will buy, because nobody wants to run four incompatible management systems across a single estate. Almost nobody has built this properly yet. First mover advantage here is real.
Market Impact: Software licences yield 8 to 14 per

Contract Service Across A Decade Outdoors

An outdoor terminal lives ten years in weather, gets vandalised, and depends on connectivity and power that fail unpredictably, yet most suppliers sell the box and walk away. Full service agreements covering uptime, cleaning, and component replacement recover 9% to 15% of installed value annually at margins well above the hardware itself. Operators accept it because a terminal out of service is worse commercially than no terminal at all, since customers who find a broken locker stop choosing the channel entirely. A dead terminal costs more than the repair ever would.
Market Impact: Service recovers 9 to 15 percent of

Push Refrigerated Compartments Into Pharmacy Dispensing

A chilled compartment costs roughly three times a dry one and sells to buyers with no cheaper alternative, which is a rare combination in this market. Pharmacy dispensing fits particularly well because collection is time-critical, identity verification is already built into the access control, and the regulatory requirement for temperature records is easily satisfied by hardware that logs continuously. Grocery is the larger volume opportunity and pharmacy the better margin one. Both grow at 15.8% against a market at 10.6%. Neither buyer has a cheaper alternative available to them. Pricing power is the difference.
Market Impact: Chilled compartments cost 3 times a

Who Controls the Margin Pool

Concentration sits at 41% across the top five measured on terminal supply revenue, and the field divides on cost structure rather than on capability. KEBA and Cleveron lead among European specialists on engineering, software depth, and serviceability, selling into networks that value uptime over unit price. Zhilai and other Chinese manufacturers supply enormous domestic volume at costs European makers cannot reach. Quadient and Bell and Howell sit closer to the retail and residential end.
Competition currently turns on three things. Cost per compartment, which the Chinese manufacturers win outright wherever hardware is the deciding factor. Software able to handle multiple carriers, which almost nobody has built properly and which is where the utilisation problem gets solved. And service coverage, because an outdoor terminal that stops working destroys the customer habit the whole channel depends on.

Pressure is coming from network operators who have started specifying or building their own hardware once their estates reach a scale that justifies it. Chinese manufacturers are also moving into Southeast Asia, the Middle East, and Latin America at prices that foreclose European entry. Rankings will shift toward suppliers owning the software and service layer rather than the sheet metal around it.
automated-parcel-delivery-terminals-market-company-positioning-matrix-1787333416184

Competitive Moat and Risk Dimensions

KEBA

Moat: Engineering depth and network software

KEBA builds terminals with the industrial automation discipline of its wider business and pairs them with management software handling multi-carrier access, which very few competitors have built properly. For an operator running thousands of units across weather and vandalism, reliability engineering and remote diagnostics matter far more than the price of the box, and that is where KEBA sells.
KEBA

Risk: Hardware cost against Chinese supply

Manufacturing in Europe against Chinese producers supplying at a fraction of the cost is a permanent disadvantage wherever hardware price decides the tender, and that is most of the emerging deployment outside Europe. As Chinese suppliers improve software and serviceability, the ground on which KEBA differentiates narrows toward markets that are already close to saturation.
CLEVERON

Moat: Robotic and high-density formats

Cleveron built its position on robotic parcel handling and high-density formats that fit far more parcels into a given footprint than a conventional locker bank does, which matters enormously where retail floor space or pavement width is the binding constraint. Retailers with expensive square metres value that directly, and it is a genuinely difficult format to copy quickly.
CLEVERON

Risk: Complexity raises service exposure

Robotic mechanisms have more to go wrong than a bank of doors with electronic locks, and every failure mode is one a conventional locker simply does not have. Operators counting uptime across thousands of units weigh that heavily, and it constrains Cleveron in exactly the large outdoor estates where volume deployment happens most quickly.

Players Tracked

Prominent Players

KEBA
Cleveron
Quadient
Bell and Howell
Zhilai Technology

Other Key Players

Winnsen Industrial
TZ Limited
Luxer One
American Locker
Smiota
Vlocker
Snaile
Variocube
LockTec
Bloq.it
Hive Box
Shanghai Fuyou Intelligent Technology
Zhongyou Zhidi
Package Nexus
Gantner Electronic

Recent Developments

MAY 2025

Neutral network operator launched multi-carrier estate in Europe

A neutral operator launched a locker estate open to several carriers simultaneously, using access software that keeps each carrier's parcels and branding fully separate within one physical terminal. The proposition targets the utilisation problem that carrier-exclusive networks have never been able to solve for themselves.
Signal: Open networks address utilisation directly
OCTOBER 2024

Pharmacy chain deployed temperature-controlled dispensing terminals

A pharmacy chain deployed temperature-controlled terminals for prescription collection, using the identity verification already present in the access control and continuous temperature logging to satisfy the regulatory record-keeping requirement. Collection outside normal opening hours was the stated driver rather than any saving on staff labour.
Signal: Pharmacy suits this format better than gro
FEBRUARY 2025

Operator relocated underused terminals after utilisation review

A network operator relocated a substantial portion of its estate following a utilisation review that found many pandemic-era sites had never developed the footfall originally assumed for them. Relocation cost far less than new deployment and lifted average compartment turnover across the whole network measurably.
Signal: Siting quality rather than terminal count

Sheet Steel, Locks, Screens, Electronics

Powder-coated sheet steel for cabinets and doors carries roughly 30% to 38% of cost of goods, sourced from regional mills close to wherever the terminal is fabricated because shipping empty enclosures is uneconomic. Electronic locks, controllers, and door sensors add 18% to 24% from a concentrated component base. Touchscreens, cameras, connectivity modules, and refrigeration units on temperature-controlled variants make up most of the remainder.
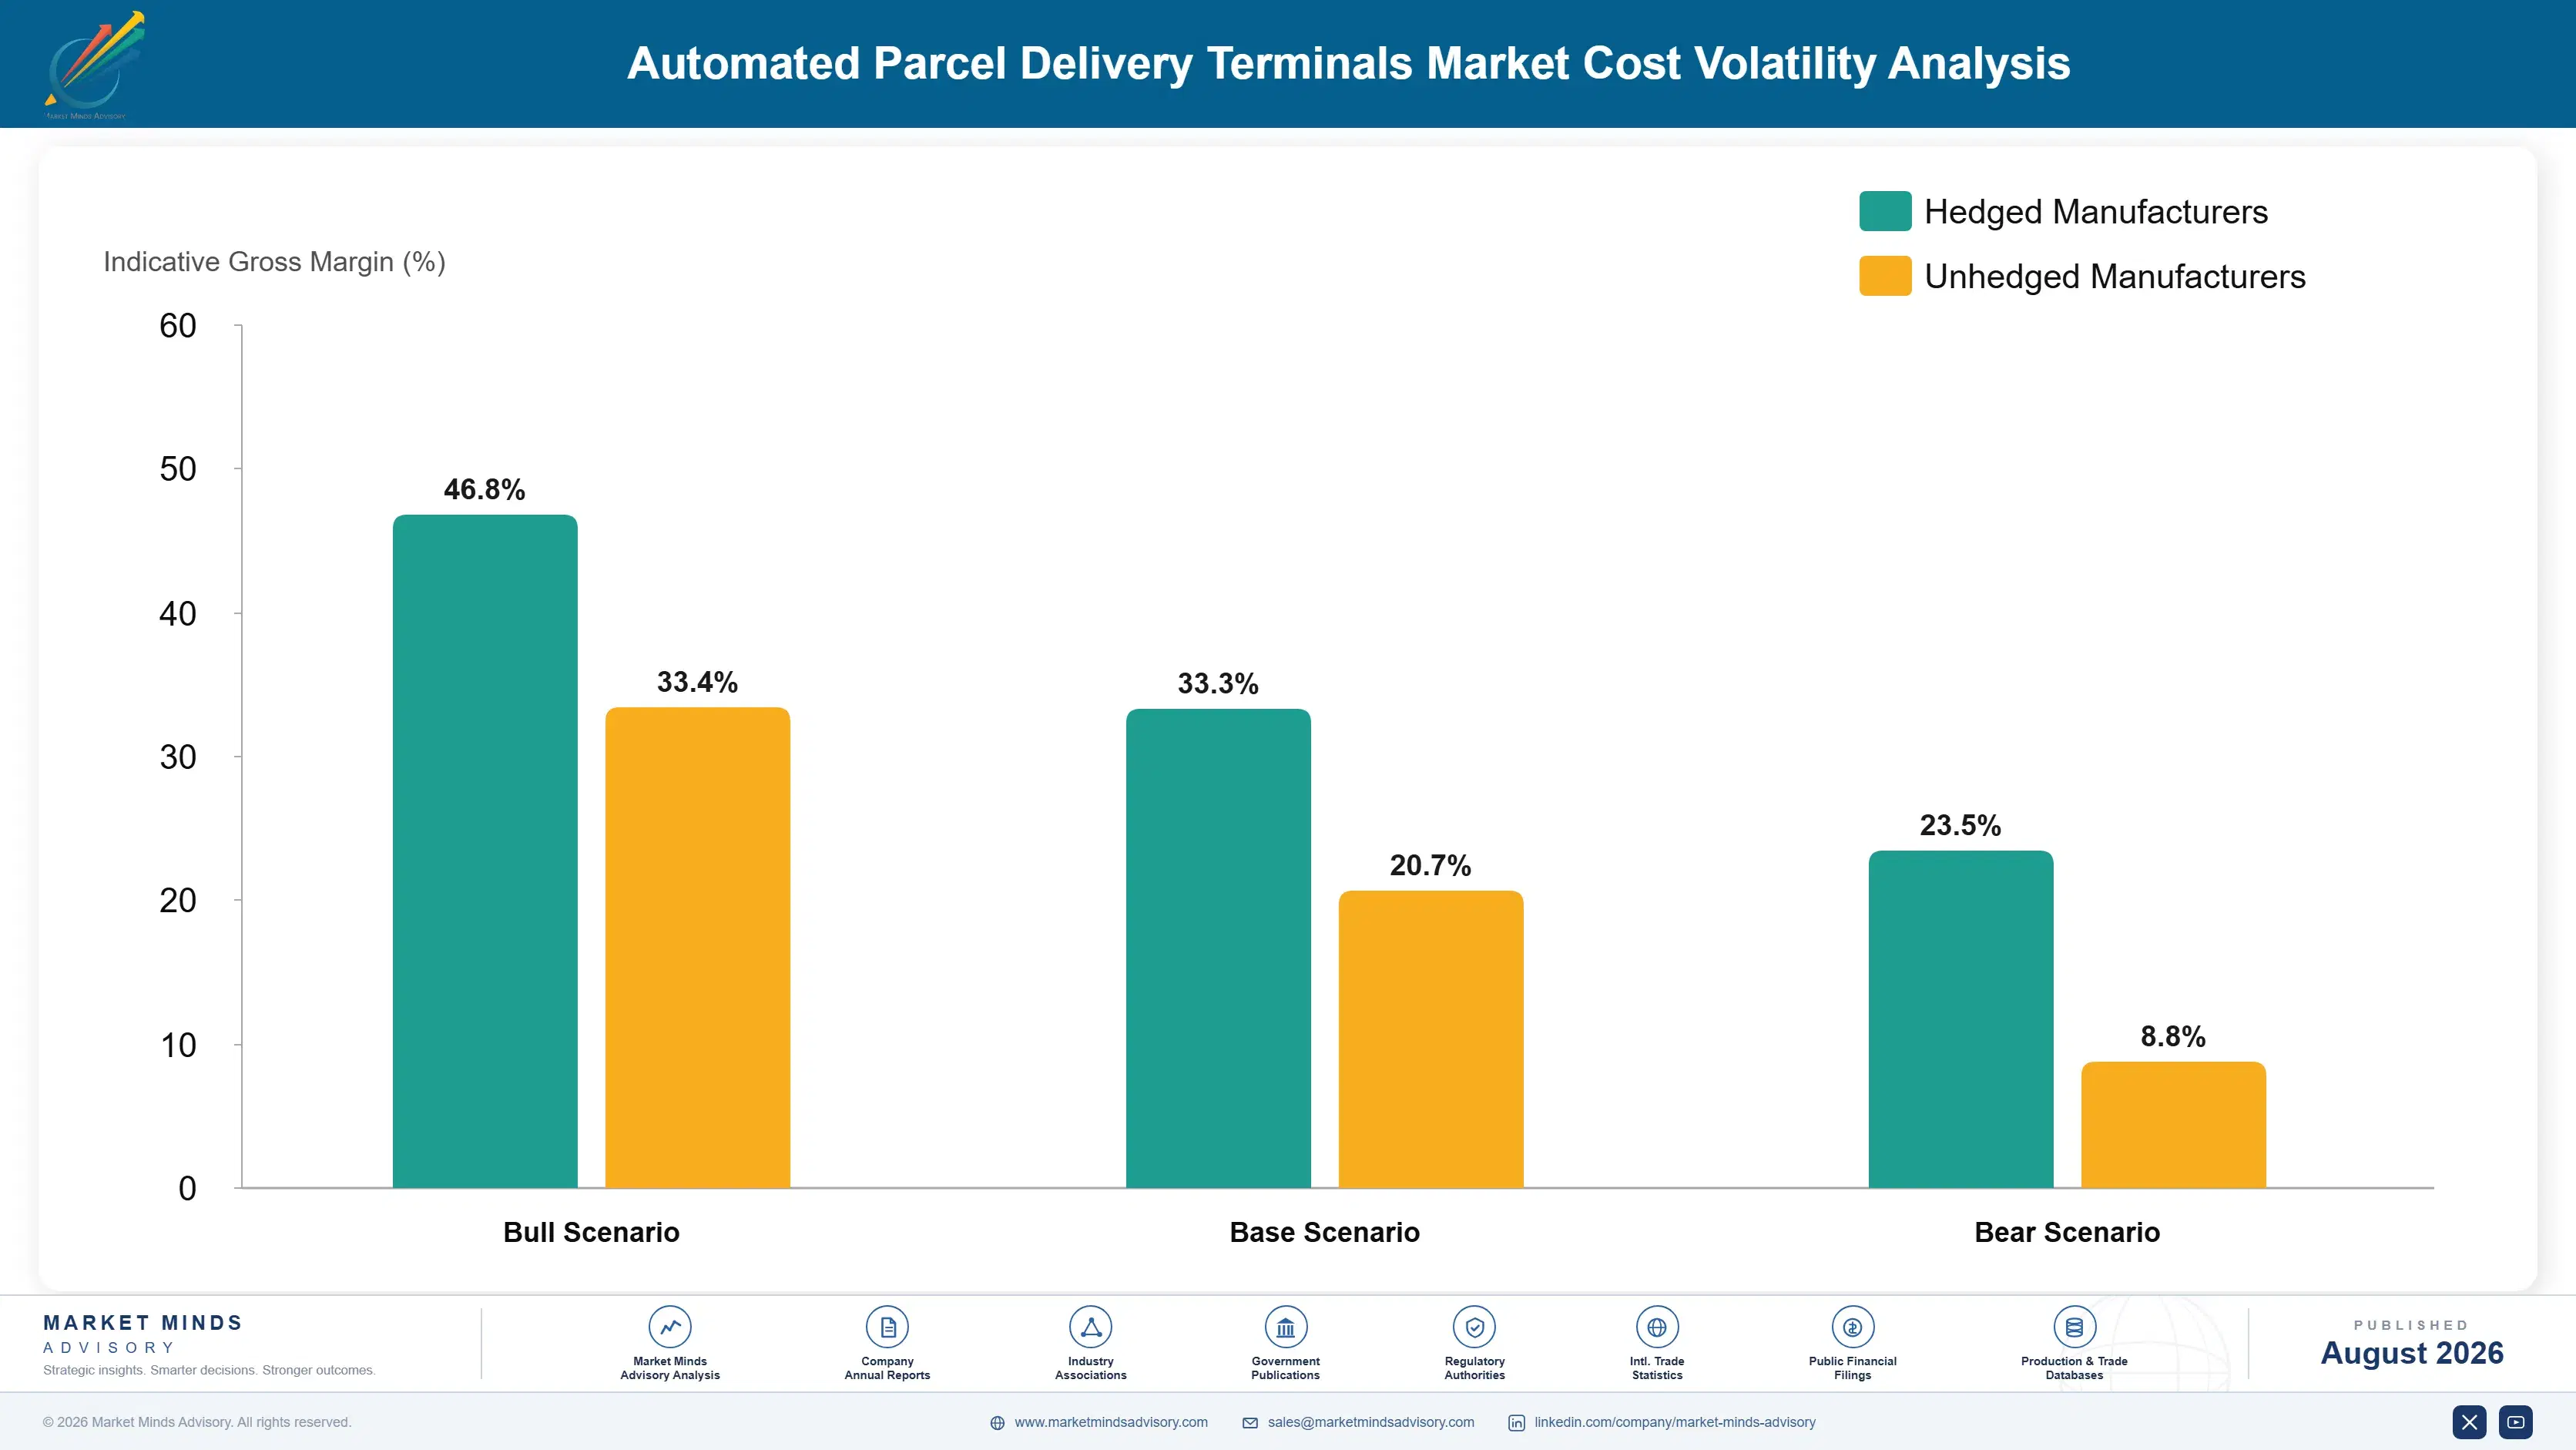
European steel and energy costs rose sharply through 2022 and 2023 after the gas shock, and European Commission energy statistics record industrial electricity roughly doubling at the peak. Terminal makers quoting fixed prices on multi-year network rollout agreements absorbed most of that themselves. The episode widened the gap against Chinese manufacturers who faced no equivalent increase, and several European suppliers repriced or renegotiated rollout contracts rather than continue delivering at a loss.

Exposure divides by where fabrication happens and by what is being sold. Suppliers fabricating in Europe against Chinese competition carry a cost base they cannot close through purchasing discipline alone. Those selling software and service alongside hardware carry less steel per unit of revenue. Small fabricators bidding hardware-only rollouts sit worst, exposed on input cost and undifferentiated on everything else.
automated-parcel-delivery-terminals-market-cost-volatility-analysis-1787333416381

Shift revenue mix toward software and service

Network management software, multi-carrier access licensing, and uptime service agreements carry no steel at all and considerably better margins than the cabinet does. Raising their share lowers metal exposure without changing how terminals are built. It also moves the sale away from the cost comparison Chinese manufacturers win, which is worth more than the input saving itself.

Standardise cabinet modules across the product range

Common door, frame, and cabinet modules shared across configurations raise steel purchase volumes for any given specification and support forward contracts that per-model buying cannot reach. Fabrication setup cost and inventory both fall. The obstacle is customer demand for bespoke sizing, which erodes the purchasing advantage one special order at a time. Discipline here repays itself quietly.

Fabricate close to the deployment market

Shipping empty steel enclosures across continents is expensive and slow, and regional fabrication under licence removes both the freight cost and much of the currency exposure. Control systems and software still ship from the home operation, which is where the value actually sits. Quality consistency across licensed fabricators is the real constraint on doing this well.

Portfolio Architecture for Margin Defence

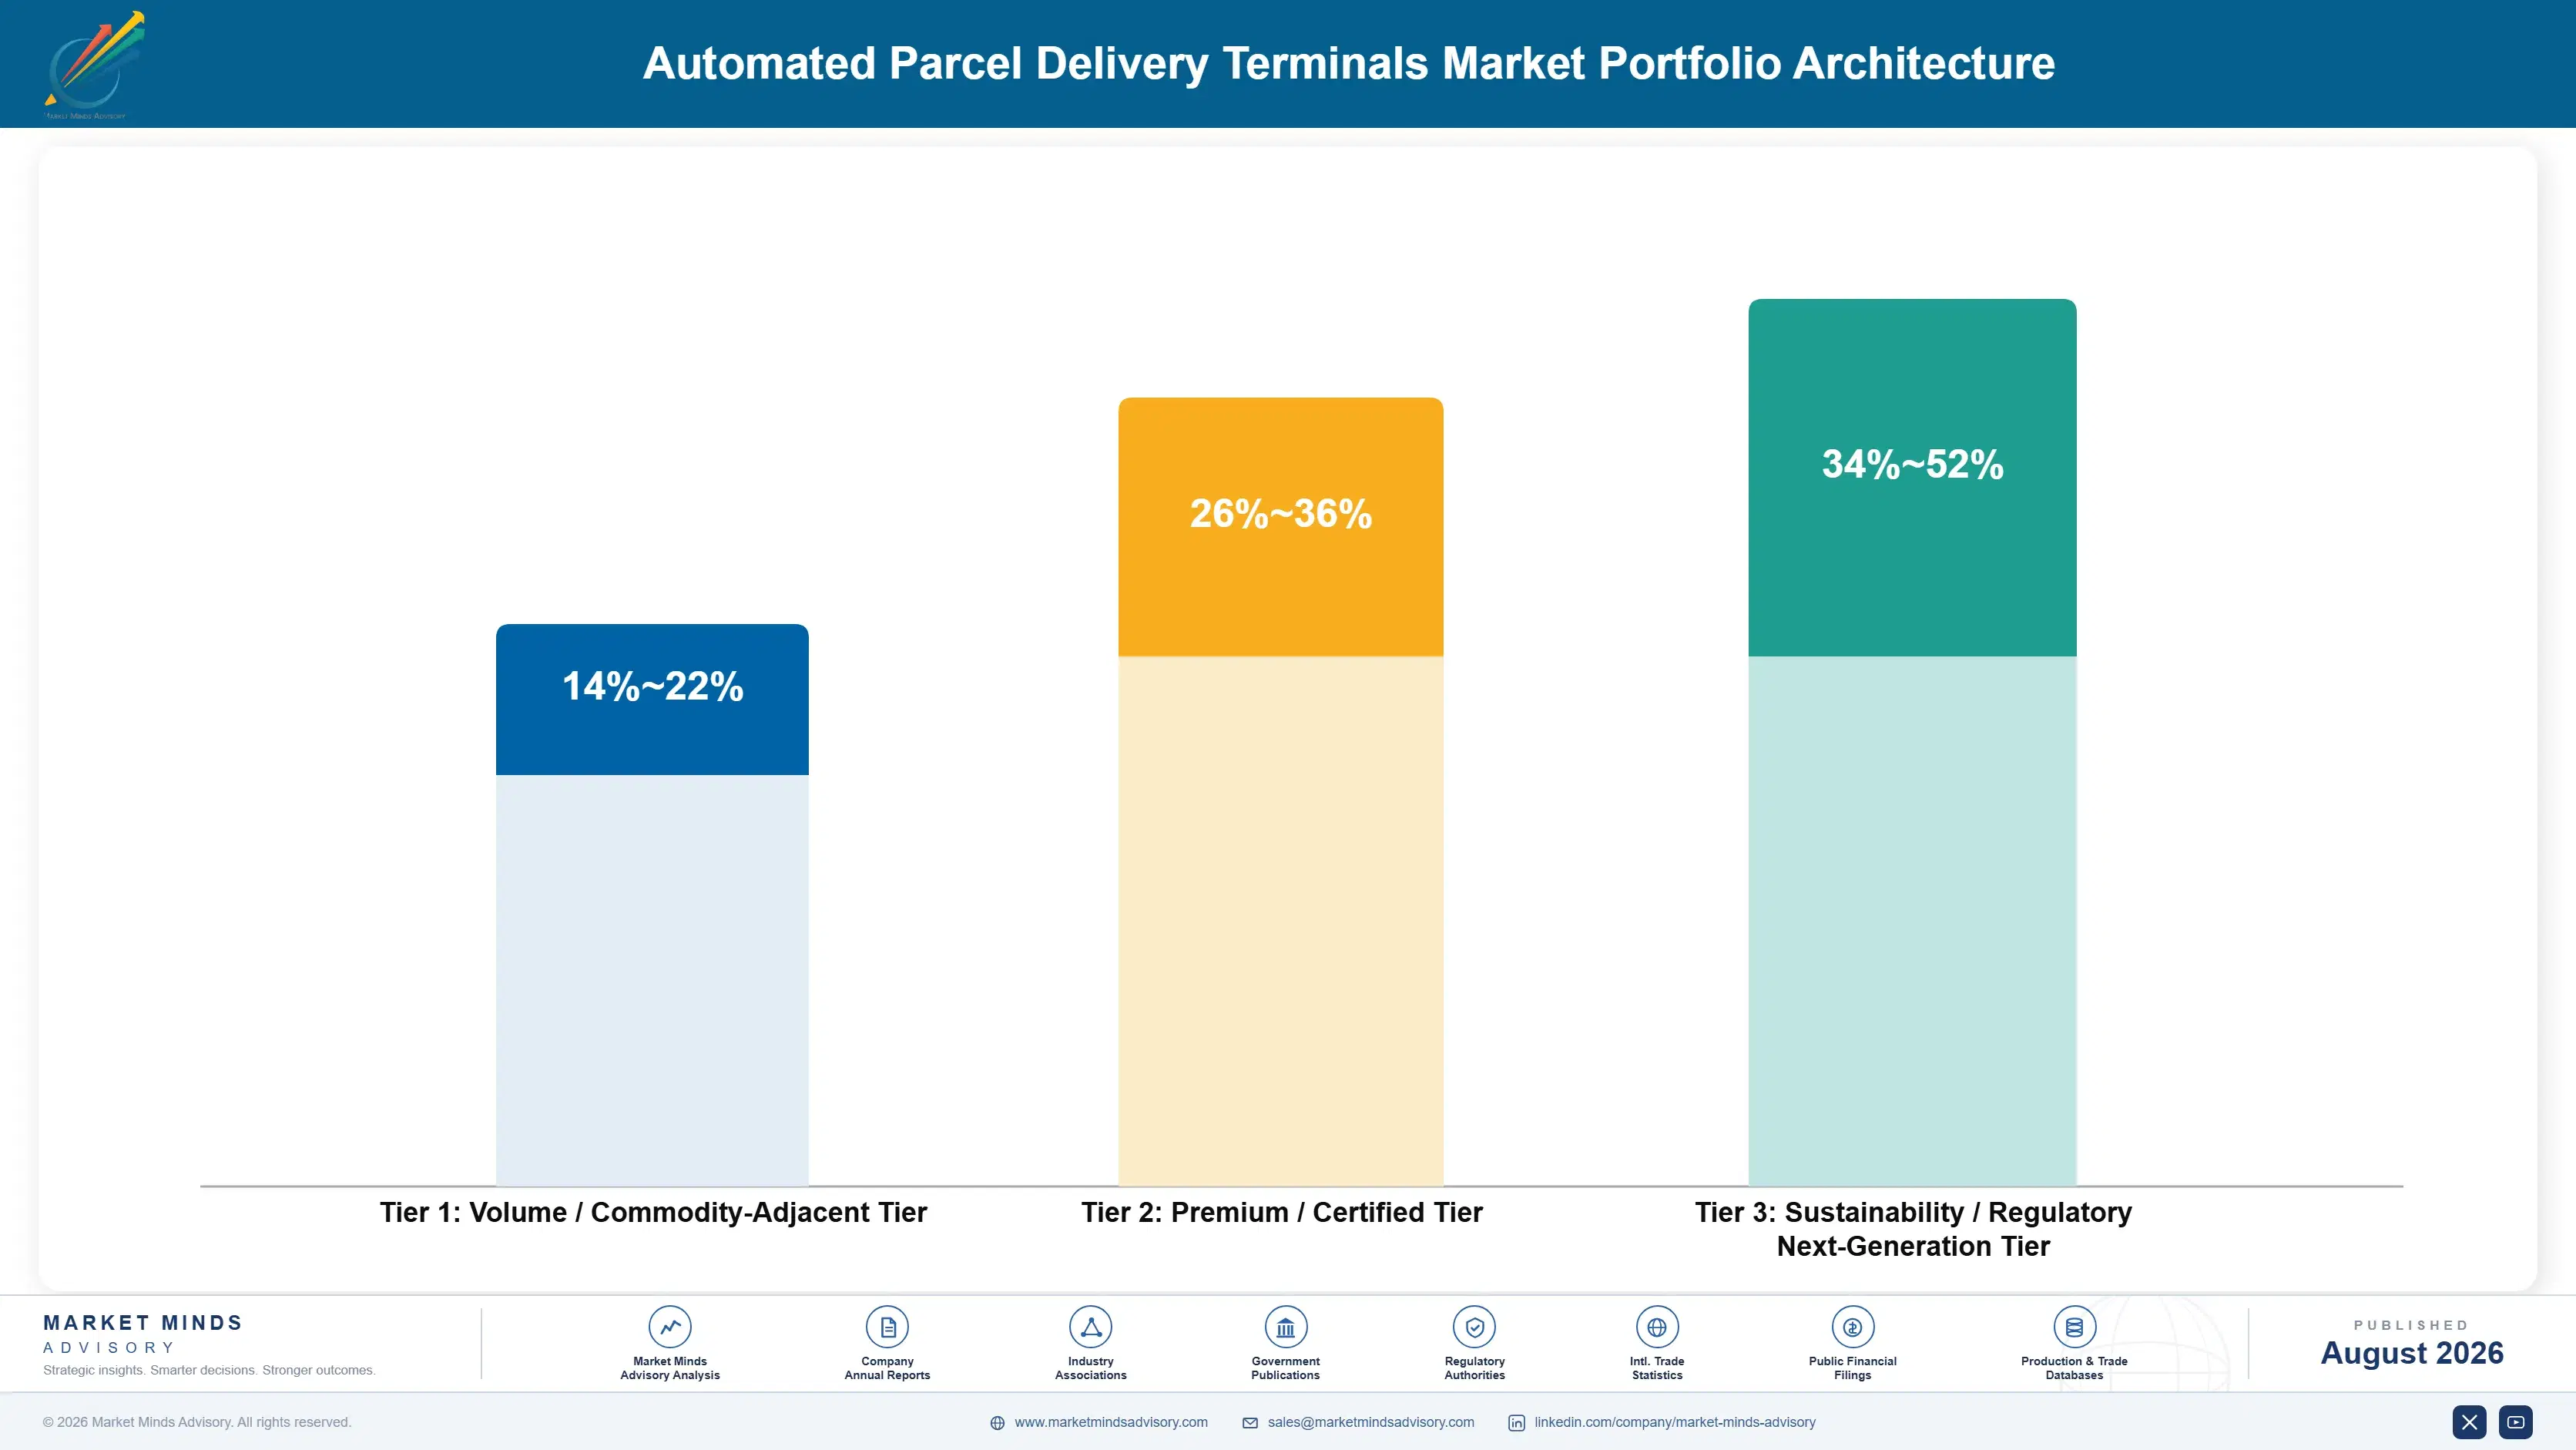
Margin here tracks distance from the sheet metal. A standard dry locker bank is close to a commodity, judged purely on cost per compartment, and Chinese manufacturers set the level that everybody else has to work against. Software, service, and temperature-controlled hardware are judged instead on what they enable rather than on what they cost to build, and they earn their margin accordingly.
The volume tension is uncomfortable for European suppliers. Standard outdoor hardware is the bulk of every network rollout, and giving it up means losing the estate that service and software revenue attaches to afterwards. Holding it means competing on a cost base that simply cannot be matched. Most have chosen to bundle rather than retreat, which works only where the buyer values uptime above unit price.

High-value pools sit in three places. Multi-carrier access software licensed annually, uptime service agreements on outdoor estates, and temperature-controlled compartments for pharmacy and grocery use. All three are defended by capability and by switching cost rather than by manufacturing economics, which is the only ground where a European supplier can hold a position durably against Chinese pricing.

Volume / Commodity-Adjacent Tier

Standard dry locker banks for outdoor and retail-sited deployment, sold on cost per compartment. Chinese manufacturers set pricing here, and the range reflects how differently European and Asian cost bases carry the same cabinet.
Gross Margin: 14-22%

Premium / Certified Tier

Engineered outdoor terminals with vandal resistance, remote diagnostics, and high-density or robotic handling formats. Reliability and footprint efficiency rather than hardware cost sustain the margin with operators running large estates.
Gross Margin: 26-36%

Sustainability / Regulatory / Next-Generation Tier

Multi-carrier access software, uptime service agreements, and temperature-controlled compartments for pharmacy and grocery. The very wide range reflects genuinely different economics between annual software licensing, contracted service, and refrigerated hardware.
Gross Margin: 34-52%
automated-parcel-delivery-terminals-market-portfolio-architecture-1787333416887

High-value Sub-segments and Strategic Watch-out

Multi-Carrier Access Software

The only thing that fixes utilisation stuck near 34%, and almost nobody has built it properly yet. Licensed annually it earns software margins, and a neutral network operator will not buy hardware that cannot run several carriers within one estate. Whoever builds it first sets the standard for everybody else.
Gross Margin: 56-72%

Temperature-Controlled Compartments

Growing at 15.8% and the only hardware in this market commanding a real price premium. Pharmacy dispensing pays best because collection is time-critical and the regulatory temperature record comes free with hardware that logs continuously anyway. It is also the only hardware still commanding a real premium.
Gross Margin: 38-50%

Standard Dry Locker Banks

The volume base of every network rollout and the part Chinese manufacturers contest most effectively on price alone. It still carries the estate that service and software revenue attaches to, which is why exiting it costs more than the margin suggests. Exiting it costs the estate, not just the volume.
Gross Margin: 14-22%

Uptime Service Agreements

Growing because an outdoor terminal spends a decade in weather and a broken locker destroys the customer habit the channel depends on. The watch-out is that service quality is hard to scale geographically without local presence in every deployment market. Local presence is the constraint on scaling it.
Gross Margin: 40-54%

What The Terminal Earns Afterwards

A locker earns more after installation than most suppliers collect. Ten years outdoors produces continuous demand for lock replacement, screen renewal, connectivity modules, cleaning, and vandalism repair, alongside management software that has to be maintained and updated throughout. Suppliers who structure that as contracted service recover 9% to 15% of installed value annually at margins the hardware sale never approaches, and the revenue is independent of rollout cycles.
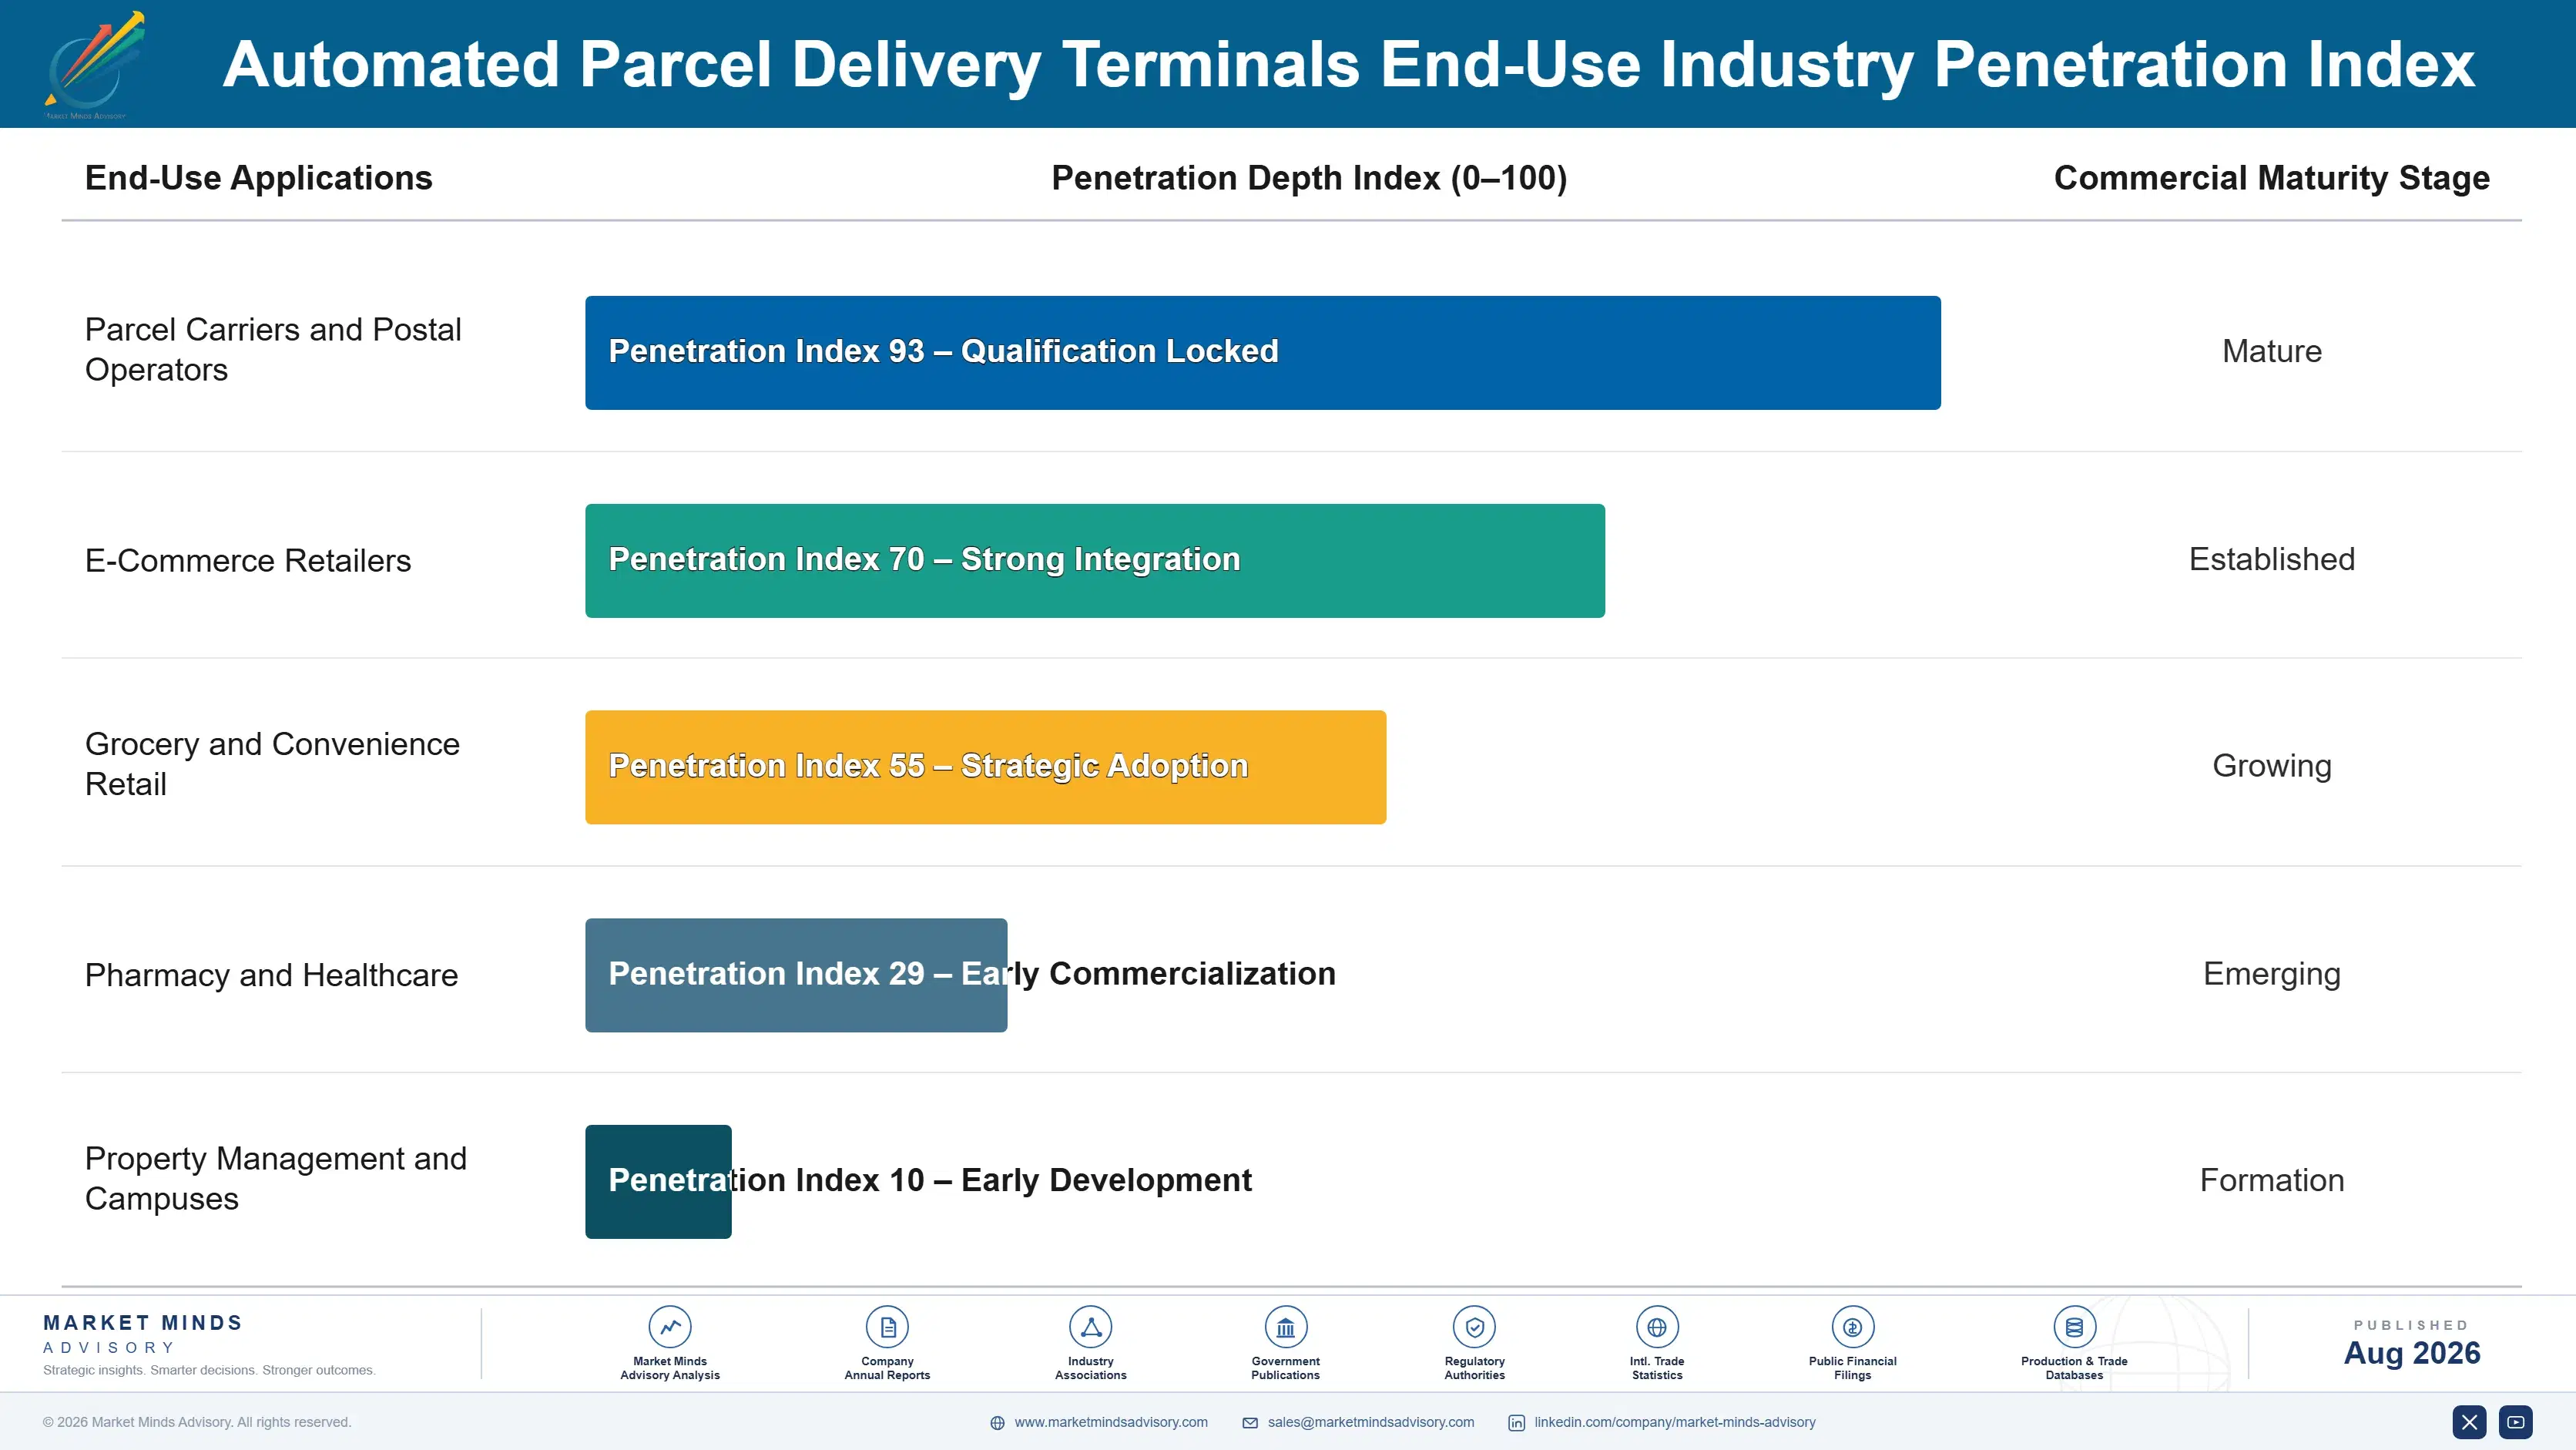
Stickiness varies by who owns the estate. Carrier-operated networks are locked in almost completely, because a mixed estate means running incompatible management systems and retraining field teams across thousands of sites. Property managers buying residential units switch freely at replacement. Retailers sit between the two, standardising across stores but retendering whenever a rollout programme comes up for renewal.

Buyer profiles have shifted from operations toward finance. Terminals used to be specified by a logistics manager focused on failed delivery rates and driver stops saved. The decision increasingly sits with whoever owns network capital allocation and is measured on compartments turned per week rather than terminals installed. That change favours suppliers who can demonstrate utilisation improvement, and it disadvantages those selling on hardware specification.
automated-parcel-delivery-terminals-market-end-use-penetration-index-1787333417382

Where To Compete Here

These are among the four positions where our research anticipates prominent divergence between winners and laggards over the coming forecast period. Each is grounded in the demand model, the regulatory perimeter, and the announced capacity pipeline.
01 / UTILISATION ECONOMICS FOCUS

Sell compartments turned, not terminals installed

Average utilisation near a third means that fully two thirds of the deployed capital sits idle at any given moment, and the industry's habit of counting terminals installed has hidden exactly that from the people funding it. Suppliers who can demonstrate measured utilisation improvement through siting analysis and multi-carrier access are answering the question that network owners have finally started asking them. Those still presenting hardware specifications are talking to a buyer who moved on from that conversation some time ago.
02 / MULTI-CARRIER SOFTWARE BUILD

Own the layer that fixes the shared problem

Carrier exclusivity is the reason utilisation stays low, and software allowing one physical terminal to serve several operators under separate branding is the only mechanism that addresses it without anybody giving up their own network. Almost nobody has built that layer properly yet, which leaves it wide open to whichever supplier invests in it first and does the job well. Licensed annually it earns proper software margins, and it makes that supplier's hardware the obvious choice for any neutral network operator.
03 / OUTDOOR SERVICE CONTRACTING

Guarantee uptime across ten years outdoors

A terminal spends an entire decade out in the weather, gets vandalised, and loses connectivity unpredictably, and a customer who finds a broken locker stops choosing the channel altogether rather than simply trying again next week. Uptime agreements covering repair, cleaning, and component replacement recover roughly a tenth to a seventh of installed value each year, at margins well above the hardware itself. Operators accept the cost readily enough once somebody quantifies what a dead terminal actually does to their volume.
04 / REFRIGERATED FORMAT PUSH

Chase pharmacy before grocery chases you

Temperature-controlled compartments cost around three times a dry one and sell to buyers who have no cheaper way of solving the problem in front of them, which is genuinely rare anywhere in this market. Pharmacy fits better than grocery does, because collection is time-critical, identity checking is already built in, and continuous logging satisfies the regulatory record without any extra equipment. It is the fastest-growing segment in this market and the only one where hardware still commands any real premium.

Engagement Snapshot From the Field

A live engagement with an industry participant carrying material or product regulatory and market exposure ahead of a defining policy shift, showing how our research translates into a defensible multi-year portfolio strategy.
MARKET MINDS ADVISORY · CLIENT ENGAGEMENT SUMMARY
Automated Parcel Delivery Terminals Producer Strategic Portfolio Review and Transition Roadmap 2026·Investment Scenario on Automated Parcel Delivery Terminals Exposure Evaluation 2025-26
CLIENT PROFILE
A national parcel carrier operating a locker estate of several thousand terminals across a mature European market, with annual parcel volumes above 200 million and network capital deployed near USD 190 million (client-reported, unverified by MMA). The estate had been built rapidly between 2020 and 2022, and average compartment utilisation had never approached the figures assumed in the original business case.
STRATEGIC CHALLENGE
The board had approved further deployment on the original utilisation assumptions and wanted to know whether to continue, pause, or redirect the capital. Underperformance was clear in aggregate but nobody could say whether the cause was siting, carrier exclusivity, consumer behaviour, or simply too many terminals for the parcel volume available.
MMA APPROACH
MMA analysed compartment turnover site by site against footfall, housing type, competing terminal density, and parcel volume within the catchment. Sites were then grouped by whether the shortfall traced to location or to exclusivity. Relocation economics were modelled against new deployment, and open-network scenarios were tested for what utilisation they would realistically deliver.
KEY FINDINGS
  1. Roughly 28% of terminals sat in locations where catchment parcel volume could never fill them regardless of any operational improvement (client-reported, unverified by MMA).
  2. Relocating an underused terminal cost approximately 35% of new deployment and delivered comparable utilisation once it was resited into a properly validated catchment.
  3. Sites within 300 metres of a competing carrier's terminal showed materially lower turnover, confirming that exclusivity rather than demand explained part of the shortfall.
  4. Opening a pilot group of terminals to a second carrier lifted compartment turnover by roughly half without displacing any of the client's own volume.
CLIENT PROFILE
A national parcel carrier operating a locker estate of several thousand terminals across a mature European market, with annual parcel volumes above 200 million and network capital deployed near USD 190 million (client-reported, unverified by MMA). The estate had been built rapidly between 2020 and 2022, and average compartment utilisation had never approached the figures assumed in the original business case.
STRATEGIC CHALLENGE
The board had approved further deployment on the original utilisation assumptions and wanted to know whether to continue, pause, or redirect the capital. Underperformance was clear in aggregate but nobody could say whether the cause was siting, carrier exclusivity, consumer behaviour, or simply too many terminals for the parcel volume available.
MMA APPROACH
MMA analysed compartment turnover site by site against footfall, housing type, competing terminal density, and parcel volume within the catchment. Sites were then grouped by whether the shortfall traced to location or to exclusivity. Relocation economics were modelled against new deployment, and open-network scenarios were tested for what utilisation they would realistically deliver.
KEY FINDINGS
  1. Roughly 28% of terminals sat in locations where catchment parcel volume could never fill them regardless of any operational improvement (client-reported, unverified by MMA).
  2. Relocating an underused terminal cost approximately 35% of new deployment and delivered comparable utilisation once it was resited into a properly validated catchment.
  3. Sites within 300 metres of a competing carrier's terminal showed materially lower turnover, confirming that exclusivity rather than demand explained part of the shortfall.
  4. Opening a pilot group of terminals to a second carrier lifted compartment turnover by roughly half without displacing any of the client's own volume.
RECOMMENDED STRATEGY
Phase 1: Phase one: relocate the terminals in unfillable catchments rather than deploying new units, releasing capital from the approved expansion budget. Phase 2: Phase two: extend the second-carrier pilot across those sites where competing terminal density is highest and measured utilisation is weakest. Phase 3: Phase three: rebase the whole deployment business case on measured compartment turnover rather than on the original terminal count targets.
OUTCOME
The client paused new deployment, relocated the identified terminals, and reported network average utilisation rising from the low thirties to above 45% within a year (client-reported, unverified by MMA). The second-carrier arrangement was extended beyond the pilot, and the deployment business case was rebased on compartment turnover for the following capital cycle.

Frequently Asked Questions

Foundational context covering the market sizes, CAGR, scope, country, region and competition that inform every finding below. This section is provided to cover basics and most often pre-purchase conversations, answered from the MMA Primary Research Dataset.

What is the current size of the Automated Parcel Delivery Terminals Market?

The market reached USD 1.8 billion in 2025 and is forecast at USD 1.99 billion for 2026. Growth follows network deployment and returns volume rather than parcel volume generally.

How large will the Automated Parcel Delivery Terminals Market be by 2036?

MMA forecasts USD 5.45 billion by 2036, an increase of USD 3.46 billion over 2026. That represents an expansion multiple of 2.74 times across the forecast period.

What is the CAGR for the Automated Parcel Delivery Terminals Market 2026 to 2036?

The base case CAGR is 10.6%, with a bull case at 11.9% and a bear case at 9.3%. The bull case depends on carrier-agnostic open networks finally reaching genuine scale.

Which segment is growing fastest?

Temperature-controlled terminals grow fastest at 15.8%, roughly 1.49 times the market rate. Grocery and pharmacy fulfilment is pushing into a channel originally built for dry goods only.

Who are the major companies in the Automated Parcel Delivery Terminals Market?

KEBA, Cleveron, Quadient, Bell and Howell, and Zhilai Technology lead the market. The top five hold roughly 41% of terminal supply revenue, split between European specialists and Chinese volume manufacturers.

Which country is growing fastest?

India grows fastest at 14.2%, driven by e-commerce volume, apartment living in the cities receiving those parcels, and the shift away from cash on delivery. Almost all of that installed base is very recent.

Report Segmentation Architecture

The full report scope spans multiple orthogonal segmentation dimensions, with cross-tabulated demand data provided for each dimension pair. Coverage extends further to regional breakdowns, trend trajectories, and the competitive detail needed to support segment-level decision-making.

By Terminal Configuration

  • Temperature-Controlled Terminals
  • Outdoor Standalone Terminals
  • Indoor Retail-Sited Terminals
  • Residential Building Terminals
  • Mobile and Relocatable Terminals

By End-Use Industry

  • Parcel Carriers and Postal Operators
  • E-Commerce Retailers
  • Grocery and Convenience Retail
  • Pharmacy and Healthcare
  • Property Management and Campuses

By Commercial Dimension

  • Direct Network Rollout Supply
  • Neutral Operator Deployment
  • Property Developer Specification
  • Software Licensing and Access Management
  • Service and Uptime Agreements

By Region

  • East Asia
  • Eastern Europe
  • Western Europe
  • North America
  • South Asia and Pacific
  • Latin America
  • Middle East and Africa

Scope, Methodology, and Coverage

Every figure in this report is reproducible from documented input assumptions. The scope below maps the historical period, the forecast horizon, the segmentation dimensions, and the countries covered, alongside the underlying primary and qualitative methodology.
Historical Period
2020 to 2025
Forecast Period
2026 to 2036
Base Year
2025 (USD billions; MMA Primary Research Dataset, August 2026)
Market Definition
The automated parcel delivery terminals market comprises unattended self-service locker systems used for parcel handover, collection, and returns, valued at supplier selling prices to parcel carriers, postal operators, neutral network operators, retailers, pharmacies, and property managers. It spans outdoor standalone, indoor retail-sited, residential building, temperature-controlled, and mobile relocatable configurations, together with the electronic access control, network management and multi-carrier access software licences, and uptime and maintenance service agreements supplied with them. Staffed parcel shops and counter services, warehouse automation and parcel sortation equipment, vending and retail dispensing machines, left-luggage and personal storage lockers, autonomous delivery vehicles and drones, and the parcel delivery services themselves are excluded.
Quantitative Units
USD billions (current prices); volume in terminals and compartments shipped
Segmentation Dimensions
By Terminal Configuration; By End-Use Industry; By Commercial Dimension; By Region
Regions Covered
East Asia, Eastern Europe, Western Europe, North America, South Asia and Pacific, Latin America, Middle East and Africa
Countries Covered
China, Japan, South Korea, Taiwan, India, Australia, Indonesia, Malaysia, Thailand, Vietnam, Poland, Czechia, Slovakia, Estonia, Latvia, Lithuania, Romania, Hungary, Germany, Netherlands, Belgium, France, UK, Sweden, Denmark, Norway, Finland, Spain, Italy, USA, Canada, Mexico, Brazil, Chile, Colombia, United Arab Emirates, Saudi Arabia, South Africa, and additional markets relevant to this sector
Key Companies Profiled
KEBA, Cleveron, Quadient, Bell and Howell, Zhilai Technology, Winnsen Industrial, TZ Limited, Luxer One, American Locker, Smiota, Vlocker, Snaile, Variocube, LockTec, Bloq.it, Hive Box, Shanghai Fuyou Intelligent Technology, Zhongyou Zhidi, Package Nexus, Gantner Electronic
Quantitative Methodology
Primary survey, n=3,800 respondents, Q4 2025, six countries; demand-side model with trade association cross-validation
Qualitative Methodology
47 expert interviews, Q4 2025; applied to validate demand model assumptions, identify emerging dynamics, and assess competitive positioning
Report Format
PDF and XLSX data workbook (Word format preview document)
Publisher
Market Minds Advisory
Report Code
MMA-2026-TEC-617
Published
August 2026
Contact
sales@marketmindsadvisory.com | www.marketmindsadvisory.com

Purchase the full Automated Parcel Delivery Terminals Market Report (2026 to 2036).

The full report examines automated parcel terminal demand across seven regions and five configurations, with particular attention to why compartment utilisation rather than terminal count determines whether a network earns its capital back. It quantifies the effect of carrier exclusivity on turnover and sizes the relocation opportunity across estates built during the pandemic build-out. Competitive analysis covers twenty participants assessed on terminal supply revenue, including how Chinese manufacturing cost is foreclosing European entry into emerging deployment markets. Regional chapters map network density against housing form and parcel volume.
Seven-region network density and deployment demand analysis
Five configuration segmentation with growth rates
Twenty participant competitive assessment and cost positioning
Compartment utilisation benchmarking by siting and exclusivity
Multi-carrier software and service revenue economics
Temperature-controlled format sizing across grocery and pharmacy

Built For The People Who Decide

From boardroom strategy to bench-side execution, this report is read cover-to-cover by leaders shaping the next decade of their industry, turning demand scenarios, market dynamics and valuation benchmarks into decisions.
CXOs/ Presidents/ VPs/ Managers
M&A and Corporate Development
Strategy Teams and R&D Heads
Procurement and Product Directors
Regulatory and Compliance Leaders
Investor Relations and Equity Analysts