Market Minds Advisory
Automated Container Terminal Market

Automated Container Terminal Market: Labor Cost Pressure and the Software-Defined Terminal

Port operators are pairing automated stacking cranes with AI-enabled terminal operating systems faster than labor negotiations can keep pace, even as ZPMC's manufacturing scale and Kalmar's software depth squeeze out smaller regional integrators.

Lead Analyst

David Horsley

Published

September 2026

Make Smarter Decisions with Customized Research Insights

Request a free sample report and evaluate market opportunities, growth trends, and competitive dynamics relevant to your business needs.

2025 MARKET VALUE$6.8BMarket Size 2025
2036 FORECAST VALUE$18.6BBase Case , 2026 to 2036
CAGR 2026 TO 20369.6 %Bull 10.8% / Bear 8.3%
INCREMENTAL OPPORTUNITY$11.2BNet 10- year value creation
EXPANSION MULTIPLE2.50x2036 value over 2026 base
Strategic Levers
M&A Pipeline
Regional Outlook
Country Rankings
Competitive Intelligence
Segmental Deep-dive
Call-Us : 91 93563 13602

Executive Snapshot and Market Trajectory

Port operators are pairing automated stacking cranes with AI-enabled terminal operating systems faster than labor negotiations and dockworker union agreements can accommodate, as post-pandemic congestion memory keeps throughput reliability and labor cost control at the top of every major terminal operator's capital planning agenda, regardless of route or trade lane.
Terminal operating system software is capturing the fastest growth as AI-enabled yard optimization and cloud-based deployment spread across greenfield and brownfield terminal projects worldwide, while automated guided vehicles follow closely as horizontal transport automation expands beyond early-adopter terminals. East Asia holds the deepest equipment manufacturing and automated deployment base given China's crane production dominance, and Saudi Arabia's Vision 2030 port investment program drives the fastest-growing single country market as automated terminal capacity comes online.
Competitive intensity concentrates around a small group of integrators that can deliver full-stack crane, vehicle, and software automation simultaneously, even as regional equipment makers expand qualified capacity each year. Cargotec's Kalmar brand and Shanghai Zhenhua's manufacturing scale set the pace that challengers chase, while tightening cybersecurity and interoperability standards keep raising the bar for new entrants across the automation stack, particularly for smaller regional manufacturers lacking multi-vendor certification.
Market Definition
The automated container terminal market covers automation equipment and software deployed at container terminals, including automated stacking cranes, automated guided vehicles and automated lift vehicles, automated quay cranes, terminal operating system software, and gate automation systems sold to port operators and terminal developers. It excludes manual container handling equipment, ocean carrier vessels themselves, and general port infrastructure such as berths, breakwaters, and dredging services outside the automation equipment scope.
Base Year Value
$6.8B in 2025 (MMA Primary Research Dataset, August 2026)
Forecast Period
2026 to 2036, eleven discrete annual values
CAGR
9.6% base case. Bull 10.8%. Bear 8.3%.
Fastest Growth Segment
Terminal Operating System (TOS) Software: 13.2% CAGR
Fastest Growth Country
Saudi Arabia: 13.1% CAGR
Fastest Growth Region
South Asia and Pacific: 11.7% CAGR
Largest Region
East Asia: 30% of 2025 global value
Market Leaders
Cargotec Corporation, Konecranes plc, Shanghai Zhenhua Heavy Industries Co., Liebherr Group, ABB Ltd. Source: MMA Analysis based on company annual reports and investor filings.
Primary Survey
n=3,800 procurement and R&D decision-makers, Q4 2025, six countries
Methodology
Demand-side build-up, cross-validated against public data, 47 expert interviews

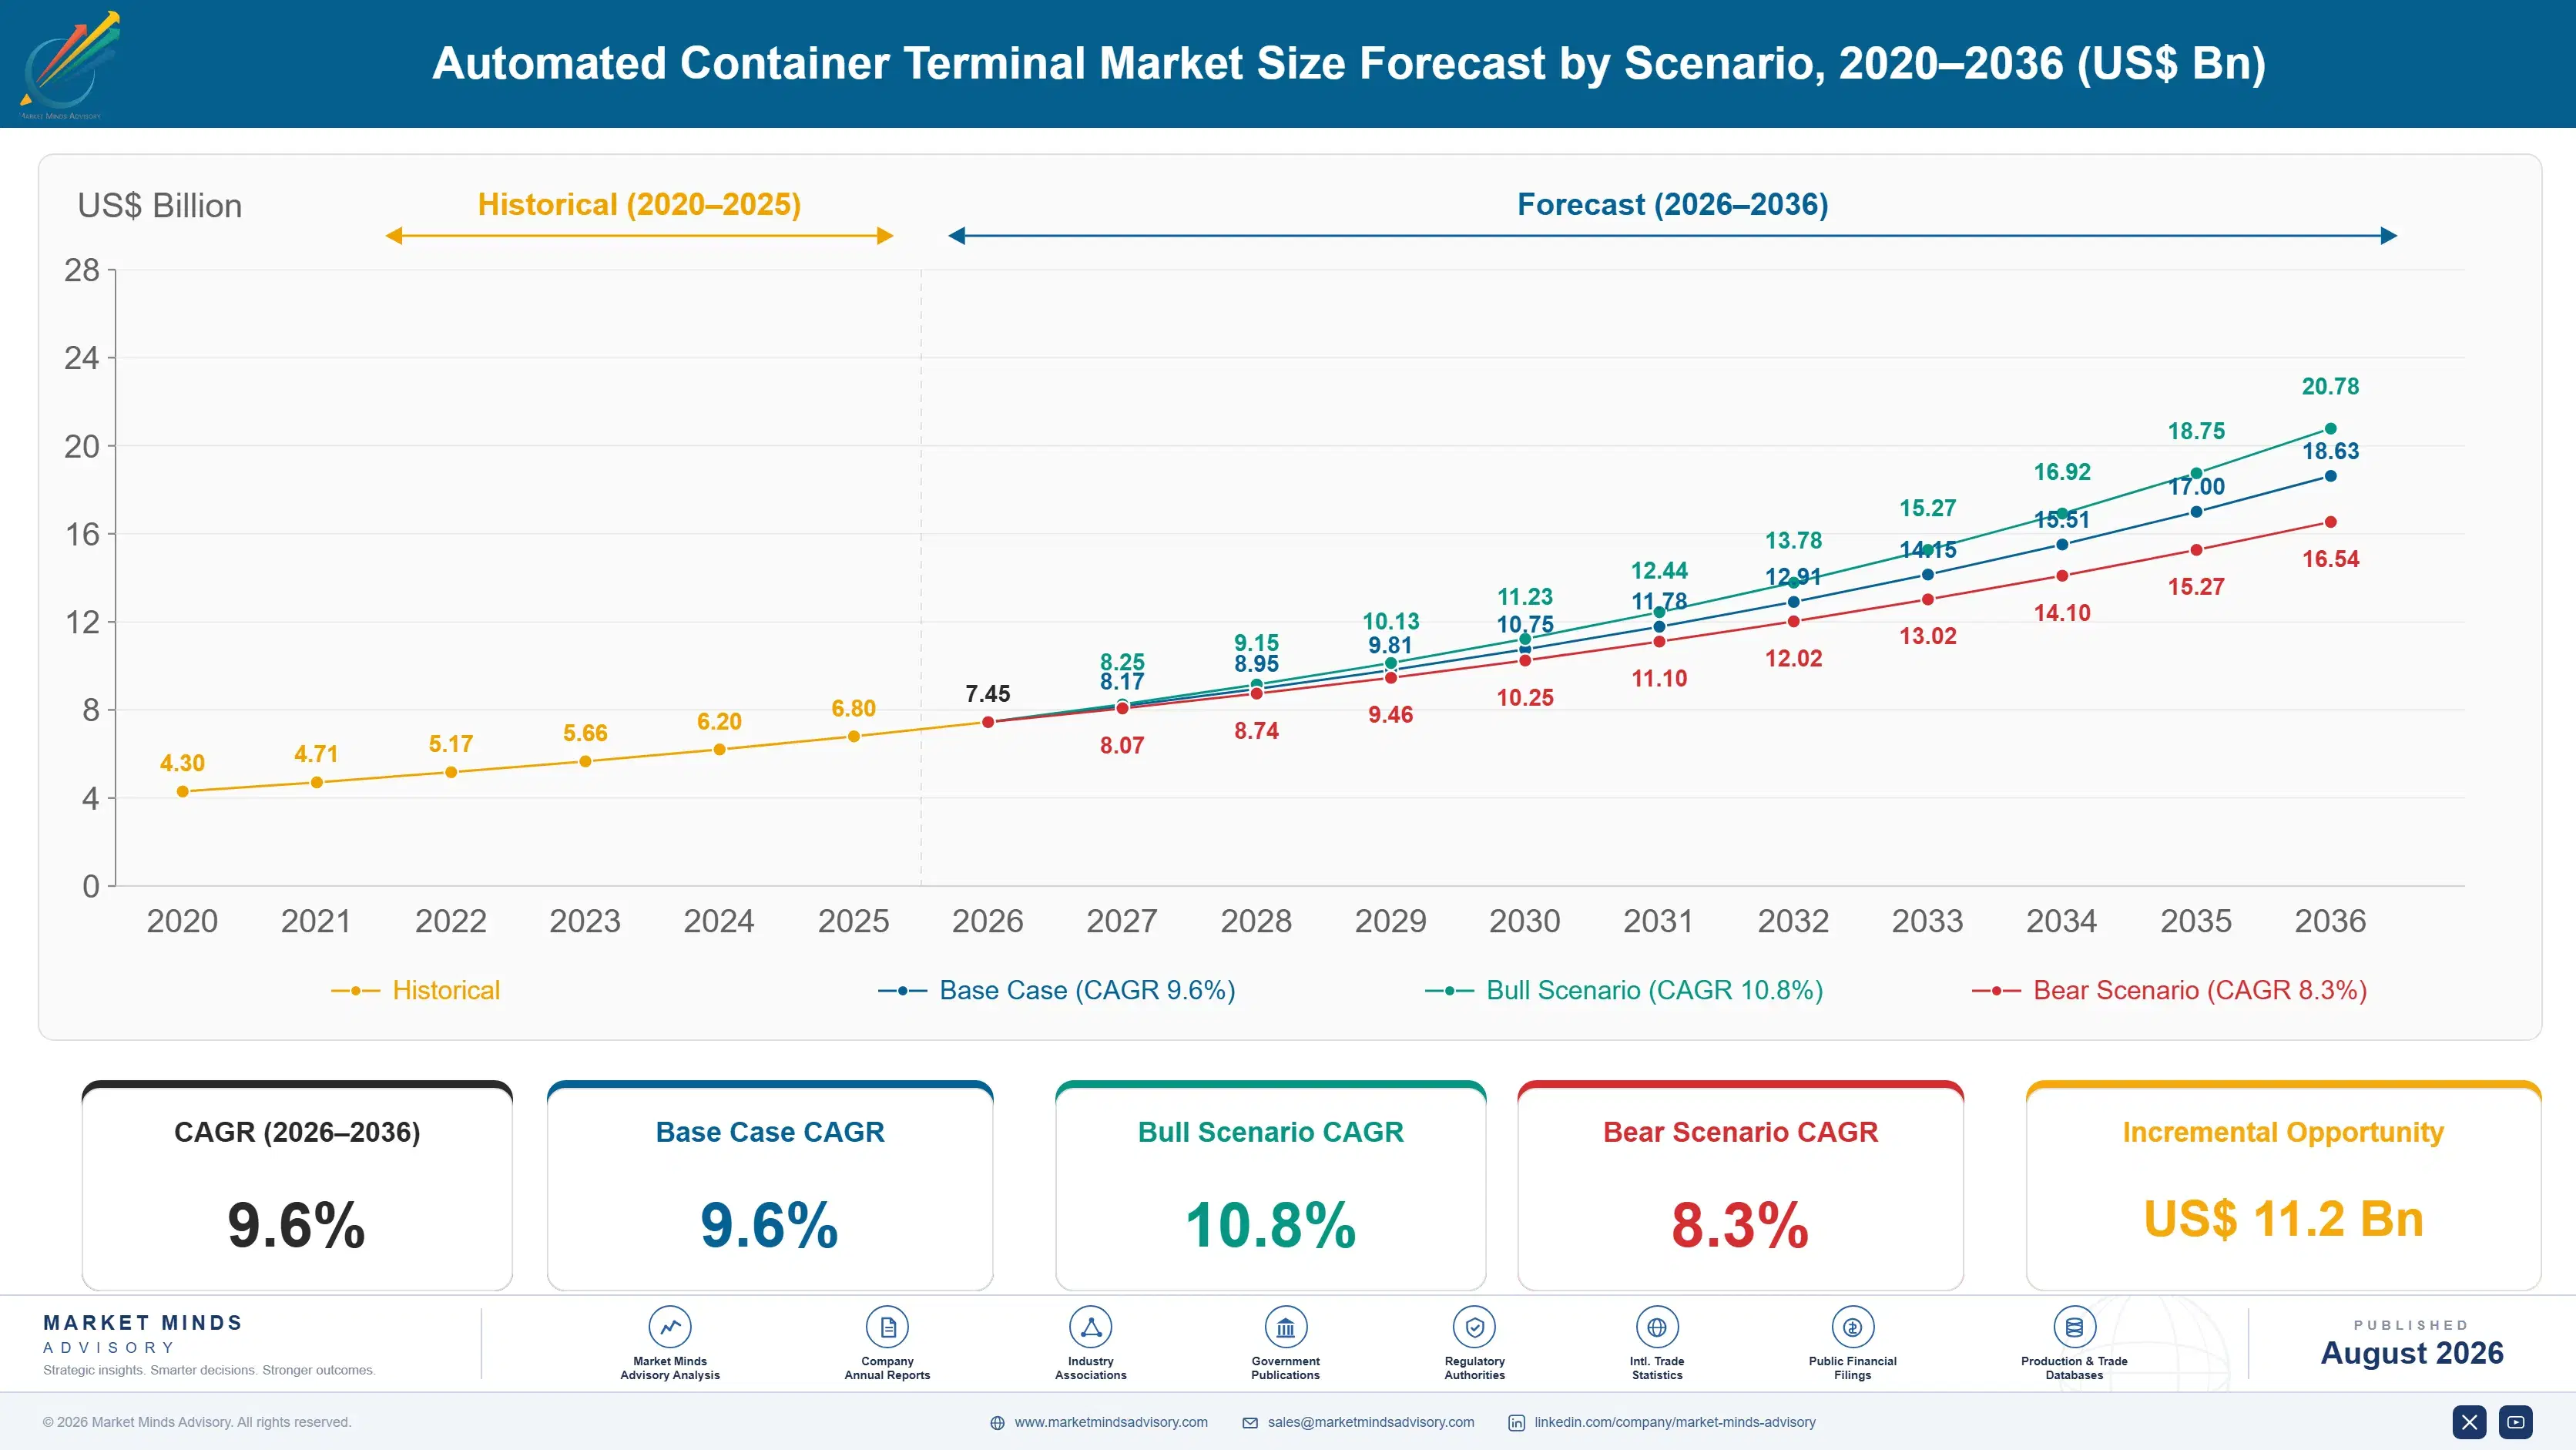
Automated Container Terminal Market Forecast Scenarios

automated-container-terminal-market-size-forecast-scenario-1787301223604
Automated container terminal demand grew unevenly through 2020 to 2025, as pandemic-era port congestion crises sharply accelerated automation investment decisions before supply chain disruption briefly slowed equipment delivery timelines across major projects. The category closed 2025 at an estimated 8.4% historical CAGR, reflecting that congestion-driven urgency building steadily through the back half of the period.
The base case rests on three mechanisms. First, persistent dockworker labor cost pressure keeps pushing terminal operators toward automation as a cost-control strategy rather than a discretionary upgrade. Second, greenfield terminal projects across the Middle East and South Asia increasingly specify automation from initial design rather than retrofitting later, driving equipment demand as new capacity comes online. Third, AI-enabled terminal operating system software is expanding automation's scope beyond crane and vehicle hardware into yard planning and vessel scheduling optimization faster than the port equipment category.
The bull case turns on faster-than-expected greenfield terminal automation adoption pulling equipment and software demand forward across every category simultaneously. The bear risk is a major automated terminal's high-profile operational failure undermining operator confidence in full-stack automation broadly, pushing some operators back toward hybrid manual-automated models and slowing the software-defined terminal trend currently underway across most major port programs worldwide.

Full-Stack Integration and the Software-Defined Terminal

Automated container terminal equipment sits at the intersection of heavy industrial manufacturing and software-defined operations, since terminal operators cannot substitute equipment suppliers mid-project without triggering systems integration and interoperability retesting across the full automation stack. That switching friction has favored established full-stack integrators, but the rise of AI-enabled terminal operating system software is pushing loyal operators to evaluate best-of-breed sof
MARKET CONCENTRATION64% CR5Manufacturing scale and integration depth limit new entrant share
AVERAGE SELLING PRICE$2.5-9.5 million per crane unitPrice varies steeply by automation level and equipment category
TOP PRODUCING COUNTRYChina, 28% shareChina retains the largest single national output share
CAPACITY UTILISATION69%Utilisation trails potential given ongoing manufacturing capacity expansion
TRADE INTENSITY64% cross-borderMost equipment crosses a border before final terminal installation
FEEDSTOCK COST SHARE35% of COGSStructural steel and power electronics costs dominate input spending
Commercially, the market splits between a mature base of automated stacking cranes and quay cranes sold through long-standing equipment relationships with terminal operators, and a smaller but faster-growing tier of terminal operating system software and automated guided vehicles sold on documented throughput performance in greenfield and retrofit projects. Large port operators specify software interoperability and cybersecurity documentation in procurement contracts rather than relying on single-vendor specifications.
Over the decade, software depth and interoperability will matter more than crane manufacturing scale alone. Tightening cybersecurity and data interoperability standards will keep raising the qualification bar for automation entrants, and the integrators that build the deepest full-stack relationships across greenfield and retrofit terminal programs stand to capture share of the automation build-out as fleets and yards modernize.
"Terminal automation used to be a hardware conversation about which crane brand you bought. Now the software layer decides who wins the contract, because the crane is only as good as the yard planning system telling it where to go."
Director, Port Infrastructure and Logistics Automation Practice · MMA Constructi

Market Trends

AI-Enabled Terminal Operating Systems Expand Automation's Scope

AI-enabled terminal operating system software is expanding automation's addressable scope well beyond crane and vehicle hardware into yard planning, vessel scheduling, and predictive maintenance optimization, treating software as the primary differentiator rather than a supporting layer. MMA's primary survey found more than 47% of surveyed terminal operations directors have added or are actively adding AI-enabled optimization software to at least one terminal since 2024, a meaningful shift from hardware-first automation strategies. Suppliers including Navis and Cargotec have both expanded dedicated software development teams since 2024 to capture this software-driven demand shift across terminal operators worldwide.
Market Impact: Cited by 53%+ of operations directors
Greenfield Terminal Projects Specify Automation From Initial Design

Greenfield terminal projects across the Middle East and South Asia increasingly specify full automation from initial design rather than retrofitting equipment later, treating automated capability as a baseline requirement for new capacity rather than a phased upgrade path. Several large port authorities have disclosed greenfield automation mandates since 2023 specifically targeting new terminal capacity entering service through the forecast period. Integrators including Cargotec and Konecranes have both expanded dedicated greenfield project teams since 2024 to capture this design-stage demand shift across new port development programs worldwide. Smaller integrators without comparable greenfield experience risk losing these contracts to established full-stack suppliers.
Market Impact: Cited in expansion plans since 2024

Market Opportunities and Growth Drivers

Persistent Dockworker Labor Cost Pressure Drives Automation Investment

Terminal operators across major markets continue facing persistent dockworker labor cost pressure and recurring negotiation disputes that push automation from a discretionary efficiency upgrade toward a structural cost-control strategy embedded in long-term capital planning. MMA's primary survey found more than 53% of surveyed terminal operations directors now cite labor cost and negotiation risk as the primary justification for automation capital requests, a meaningful increase from prior planning cycles focused mainly on throughput. That labor cost pressure is raising automation's priority for terminal operators that previously deferred capital investment toward incremental manual capacity expansion instead.
Market Impact: Compresses margins 7-13 points

Middle East Port Investment Programs Accelerate Automated Capacity

Port authorities across Saudi Arabia and the broader Gulf region continue expanding automated terminal capacity at a pace that outstrips most other regional markets, driving proportional demand for full-stack automation equipment and software across new terminal developments. Several large regional port authorities have disclosed automated capacity expansion plans since 2024 specifically targeting Vision 2030 economic diversification and transshipment hub development goals. That expansion requires automation integrators holding proven full-stack delivery track records across multiple international terminal programs simultaneously, favoring established global suppliers over regional manufacturers whose deployment portfolio covers a narrower set of terminal configurations.
Market Impact: Integration can exceed $80 million

Market Restraints and Challenges

Structural Steel and Power Electronics Cost Volatility Compresses Margins

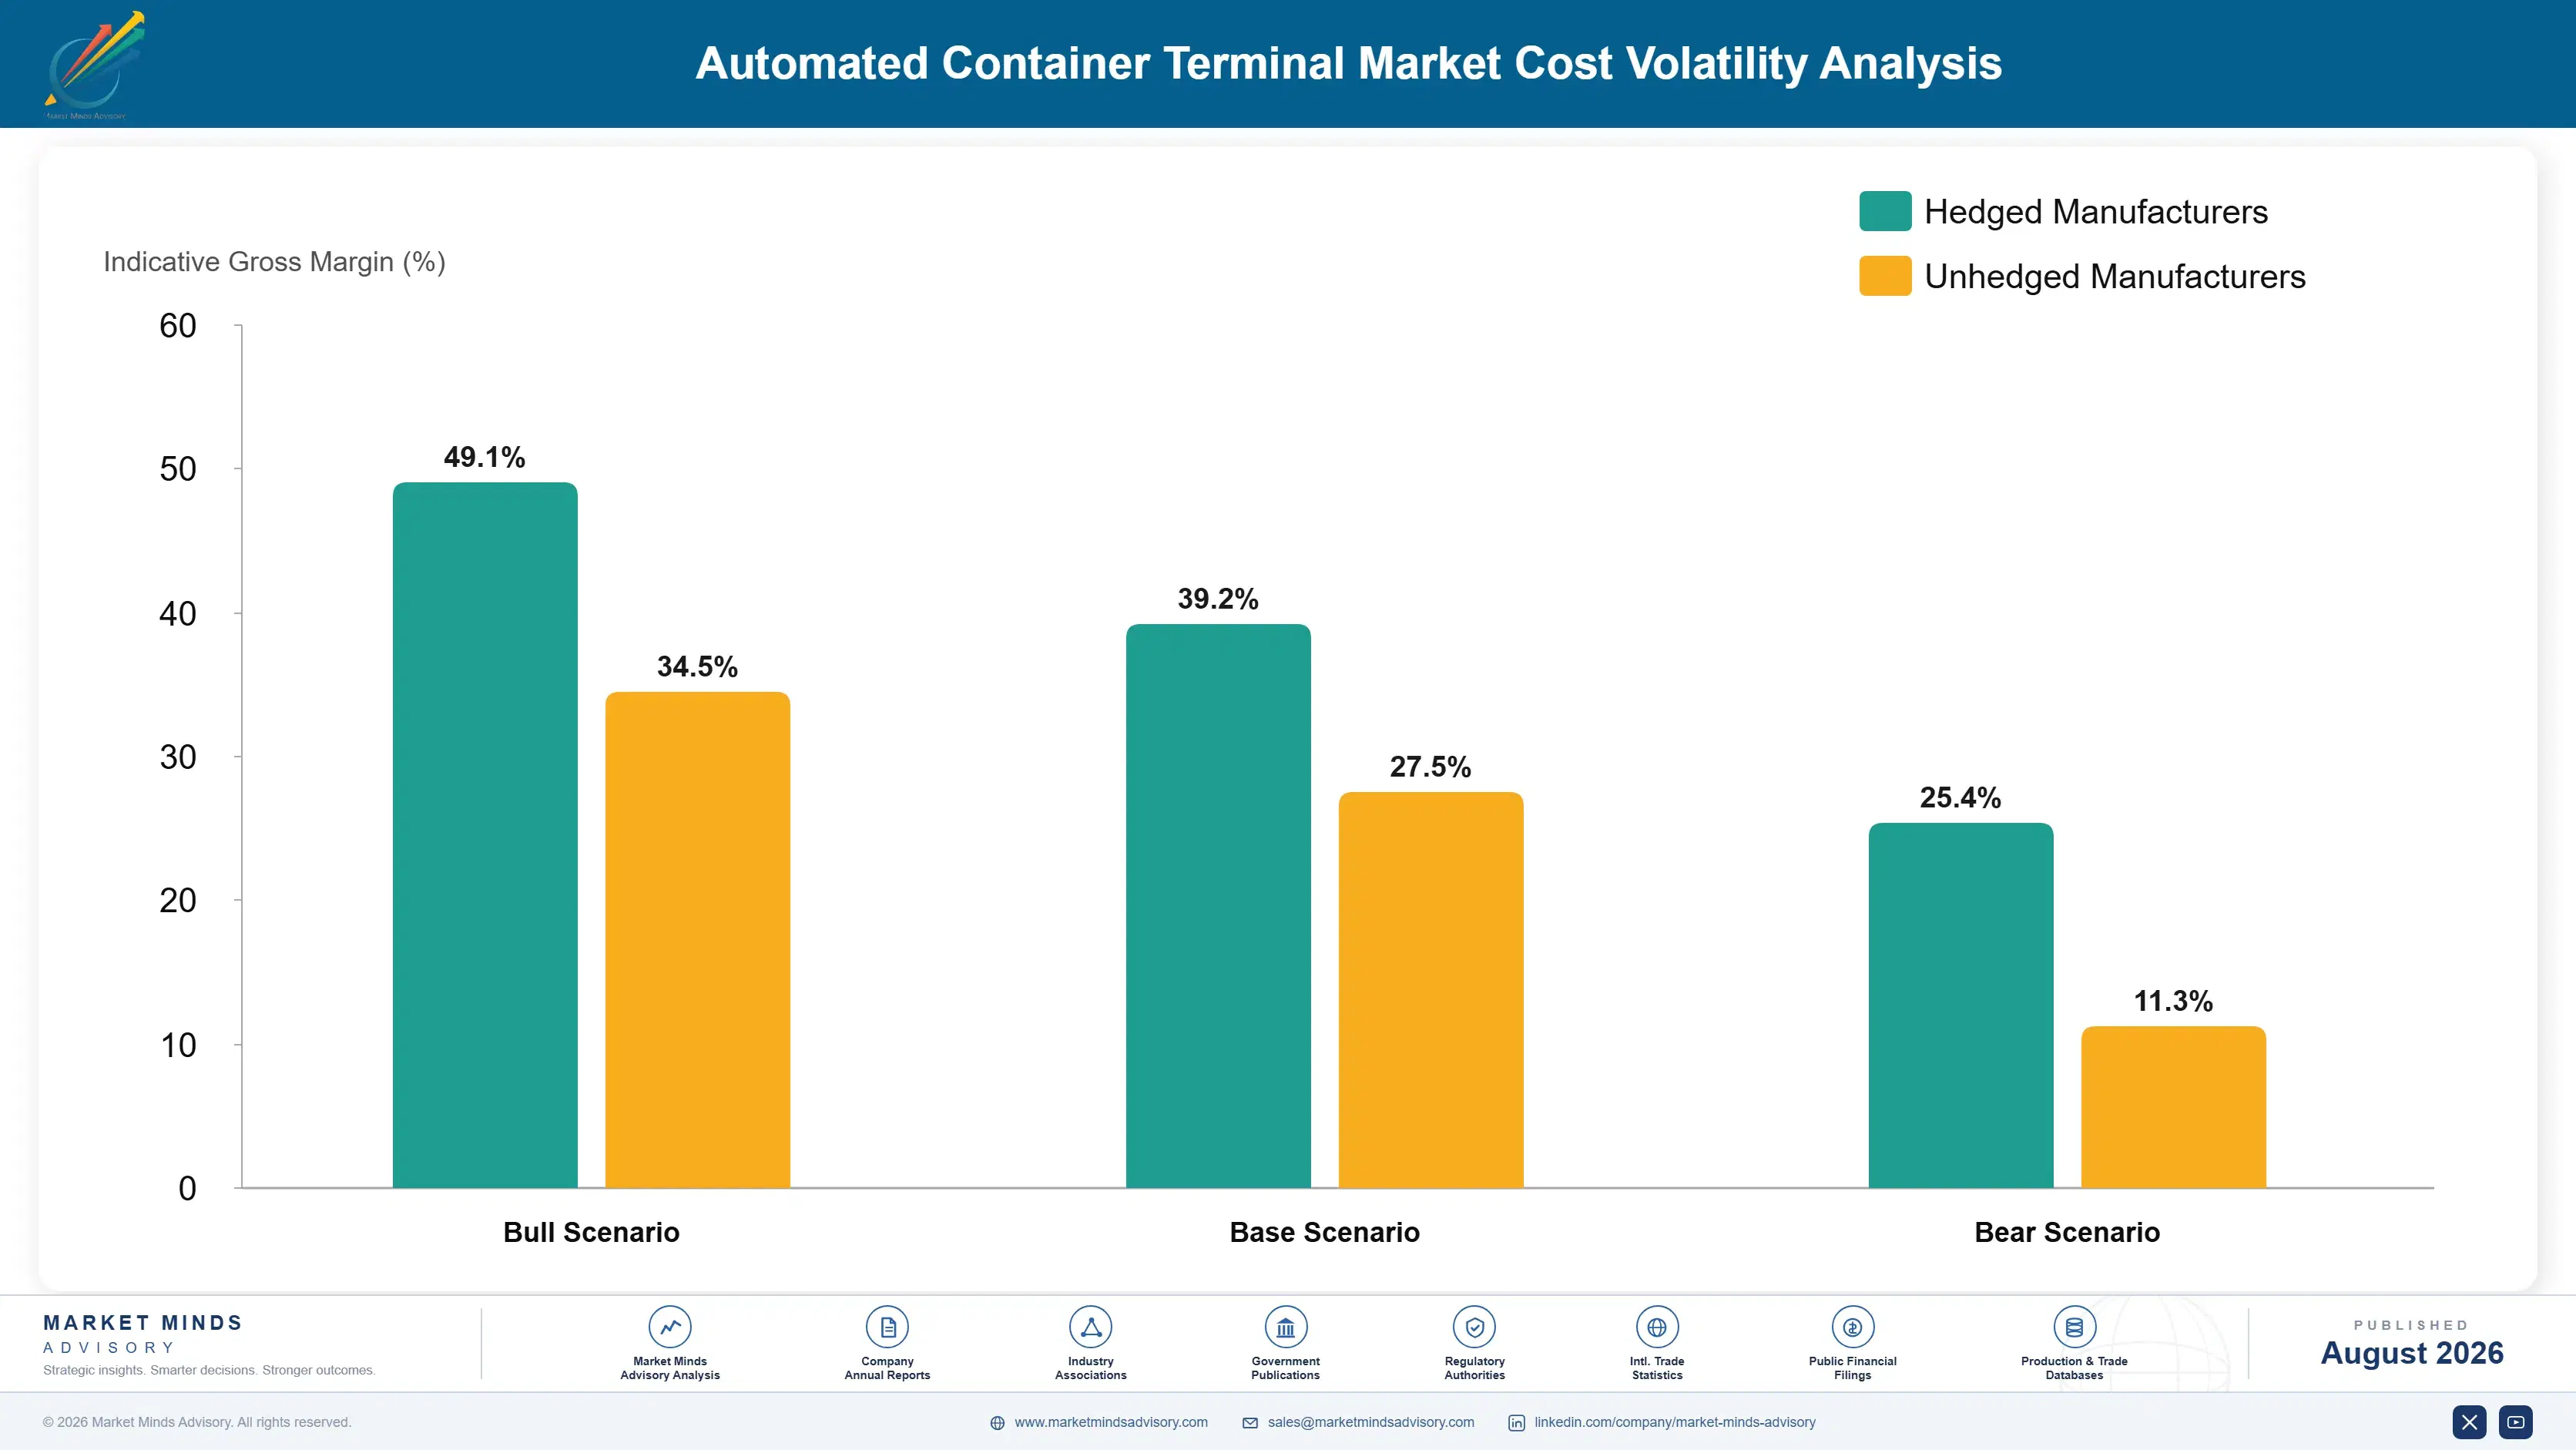
Structural steel and power electronics components account for roughly 35% of cost of goods sold, and their price tracks global metals and semiconductor supply chains that equipment manufacturers cannot easily pass through given long-term terminal supply contracts negotiated years in advance. That exposure, rooted in the components' dependence on global commodity and semiconductor market cycles rather than any single manufacturer's pricing decision, compresses margins hardest for smaller integrators without integrated component sourcing or long-term hedging contracts. Larger manufacturers are responding by pursuing direct component supply agreements to protect margin during future volatility.
Market Impact: Cited by 47%+ of operations directors

Systems Integration Complexity Slows Regional Integrator Entry

Delivering a full-stack terminal automation project across cranes, vehicles, and software requires systems integration and interoperability testing that can take eighteen months to three years and cost well into eight figures per terminal, a barrier that keeps smaller regional integrators from competing in the highest-value full-scope automation categories that major port operators require. That complexity, a direct consequence of the rigorous interoperability and cybersecurity testing operators require following past automation deployment failures at unrelated terminals, favors incumbents with existing full-stack delivery portfolios. Smaller integrators are responding by focusing on single-category equipment supply instead of pursuing full-stack systems integration contracts.
Market Impact: Greenfield mandates disclosed since 2023
3 additional market trends, 4 additional growth drivers, and 3 additional restraints and challenges are covered in the full report. Contact sales@marketmindsadvisory.com to access the complete intelligence.

Segment CAGR and Growth Architecture

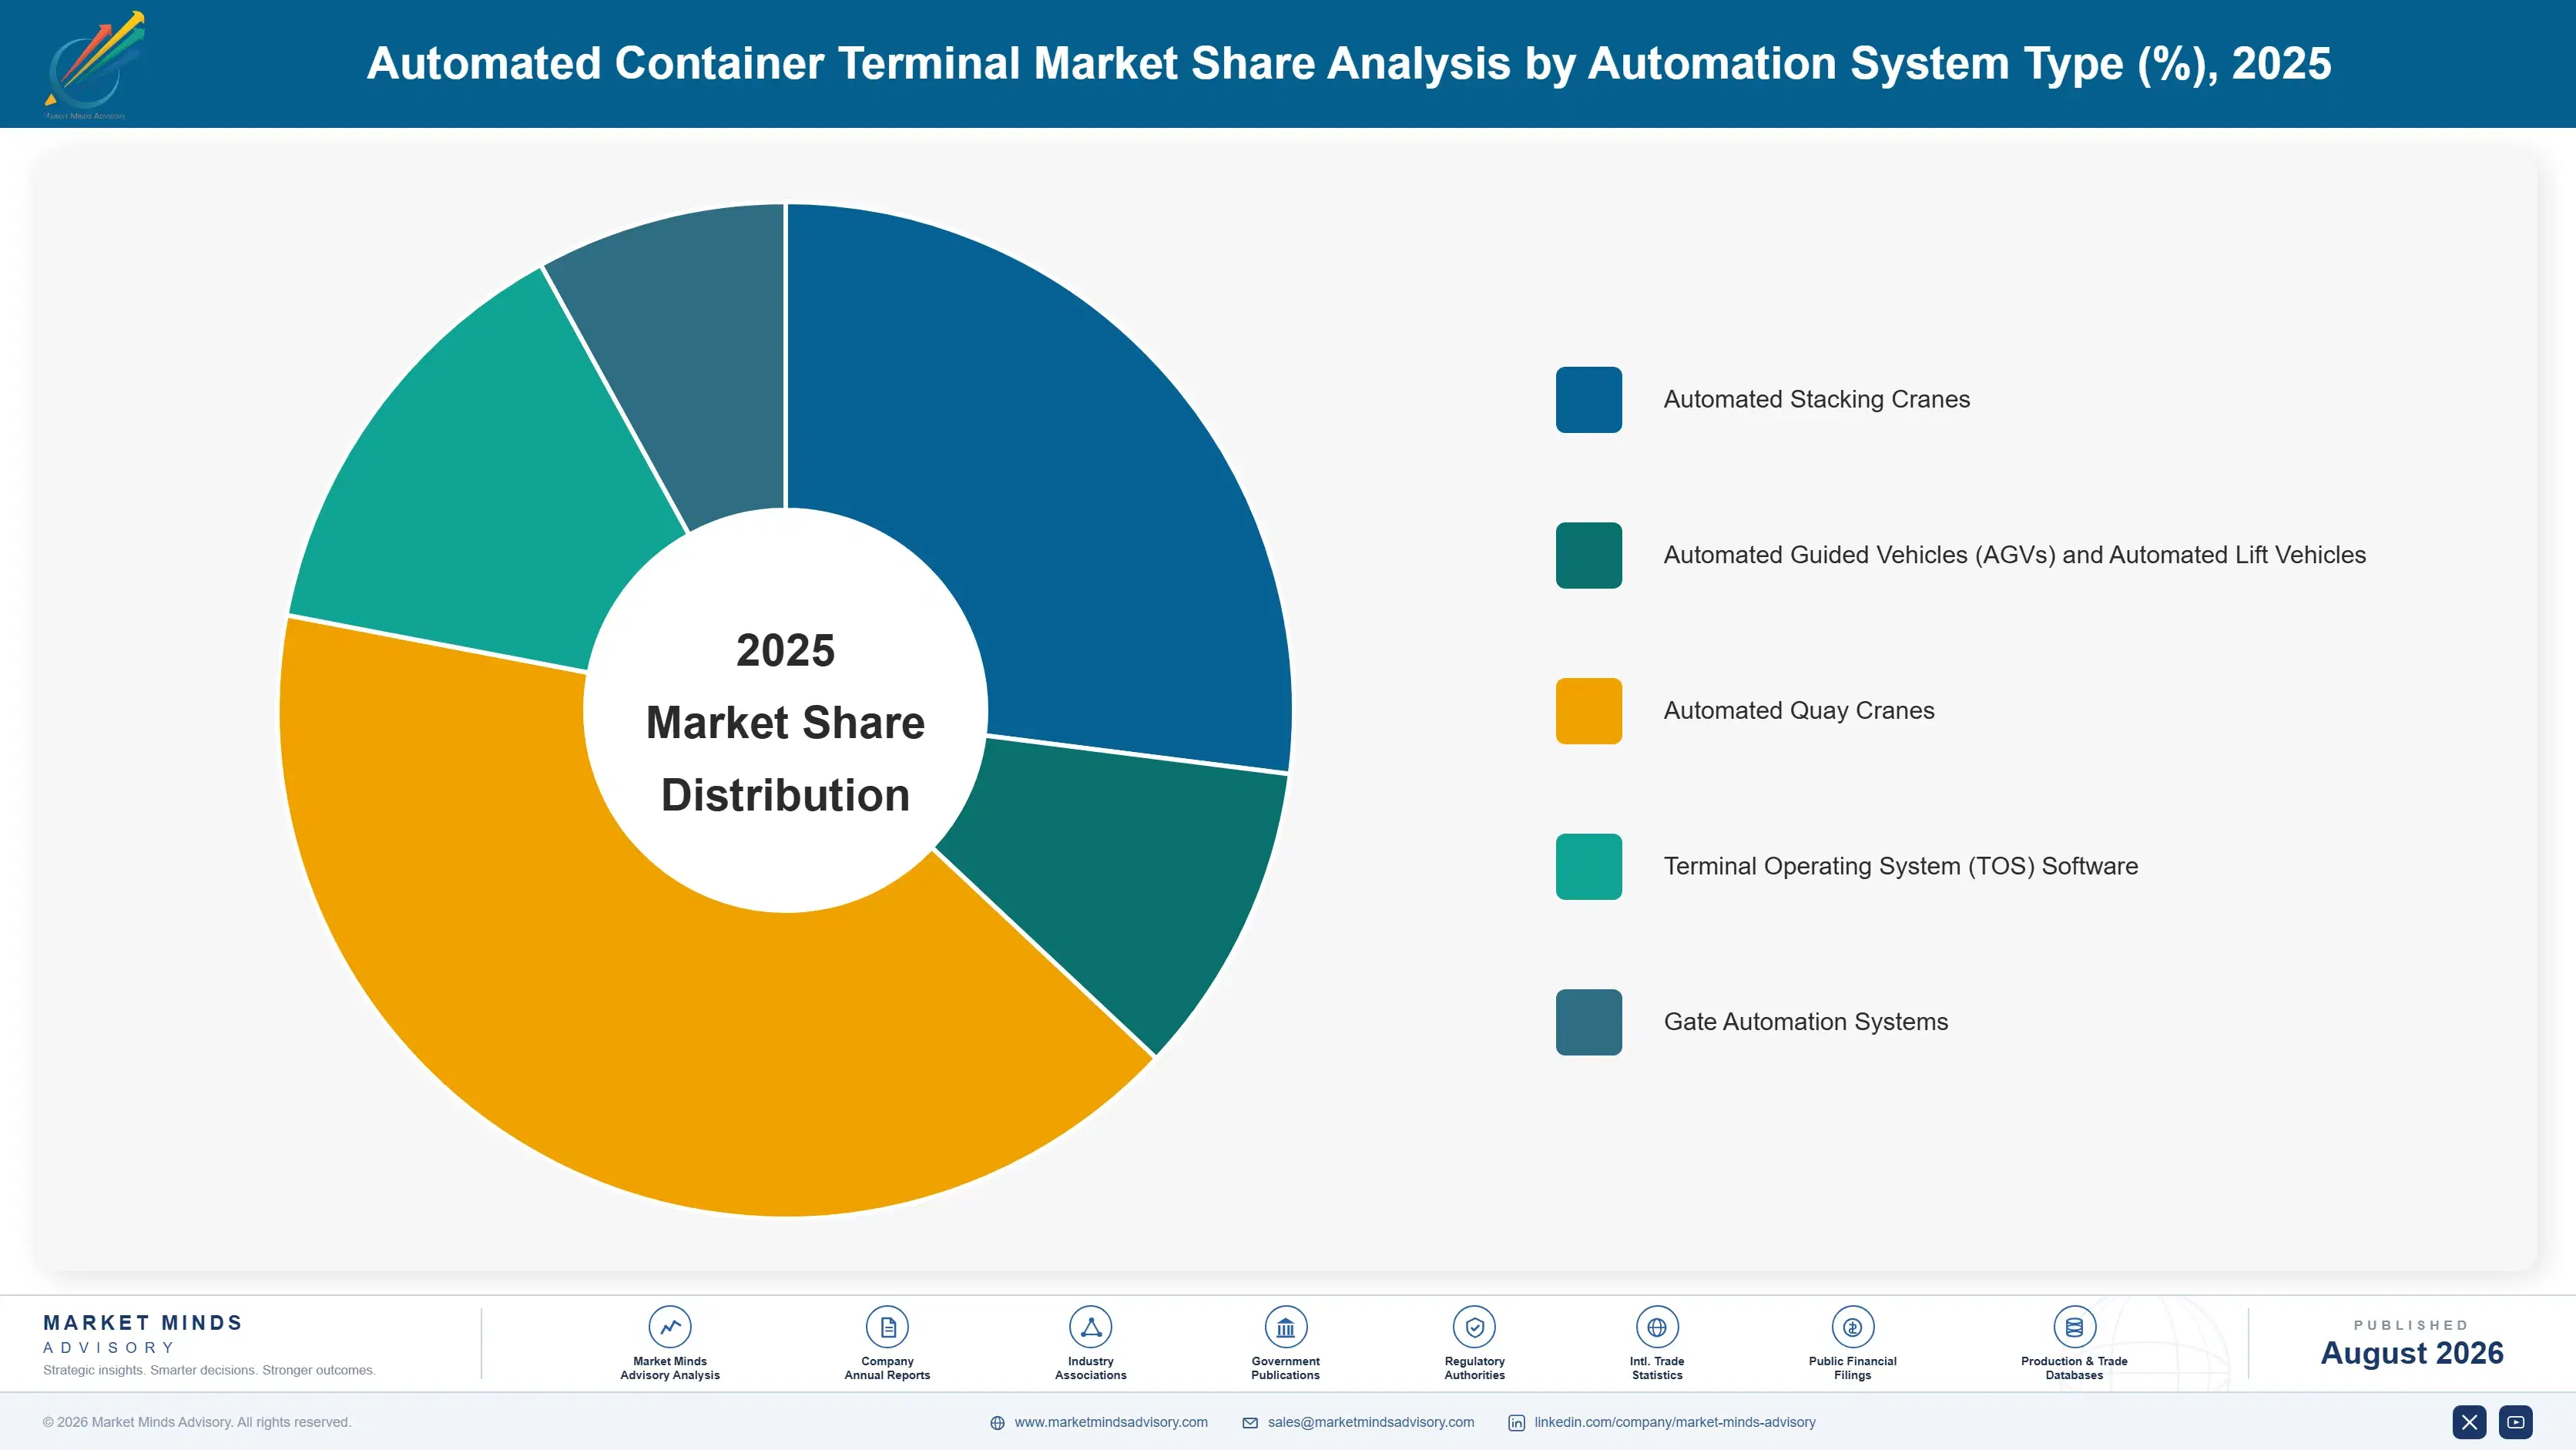
Segmentation follows automation system type rather than terminal ownership model, since the specific automation function a system delivers determines which procurement budgets and integration pathways apply more than which operator ultimately runs the terminal. Automated stacking cranes remain the legacy base, but terminal operating system software and automated guided vehicles now address throughput requirements older equipment cannot satisfy.
automated-container-terminal-market-market-share-analysis-1787301224145

Terminal Operating System (TOS) Software

Terminal operating system software is the fastest-growing segment, expanding at an estimated 13.2% CAGR against a market average of 9.6%, roughly 1.38 times the overall pace. Growth tracks with AI-enabled yard optimization and cloud-based deployment models that require software capable of coordinating cranes, vehicles, and vessel scheduling simultaneously across complex terminal operations. Navis and Cargotec lead on deployed terminal operating system installations, though the segment requires more cybersecurity and interoperability certification than legacy hardware given its central coordinating role across the automation stack. Continued adoption depends on greenfield and retrofit project volume climbing across major port development programs through the forecast period. ABB and Konecranes are both investing in expanded software development capacity to meet this faster-growing demand.
CAGR 13.2%

Automated Guided Vehicles (AGVs) and Automated Lift Vehicles

Automated guided vehicles and automated lift vehicles rank second-fastest, growing at an estimated 11.4% CAGR as horizontal transport automation expands steadily beyond the early-adopter terminals that pioneered the technology two decades ago. The segment benefits from terminal operators increasingly specifying automated vehicle fleets for container movement between quay and yard, where continuous operation improves throughput reliability over driver-dependent alternatives. Adoption still trails automated stacking cranes by a meaningful margin given higher fleet management complexity and more extensive safety certification requirements than fixed crane installations demand. Growth is concentrated among suppliers including Toyota Industries and Cargotec that have expanded automated vehicle capacity to meet operator demand for simplified fleet deployment. Regional Asian manufacturers are also entering this category with lower-cost platforms.
CAGR 11.4%
Full segment breakdown across 5 segments available in the complete report.

Regional Architecture and Country Demand Map

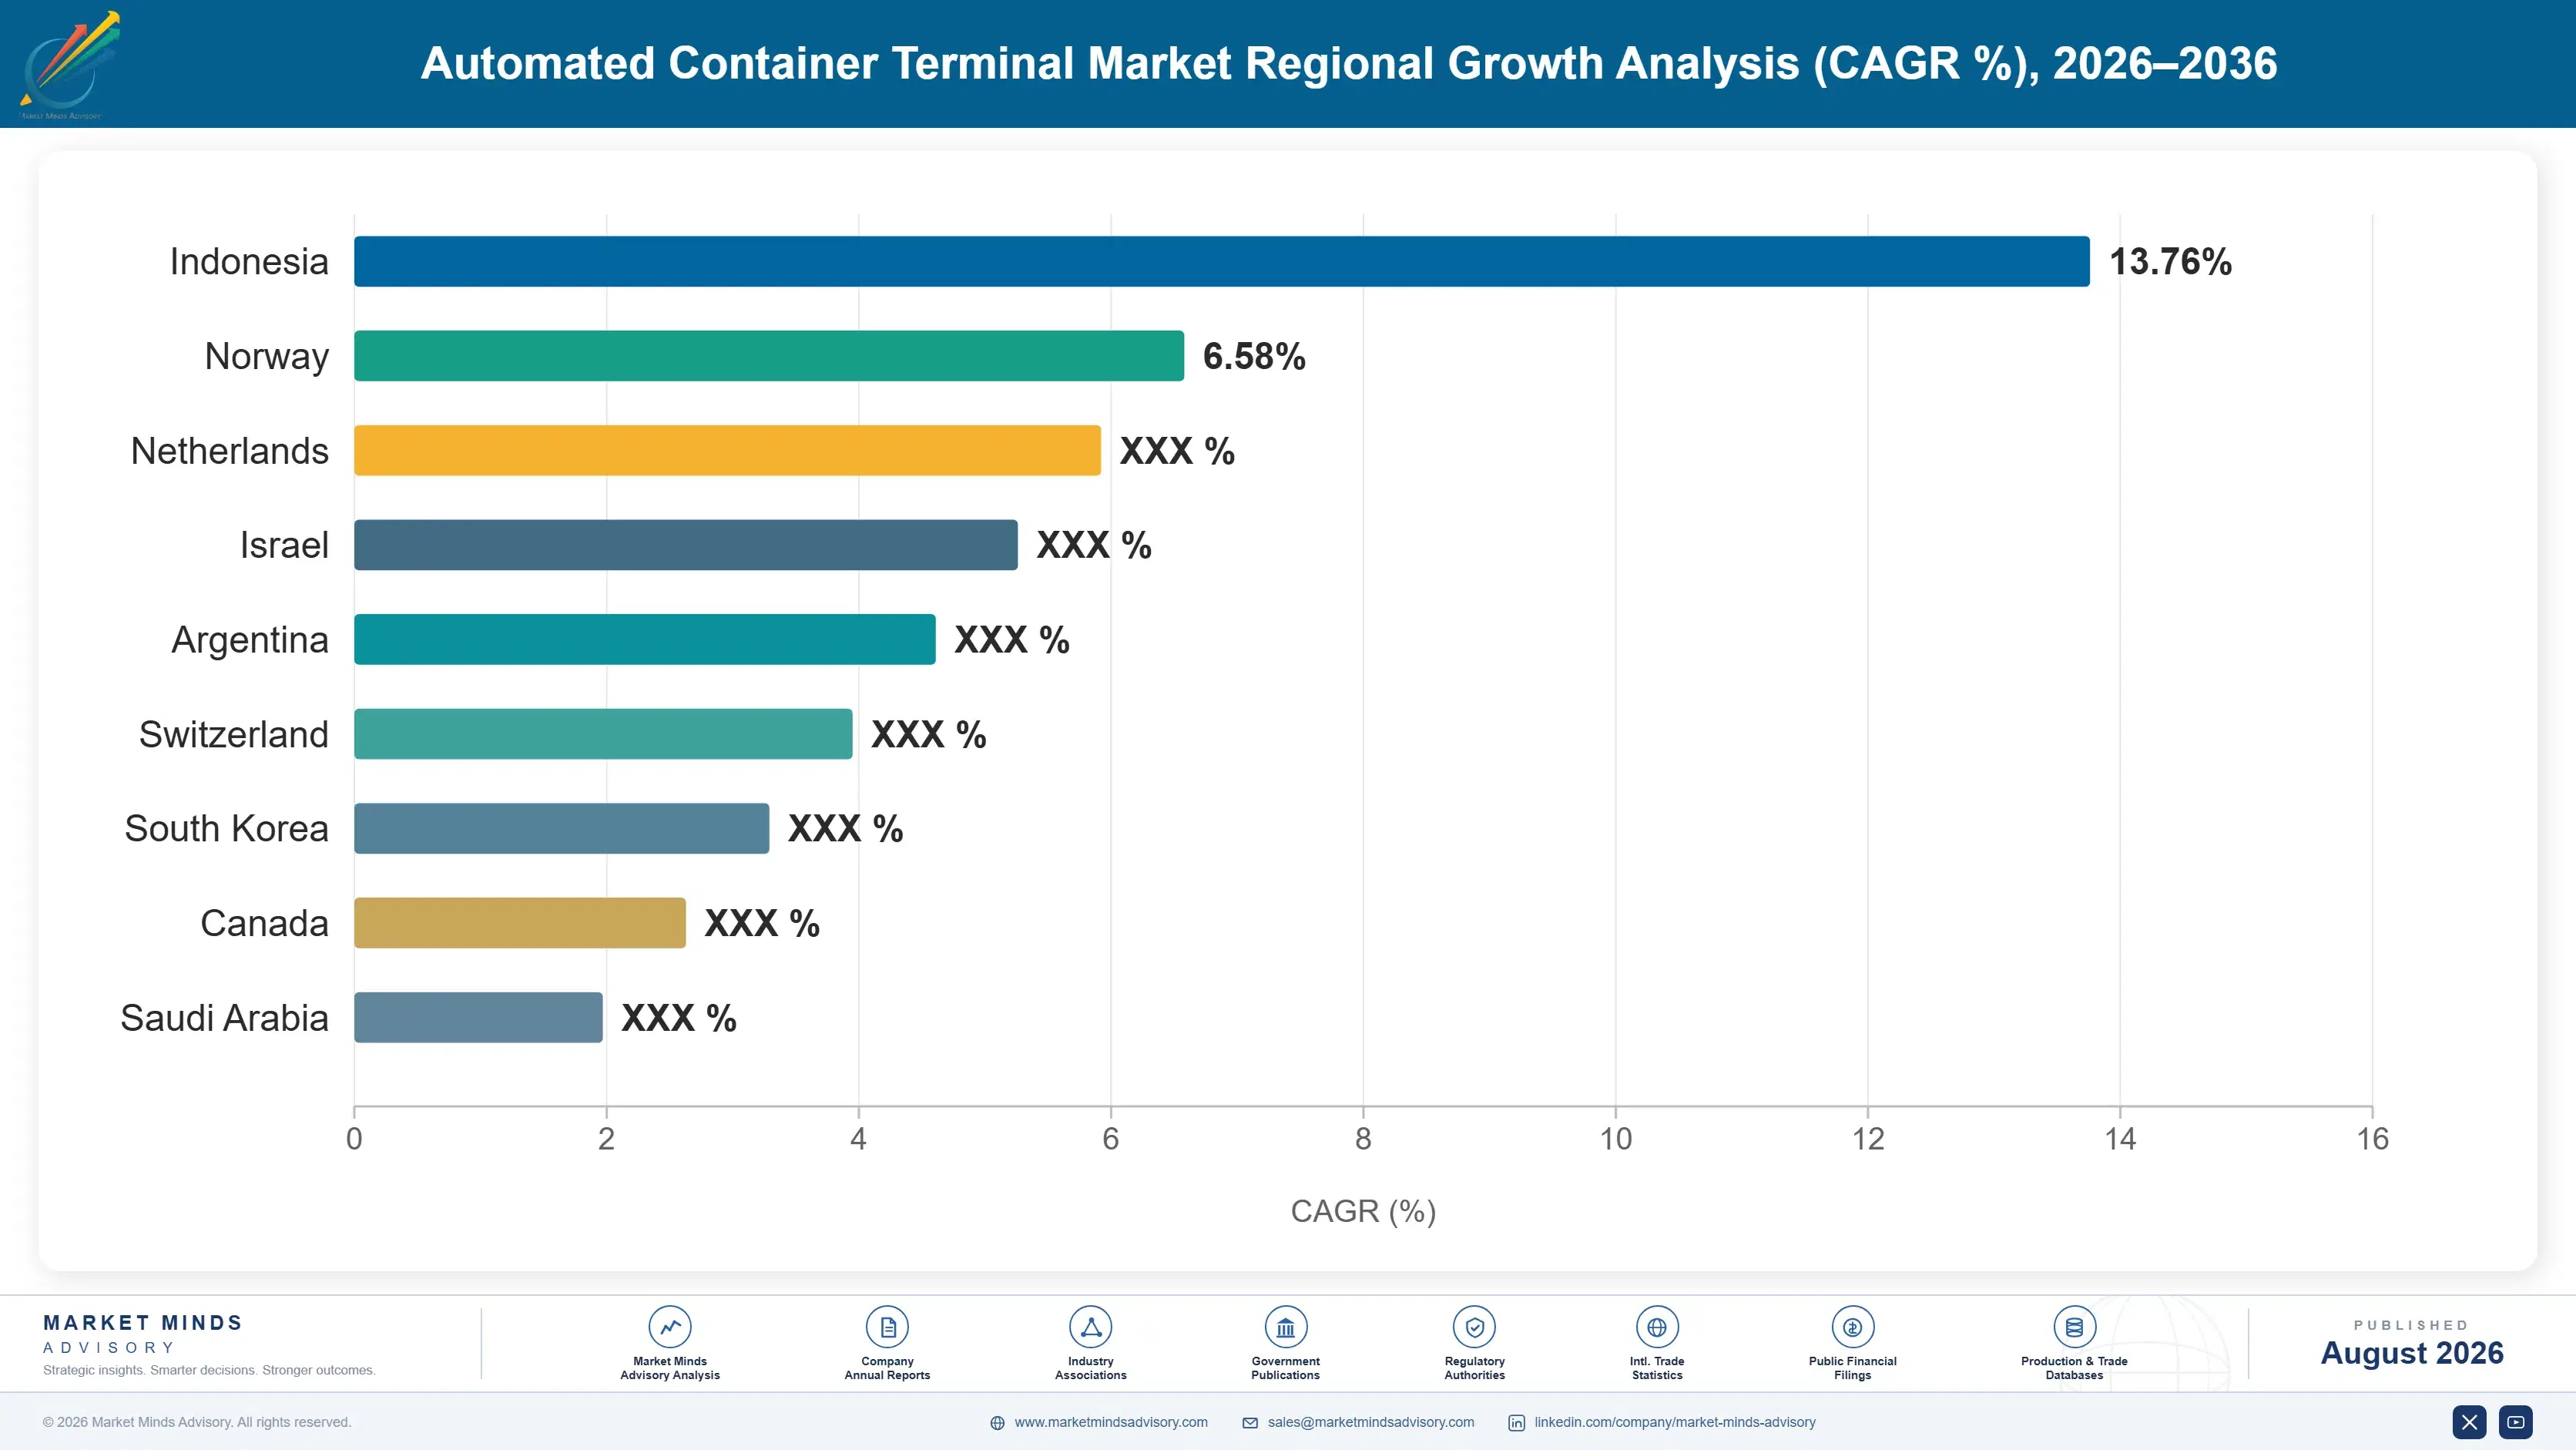
Automated container terminal demand concentrates where crane manufacturing scale and port investment programs overlap. East Asia leads on manufacturing concentration and deployment density, South Asia and Pacific follows on expanding greenfield programs, and Middle East and Africa grows fastest as national diversification investment accelerates across new terminal capacity.

East Asia

China accounts for the largest share of East Asia's automated container terminal demand, driven by Shanghai Zhenhua's overwhelming global crane manufacturing scale and the country's concentration of fully automated terminal deployments at Qingdao and Shanghai Yangshan. China's port authorities have expanded automated terminal capacity substantially since 2023, pulling equipment demand forward as domestic operators pursue throughput leadership over regional competitors. Japan and South Korea contribute a smaller but higher-value share, where established Mitsui E&S manufacturing base and demanding domestic operator practices favor premium, well-certified automation platforms over unproven alternatives. Capacity additions across China since 2023 have kept East Asia the clear manufacturing and deployment center of the industry even as software integration increasingly happens closer to individual terminal operators worldwide.
Share: 30% | CAGR: 10.7% (2026 to 2036)

North America

The United States accounts for the large majority of North America's automated container terminal demand, anchored by major West Coast port automation programs and the concentration of large terminal operators managing capital planning across multiple facilities. Large US terminal operators increasingly specify software interoperability and cybersecurity documentation directly in procurement contracts, favoring established integrators with proven full-stack delivery track records over regional suppliers with narrower deployment portfolios. Canada contributes a smaller, steadier share tied to its own port modernization programs at Vancouver and Montreal. Mexico's contribution grows fastest of the three as nearshoring-driven trade volume growth expands automated terminal investment closer to US supply chain networks and reduces logistics costs for cross-border container movement.
Share: 22% | CAGR: 10.1% (2026 to 2036)
Regional intelligence for 5 additional markets available in the complete report: Western Europe, South Asia and Pacific, Latin America, Middle East and Africa, Eastern Europe. Contact sales@marketmindsadvisory.com.
automated-container-terminal-market-country-cagr-analysis-1787301224661

Where Terminal Automation Margin Concentrates Next

Four commercial moves separate automation integrators capturing outsized margin from those competing purely on delivered equipment price. Each depends on shifting revenue toward software platform depth, greenfield project management, predictive maintenance service, or multi-terminal supply agreements that current shipment volume does not yet fully reflect, particularly as operators formalize automation procurement strategies industry-wide each year.

Terminal Operating System Software Platform Investment Program

Integrators that build and maintain software platforms capable of coordinating cranes, vehicles, and vessel scheduling simultaneously are capturing the growing share of demand that software depth, not just equipment manufacturing, now specifies by name. A single new software platform deployment can cost $5 million or more and take up to eighteen months to fully integrate, but each deployed platform then commands demand that hardware-only competitors are effectively barred from serving in the most sophisticated automation programs. Integrators without software platform depth increasingly lose the highest-value full-stack accounts entirely, making platform depth a durable advantage rather than a one-time cost.
Market Impact: Locks in demand across 68% of full-stack accounts

Greenfield Terminal Project Management Support Services

Integrators offering structured greenfield project management, helping port authorities coordinate equipment delivery against construction schedules and commissioning milestones, are capturing service revenue that unstructured equipment suppliers cannot offer. A dedicated greenfield project management engagement typically adds 15 to 25% to base equipment contract revenue through bundled commissioning support and training fees, reflecting the specialized program management labor required to support authorities through multi-year terminal build-outs. This service model matters most for port authorities managing greenfield automation for the first time. Authorities that skip this support often face costly commissioning delays during terminal launch.
Market Impact: Adds 15 to 25% to base contract revenue

Predictive Maintenance and Uptime Support Program

Integrators offering dedicated predictive maintenance support, including sensor-based equipment health monitoring and uptime guarantee programs for automated cranes and vehicles, are capturing higher-margin business than commodity equipment sellers offering hardware alone without ongoing service support. A predictive maintenance program typically carries annual fees of $800,000 to $3.5 million depending on terminal size and equipment fleet complexity, in addition to the recurring per-unit equipment revenue that follows over the contract term. This service model matters most for operators running twenty-four-hour automated operations without established internal maintenance infrastructure. Operators that skip this support often face costly unplanned downtime during peak shipping seasons.
Market Impact: Annual fees run $800,000 to $3.5 million per terminal

Multi-Terminal Framework Supply Agreement Program Development

Integrators securing multi-year framework supply agreements with large terminal operators managing multiple facilities, often tied to specific fleet standardization or expansion milestones, are capturing volume commitments that protect against price-only competition from integrators without comparable operator relationships built over years of reliable, on-specification delivery. These framework agreements typically carry a price premium of 6 to 13% over spot-market purchasing, reflecting the value operators place on guaranteed supply and standardized equipment across their global terminal networks. Integrators able to demonstrate reserved production capacity increasingly win these agreements over lower-cost competitors lacking comparable global delivery scale.
Market Impact: Commands 6 to 13% premium over spot pricing

Who Controls the Margin Pool

The top five integrators hold an estimated 64% of global automated container terminal shipment volume, a higher concentration than port equipment categories, reflecting the systems integration and manufacturing scale requirements that keep suppliers from entering the automation markets. Cargotec and Shanghai Zhenhua lead on manufacturing scale and integration depth, while a tier of suppliers competes on price for equipment supply.
Current competitive activity centers on three fronts. Terminal operating system software expansion is redrawing the tier, with Navis, Cargotec, and ABB racing to secure greenfield software platform contracts. Predictive maintenance service build-out is becoming a differentiator among integrators targeting operators managing automated fleets. And Chinese and South Korean manufacturers are pursuing certification and Western integrator partnerships to move beyond equipment supply into integration competition.

Emerging pressure comes from Chinese and South Korean manufacturers moving up the value chain into certified, full-stack integration categories once dominated by Western specialists, aided by domestic component supply that keeps their production costs lower. If regional manufacturers close the integration gap, expect share to shift, particularly in South Asia and the Middle East where greenfield project economics run more favorably than at North American and European operator accounts.
automated-container-terminal-market-company-positioning-matrix-1787301225193

Competitive Moat and Risk Dimensions

CARGOTEC CORPORATION

Moat: Full-Stack Integration Depth

Cargotec's Kalmar brand built the industry's broadest full-stack automation portfolio spanning cranes, vehicles, and terminal operating system software over more than two decades, a depth smaller integrators cannot replicate quickly, and its established operator relationships give it project priority that regional competitors cannot match at comparable speed or integration completeness.
CARGOTEC CORPORATION

Risk: Chinese Manufacturing Cost Gap

Cargotec's premium integration model depends on operators valuing full-stack software depth enough to pay meaningfully more than Chinese manufacturing-led alternatives, and that willingness to pay could erode as Chinese integrators close the software capability gap while retaining a substantial manufacturing cost advantage built on domestic component supply.
SHANGHAI ZHENHUA HEAVY INDUSTRIES CO.

Moat: Global Crane Manufacturing Scale

Shanghai Zhenhua supplies the large majority of the world's ship-to-shore and automated stacking cranes, giving it manufacturing scale and cost advantages that Western integrators cannot match, backed by domestic steel and component supply chains that keep production costs consistently lower across every crane category it manufactures.
SHANGHAI ZHENHUA HEAVY INDUSTRIES CO.

Risk: Software Platform Depth Lags

Shanghai Zhenhua's manufacturing scale advantage does not yet extend to terminal operating system software depth, leaving room for software-focused competitors including Navis and Cargotec to capture the highest-margin coordination layer even on terminals where Shanghai Zhenhua supplies the underlying crane hardware. That software gap could narrow Shanghai Zhenhua's long-term margin capture even as its hardware volume keeps climbing steadily.

Players Tracked

Prominent Players

Cargotec Corporation
Konecranes plc
Shanghai Zhenhua Heavy Industries Co.
Liebherr Group
ABB Ltd

Other Key Players

Siemens AG
Navis LLC
Camco Technologies
TMEIC Corporation
Identec Solutions
Toyota Industries Corporation
Hyster-Yale Materials Handling Inc.
Terex Corporation
Doosan Corporation
Mitsui E&S Co.
Sany Heavy Industry Co.
Anhui Heli Co.
Vahle Group
ELME Spreader AB
Q-Free ASA

Recent Developments

MARCH 2025

Navis Expands Terminal Operating System Deployment Across Additional Greenfield Projects

Navis LLC secured deployment contracts for its terminal operating system software across three additional greenfield automated terminal projects, expanding the operator accounts its platform can support. The deployment followed sixteen months of interoperability testing across multiple equipment vendor partnerships worldwide, ahead of the originally proposed commissioning timeline.
Signal: Signals software platform breadth becoming a primary competitive battleground among terminal operating system vendors targeting greenfield accounts nationwide.
SEPTEMBER 2024

Shanghai Zhenhua Commissions Additional Automated Crane Production Capacity

Shanghai Zhenhua Heavy Industries Co. commissioned additional automated stacking crane production capacity at its China facility, expanding dedicated output for greenfield terminal demand across major port authority accounts. The expansion followed order backlog growth as Middle East and South Asian authorities finalized capacity plans through 2024 and into 2025.
Signal: Signals greenfield demand outpacing existing certified production capacity and pressuring smaller manufacturers across the industry this cycle.
JANUARY 2025

Cargotec Acquires Regional Predictive Maintenance Service Provider

Cargotec Corporation acquired a regional automated equipment predictive maintenance and uptime monitoring service provider to strengthen its operator support offering, targeting terminal operators managing large automated fleets facing tightening uptime requirements. The acquired provider continues operating under its existing brand within Cargotec's broader corporate structure following the transaction's close.
Signal: Signals large diversified automation integrators entering maintenance services through acquisition rather than organic development across the industry.

Structural Steel and Power Electronics Exposure

Structural steel and power electronics components account for roughly 35% of cost of goods sold in automated container terminal equipment manufacturing, with production concentrated among a handful of qualified heavy industrial suppliers capable of aerospace-adjacent electronics purity and structural performance. Software development and systems integration labor add a further share, sourced predominantly from specialized controls engineering and cybersecurity staff regardless of manufacturer lo
Structural steel prices spiked sharply during 2022 as global metals market disruption tied to broader supply chain volatility constrained available volume, with several manufacturers reporting input cost increases exceeding 41% in their 2022 annual reports before pricing stabilized through 2023. Industry supply chain reviews have flagged structural steel and power electronics production as sensitive to both global commodity cycles and the specialized semiconductor capacity required for automation-grade control systems.

Smaller regional manufacturers without long-term component supply agreements absorbed the 2022 price spike hardest, losing contract bids to larger suppliers including Shanghai Zhenhua and Cargotec that had negotiated priority pricing and, in several cases, invested directly in component sourcing partnerships. Manufacturers with secured upstream sourcing weathered the volatility better than those dependent on the open market, a cost advantage that persists across East Asian and European producing regions.
automated-container-terminal-market-cost-volatility-analysis-1787301225390

Multi-Year Component Supply Agreements

Larger manufacturers are locking multi-year structural steel and power electronics supply agreements directly with qualified producers, trading some pricing flexibility for guaranteed volume and price stability that protects margin during future sourcing volatility, an increasingly standard practice among the top five suppliers following the 2022 shortage experience. Smaller manufacturers are pooling procurement through industry consortiums to negotiate comparable terms.

Direct Upstream Sourcing Partnerships

Several larger manufacturers are investing directly in upstream component sourcing partnerships rather than purchasing entirely on the open market, reducing exposure to material price swings and improving supply reliability, though this requires higher fixed capital investment than pure equipment assembly operations require. That investment pays back within four to six years given the volatility component pricing has shown.

Regional Supplier Qualification Diversification Strategy

Manufacturers are qualifying multiple regional component sources across East Asia, Europe, and North America rather than depending on a single production region, reducing exposure to any single geography's supply disruption while adding modest logistics complexity to sourcing operations across the manufacturing network. This approach raises base material costs by two to four percent but improves supply continuity during regional disruptions.

Portfolio Architecture for Margin Defence

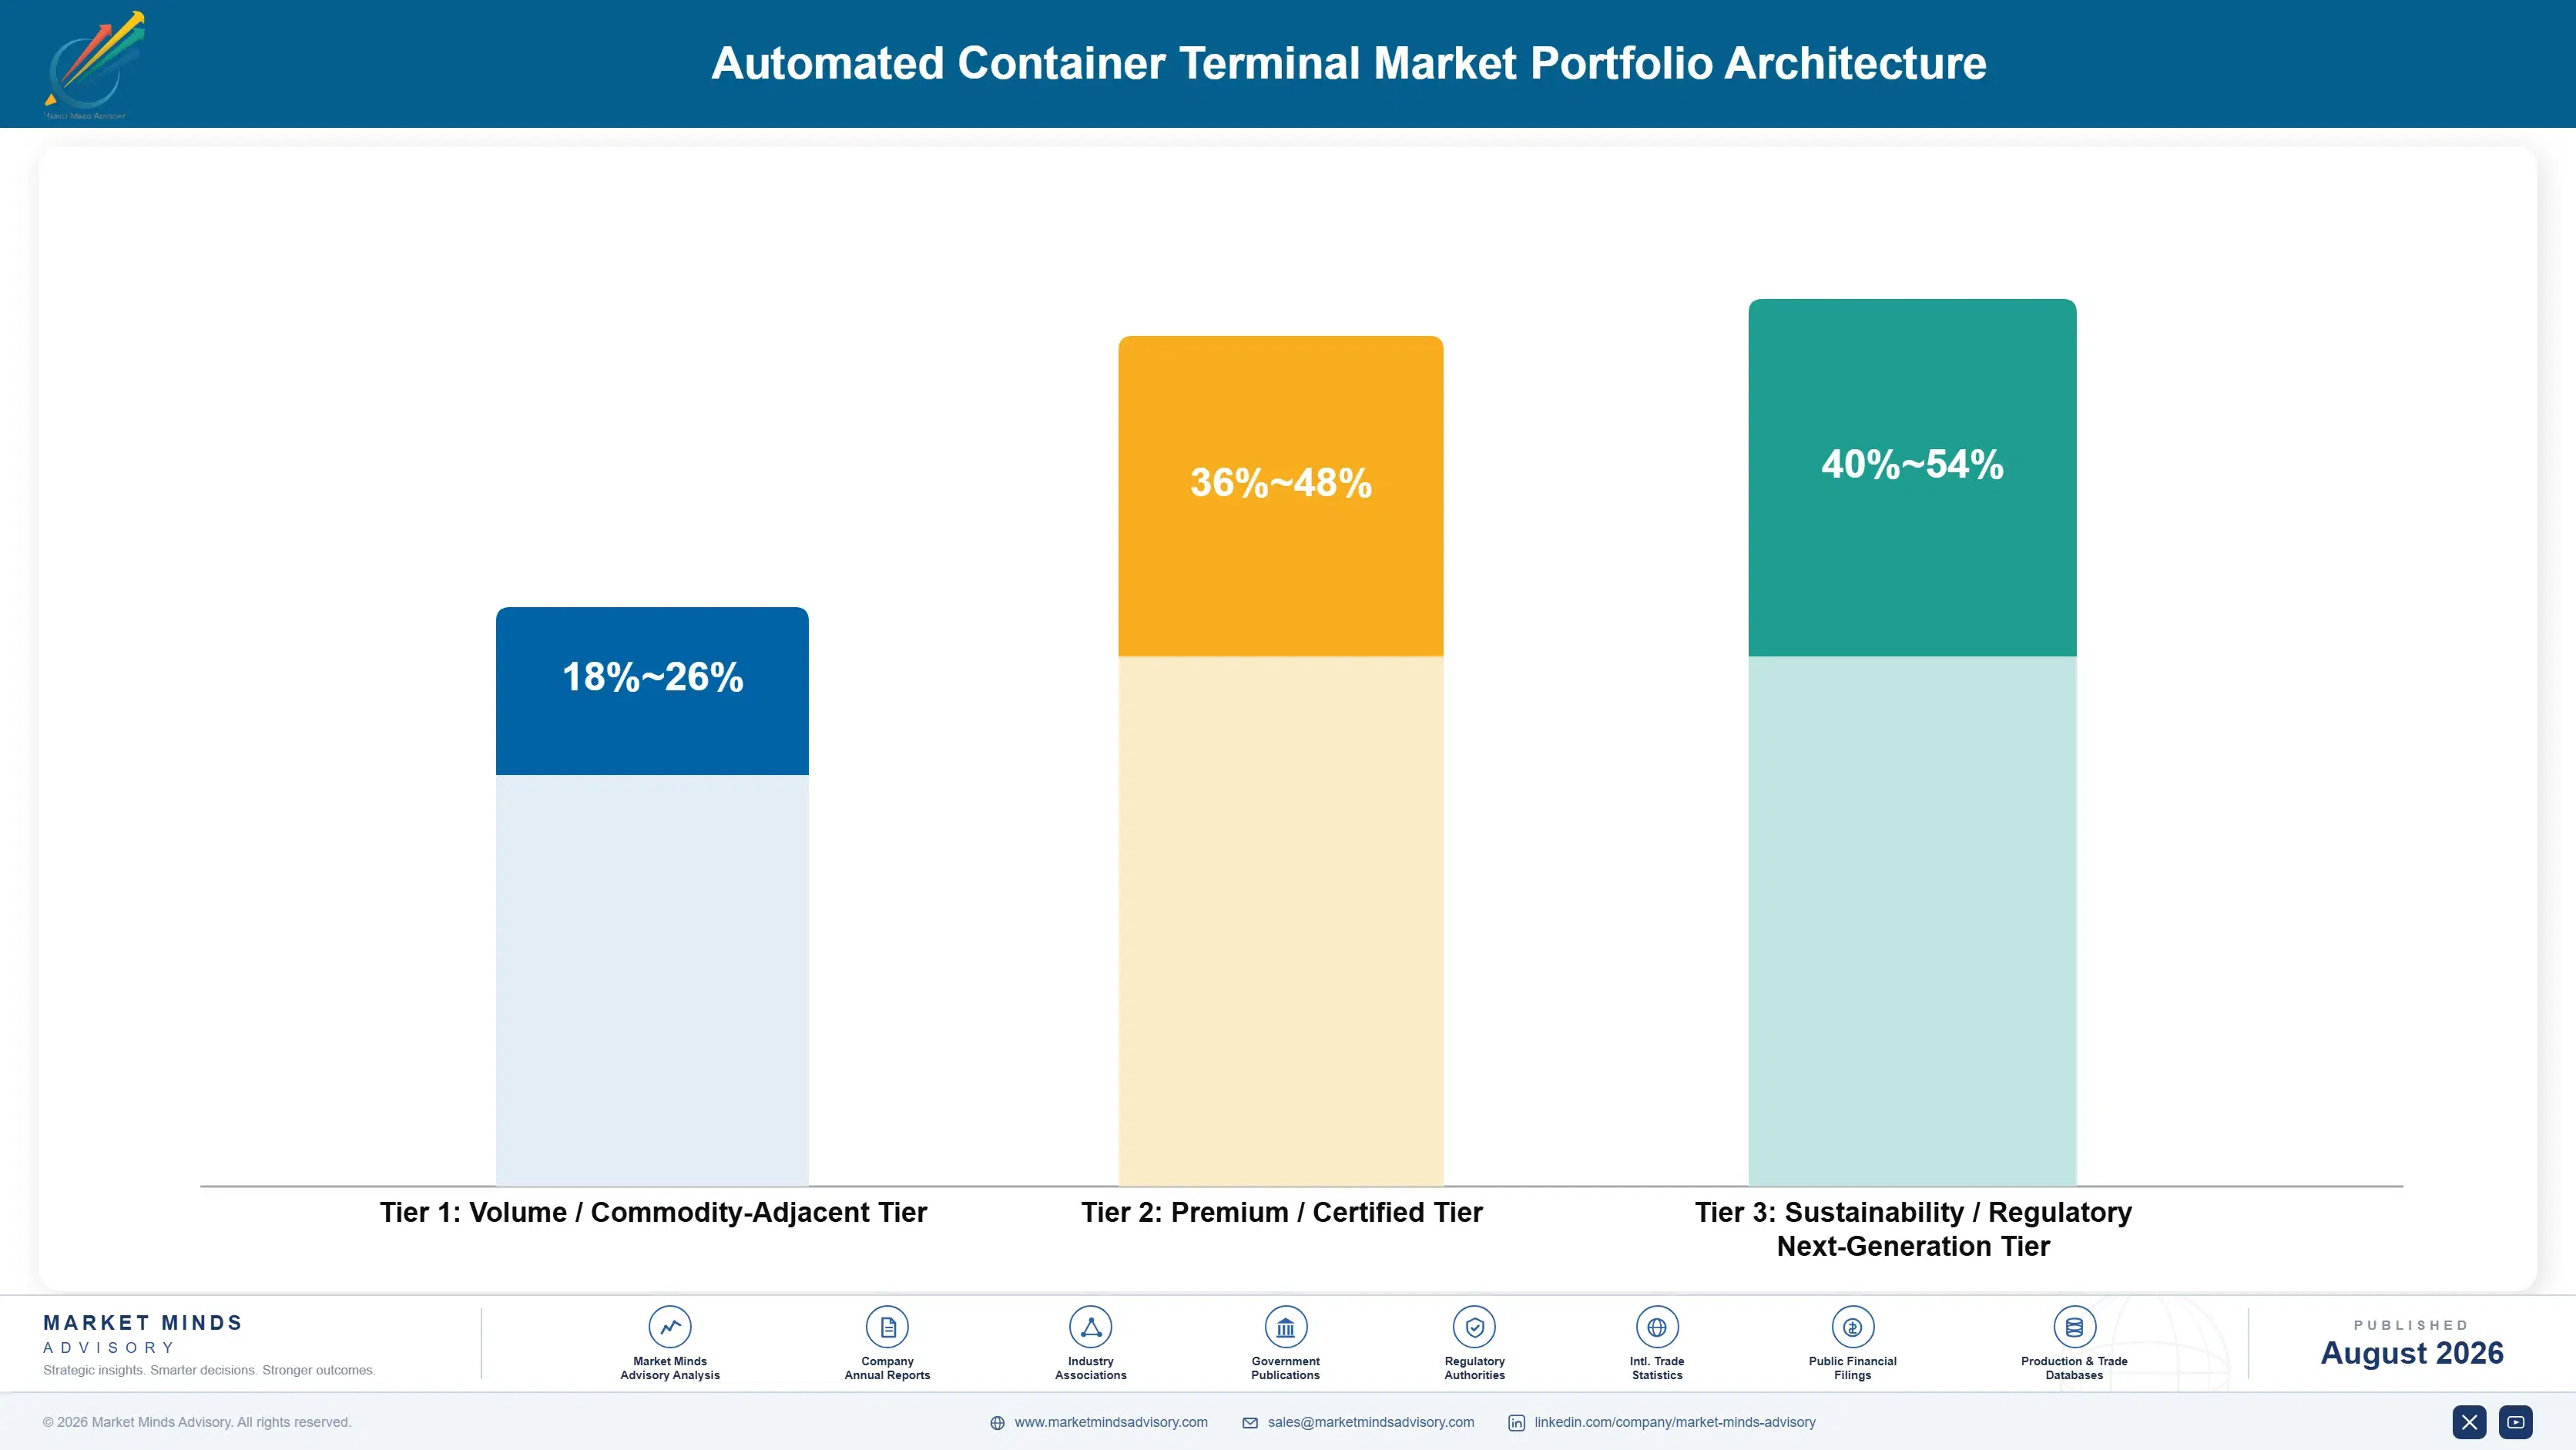
Automated container terminal portfolios split across three tiers with different margin economics. The volume tier, standard automated stacking cranes and quay cranes, competes on established manufacturing relationships and delivers gross margins in the 18 to 28% range. Premium terminal operating system software and automated guided vehicle platforms bundling interoperability certification and technical support command higher margins, reflecting software development cost and service investment la
The tension between volume and premium tiers shapes capacity allocation decisions across the industry. Volume crane capacity is easiest to scale and fastest to fund, but Chinese manufacturing price competition keeps margin pressure constant in that tier. Premium software and vehicle automation capacity requires deeper development investment and slower interoperability certification cycles, but rewards patient capital with margins that hold up as greenfield and retrofit demand continues.

High-value margin pools concentrate in terminal operating system software, automated guided vehicle platforms, and the predictive maintenance and project management support layer that increasingly separates established integrators from commodity equipment sellers. These pools remain a modest share of total shipment volume today, but they are growing faster than the legacy crane hardware base and are where most integrator research spending is now directed.

Volume / Commodity-Adjacent Tier

Standard automated stacking cranes and quay cranes sold primarily on established manufacturing relationships and price, serving routine terminal capacity demand. These units carry the thinnest margins in the portfolio and depend on manufacturing scale rather than software depth to stay profitable.
Gross Margin: 18-26%

Premium / Certified Tier

Premium terminal operating system software and automated guided vehicle platforms bundling interoperability certification, cybersecurity documentation, and technical support that large operators pay a premium to access. This tier generates steady repeat business, since certified accounts rarely switch integrators without cause.
Gross Margin: 36-48%

Sustainability / Regulatory / Next-Generation Tier

Next-generation AI-enabled optimization platforms and electrified automation systems tied to tightening cybersecurity standards and expanding greenfield project specifications. This tier draws the heaviest research spending, since software depth and multi-vendor interoperability both require sustained investment to defend against integration erosion.
Gross Margin: 40-54%
automated-container-terminal-market-portfolio-architecture-1787301225886

High-value Sub-segments and Strategic Watch-out

Terminal Operating System (TOS) Software

The fastest-growing, highest-margin pool in the market, driven by greenfield projects that reward integrators with mature interoperability certification and coordination capability already proven at scale. Integrators without that capability risk losing the fastest-growing accounts to specialists that moved earlier in the adoption cycle, particularly in the Middle East.
Gross Margin: 40-54%

Automated Guided Vehicles (AGVs)

A smaller but rapidly scaling high-value pool as horizontal transport automation expands, gated by fleet management infrastructure and safety certification cycles with large operators. Integrators that secure early operator qualification tend to hold that relationship for years, since switching mid-fleet is costly and operationally disruptive.
Gross Margin: 34-44%

Automated Stacking Cranes

The volume core of the market, serving cost-sensitive greenfield and retrofit demand where Chinese manufacturing price competition keeps margins under the most sustained scrutiny of any product tier. This segment still generates the largest absolute shipment volume, and defending share funds the research spending premium tiers require to grow further.
Gross Margin: 18-26%

Unqualified Regional Equipment Suppliers

A strategic watch-out segment where rapidly qualifying low-cost regional suppliers could pull volume-tier pricing down faster than integration depth and operator trust can defend established margins. Integrators without a genuine software or manufacturing advantage against these regional entrants should expect continued price erosion across the entire volume tier.
Gross Margin: 12-22%

The Systems Integration Moat

Automated container terminal economics increasingly resemble a systems-integration relationship business rather than a simple equipment sale. Software platform support, greenfield project management, and predictive maintenance assistance generate recurring engagement with large terminal operators that persists well beyond the initial equipment delivery, and integrators that own that systems integration relationship can forecast renewal demand with more confidence than pure hardware competitors m
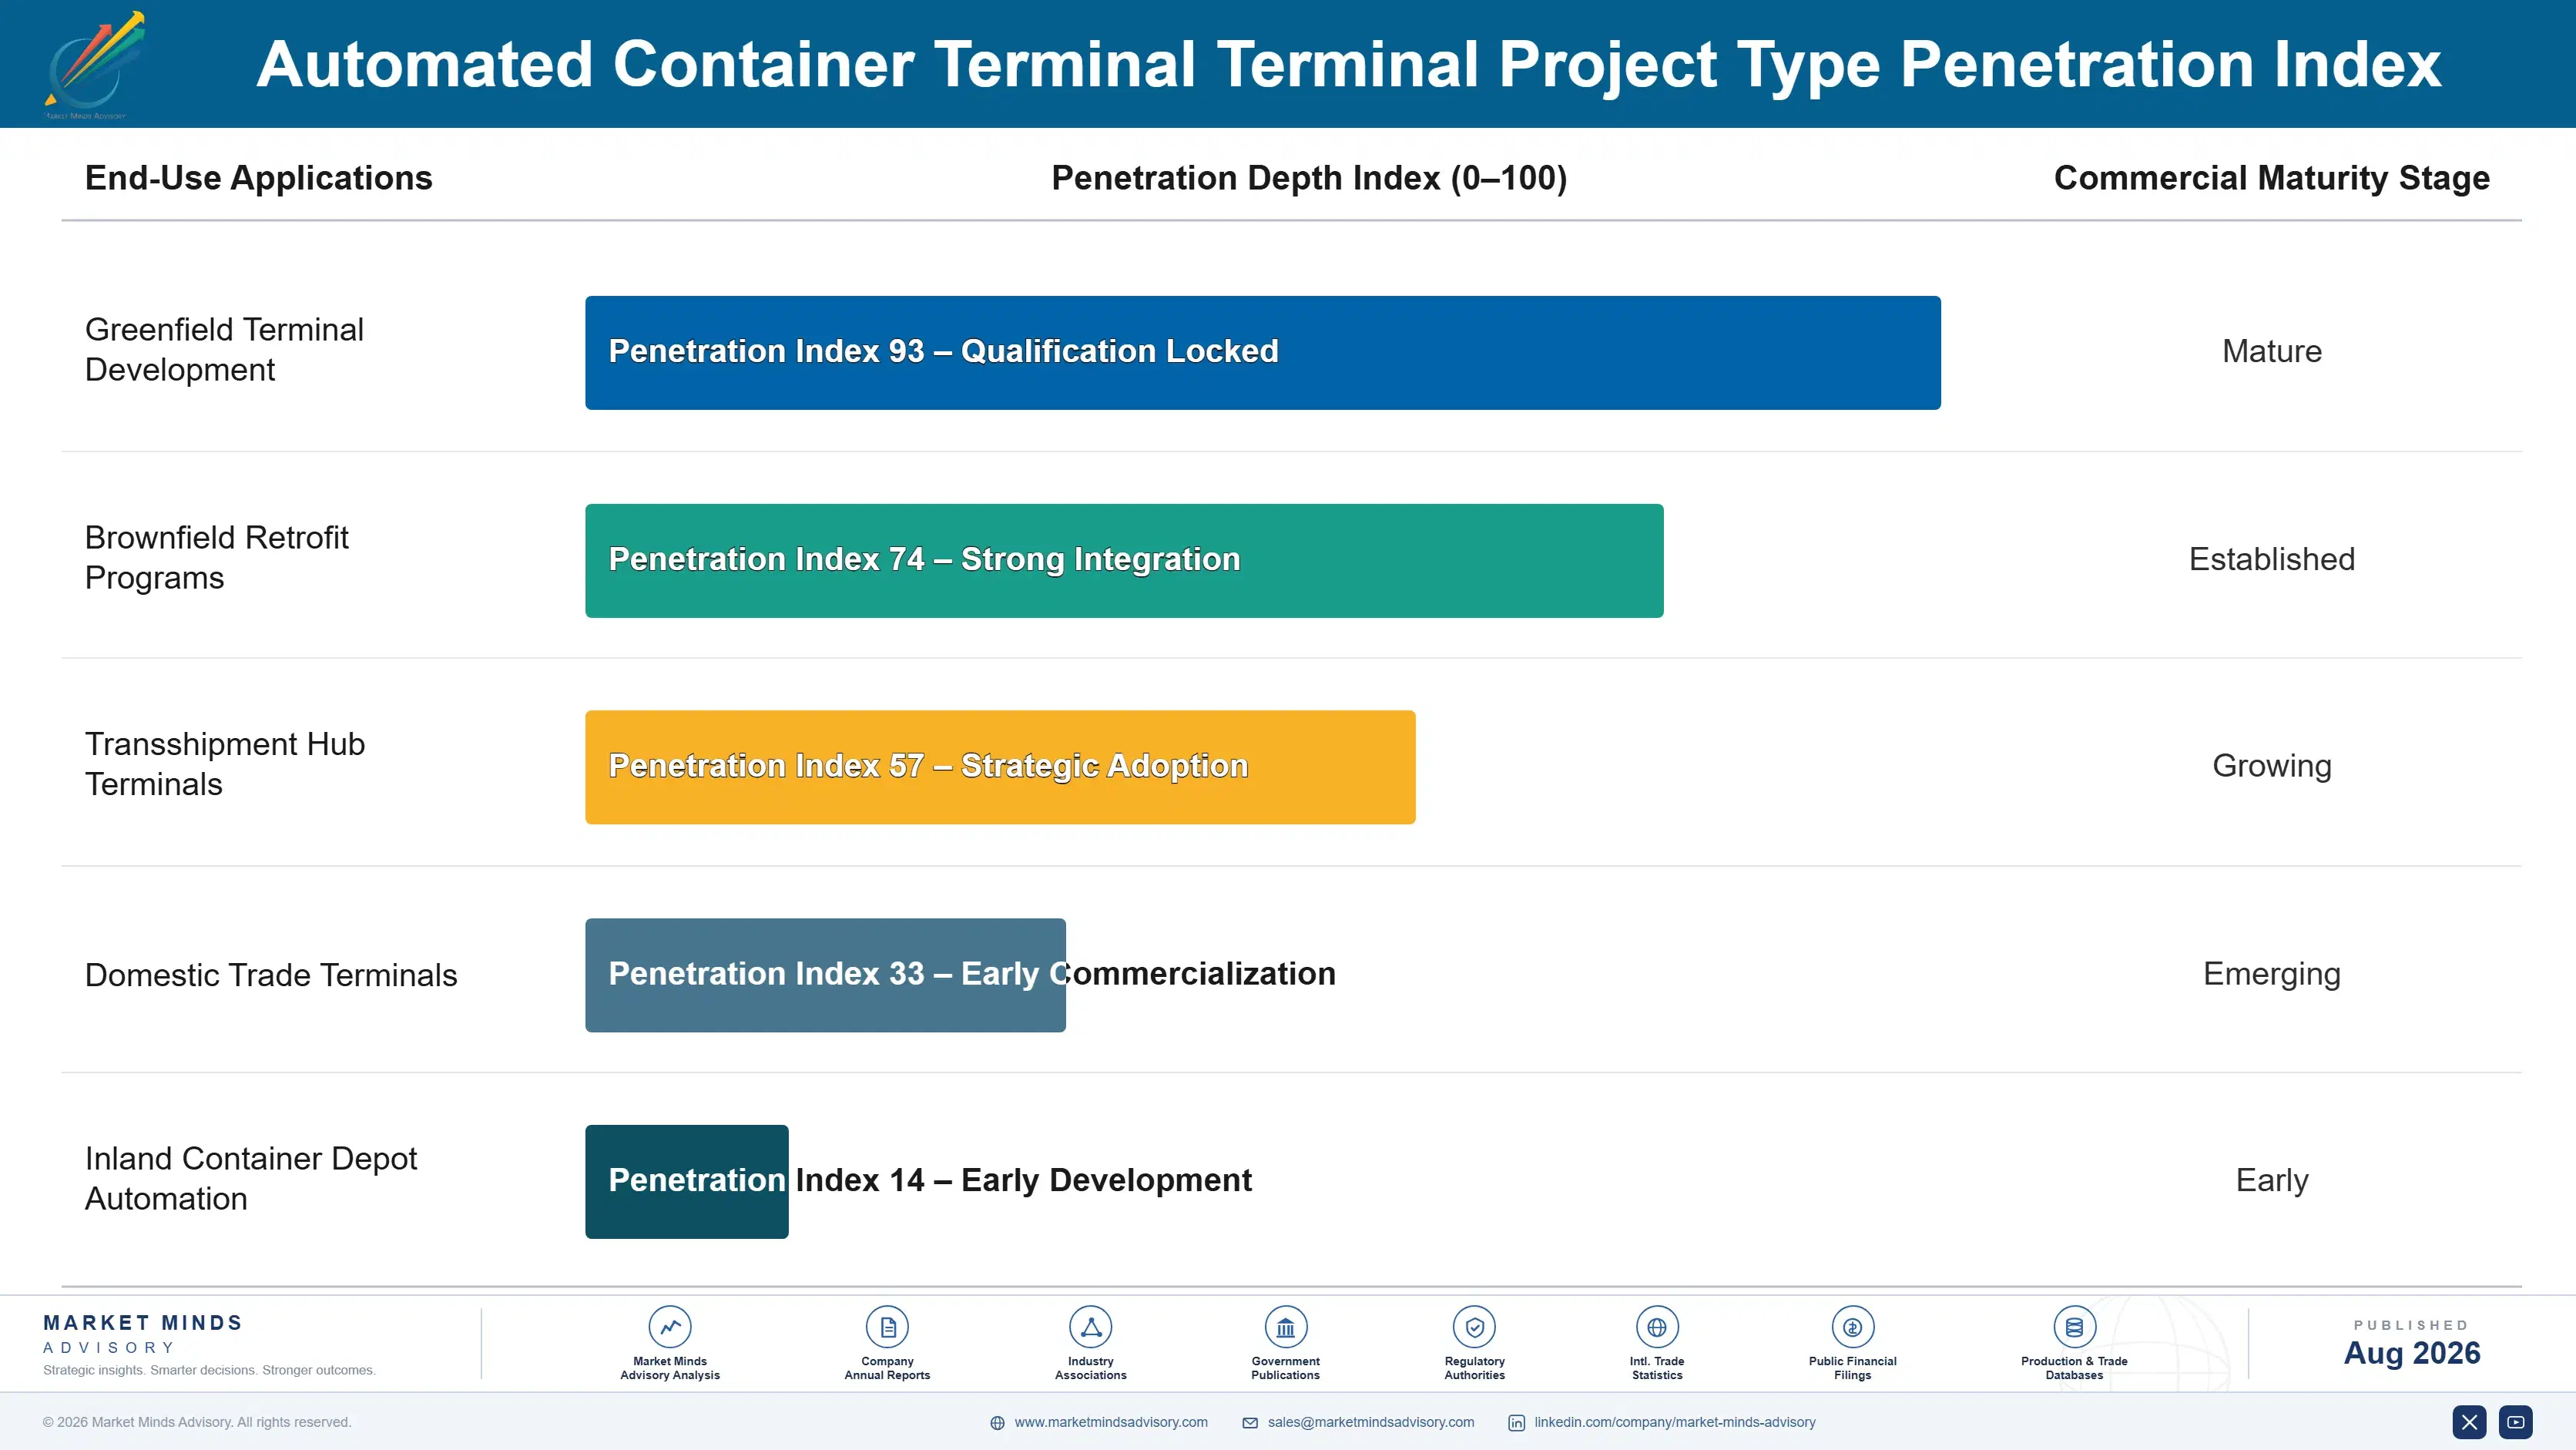
Adoption depth varies by end-use vertical. Large terminal operators and port authorities, once qualified on an integrator's full-stack certification and interoperability documentation, rarely switch given the cost and operational risk of requalifying an entire terminal's automation stack mid-cycle. Smaller regional terminals and single-berth operators show shallower stickiness so far, since they source equipment through distributors rather than direct integrator relationships and switch more readily on price alone.

A generational shift in buyer profiles is underway as chief technology and operations officers, rather than pure procurement, increasingly co-sign automation sourcing decisions given the operational risk full-stack systems carry. These buyers weight software interoperability credibility and cybersecurity documentation alongside unit cost, a shift that favors integrators with proven full-stack records over those competing purely on price. That shift is most pronounced among operators managing multiple terminals under standardized fleet strategies.
automated-container-terminal-market-end-use-penetration-index-1787301226399

Where the Software Premium Sits

These are among the four positions where our research anticipates prominent divergence between winners and laggards over the coming forecast period. Each is grounded in the demand model, the regulatory perimeter, and the announced capacity pipeline.
01 / SOFTWARE PLATFORM INVESTMENT

Prioritize TOS software depth over legacy crane capacity growth

Terminal operating system software is growing roughly 1.38 times faster than the overall market, driven by AI-enabled optimization and greenfield specification that show no sign of slowing as operator strategies keep expanding industry-wide. Integrators still weighted toward legacy crane hardware risk ceding the fastest-growing, highest-margin accounts to specialists that built software coordination and interoperability expertise earlier in the adoption cycle. Capital directed toward software platform depth now should pay back meaningfully faster than incremental crane hardware expansion into an increasingly crowded, price-competitive tier that Chinese manufacturers keep pressuring hardest.
02 / GREENFIELD PROGRAM READINESS

Build greenfield project management support before Middle East demand peaks

Integrators that still compete purely on equipment price without structured greenfield project management are leaving significant value on the table that commissioning support, interoperability testing, and training assistance are already capturing for established brands. These project management partnerships carry materially higher switching costs than the underlying equipment sale, locking port authorities into renewal patterns that price-only competitors struggle to break. Building this capability now, before Middle East greenfield demand peaks further, is worth considerably more than matching a rival's price cut for cut.
03 / COMPONENT COST HEDGING

Lock multi-year structural steel and electronics agreements now

Component input costs already run close to 35% of cost of goods sold, and the 2022 spike showed supply disruption can push manufacturer costs up by more than 41% within months during a volatile cycle. Manufacturers without multi-year supply agreements risk losing contract bids to better-hedged rivals during the next volatile cycle, damaging operator relationships built over years in a single sharp shortage. Locking supply now, even at a premium to spot pricing, protects margin stability and the credibility needed to win long-duration framework contracts.
04 / REGIONAL MANUFACTURING POSITIONING

Weigh Chinese manufacturing scale against Western software trust carefully

East Asia now holds the largest manufacturing base for automated terminal equipment and continues adding capacity faster than most other regions, making cost leadership there increasingly difficult for Western integrators to contest on crane hardware price. Western integrators still hold an advantage in software platform depth, systems integration trust, and multi-vendor interoperability that Chinese entrants have not yet closed. The strategy is not chasing Chinese manufacturing cost scale directly, but doubling down on the software and integration capability Chinese competitors still cannot replicate at comparable trust levels.

Engagement Snapshot From the Field

A live engagement with an industry participant carrying material or product regulatory and market exposure ahead of a defining policy shift, showing how our research translates into a defensible multi-year portfolio strategy.
MARKET MINDS ADVISORY · CLIENT ENGAGEMENT SUMMARY
Automated Container Terminal Producer Strategic Portfolio Review and Transition Roadmap 2026·Investment Scenario on Automated Container Terminal Exposure Evaluation 2025-26
CLIENT PROFILE
The client is a regional port authority developing a new greenfield container terminal with planned annual capacity of roughly two million TEU, located along a strategic transshipment route in the Middle East. The authority had committed to full automation from initial design and needed an independent assessment of integrator options ahead of finalizing its equipment and software procurement strategy (client-reported, unverified by MMA).
STRATEGIC CHALLENGE
The authority needed to select an integrator capable of delivering full-stack automation, cranes, vehicles, and terminal operating system software, on a schedule aligned with the terminal's planned commissioning date, while also securing a partner capable of supporting a multi-year maintenance and software update commitment after launch. Budget constraints further limited the authority's ability to run parallel integrator evaluations across multiple procurement tracks simultaneously.
MMA APPROACH
MMA conducted a vendor-neutral integrator assessment benchmarking candidate suppliers' full-stack delivery track record, software interoperability depth, and commissioning timeline reliability against the authority's terminal design and capacity ramp-up requirements across comparable greenfield projects worldwide. The assessment incorporated interviews with the authority's engineering and operations leadership to validate integration feasibility before finalizing supplier recommendations.
KEY FINDINGS
  1. Candidate integrator benchmarking identified two suppliers with full-stack delivery track records closely matching the terminal's planned capacity and automation complexity requirements for a project of this scale.
  2. A phased commissioning approach prioritizing quay crane automation first would reduce risk of schedule slippage compared to a uniform simultaneous commissioning approach across the full automation stack.
  3. Software interoperability gaps existed between two candidate integrators' terminal operating systems and the authority's planned vessel scheduling requirements, requiring additional integration work before commissioning could proceed.
  4. Cost modeling showed the selected integrator's software platform premium would pay back its investment within roughly twenty months through improved throughput and reduced labor cost exposure at full capacity.
CLIENT PROFILE
The client is a regional port authority developing a new greenfield container terminal with planned annual capacity of roughly two million TEU, located along a strategic transshipment route in the Middle East. The authority had committed to full automation from initial design and needed an independent assessment of integrator options ahead of finalizing its equipment and software procurement strategy (client-reported, unverified by MMA).
STRATEGIC CHALLENGE
The authority needed to select an integrator capable of delivering full-stack automation, cranes, vehicles, and terminal operating system software, on a schedule aligned with the terminal's planned commissioning date, while also securing a partner capable of supporting a multi-year maintenance and software update commitment after launch. Budget constraints further limited the authority's ability to run parallel integrator evaluations across multiple procurement tracks simultaneously.
MMA APPROACH
MMA conducted a vendor-neutral integrator assessment benchmarking candidate suppliers' full-stack delivery track record, software interoperability depth, and commissioning timeline reliability against the authority's terminal design and capacity ramp-up requirements across comparable greenfield projects worldwide. The assessment incorporated interviews with the authority's engineering and operations leadership to validate integration feasibility before finalizing supplier recommendations.
KEY FINDINGS
  1. Candidate integrator benchmarking identified two suppliers with full-stack delivery track records closely matching the terminal's planned capacity and automation complexity requirements for a project of this scale.
  2. A phased commissioning approach prioritizing quay crane automation first would reduce risk of schedule slippage compared to a uniform simultaneous commissioning approach across the full automation stack.
  3. Software interoperability gaps existed between two candidate integrators' terminal operating systems and the authority's planned vessel scheduling requirements, requiring additional integration work before commissioning could proceed.
  4. Cost modeling showed the selected integrator's software platform premium would pay back its investment within roughly twenty months through improved throughput and reduced labor cost exposure at full capacity.
RECOMMENDED STRATEGY
Phase 1: Phase 1 (Months 1 to 4): Conduct candidate integrator benchmarking and software interoperability validation across finalist suppliers and full-stack delivery track record review. Phase 2: Phase 2 (Months 5 to 14): Initiate phased commissioning beginning with quay crane automation while completing software integration testing across all planned berths. Phase 3: Phase 3 (Months 15 to 20): Complete full-stack commissioning and finalize the multi-year maintenance and software update agreement terms with the selected integrator.
OUTCOME
The authority selected its integrator and began phased commissioning in early 2026, prioritizing quay crane automation as recommended. Early data through mid-2026 showed integration testing tracking ahead of the original twenty-month payback estimate, though full-capacity commissioning awaits completion of the remaining software interoperability work (client-reported, unverified by MMA).

Frequently Asked Questions

Foundational context covering the market sizes, CAGR, scope, country, region and competition that inform every finding below. This section is provided to cover basics and most often pre-purchase conversations, answered from the MMA Primary Research Dataset.

What is the current size of the Automated Container Terminal Market?

The global automated container terminal market reached an estimated $6.8 billion in 2025. Growth concentrates in terminal operating system software and automated guided vehicles where greenfield specifications increasingly determine integrator selection.

How large will the Automated Container Terminal Market be by 2036?

MMA forecasts the market reaching approximately $18.63 billion by 2036, roughly two and a half times its 2026 value. Terminal operating system software is expected to drive the largest share of that incremental growth.

What is the CAGR for the Automated Container Terminal Market 2026 to 2036?

The base case CAGR is 9.6% across the forecast period, with a bull case near 10.8% and a bear case near 8.3% depending on greenfield project pace and automation confidence.

Which segment is growing fastest?

Terminal operating system software is the fastest-growing segment, expanding at roughly 13.2% CAGR, about 1.38 times the overall market pace, driven by AI-enabled yard optimization.

Who are the major companies in the Automated Container Terminal Market?

Leading integrators include Cargotec, Konecranes, Shanghai Zhenhua, Liebherr, and ABB, each with substantial full-stack automation portfolios. The top five hold an estimated 64% of global shipment volume, with integration depth largely determining share.

Which country is growing fastest?

China leads growth in absolute manufacturing and deployment volume, but Saudi Arabia is expanding fastest in percentage terms, driven by its Vision 2030 port investment program.

Report Segmentation Architecture

The full report scope spans multiple orthogonal segmentation dimensions, with cross-tabulated demand data provided for each dimension pair. Coverage extends further to regional breakdowns, trend trajectories, and the competitive detail needed to support segment-level decision-making.

By Automation System Type

  • Automated Stacking Cranes
  • Automated Guided Vehicles (AGVs) and Automated Lift Vehicles
  • Automated Quay Cranes
  • Terminal Operating System (TOS) Software
  • Gate Automation Systems

By Terminal Project Type

  • Greenfield Terminal Development
  • Brownfield Retrofit Programs
  • Transshipment Hub Terminals
  • Domestic Trade Terminals
  • Inland Container Depot Automation

By Commercial Dimension

  • Direct Equipment Supply Agreements
  • Software Platform Licensing
  • Predictive Maintenance Service Contracts
  • Systems Integration and Project Management Services

By Region

  • East Asia
  • North America
  • Western Europe
  • South Asia and Pacific
  • Latin America
  • Middle East and Africa
  • Eastern Europe

Scope, Methodology, and Coverage

Every figure in this report is reproducible from documented input assumptions. The scope below maps the historical period, the forecast horizon, the segmentation dimensions, and the countries covered, alongside the underlying primary and qualitative methodology.
Historical Period
2020 to 2025
Forecast Period
2026 to 2036
Base Year
2025 (USD billions; MMA Primary Research Dataset, August 2026)
Market Definition
The automated container terminal market covers automation equipment and software deployed at container terminals, including automated stacking cranes, automated guided vehicles and automated lift vehicles, automated quay cranes, terminal operating system software, and gate automation systems sold to port operators and terminal developers. It excludes manual container handling equipment, ocean carrier vessels themselves, and general port infrastructure such as berths, breakwaters, and dredging services outside the automation equipment scope.
Quantitative Units
USD billions (current prices); automated equipment units shipped where disclosed
Segmentation Dimensions
By Automation System Type; By Terminal Project Type; By Commercial Dimension; By Region
Regions Covered
East Asia, North America, Western Europe, South Asia and Pacific, Latin America, Middle East and Africa, Eastern Europe
Countries Covered
China, Japan, South Korea, USA, Canada, Mexico, Germany, Netherlands, UK, India, Australia, Singapore, Vietnam, New Zealand, Brazil, Panama, Colombia, Saudi Arabia, UAE, South Africa, Poland, Romania, and additional markets relevant to this sector
Key Companies Profiled
Cargotec Corporation, Konecranes plc, Shanghai Zhenhua Heavy Industries Co., Liebherr Group, ABB Ltd, Siemens AG, Navis LLC, Camco Technologies, TMEIC Corporation, Identec Solutions, Toyota Industries Corporation, Hyster-Yale Materials Handling Inc., Terex Corporation, Doosan Corporation, Mitsui E&S Co., Sany Heavy Industry Co., Anhui Heli Co., Vahle Group, ELME Spreader AB, Q-Free ASA
Quantitative Methodology
Primary survey, n=3,800 respondents, Q4 2025, six countries; demand-side model with trade association cross-validation
Qualitative Methodology
47 expert interviews, Q4 2025; applied to validate demand model assumptions, identify emerging dynamics, and assess competitive positioning
Report Format
PDF and XLSX data workbook (Word format preview document)
Publisher
Market Minds Advisory
Report Code
MMA-2026-CON-163
Published
August 2026
Contact
sales@marketmindsadvisory.com | www.marketmindsadvisory.com

Purchase the full Automated Container Terminal Market Report (2026 to 2036).

The full Automated Container Terminal Market report delivers a comprehensive assessment of automation system technology, competitive positioning, and regional demand through 2036. It includes detailed segmentation by automation system type, terminal project type, and commercial dimension, alongside profiles of all twenty companies covered in this summary. The report quantifies regional market size and growth across all seven world regions, with country-level detail for the twenty-plus markets MMA tracks. Buyers receive access to MMA's underlying primary survey dataset and expert interview transcripts, enabling further custom analysis. A dedicated chapter benchmarks structural steel and power electronics cost exposure and mitigation strategies across manufacturer types.
Automation system segmentation across five technology categories
Profiles of twenty leading automated terminal integrators worldwide
Regional sizing and forecasts across all seven world regions
Structural steel and power electronics cost exposure mitigation chapter
Primary survey dataset access covering 3,800 respondent interviews
Competitive development tracking with dated corporate event log

Built For The People Who Decide

From boardroom strategy to bench-side execution, this report is read cover-to-cover by leaders shaping the next decade of their industry, turning demand scenarios, market dynamics and valuation benchmarks into decisions.
CXOs/ Presidents/ VPs/ Managers
M&A and Corporate Development
Strategy Teams and R&D Heads
Procurement and Product Directors
Regulatory and Compliance Leaders
Investor Relations and Equity Analysts