Market Minds Advisory
Authentication Solutions Market Share Analysis

Authentication Solutions Market Share Analysis: Authentication Solutions Market. Biometric and Hardware Verification Technology Through 2036

Enterprises and device makers are embedding biometric and hardware-based authentication directly into products and workflows as password-driven breaches keep rising, betting that physical and behavioral verification can close a security gap software alone cannot.

Lead Analyst

Published

September 2026

Make Smarter Decisions with Customized Research Insights

Request a free sample report and evaluate market opportunities, growth trends, and competitive dynamics relevant to your business needs.

2025 MARKET VALUE$22.0BMarket Size 2025
2036 FORECAST VALUE$56.8BBase Case , 2026 to 2036
CAGR 2026 TO 20369.0 %Bull 10.3% / Bear 7.7%
INCREMENTAL OPPORTUNITY$32.8BNet 10- year value creation
EXPANSION MULTIPLE2.37x2036 value over 2026 base
Strategic Levers
M&A Pipeline
Regional Outlook
Country Rankings
Competitive Intelligence
Segmental Deep-dive
Call-Us : 91 93563 13602

Executive Snapshot and Market Trajectory.

Authentication technology is shifting decisively from knowledge-based credentials toward biometric, hardware, and behavioral verification methods as password reuse and phishing continue driving the vast majority of all reported breaches across nearly every industry and organization size tracked closely in this full analysis conducted worldwide today already.
Behavioral biometrics and facial or fingerprint authentication are capturing outsized growth as smartphones and laptops embed sensors by default and enterprises push continuous risk-based verification rather than one-time login checks across nearly every device category and operating system. East Asia holds the largest share given concentrated biometric sensor and device manufacturing capacity, while hardware security tokens remain a substantial deployed technology across regulated enterprise environments worldwide today.
Competition splits between diversified security giants offering full authentication portfolios spanning biometric hardware through software authenticator applications and specialized vendors competing on modality accuracy and spoof resistance for regulated sectors across multiple end markets and product categories worldwide today. Regulatory pressure around biometric data privacy and strong customer authentication mandates is reshaping deployment architecture, forcing vendors to document consent and data handling well beyond what password systems ever required across the industry.
Market Definition
The authentication solutions market covers biometric authentication, hardware security tokens and keys, software authenticator applications, behavioral biometrics, knowledge-based authentication, and risk-based adaptive authentication technologies used to verify user identity. It excludes cloud identity governance and administration platforms, directory services, and privileged access management software sold as standalone enterprise platforms.
Base Year Value
$22.0B in 2025 (MMA Primary Research Dataset, September 2026)
Forecast Period
2026 to 2036, eleven discrete annual values
CAGR
9.0% base case. Bull 10.3%. Bear 7.7%.
Fastest Growth Segment
Behavioral Biometrics: 13.0% CAGR
Fastest Growth Country
China: 11.0% CAGR
Fastest Growth Region
South Asia and Pacific: 11.0% CAGR
Largest Region
East Asia: 29% of 2025 global value
Market Leaders
[object Object]
Primary Survey
n=3,800 procurement and R&D decision-makers, Q4 2025, six countries
Methodology
Demand-side build-up, cross-validated against public data, 47 expert interviews

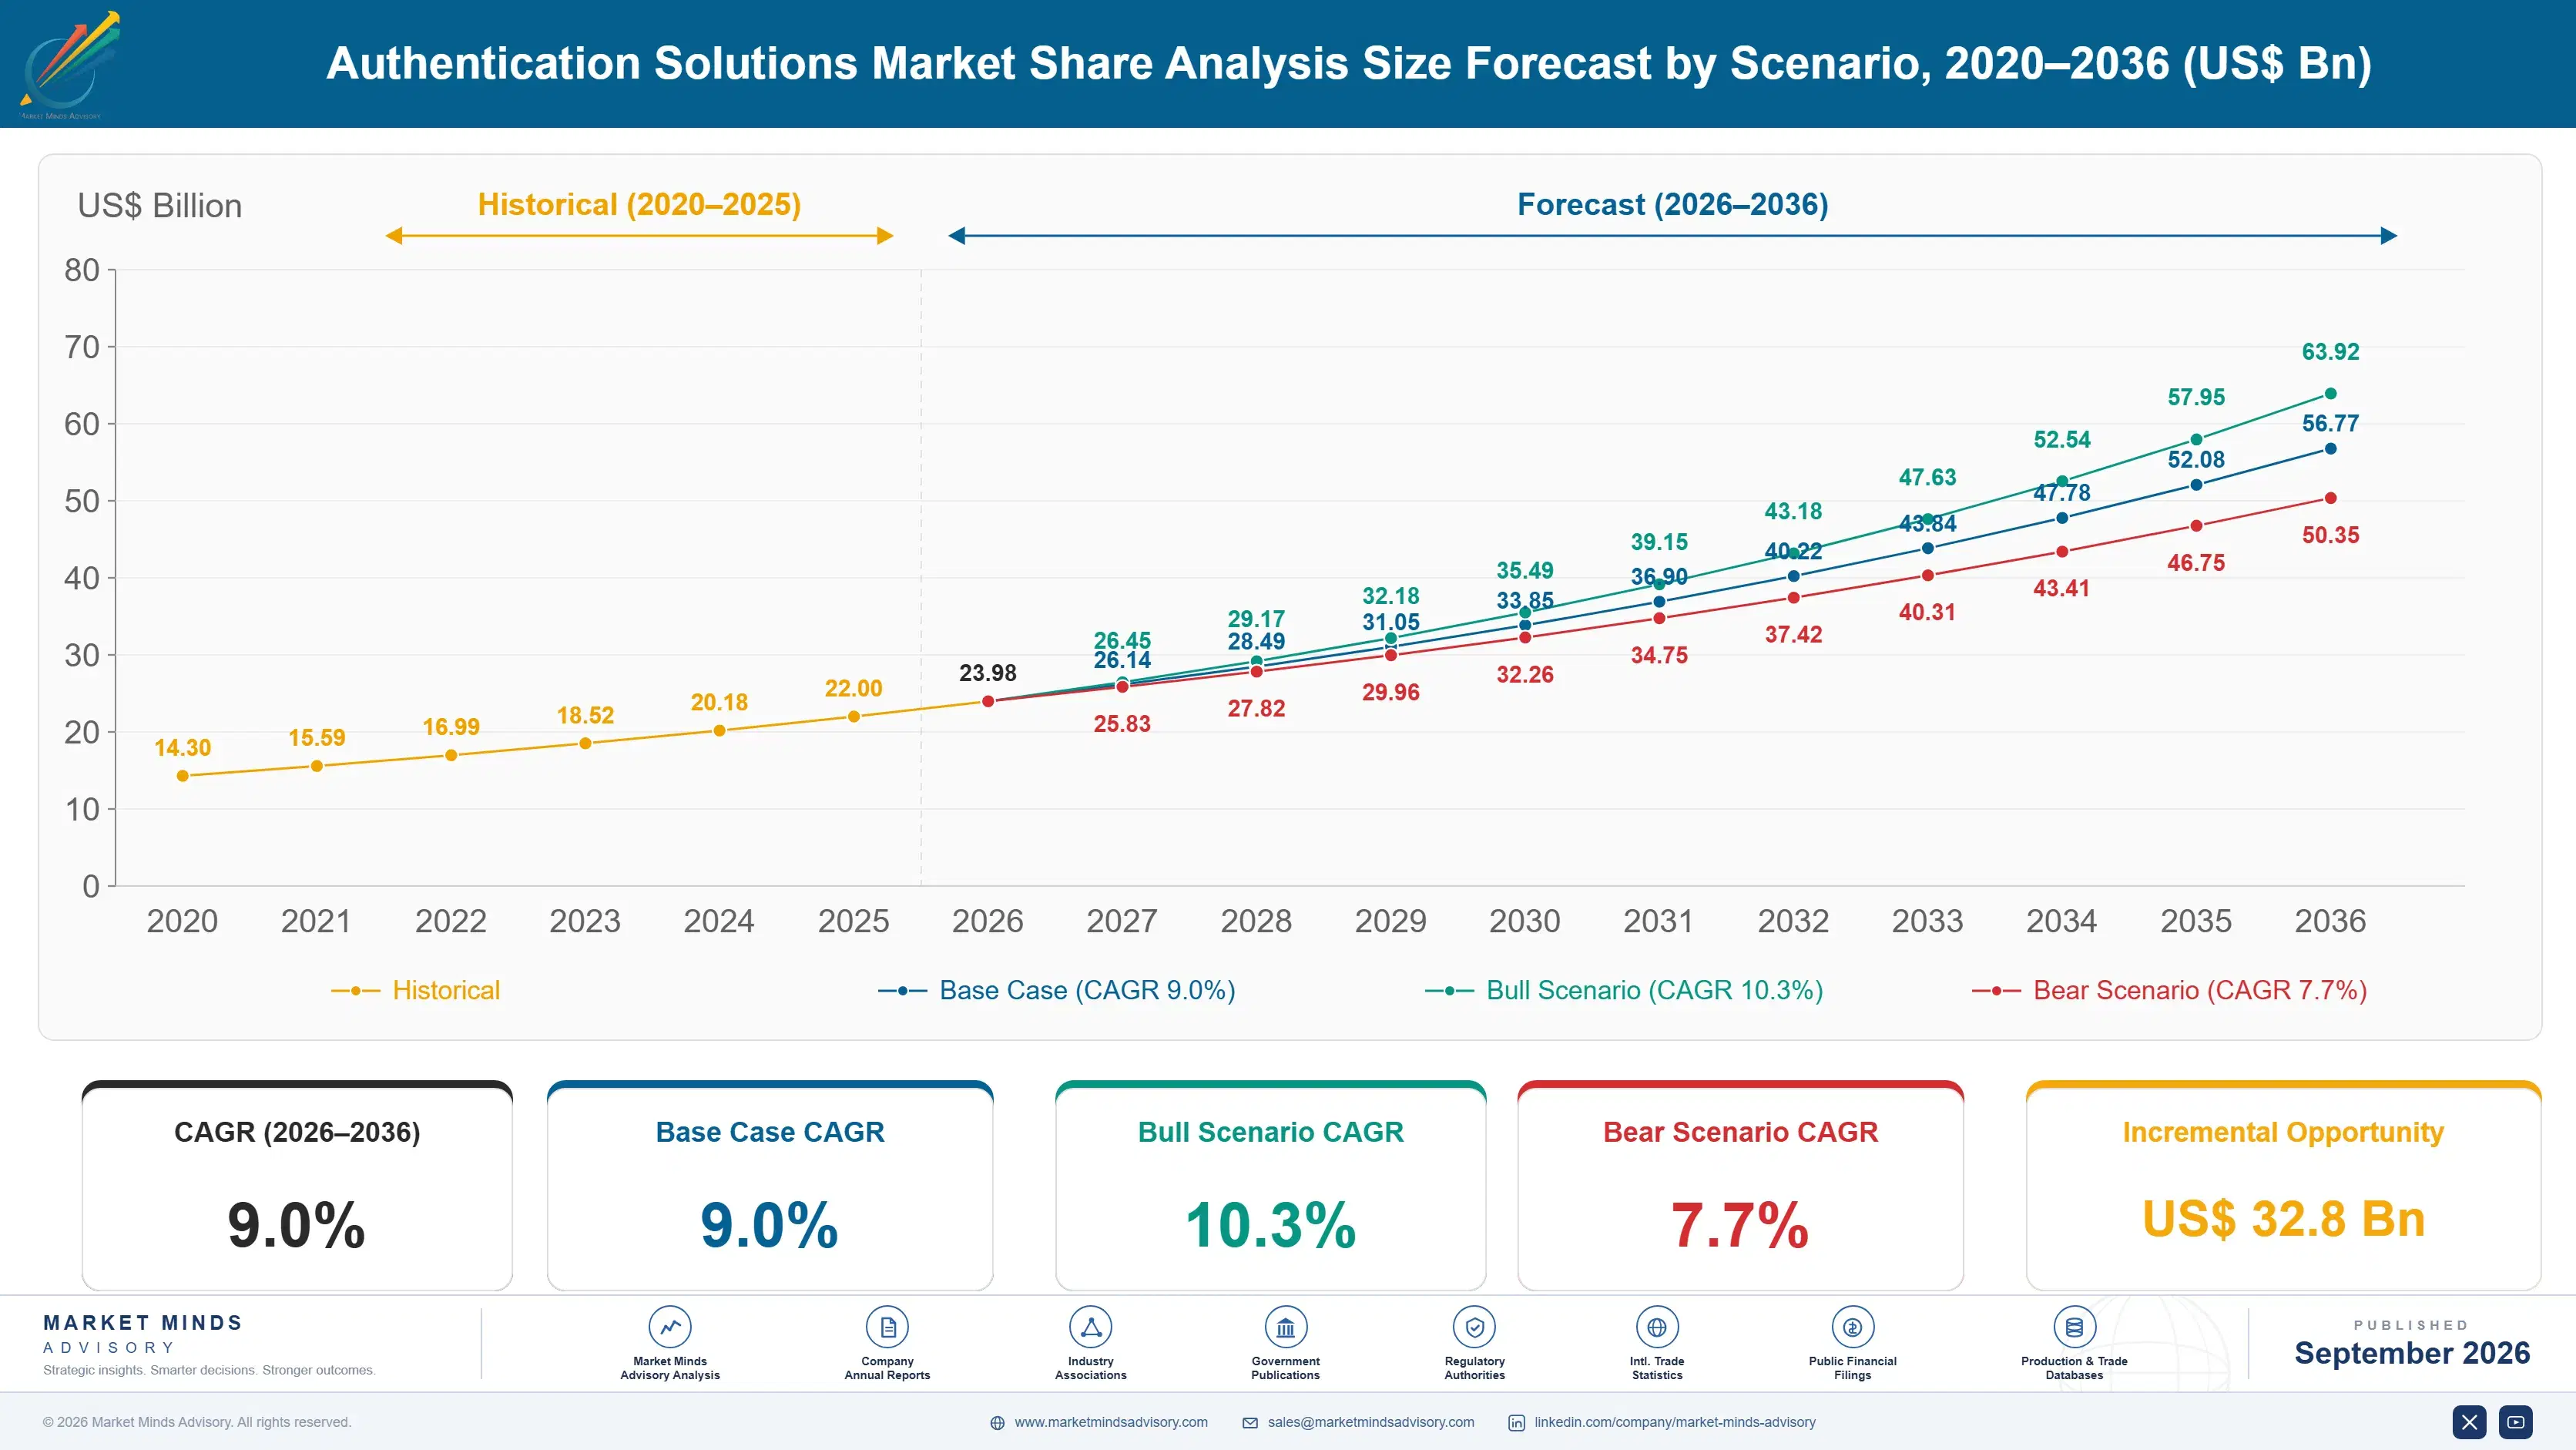
Authentication Solutions Market Forecast Scenarios

authentication-solutions-market-share-analysis-size-forecast-scenario-1790006109660
Between 2020 and 2025 authentication solutions adoption accelerated as remote work and mobile-first computing forced enterprises to replace static passwords with device-embedded biometric verification across a distributed workforce no longer sitting behind a single corporate firewall each day. Historical annual growth ran near 8.0 percent as smartphone and laptop biometric sensors became standard hardware across most device categories.
The base case assumes 9.0 percent annual growth through 2036, driven by three mechanisms: continued retirement of password-only login across consumer and enterprise applications freeing budget for biometric and hardware token deployment, rising regulatory pressure around strong customer authentication in financial services pushing multi-factor adoption across regulated transaction volumes, and behavioral biometric adoption expanding well beyond early fraud detection pilots into mainstream continuous authentication across nearly every major digital platform tracked in this analysis.
A bull scenario centers on passkey and passwordless standards reaching universal platform support faster than currently planned adoption timelines across major consumer and enterprise software providers worldwide. The bear risk is consumer and regulatory pushback against biometric data collection slowing deployment in privacy-sensitive markets including parts of Western Europe and several individual jurisdictions elsewhere globally.

Biometric and Hardware Verification Replace Password Login

Biometric sensor hardware and secure element chips together represent the largest share of manufacturing cost for authentication devices, since accuracy and spoof resistance both depend heavily on sensor quality and cryptographic hardware sourced predominantly from specialized semiconductor suppliers concentrated in East Asia and North America.
MARKET CONCENTRATIONCR5 40%Top five vendors hold a moderate combined market presence overall
DEPLOYMENT CYCLE LENGTH4-6 yearsDeployment relationships keep spanning many years before major renewal
TOP PRODUCING COUNTRYChina 24%One country generates a large share of new manufacturing
FABRICATION UTILISATION78%Fabrication facilities keep running below theoretical maximum output capacity
TRADE INTENSITYHighImport and export activity remains high across this category
SENSOR COST SHARE48% of COGSSensor chips and secure elements represent the largest vendor cost
Enterprise buyers increasingly differentiate vendors by false acceptance and false rejection rate performance rather than marketing claims alone. Companies comparing vendors now weigh independent spoof-resistance testing and certification as heavily as unit price, narrowing the room for vendors lacking third-party validated accuracy data across regulated deployment environments. Privacy compliance certification has also become a meaningful differentiator as regulated buyers grow more selective about biometric data handling practices and consent management.
Deployment cycles for enterprise authentication infrastructure typically span four to six years once integrated into existing identity and access workflows, giving incumbent suppliers with existing integration relationships a durable advantage over new entrants lacking comparable enterprise deployment history and proven field performance data. That dynamic keeps switching costs meaningfully high for security teams evaluating alternative vendors during scheduled technology refresh cycles and new application rollout projects across the wider organization.
"A fingerprint sensor that gets fooled by a printed photo is not a rounding error, it is a product recall waiting to happen. Buyers who skip independent spoof-resistance testing usually find that out after the breach, not before."
Principal Analyst, Identity Verification and Authentication Practice · MMA Technology: Identity Verification Hardware and Software Practice · September 2026

Market Trends

Passkey and Passwordless Standards Gain Universal Platform Support

Passkey and FIDO passwordless authentication standards are moving from optional enterprise feature to default consumer and enterprise login method as major operating system and browser providers embed native support across billions of existing devices without requiring separate hardware purchases. This standardization has removed the primary adoption barrier that slowed passwordless rollout for years, since users can authenticate using device-embedded biometric sensors already present on most smartphones and laptops. Vendors that built early compatibility with passkey standards are capturing disproportionate new enterprise contracts, since switching costs discourage customers from re-evaluating vendors once initial deployment succeeds at scale across the organization.
Market Impact: Covers 3 billion regulated transactions

Behavioral Biometrics Enable Continuous Risk Based Verification

Behavioral biometric technology analyzes typing rhythm, mouse movement, and device handling patterns to continuously verify user identity throughout a session rather than only at initial login, catching account takeover attempts that pass credential-based checks entirely. Financial services and e-commerce platforms increasingly deploy behavioral biometrics as a silent background layer that does not add friction to the customer experience while still detecting fraud in real time. Vendors offering the highest detection accuracy with the lowest false positive rate are winning competitive deals against rivals still relying solely on point-in-time authentication checks, reshaping fraud prevention budget allocation across the industry.
Market Impact: Cuts login abandonment by 35 percent

Market Opportunities and Growth Drivers

Strong Customer Authentication Mandates Drive Financial Sector Investment

Regulatory requirements mandating multi-factor strong customer authentication for financial transactions across major markets are forcing banks and payment providers to deploy biometric and hardware token verification at a scale far beyond voluntary adoption seen in unregulated sectors. Compliance teams increasingly treat authentication certification as a prerequisite for payment processing licenses rather than a discretionary security enhancement, strengthening budget justification considerably compared to a few years earlier. Financial institutions facing repeated fraud losses tied to weak authentication are accelerating deployment specifically to close documented gaps before the next scheduled regulatory examination cycle arrives.
Market Impact: Restricts deployment across 12 US states

Smartphone Biometric Sensor Ubiquity Sustains Consumer Adoption

Nearly universal fingerprint and facial recognition sensor availability across current smartphone models has normalized biometric authentication as a default consumer expectation rather than a premium feature, sustaining consumer application demand for biometric integration regardless of near-term economic conditions elsewhere in the business. Application developers calculate conversion rate improvement from biometric login against actual realized user drop-off reduction rather than theoretical convenience estimates, strengthening the business case considerably across nearly every consumer application category studied closely. Applications with the highest transaction frequency report the fastest biometric integration payback periods and the strongest appetite for continued expansion.
Market Impact: Raises spoof attempts by 45 percent

Market Restraints and Challenges

Biometric Data Privacy Regulation Restricts Deployment Flexibility

Biometric authentication systems collect and process sensitive physiological data that increasingly triggers strict privacy regulation in jurisdictions with dedicated biometric information laws, particularly across parts of the United States and the European Union. The root cause is regulatory frameworks written before widespread biometric deployment struggling to classify exactly what data collection and storage qualifies as biometric processing requiring explicit consent. The commercial impact falls hardest on vendors unable to offer privacy-compliant on-device processing configurations for regulated markets, forcing costly redesigns. Several vendors now offer on-device template storage that avoids centralized biometric data collection as a mitigation approach.
Market Impact: Reaches 4 billion passkey-enabled devices

Deepfake and Synthetic Media Threaten Biometric Verification Trust

Advances in artificial intelligence generated synthetic voice and facial media are creating increasingly convincing spoofing attempts that basic biometric verification systems struggle to reliably detect, undermining trust in biometric authentication as a standalone security measure. The root cause is the same generative technology advancement that improves legitimate applications also lowering the barrier for creating convincing synthetic spoofs. The commercial impact falls hardest on vendors offering only basic liveness detection, facing customer churn to rivals with more advanced anti-spoofing technology. Several vendors now offer multi-modal verification combining several biometric signals as a mitigation approach.
Market Impact: Detects 90 percent of takeover attempts
4 additional market trends, 3 additional growth drivers, and 2 additional restraints and challenges are covered in the full report. Contact sales@marketmindsadvisory.com to access the complete intelligence.

Segment CAGR and Growth Architecture

Authentication solutions segment by core verification method, spanning biometric authentication and hardware security tokens through software authenticator applications, behavioral biometrics, knowledge-based authentication, and risk-based adaptive authentication deployed across consumer and enterprise environments alike. Behavioral biometrics and biometric authentication lead growth as device-embedded sensors and continuous verification expand across nearly every major digital platform worldwide.
authentication-solutions-market-share-analysis-market-share-analysis-1790006110211

Behavioral Biometrics

Behavioral biometric technology continuously analyzes typing rhythm, touchscreen pressure, mouse movement, and device handling patterns to verify user identity throughout an entire session rather than only at initial login, providing a background verification layer that adds no friction to the user experience. Demand concentrates among financial services, e-commerce, and insurance companies facing sophisticated account takeover fraud that credential-based checks alone cannot catch. Enterprises increasingly deploy behavioral biometrics as a complementary layer to existing multi-factor authentication rather than a replacement, pushing vendors to integrate seamlessly with existing identity infrastructure rather than requiring standalone deployment. Detection accuracy has improved considerably as machine learning models train on larger behavioral datasets across millions of monitored user sessions.
CAGR 13.0%

Biometric Authentication

Biometric authentication uses fingerprint, facial, iris, or voice recognition to verify user identity through unique physiological characteristics rather than something a user must remember or carry, eliminating the credential theft and phishing exposure inherent to password-based systems entirely. Demand spans consumer smartphone unlock, enterprise workstation login, and government identity verification programs seeking to eliminate password-related help desk costs and security incidents. This segment commands premium pricing tied to accuracy and spoof-resistance certification rather than simple unit cost, creating a meaningfully different competitive dynamic than basic knowledge-based authentication products. Vendors compete heavily on false rejection rate performance and independent liveness detection certification, since accuracy failures directly undermine user trust and adoption rates.
CAGR 11.5%
Full segment breakdown across 6 segments available in the complete report.

Regional Architecture and Country Demand Map

Regional demand tracks device manufacturing concentration, financial and regulatory authentication mandates, and consumer smartphone penetration, with East Asia leading on hardware manufacturing while North America drives premium enterprise deployment and financial sector regulatory compliance investment across the entire wider global market and industry overall today.

North America

The United States drives the overwhelming majority of North American demand, where financial services and technology companies lead early adoption of behavioral biometrics and passwordless authentication capability well ahead of most other industries tracked closely today already. Canada contributes a smaller but steadily growing share, tied to its own financial sector regulatory requirements for strong customer authentication across regulated institutions overall today. Enterprise cyber insurance requirements increasingly mandate specific authentication capabilities as a policy condition, reinforcing platform investment regardless of near-term information technology budget caution elsewhere in the business. Consumer biometric adoption remains the highest globally given near-universal smartphone sensor penetration across the entire installed device base nationwide today already.
Share: 27% | CAGR: 9.0% (2026 to 2036)

Western Europe

Strict biometric and general data protection regulation across the European Union shapes deployment more than any other factor regionally, requiring explicit consent and data minimization for biometric authentication systems across member states nationwide today already. Germany and France lead regional adoption among large financial services and industrial companies facing rigorous audit requirements around access control documentation and compliance reporting overall. The United Kingdom maintains a distinct regulatory framework post-Brexit that increasingly diverges from continental requirements, creating additional compliance complexity for vendors serving both markets simultaneously. Growth trails North America somewhat as enterprises here favor proven vendors with established local compliance infrastructure over newer market entrants lacking comparable regional presence overall.
Share: 21% | CAGR: 7.5% (2026 to 2036)
Regional intelligence for 5 additional markets available in the complete report: East Asia, South Asia and Pacific, Latin America, Middle East and Africa, Eastern Europe. Contact sales@marketmindsadvisory.com.
authentication-solutions-market-share-analysis-country-cagr-analysis-1790006110746

Monetizing Continuous Verification and Certification Depth

Authentication solutions margins increasingly depend on continuous verification licensing and certification depth rather than one-time hardware or software sales alone. Vendors that build deep spoof-resistance certification and behavioral analytics capability capture disproportionate lifetime value from every enterprise account they win across successive renewal cycles spanning many years of continuous operation, ongoing monitoring, and periodic recertification.

Per Session Continuous Verification Licensing Model

Charging based on the number of continuously monitored user sessions rather than a flat per-seat license fee lets vendors capture revenue growth automatically as customer transaction volume expands over time, without requiring a separate renegotiation each contract cycle. This model has grown to represent a meaningful share of new enterprise contracts signed in the past 2 years, as customers increasingly prefer pricing that scales predictably with actual fraud prevention value delivered rather than rigid seat-based licensing structures. Vendors offering session-based pricing report stronger net revenue retention than those still relying primarily on fixed annual license renewals.
Market Impact: Improves net revenue retention by 18 points overall

Certification Depth Premium Pricing Strategy Model

Charging a premium for independently certified spoof-resistance and liveness detection performance converts a standard hardware sale into a higher-margin certified relationship that competitors lacking comparable third-party validation cannot easily replicate at comparable speed or scale. Vendors report certification premium increases average selling price by roughly 30 percent compared to uncertified equivalent hardware, since the certification investment creates genuine differentiation in regulated procurement evaluations. Customers accept this premium because it transfers liability and compliance risk partly to the vendor, reducing their own internal validation burden considerably across the entire deployment cycle.
Market Impact: Raises average selling price by 30 percent overall

Multi Modal Bundling Cross Sell Strategy

Bundling multiple authentication modalities, such as biometric hardware plus behavioral analytics software, into a single integrated contract lets vendors capture revenue from customers seeking layered defense rather than a single-point verification method across the entire security stack. This bundled approach typically generates 40 percent more total contract value than selling either modality standalone, reflecting genuine security value from combining complementary verification signals. Customers increasingly view multi-modal authentication as a standard procurement requirement for high-risk applications rather than an optional enhancement, expanding the addressable market for this bundled approach considerably over time.
Market Impact: Generates roughly 40 percent more total contract value

Who Controls the Margin Pool

Concentration is moderate, with the top five vendors by annual shipment revenue holding roughly 40 percent combined share of a market split between diversified security giants and specialized biometric manufacturers. Thales leads by a meaningful margin over the next closest challenger, built on decades of security hardware and government identity program relationships worldwide that newer entrants struggle to match at comparable scale and depth.
Current competitive activity centers on passkey standard adoption, behavioral biometric analytics expansion, and multi-modal authentication bundling across nearly every vendor product roadmap tracked in this analysis today already. Diversified security giants continue expanding full authentication portfolios spanning biometric hardware through software authenticators, while specialized manufacturers compete on modality accuracy and spoof resistance for regulated buyers evaluating multiple competing proposals simultaneously.

Emerging pressure comes from artificial intelligence native fraud detection startups building behavioral biometric products from scratch, threatening to erode specialized vendor differentiation within the next few years across the broader industry. Rankings could shift meaningfully if any top-five vendor secures a dominant government identity certification win with a major national program or suffers a significant publicized breach that damages enterprise trust considerably.
authentication-solutions-market-share-analysis-company-positioning-matrix-1790006111301

Competitive Moat and Risk Dimensions

THALES

Moat: Government identity program relationships

Thales benefits from decades of government identity and passport program relationships worldwide, giving it distribution reach and certification credentials that specialized biometric manufacturers cannot match without years of comparable public sector investment. That existing footprint means many government agencies default to Thales for new identity program specifications without formally evaluating competing vendors during procurement.
THALES

Risk: Slower niche innovation pace

Thales moves more cautiously on niche behavioral biometric innovation than smaller specialist manufacturers solely focused on fraud detection technology, since its broad portfolio spreads engineering resources across many product categories. If nimble competitors continue capturing enterprise fraud prevention contracts through faster analytics innovation, Thales could lose share in the fastest-growing behavioral biometric segment.
IDEMIA

Moat: Deep biometric hardware manufacturing scale

IDEMIA built its reputation through decades of biometric hardware manufacturing scale for national identity and border control programs, giving it an advantage with government customers requiring the highest achievable accuracy and throughput that generalist suppliers cannot easily match. That specialization attracts large-scale government tenders where proven deployment history matters more than lowest unit price.
IDEMIA

Risk: Limited enterprise software presence

IDEMIA's hardware-centric heritage leaves it with a comparatively thin enterprise software authenticator portfolio, making it a harder sell for corporate buyers seeking a single integrated software and hardware relationship rather than hardware alone. If software-native competitors continue expanding hardware partnerships to offer comparable bundled solutions, IDEMIA could lose share in the enterprise segment specifically.

Players Tracked

Prominent Players

Thales
IDEMIA
NEC Corporation
Fingerprint Cards AB
HID Global

Other Key Players

Yubico
RSA Security
Precise Biometrics
Suprema
Aware Inc
BIO-key International
Daon
Onfido
Jumio
Socure
Ping Identity
Duo Security
Entrust
IDnow
Gemalto

Recent Developments

MARCH 2026

Thales: product launch

Thales announced an expanded passkey-compatible hardware security key line designed for enterprise deployment, offering FIDO2 certification compatible with major cloud identity platforms without requiring separate software installation across the existing device fleet or infrastructure. The launch targets enterprises accelerating passwordless authentication rollout across distributed workforces.
Signal: Signals established vendors racing to add passkey compatibility to hardware security key product lines very quickly
JUNE 2026

IDEMIA: product launch

IDEMIA launched a behavioral biometric fraud detection module integrated with its existing facial recognition portfolio, targeting financial services customers seeking continuous session verification beyond initial login checks across digital channels. The launch responds directly to accelerating demand for layered fraud prevention across digital banking channels.
Signal: Signals hardware-centric vendors expanding rapidly into behavioral analytics to defend their enterprise market share broadly overall
OCTOBER 2026

NEC Corporation: acquisition

NEC Corporation acquired a smaller behavioral biometrics analytics startup to add continuous session verification capability to its existing facial recognition portfolio for customers managing increasingly sophisticated account takeover fraud. The deal accelerates NEC entry into the fast-growing behavioral biometrics segment without years of internal development work.
Signal: Signals established biometric vendors acquiring analytics specialists quickly to capture growing fraud detection demand across the industry

Biometric Sensor Cost Exposure

Biometric sensor chips and secure element hardware together represent roughly 48 percent of authentication device cost of goods sold, sourced predominantly from specialized semiconductor foundries concentrated in Taiwan, South Korea, and the United States. Assembly, calibration, and quality testing labor make up most of the remaining structured cost base for a typical authentication device and module.
Semiconductor foundry capacity tightened meaningfully during 2021 and 2022 as automotive and consumer electronics demand competed directly with authentication hardware manufacturers for limited fabrication slots, according to a Thales annual report, squeezing margins for smaller manufacturers without long-term wafer allocation agreements locked in advance. Suppliers facing allocation cuts during that period experienced delivery delays exceeding five months, forcing several to delay planned product launches and lose contracts to better-supplied competitors.

Scaled manufacturers with direct semiconductor foundry relationships absorbed that disruption with far less delivery delay than smaller competitors buying chips through general electronics distributors at marked-up prices and longer lead times. This exposure gap compounds further since large diversified security vendors can shift chip sourcing across multiple product lines and foundry partners more easily than specialized manufacturers dependent on a single chip supplier for their entire product portfolio.
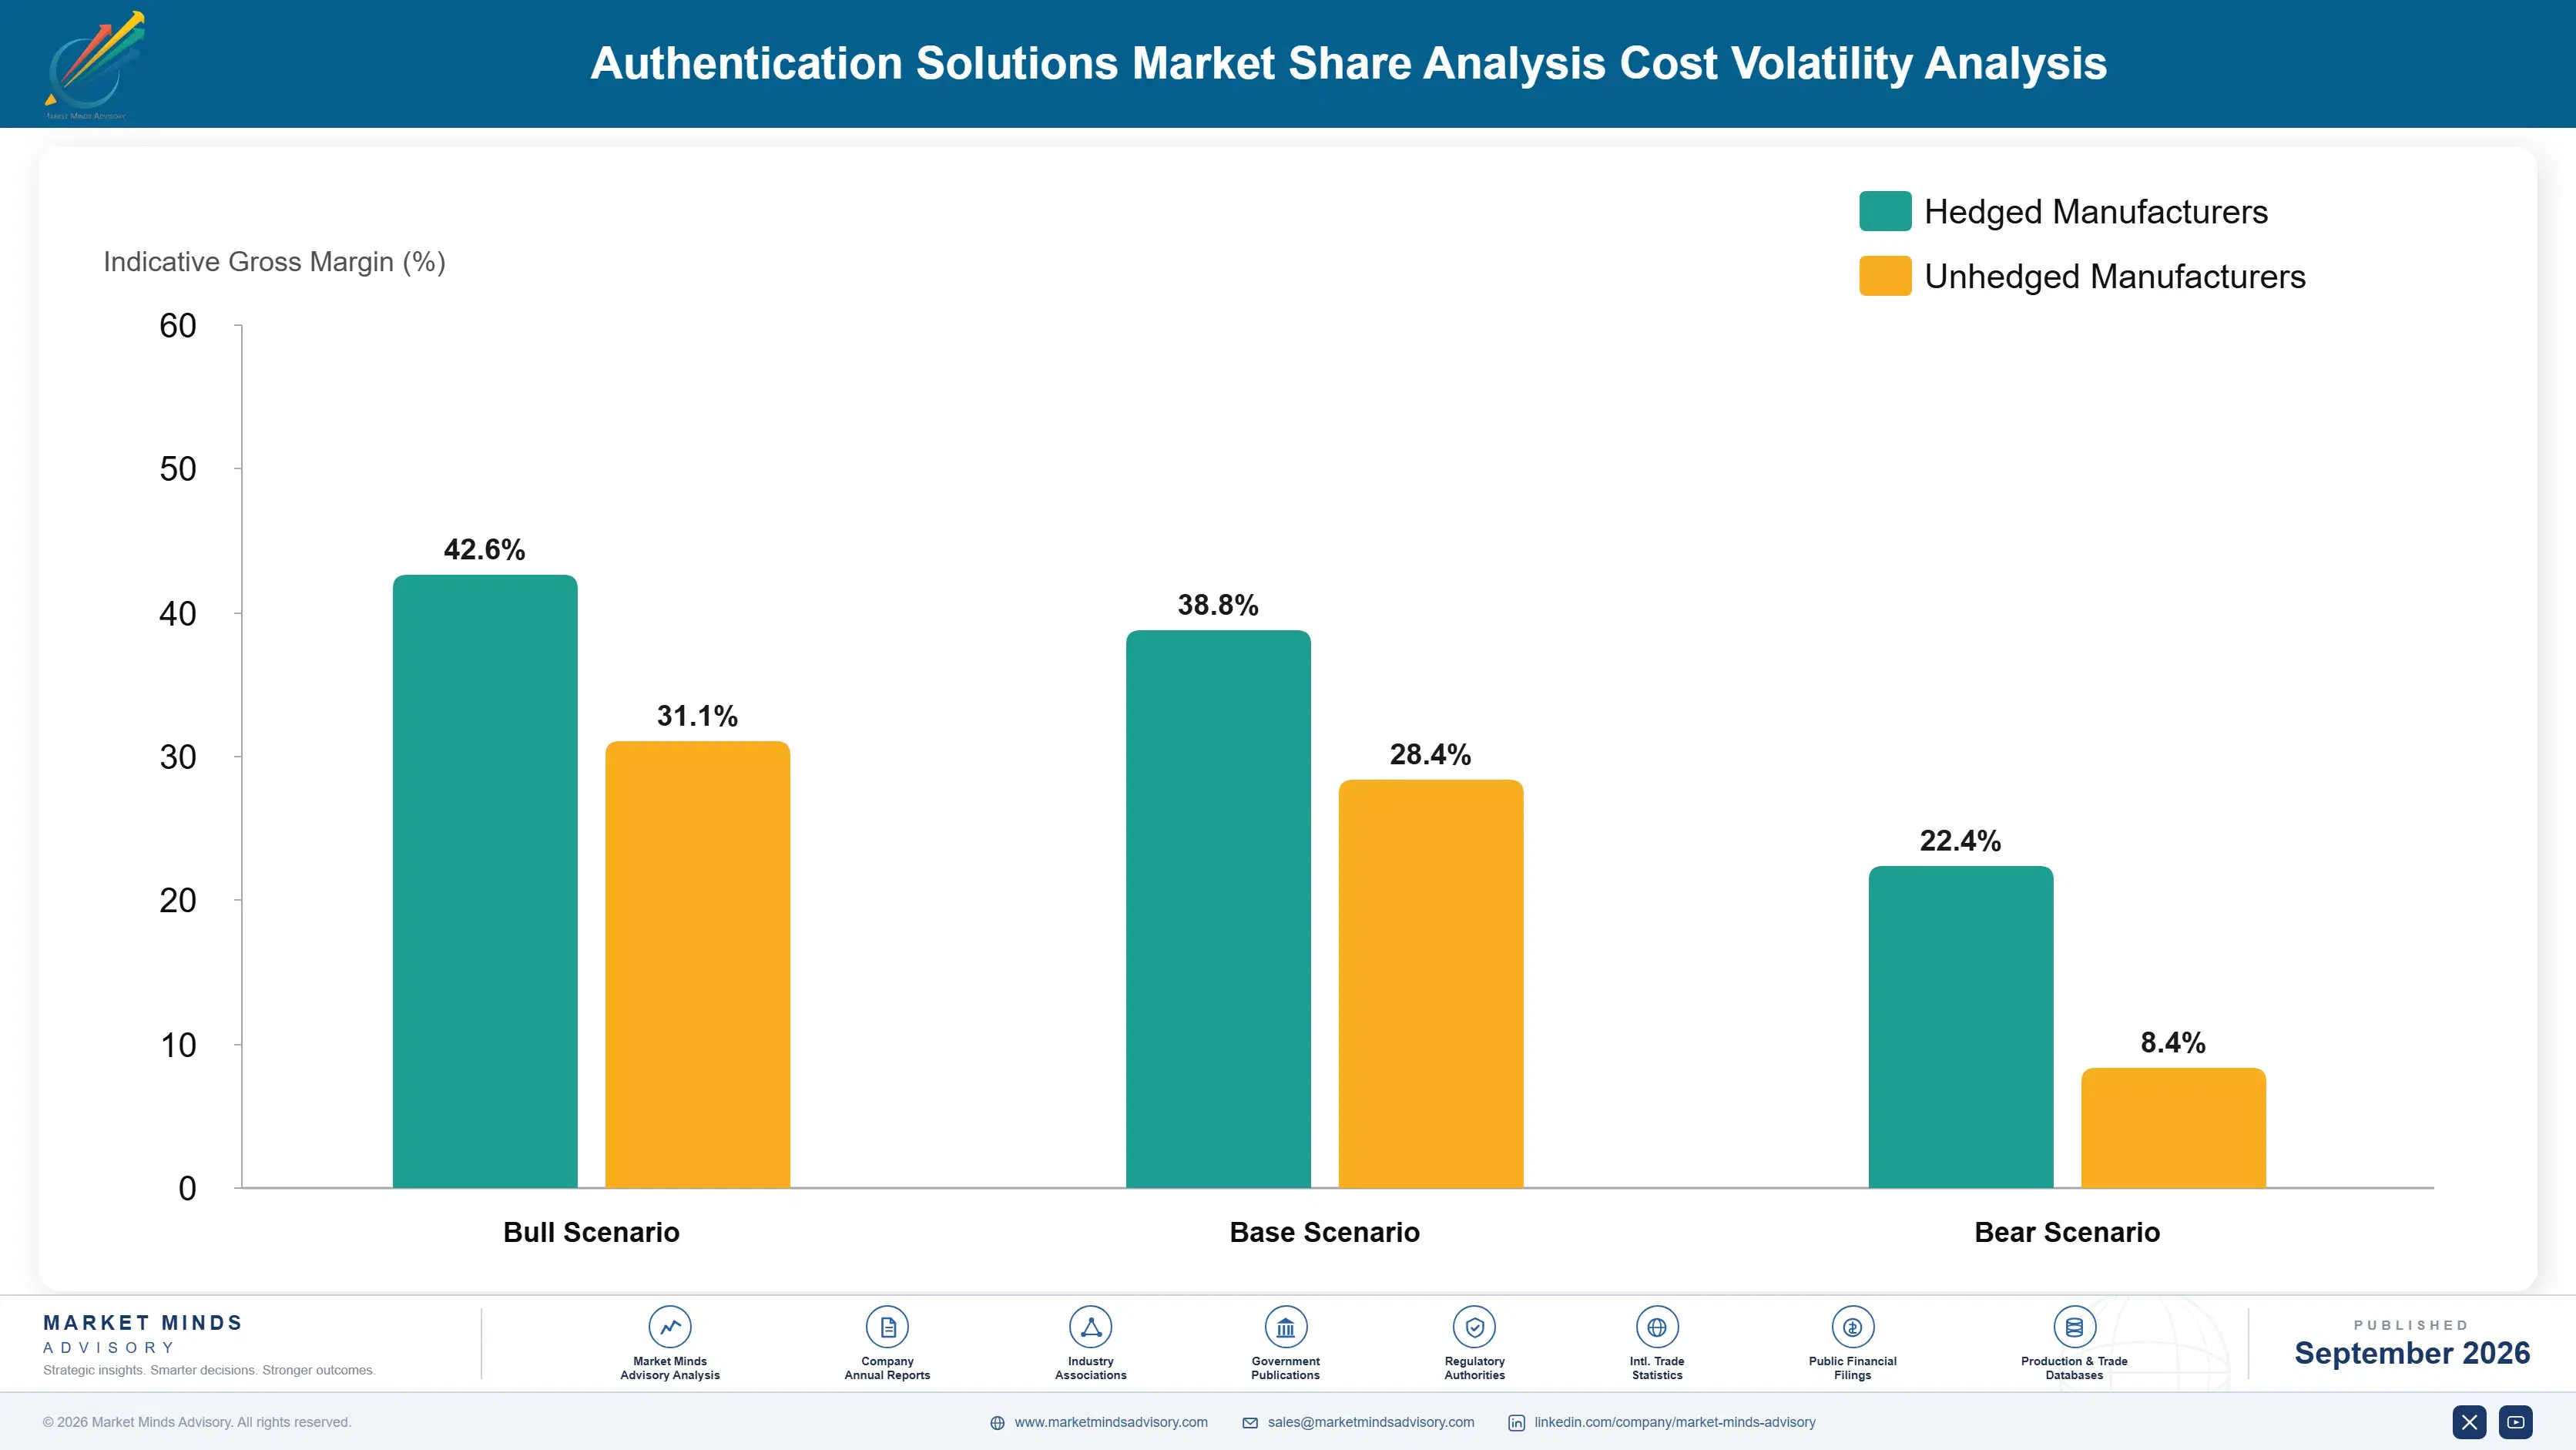
authentication-solutions-market-share-analysis-cost-volatility-analysis-1790006111499

Long Term Wafer Allocation Agreements

Locking in semiconductor wafer allocation through multi-year agreements with foundry partners shields larger manufacturers from capacity shortages during periods of industry-wide chip demand, though it requires forecasting production volume years in advance and carries meaningful penalty exposure if actual order volume falls well short of contracted minimums during an unexpected sudden demand slowdown or shift.

Multi Foundry Sourcing Diversification Strategy

Qualifying chip designs across multiple semiconductor foundries reduces single-source capacity dependency risk, though it requires additional engineering validation work to confirm performance consistency across different foundry processes and manufacturing tolerances involved. Manufacturers that diversified foundry relationships before the last chip shortage recovered delivery schedules considerably faster than single-source competitors still relying on one supplier.

Component Standardization Across Product Lines

Standardizing biometric sensor chips and secure element modules across multiple product lines lets manufacturers negotiate better volume pricing and simplifies inventory management during supply disruptions across the entire product portfolio and manufacturing footprint. This approach sacrifices some product differentiation flexibility but meaningfully reduces exposure to any single specialized component shortage affecting the broader manufacturing business overall.

Portfolio Architecture for Margin Defence

Gross margins vary meaningfully across the authentication portfolio, from thin margins on basic hardware tokens up to strong margins on behavioral biometrics and certified biometric hardware sold to regulated enterprise and government customers worldwide. Volume sits overwhelmingly in the commodity-adjacent hardware token tier, but value concentrates in the smaller behavioral analytics and certified biometric tiers instead, across nearly every regional market this study tracks in fine detail.
The tension between chasing unit volume and protecting margin plays out visibly in vendor sales strategy, where companies must decide how much to discount basic hardware tokens to win large enterprise accounts against how much to recoup through behavioral analytics and certification premium design wins that actually drive long-term profit across the full multi-year customer relationship each vendor maintains with its largest accounts.

High-value pools concentrate in behavioral biometrics, certified biometric hardware, and multi-modal bundled platforms, where customers pay for measurable fraud reduction and spoof resistance rather than raw commodity hardware alone. That is where most vendors are now directing new product development spend, well ahead of any planned expansion in commodity-tier hardware token functionality currently under consideration at most manufacturers today.

Basic Hardware Tokens and Knowledge-Based Authentication

Thin margin basic hardware tokens and knowledge-based authentication sold primarily on price through enterprise procurement channels, competing almost entirely on unit cost rather than advanced verification capability or software integration.
Gross Margin: 14-22%

Certified Biometric Hardware

Certified biometric hardware carrying proven spoof-resistance certification and liveness detection documentation, sold through direct sales relationships at a meaningful premium over basic uncertified alternatives and various unproven newer market vendors.
Gross Margin: 27-37%

Behavioral Biometrics and Multi-Modal Platforms

Advanced behavioral biometrics and multi-modal bundled platforms built around continuous verification and analytics integration, targeting customers willing to pay a premium for measurable fraud reduction and long-term layered security posture.
Gross Margin: 37-47%
authentication-solutions-market-share-analysis-portfolio-architecture-1790006111999

High-value Sub-segments and Strategic Watch-out

Behavioral Biometrics

Behavioral biometrics represent the highest value, fastest growing pocket of the market, driven by continuous fraud detection demand and recurring per-session licensing revenue that extends vendor lifetime value considerably across every enterprise account and renewal cycle for years to come across the entire wider industry.
Gross Margin: 37-47%

Biometric Authentication

Biometric authentication is a high-value, moderate-growth pocket where accuracy certification and spoof-resistance depth support durable pricing power even as unit growth moderates relative to newer behavioral biometric categories gaining share steadily across nearly every industry vertical tracked worldwide over the entire coming decade and beyond.
Gross Margin: 27-37%

Hardware Security Tokens

Hardware security tokens remain the volume core of the market, competing largely on price and basic reliability through enterprise procurement channels, generating thinner margins but still sustaining the largest absolute deployment base across nearly every regulated industry segment tracked globally each and every single year.
Gross Margin: 14-22%

Deepfake and Synthetic Media Spoofing

Deepfake and synthetic media spoofing is a strategic watch-out rather than a true revenue segment today, where vendors lacking advanced multi-modal liveness detection risk exclusion from high-security procurement shortlists as buyers grow increasingly wary of sophisticated spoofing attempts across the entire wider industry today already.
Gross Margin: n/a

Recurring Licensing and Hardware Refresh Revenue

Authentication solutions revenue increasingly resembles annuity revenue through per-user software licensing and periodic hardware token refresh cycles rather than a one-time deployment that concludes the customer relationship for good entirely. Enterprises that adopt biometric or hardware authentication typically expand coverage to additional applications and business units within two years, creating a durable expansion tail beyond the initial deployment that compounds meaningfully across the full account relationship over time and renewal cycles.
Adoption depth varies sharply by end-use vertical. Financial services and government agencies adopt hardware tokens and certified biometric modalities aggressively given strict regulatory audit requirements, while consumer technology platforms prioritize convenience-driven software authentication over hardware deployment, creating a meaningfully different specification profile within each specific vertical entirely across the wider market and broader product portfolio overall.

Buyer profiles are shifting as younger security executives increasingly treat passwordless and biometric authentication as standard baseline infrastructure rather than experimental technology pilots requiring extensive internal justification, broadening the addressable buyer base considerably beyond early enterprise adopters toward much more mainstream mid-market companies operating on tighter annual security budgets overall today across nearly every industry vertical tracked closely.
authentication-solutions-market-share-analysis-end-use-penetration-index-1790006112499

Where Authentication Value Concentrates

These are among the four positions where our research anticipates prominent divergence between winners and laggards over the coming forecast period. Each is grounded in the demand model, the regulatory perimeter, and the announced capacity pipeline.
01 / CERTIFICATION DEPTH INVESTMENT STRATEGY

Certification depth separates durable vendors from commodity hardware providers

Vendors that build deep spoof-resistance certification and behavioral analytics capability capture disproportionate lifetime value that competitors selling only uncertified hardware cannot easily match at comparable price or speed. That advantage compounds as regulated enterprises keep favoring vendors with proven certification depth over suppliers offering only basic authentication functionality across nearly every product category tracked. Vendors treating certification as optional will find their addressable customer base shrinking steadily as fraud prevention requirements keep rising across nearly every regulated sector this study tracks closely.
02 / BEHAVIORAL BIOMETRICS ADOPTION STRATEGY

Behavioral biometrics becomes the new continuous verification baseline

Behavioral biometrics are shifting from optional fraud detection add-on to baseline continuous verification layer faster than most vendor roadmaps anticipated just a few years ago at this point. Vendors committing engineering resources to behavioral analytics now will capture disproportionate share of new enterprise fraud prevention contracts through 2036 as buyers increasingly treat point-in-time login checks as an insufficient security measure across nearly every digital channel. Competitors relying solely on credential-based authentication risk losing customers to whichever vendor delivers continuous verification first.
03 / FOUNDRY SOURCING DIVERSIFICATION STRATEGY

Foundry diversification reduces vendor delivery and cost exposure meaningfully

Vendors that diversify semiconductor foundry sourcing beyond a single chip partner reduce delivery and cost exposure that competitors relying on one foundry cannot absorb as easily during periods of real capacity stress or allocation disruption. The 2021 chip shortage demonstrated how quickly delivery delays can spread for manufacturers lacking diversified foundry relationships across multiple semiconductor partners and geographic regions worldwide already operating at scale. Vendors that diversify foundry sourcing earliest will hold a meaningful delivery and resilience advantage over slower-moving rivals for years ahead.
04 / MULTI-MODAL BUNDLING PLATFORM STRATEGY

Multi-modal bundling becomes the next authentication competitive battleground

Diversified security giants and specialized biometric manufacturers are converging on multi-modal authentication bundling as the next major competitive battleground across the entire authentication solutions industry today. Vendors investing in layered biometric and behavioral verification now will protect enterprise contracts that competitors relying on single-modality authentication risk losing entirely as buyer expectations keep rising steadily across every regulated sector. This protection becomes more valuable as synthetic media and deepfake threats keep intensifying across every major digital industry tracked in this analysis.

Engagement Snapshot From the Field

A live engagement with an industry participant carrying material or product regulatory and market exposure ahead of a defining policy shift, showing how our research translates into a defensible multi-year portfolio strategy.
MARKET MINDS ADVISORY · CLIENT ENGAGEMENT SUMMARY
Authentication Solutions Share Analysis Producer Strategic Portfolio Review and Transition Roadmap 2026·Investment Scenario on Authentication Solutions Share Analysis Exposure Evaluation 2025-26
CLIENT PROFILE
The client is a mid-size digital-only bank serving 2 million retail customers across three countries, facing escalating account takeover fraud losses despite existing multi-factor authentication controls at login. Annual fraud losses attributed to compromised credentials were approximately 18 million dollars (client-reported, unverified by MMA) prior to the engagement, with authentication limited to one-time password verification.
STRATEGIC CHALLENGE
The client faced mounting fraud losses despite passing all regulatory strong customer authentication requirements, but leadership remained uncertain whether behavioral biometrics could meaningfully reduce fraud without adding friction that would hurt customer conversion rates. Leadership needed a credible evaluation framework before committing significant capital to a new fraud prevention layer.
MMA APPROACH
MMA conducted primary interviews with behavioral biometrics vendors and comparable digital banks already running continuous verification programs, benchmarked fraud detection accuracy and false positive rates across multiple vendor proposals, and modeled financial outcomes across three deployment scenarios ranging from limited pilot rollout to full customer base coverage spanning all three countries.
KEY FINDINGS
  1. Customer segments with the highest historical fraud incidence showed the strongest projected return on behavioral biometrics investment given existing loss exposure overall.
  2. Comparable digital banks running mature behavioral biometric programs reported fraud loss reduction exceeding 50 percent within just six months of full deployment.
  3. Behavioral biometric monitoring operated entirely in the background without adding any visible friction whatsoever to the customer login or overall transaction experience.
  4. Phased country-by-country rollout sequencing tested better than simultaneous full deployment, preserving customer experience while still capturing meaningful fraud reduction gains.
CLIENT PROFILE
The client is a mid-size digital-only bank serving 2 million retail customers across three countries, facing escalating account takeover fraud losses despite existing multi-factor authentication controls at login. Annual fraud losses attributed to compromised credentials were approximately 18 million dollars (client-reported, unverified by MMA) prior to the engagement, with authentication limited to one-time password verification.
STRATEGIC CHALLENGE
The client faced mounting fraud losses despite passing all regulatory strong customer authentication requirements, but leadership remained uncertain whether behavioral biometrics could meaningfully reduce fraud without adding friction that would hurt customer conversion rates. Leadership needed a credible evaluation framework before committing significant capital to a new fraud prevention layer.
MMA APPROACH
MMA conducted primary interviews with behavioral biometrics vendors and comparable digital banks already running continuous verification programs, benchmarked fraud detection accuracy and false positive rates across multiple vendor proposals, and modeled financial outcomes across three deployment scenarios ranging from limited pilot rollout to full customer base coverage spanning all three countries.
KEY FINDINGS
  1. Customer segments with the highest historical fraud incidence showed the strongest projected return on behavioral biometrics investment given existing loss exposure overall.
  2. Comparable digital banks running mature behavioral biometric programs reported fraud loss reduction exceeding 50 percent within just six months of full deployment.
  3. Behavioral biometric monitoring operated entirely in the background without adding any visible friction whatsoever to the customer login or overall transaction experience.
  4. Phased country-by-country rollout sequencing tested better than simultaneous full deployment, preserving customer experience while still capturing meaningful fraud reduction gains.
RECOMMENDED STRATEGY
Phase 1: Phase one: deploy behavioral biometric monitoring for the highest fraud incidence customer segment within the very first four calendar months. Phase 2: Phase two: expand deployment to the remaining customer base in the first country based on phase one fraud reduction results. Phase 3: Phase three: extend the validated deployment to the two remaining countries based on financial and fraud performance test data overall.
OUTCOME
Within nine months of initial deployment, the client reported a 55 percent reduction in account takeover fraud losses across the initial customer segment and secured board approval for full three-country rollout (client-reported, unverified by MMA), well ahead of the original fraud reduction target timeline set.

Frequently Asked Questions

Foundational context covering the market sizes, CAGR, scope, country, region and competition that inform every finding below. This section is provided to cover basics and most often pre-purchase conversations, answered from the MMA Primary Research Dataset.

What is the current size of the Authentication Solutions Market?

The global authentication solutions market was valued at approximately 22.0 billion dollars in 2025, covering biometric authentication, hardware security tokens, software authenticator applications, behavioral biometrics, knowledge-based authentication, and risk-based adaptive authentication.

How large will the Authentication Solutions Market be by 2036?

The market is projected to reach approximately 56.77 billion dollars by 2036, up from 23.98 billion dollars in 2026, an incremental gain of roughly 32.79 billion dollars over the forecast period.

What is the CAGR for the Authentication Solutions Market 2026 to 2036?

The market is expected to grow at a compound annual rate of 9.0 percent between 2026 and 2036, with a bull case near 10.3 percent and a bear case near 7.7 percent annually.

Which segment is growing fastest?

Behavioral biometrics leads segment growth at 13.0 percent annually, roughly 1.44 times the overall market rate, as continuous fraud detection replaces basic point-in-time login checks.

Who are the major companies in the Authentication Solutions Market?

Thales, IDEMIA, NEC Corporation, Fingerprint Cards AB, and HID Global lead the market on annual shipment revenue, together holding roughly 40 percent of combined global share.

Which country is growing fastest?

China leads country-level growth given its massive biometric sensor manufacturing capacity and rapidly expanding domestic facial recognition industry serving major digital payment platforms nationwide today.

Report Segmentation Architecture

The full report scope spans multiple orthogonal segmentation dimensions, with cross-tabulated demand data provided for each dimension pair. Coverage extends further to regional breakdowns, trend trajectories, and the competitive detail needed to support segment-level decision-making.

By Verification Method

  • Biometric Authentication
  • Hardware Security Tokens
  • Software Authenticator Applications
  • Behavioral Biometrics
  • Knowledge-Based Authentication
  • Risk-Based Adaptive Authentication

By End-Use Industry

  • Banking and Financial Services
  • Government and Public Sector
  • Healthcare
  • Retail and E-Commerce
  • Technology and Telecommunications
  • Travel and Hospitality

By Commercial Dimension

  • Direct Enterprise Sales
  • Original Equipment Manufacturer Integration
  • Distributor Channel Sales
  • Managed Service Provider Channel

By Region

  • North America
  • Western Europe
  • East Asia
  • South Asia and Pacific
  • Latin America
  • Middle East and Africa
  • Eastern Europe

Scope, Methodology, and Coverage

Every figure in this report is reproducible from documented input assumptions. The scope below maps the historical period, the forecast horizon, the segmentation dimensions, and the countries covered, alongside the underlying primary and qualitative methodology.
Historical Period
2020 to 2025
Forecast Period
2026 to 2036
Base Year
2025 (USD billions; MMA Primary Research Dataset, September 2026)
Market Definition
The authentication solutions market covers biometric authentication, hardware security tokens and keys, software authenticator applications, behavioral biometrics, knowledge-based authentication, and risk-based adaptive authentication technologies used to verify user identity. It excludes cloud identity governance and administration platforms, directory services, and privileged access management software sold as standalone enterprise platforms.
Quantitative Units
USD Billion, CAGR (%) 2026-2036
Segmentation Dimensions
Verification Method, End-Use Industry, Commercial Dimension, Region
Regions Covered
North America, Western Europe, East Asia, South Asia and Pacific, Latin America, Middle East and Africa, Eastern Europe
Countries Covered
US, Canada, Germany, UK, France, China, Japan, South Korea, Taiwan, India, Australia, Brazil, Mexico, UAE, South Africa
Key Companies Profiled
20
Quantitative Methodology
Primary survey, n=3,800 respondents, Q4 2025, six countries; demand-side model with trade association cross-validation
Qualitative Methodology
47 expert interviews, Q4 2025; applied to validate demand model assumptions, identify emerging dynamics, and assess competitive positioning
Report Format
PDF and XLSX data workbook (Word format preview document)
Publisher
Market Minds Advisory
Report Code
MMA-2026-TEC-708
Published
September 2026
Contact
sales@marketmindsadvisory.com | www.marketmindsadvisory.com

Purchase the full Authentication Solutions Market Share Analysis Report (2026 to 2036).

The full report delivers a complete strategic assessment of the authentication solutions market, spanning detailed segment-level forecasts, regional demand modeling, and competitive benchmarking across the top twenty market participants. It includes proprietary primary survey data covering three thousand eight hundred respondents and forty-seven expert interviews conducted in the fourth quarter of 2025. Buyers receive access to editable data tables alongside the narrative analysis for internal strategic planning use across security, fraud prevention, and product teams. The analysis is designed to support decisions on vendor selection, deployment sequencing, and capital investment over the coming decade.
Segment level revenue forecasts through the year 2036
Regional market sizing across seven world regions
Competitive benchmarking of twenty key market participants
Editable data tables for internal strategic planning
Primary survey data from 3,800 global respondents
Expert interview insights from 47 industry practitioners

Built For The People Who Decide

From boardroom strategy to bench-side execution, this report is read cover-to-cover by leaders shaping the next decade of their industry, turning demand scenarios, market dynamics and valuation benchmarks into decisions.
CXOs/ Presidents/ VPs/ Managers
M&A and Corporate Development
Strategy Teams and R&D Heads
Procurement and Product Directors
Regulatory and Compliance Leaders
Investor Relations and Equity Analysts