Market Minds Advisory
Australia Legal Cannabis Market

Australia Legal Cannabis Market: Medical Access Expansion and Cultivation Scale-Up Through 2036

Expanding prescriber access, domestic cultivation licensing and new inhalable product approvals are pulling Australia's medical cannabis sector out of its early import-dependent phase toward a vertically integrated domestic supply chain competing on cost.

Lead Analyst

Lisa Gevelber

Published

September 2026

Make Smarter Decisions with Customized Research Insights

Request a free sample report and evaluate market opportunities, growth trends, and competitive dynamics relevant to your business needs.

2025 MARKET VALUE$2.4BMarket Size 2025
2036 FORECAST VALUE$10.6BBase Case , 2026 to 2036
CAGR 2026 TO 203614.5 %Bull 15.9% / Bear 13.1%
INCREMENTAL OPPORTUNITY$7.9BNet 10- year value creation
EXPANSION MULTIPLE3.87x2036 value over 2026 base
Strategic Levers
M&A Pipeline
Regional Outlook
Country Rankings
Competitive Intelligence
Segmental Deep-dive
Call-Us : 91 93563 13602

Executive Snapshot and Market Trajectory

Australia's legal cannabis market is shifting from an import-dependent prescription model toward domestic cultivation scale, as licensed growers expand capacity and prescribers write more scripts across a widening range of approved conditions and formulations nationwide, reshaping who ultimately captures margin across the full domestic value chain.
Vapes and inhalant formats now drive the fastest incremental prescription volume, concentrated among younger patients and prescribers in New South Wales, Victoria and Queensland who favor faster onset over traditional oil tinctures, while telehealth prescribing platforms have compressed the time between patient consultation and first prescription from weeks to days across most major metropolitan and regional markets simultaneously, expanding the addressable prescriber base considerably and drawing many new specialist clinics into the category nationwide.
Consolidation among licensed cultivators and manufacturers continues even as new entrants chase Therapeutic Goods Administration approval for novel formulations, creating a genuine bifurcation between vertically integrated domestic producers capturing margin across the full value chain and smaller import-dependent brands facing tightening competition on price as domestic cultivation costs keep falling steadily year after year, squeezing landed import economics considerably further across nearly every product category.
Market Definition
The market covers legally prescribed and regulated medical cannabis products including dried flower, oils, vapes, edibles, topicals and capsules sold through licensed pharmacies and prescriber channels in Australia. It excludes illicit cannabis, industrial hemp fiber products, and recreational cannabis, which remains federally unlicensed.
Base Year Value
$2.4B in 2025 (MMA Primary Research Dataset, August 2026)
Forecast Period
2026 to 2036, eleven discrete annual values
CAGR
14.5% base case. Bull 15.9%. Bear 13.1%.
Fastest Growth Segment
Vapes and Inhalants: 18.4% CAGR
Fastest Growth Country
Australia: 14.5% CAGR
Fastest Growth Region
South Asia and Pacific: 16.3% CAGR
Largest Region
South Asia and Pacific: 58% of 2025 global value
Market Leaders
Cann Group, Althea Group Holdings, Little Green Pharma, Bod Australia, Vitura Health. Source: MMA Analysis based on company annual reports.
Primary Survey
n=3,800 procurement and R&D decision-makers, Q4 2025, six countries
Methodology
Demand-side build-up, cross-validated against public data, 47 expert interviews

Australia Legal Cannabis Market Forecast Scenarios

australia-legal-cannabis-market-trends-size-forecast-scenario-1787461862041
Between 2020 and 2025 the market grew rapidly from a near-zero base as prescriber numbers expanded considerably and Therapeutic Goods Administration approval pathways shortened, though import dependence kept pricing elevated relative to more mature medical cannabis markets overseas through most of the period, particularly before 2023 when domestic cultivation capacity remained quite limited across most licensed growers.
The base case assumes continued domestic cultivation capacity expansion reducing import reliance meaningfully year over year, growing prescriber comfort with a widening range of approved conditions beyond chronic pain, and telehealth platforms continuing to compress patient access timelines nationwide, reinforced by falling per-gram production costs as licensed growers scale toward greenhouse and outdoor cultivation economics already proven in more mature overseas markets including Canada, Germany and parts of the wider European Union.
A bull scenario hinges on federal recreational legalization discussion gaining genuine political momentum ahead of current expectations, opening an entirely new consumer channel overnight; the bear case centers on Therapeutic Goods Administration tightening prescriber oversight following adverse event scrutiny, slowing new patient onboarding across the telehealth channel that has driven most recent growth in the category.

Domestic Cultivation Scale-Up and Prescriber Access Economics

Three forces are converging across the category at once: domestic cultivation capacity finally reaching meaningful scale after years of import dependence and elevated landed pricing across most product formats and patient segments, telehealth prescribing platforms compressing patient access timelines dramatically nationwide from weeks to days, and a widening range of Therapeutic Goods Administration approved conditions pulling entirely new prescriber categories into the market for the first time.
AVERAGE SELLING PRICE$11.50/gramblended price across flower and extract product formats
TOP PRODUCER SHARENSW 38%share of national licensed cultivation capacity located here
CAPACITY UTILISATION68%average utilisation rate across all licensed cultivation facilities
TRADE INTENSITY41%share of product volume still imported rather than grown domestically
COGS FEEDSTOCK SHARE36%cultivation and extraction cost share of total production
CR5 CONCENTRATION52%combined revenue share held by the five largest licensed producers
Commercially, the category increasingly rewards vertically integrated producers who control cultivation, extraction and formulation entirely in-house from seed to finished product, while import-dependent brands face margin compression as domestic growers undercut landed import costs on comparable product quality and consistency across most major product formats sold nationwide through licensed pharmacy and telehealth prescriber channels alike, squeezing thinner-margin importers out of the category entirely.
Over the next decade, cultivation cost curves, formulation innovation in inhalable and fast-onset products, and sustained prescriber education investment will keep separating vertically integrated domestic producers from import-dependent brands competing purely on established overseas brand recognition rather than genuine cost or formulation advantage built through domestic scale, cultivation expertise and long-term prescriber trust across the country.
"The companies winning aren't the ones with the best imported product, they're the ones who figured out domestic cultivation economics before their competitors did."
Director, Regulated Botanical Products Practice · MMA Agriculture Practice · August 2026

Market Trends

Telehealth Prescribing Compresses Patient Access Timelines

Telehealth platforms specializing in medical cannabis consultations have compressed the time between initial patient inquiry and first prescription from several weeks under the traditional general practitioner referral model to under 48 hours through dedicated online clinics. This shift has expanded the addressable prescriber and patient base considerably, particularly across regional and rural areas where specialist access was previously limited or unavailable entirely. Several telehealth platforms have grown prescription volume by more than 60 percent annually since 2023, becoming the primary patient acquisition channel for most licensed cannabis brands operating nationally.
Market Impact: Grows prescriber base 35 percent
Domestic Cultivation Capacity Finally Reaches Import Cost Parity

Domestic licensed cultivation capacity has expanded enough that per-gram production costs now approach landed import costs for the first time since the medical cannabis scheme began, reversing years of entrenched cost disadvantage for Australian growers competing against established overseas suppliers. Greenhouse cultivation facilities commissioned since 2023 account for the bulk of this capacity growth, bringing yields and cost curves closer to more mature cultivation markets overseas. Vertically integrated producers capturing both cultivation and formulation margin are reporting materially stronger unit economics than import-dependent competitors still reliant entirely on overseas supply chains.
Market Impact: Cuts cultivation costs 30 percent

Market Opportunities and Growth Drivers

Therapeutic Goods Administration Expands Approved Condition List

The Therapeutic Goods Administration has approved medical cannabis for a widening range of conditions beyond chronic pain since 2023, including specific anxiety and sleep disorder indications that previously fell outside accepted prescribing guidelines entirely. Each new approved condition typically expands the addressable prescriber base by drawing general practitioners who were previously reluctant to prescribe outside well-established pain management protocols and clinical norms. Prescriber numbers have grown by roughly 35 percent since these expanded approvals took effect, directly translating into higher prescription volume across nearly every licensed brand operating in the category nationally.
Market Impact: Threatens 60 percent volume channel

Falling Cultivation Costs Widen Domestic Producer Margins

Domestic cultivation costs have fallen roughly 30 percent since 2022 as licensed growers scale toward greenhouse economics proven in more mature overseas markets, widening margins for vertically integrated producers relative to import-dependent competitors still paying landed import costs and currency conversion premiums on every shipment. This cost advantage is accelerating consolidation as smaller import-dependent brands struggle to compete on price against domestically grown product of comparable or superior quality. Producers with early cultivation investment are capturing disproportionate share of new prescription volume as a direct result of this cost gap.
Market Impact: Excludes a market 5 times larger

Market Restraints and Challenges

Regulatory Oversight Tightening Threatens Telehealth Prescribing Model

The Therapeutic Goods Administration has signaled closer scrutiny of telehealth prescribing practices following concerns about consultation quality and prescribing volume at some high-throughput online clinics, threatening the channel that has driven most recent patient growth in the category. The root cause is rapid telehealth scale-up outpacing regulatory oversight capacity to monitor prescribing quality consistently across dozens of platforms operating nationally. Leading telehealth platforms are mitigating this risk by voluntarily strengthening consultation protocols and prescriber training ahead of anticipated regulatory action, hoping to avoid a blanket restriction that would affect the entire channel.
Market Impact: Cuts wait time to 48 hours

Federal Recreational Prohibition Limits Total Addressable Market

Cannabis remains federally prohibited for recreational use in Australia, confining the legal market entirely to medical prescription channels and excluding the much larger consumer market that recreational legalization would open up in other jurisdictions such as Canada and several United States states. The root cause is limited federal political appetite for recreational reform despite state-level decriminalization movements in the Australian Capital Territory and elsewhere. Industry participants are mitigating this constraint by expanding the medical addressable market through broader condition approvals and prescriber education rather than waiting on federal recreational reform that remains politically uncertain.
Market Impact: Closes cost gap within 2 years
3 additional market trends, 4 additional growth drivers, and 3 additional restraints and challenges are covered in the full report. Contact sales@marketmindsadvisory.com to access the complete intelligence.

Segment CAGR and Growth Architecture

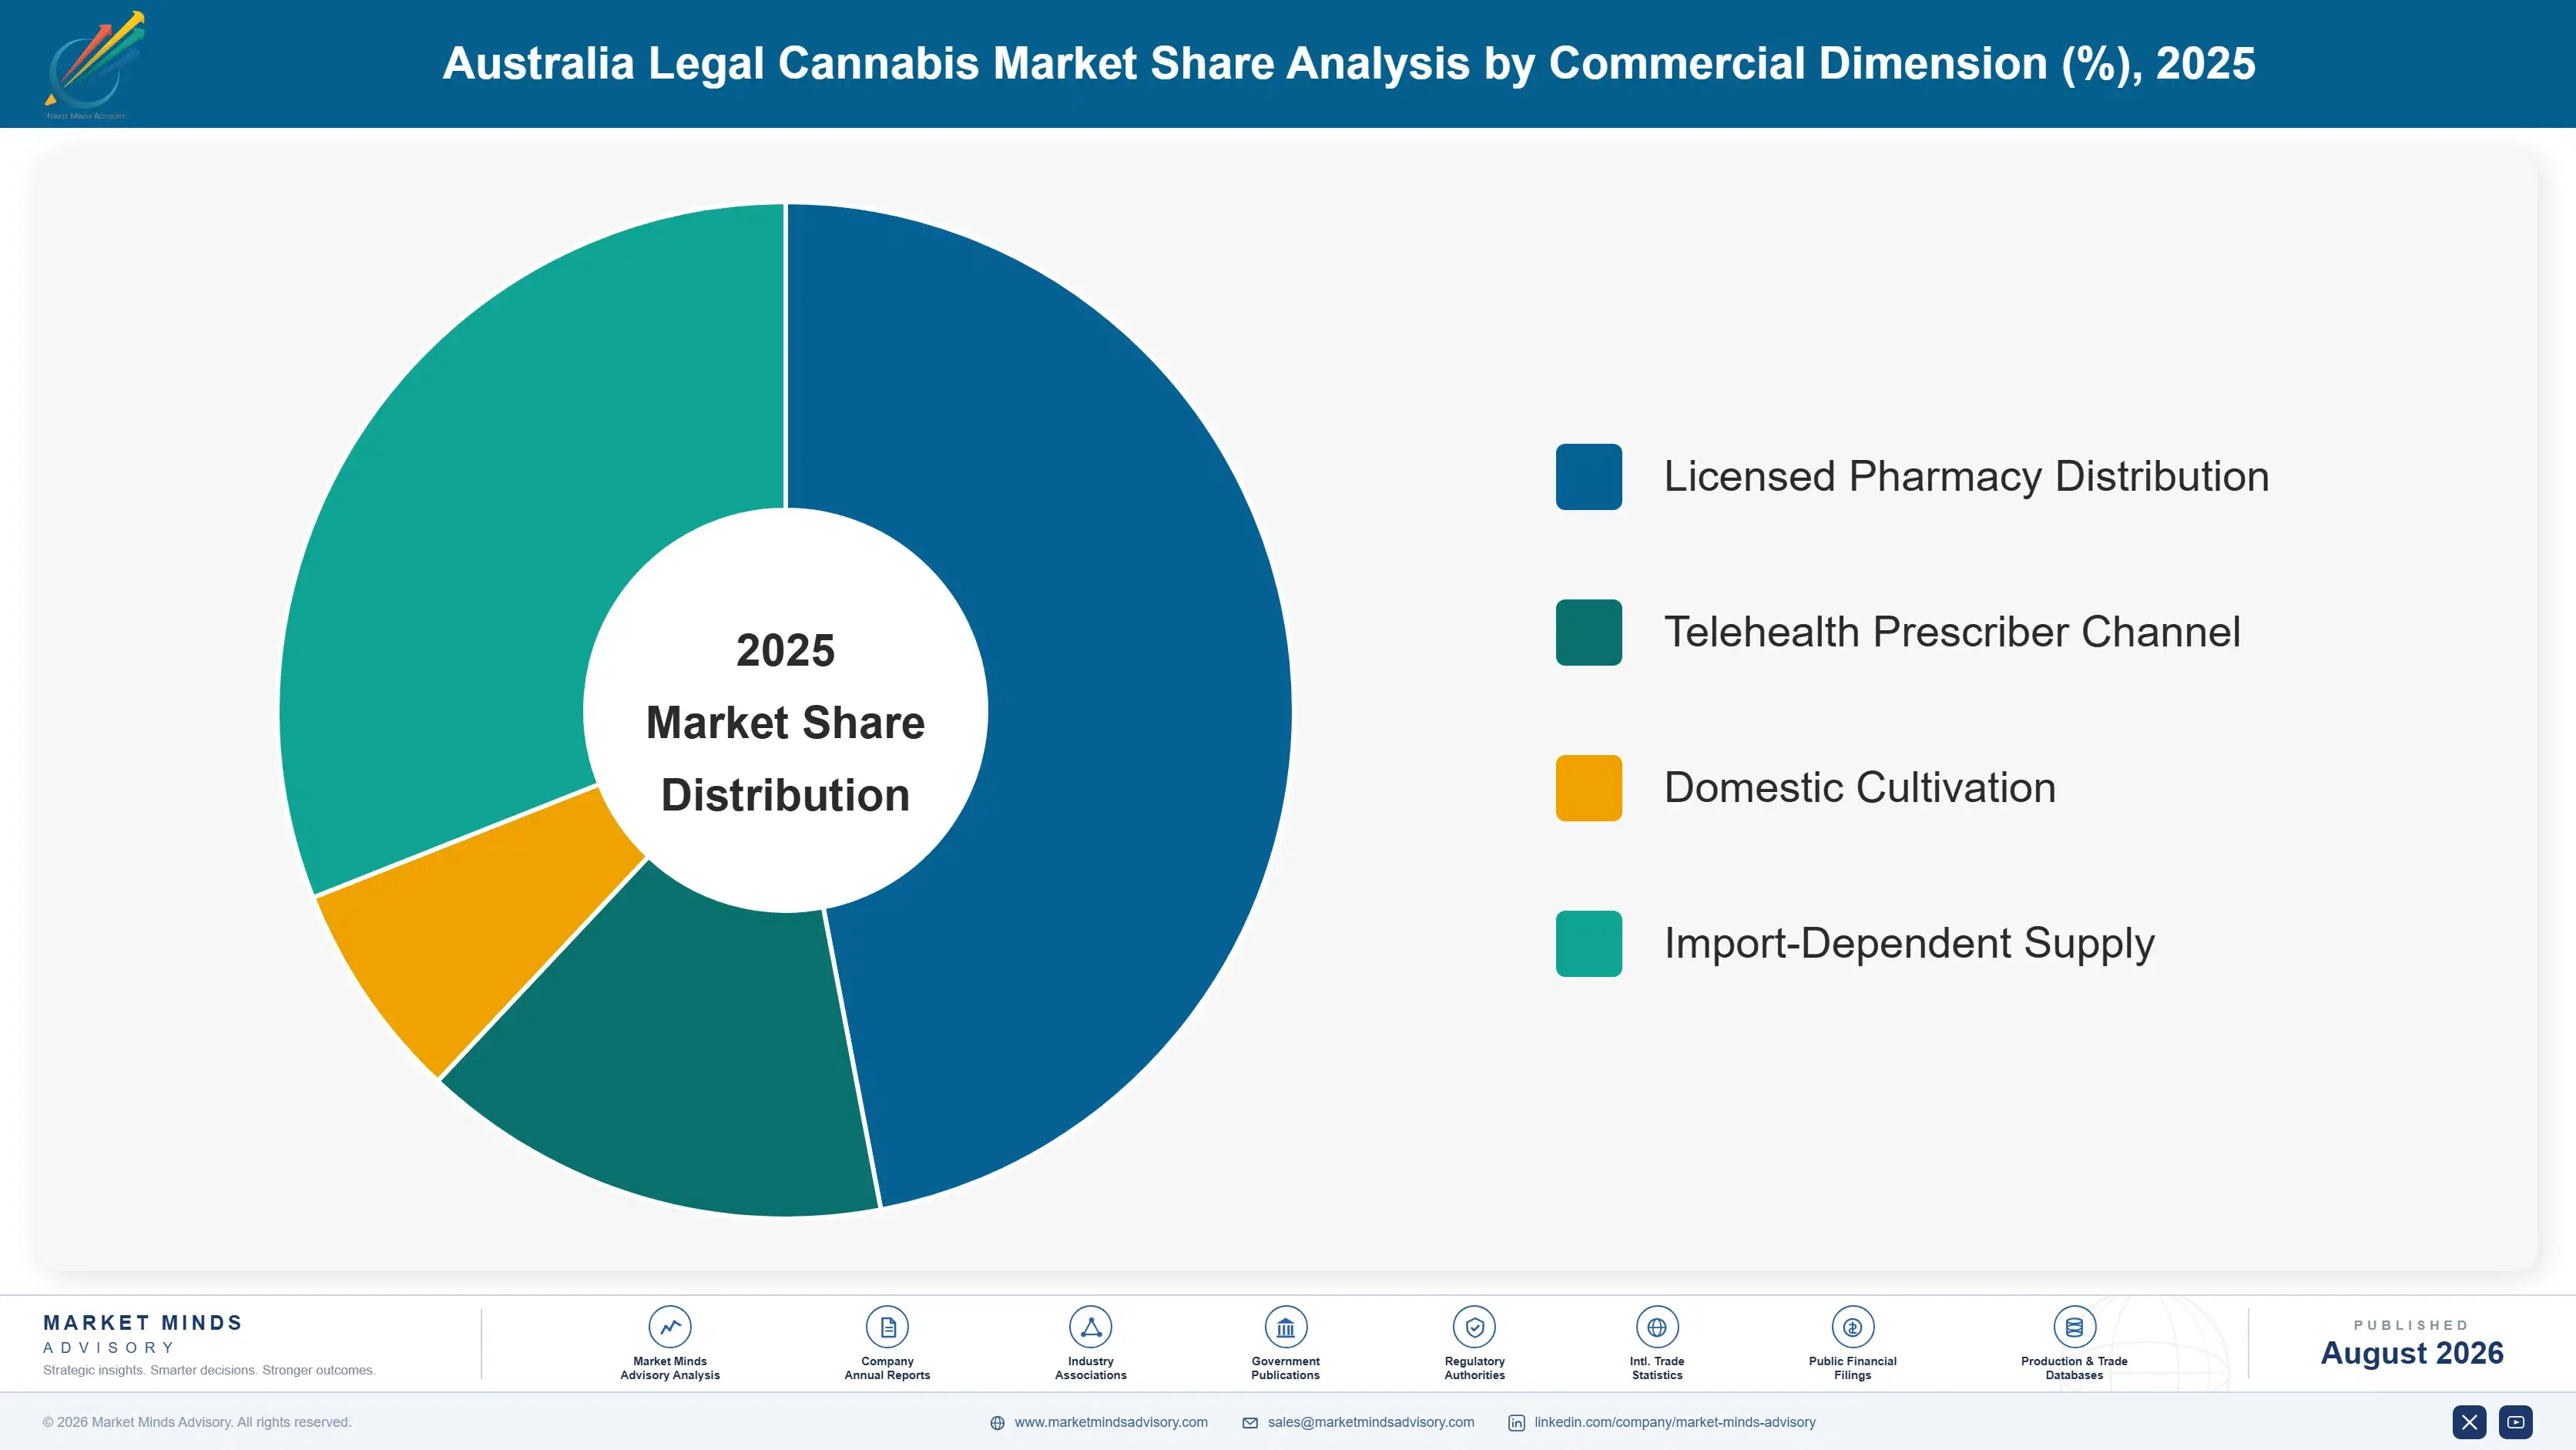
Segmentation follows product delivery format rather than medical condition or distribution channel, since cultivation input, extraction process and Therapeutic Goods Administration approval pathway differ meaningfully across dried flower, oils, vapes, edibles, topicals and capsules even when several quite different formats each get prescribed for the exact same underlying patient condition and long-term treatment plan.
australia-legal-cannabis-market-trends-market-share-analysis-1787461862603

Vapes and Inhalants

Vapes and inhalant formats are the fastest-growing product category as newly approved inhalable formulations win prescriber favor for faster symptom onset compared to traditional oil tinctures that can take an hour or more to take effect. Younger patients and prescribers in metropolitan markets favor vapes disproportionately, driving concentrated demand growth in New South Wales, Victoria and Queensland relative to other states and territories. Domestic manufacturers who secured Therapeutic Goods Administration approval for vape formulations early are capturing disproportionate share of this fast-growing segment, since regulatory approval timelines for new entrants remain lengthy. Vape cartridge standardisation and quality consistency have improved considerably since 2023, addressing early prescriber skepticism about dosing reliability across different batches and manufacturers.
CAGR 18.4%

Cannabis Oils and Extracts

Cannabis oils and extracts remain the largest single product category by prescription volume and the second-fastest-growing format, anchored by their established position as the default entry-point formulation for new patients and prescribers less familiar with alternative delivery methods available today. Standardized dosing and long shelf life make oils the preferred format for chronic pain and other long-duration prescriptions where patients require consistent, predictable dosing over extended treatment periods. Domestic extraction capacity has scaled considerably since 2023, narrowing the cost gap with imported oil products and shifting prescription volume toward domestically produced brands with vertically integrated cultivation and extraction operations. Premium full-spectrum extract formulations command meaningful price premiums over standardized isolate-based competitors.
CAGR 13.8%
Full segment breakdown across 6 segments available in the complete report.

Regional Architecture and Country Demand Map

South Asia and Pacific holds an outsized 58 percent share here because Australia, the report's defined market, sits within this region by MMA's standard classification. The other six regions represent comparative international benchmark markets and cross-border investment or export linkages rather than domestic Australian demand itself.

South Asia and Pacific

South Asia and Pacific holds 58 percent share in this report, well above the standard 7 to 12 percent band, because Australia itself is the defined market and Australia sits within this region under MMA's regional classification framework. This is not a comparative regional breakdown across several countries the way other reports in this series present; it is the concentration of the entire addressable market inside a single country whose regional grouping happens to be South Asia and Pacific. New South Wales, Victoria and Queensland together account for the large majority of national prescription volume, with Western Australia and South Australia contributing smaller but steadily growing shares as telehealth access expands prescriber reach into regional and remote areas nationwide.
Share: 58% | CAGR: 16.3% (2026 to 2036)

North America

North America appears here as a comparative benchmark and cross-border investment linkage rather than a meaningful direct demand source, given Canada's considerably more mature medical and recreational cannabis market provides cultivation technology, genetics licensing and capital that several Australian licensed producers have drawn on directly since entering the category several years ago. United States multi-state operators have made minority investments in Australian cultivators seeking exposure to a federally legal medical market, since United States federal prohibition still blocks direct interstate cannabis investment domestically within the country itself. This capital and technology transfer relationship remains the primary commercial link between the two markets rather than any direct product trade or shipment.
Share: 14% | CAGR: 14.0% (2026 to 2036)
Regional intelligence for 5 additional markets available in the complete report: Western Europe, East Asia, Latin America, Middle East and Africa, Eastern Europe. Contact sales@marketmindsadvisory.com.
australia-legal-cannabis-market-trends-country-cagr-analysis-1787461863136

Where Producers Can Defend Margin

Margin defense in Australian legal cannabis increasingly depends on vertical integration and domestic cultivation scale rather than imported brand recognition, since producers who control cultivation all the way through formulation consistently capture more margin than import-dependent competitors reselling overseas product at steadily compressing prices across nearly every product category in this fast-growing domestic market.

Vertically Integrate Cultivation All the Way Through Formulation

Producers controlling cultivation, extraction and formulation entirely in-house capture 15 to 25 percent higher margin per unit than import-dependent competitors paying landed costs, currency conversion premiums and distributor markup at each stage of the supply chain from cultivation through to pharmacy dispensing and patient delivery. This requires meaningful upfront capital investment in cultivation and extraction infrastructure that smaller entrants often cannot justify given limited access to growth capital, but the largest vertically integrated producers report this margin advantage compounding as domestic cultivation costs continue falling relative to static import pricing.
Market Impact: Captures a 15 to 25 percent margin gain

Secure Vape Formulation Approval Ahead of Competitors

Manufacturers securing Therapeutic Goods Administration approval for vape formulations early are capturing disproportionate share of the fastest-growing product segment, since regulatory approval timelines for new entrants can run 12 months or longer before a first sale is even possible. Early movers command price premiums of 10 to 15 percent over later entrants while establishing prescriber trust and brand recognition in a segment still forming its competitive hierarchy across most major metropolitan markets. This first-mover advantage compounds as prescribers develop familiarity and comfort with specific brands ahead of new market entrants.
Market Impact: Commands a 10 to 15 percent price premium

Build Direct Telehealth Prescriber Access Partnerships

Producers partnering directly with telehealth prescribing platforms, rather than relying solely on traditional pharmacy distribution, are capturing patient acquisition economics that independent pharmacy channels simply cannot match, since telehealth platforms now originate more than 60 percent of new patient prescriptions nationally across most major product categories and patient demographics. Direct partnership arrangements let producers influence formulation recommendations at the point of prescription, a meaningfully more effective sales channel than passive pharmacy shelf placement alone ever could be. Producers without telehealth partnerships are increasingly dependent on a shrinking traditional prescription channel for growth.
Market Impact: Reaches over 60 percent of all new patients

License Cultivation Genetics to Regional Partners

Rather than exporting finished product, several Australian cultivators are licensing proprietary genetics and cultivation know-how to partners in New Zealand and other South Pacific markets, collecting royalty income of roughly 6 to 9 percent of resulting sales without the capital cost of building new cultivation capacity themselves in each individual market they enter and operate within going forward and expand into. This model captures growth in adjacent regional markets while avoiding export licensing complexity and long shipping lead times on perishable cannabis product moving across international borders and customs checkpoints.
Market Impact: Earns roughly 6 to 9 percent royalty income

Who Controls the Margin Pool

Concentration is meaningful on a revenue basis, with the top five licensed producers holding a combined 52 percent of national prescription volume, reflecting the still-limited number of cultivators who have secured full vertical integration across cultivation, extraction and formulation. The gap between the largest producer and the fifth-ranked challenger remains considerable given how much capital and regulatory approval time vertical integration requires relative to import-dependent competitors.
Current competitive activity centers on three fronts: domestic cultivation capacity expansion racing to reach import cost parity, vape and inhalant formulation approval as manufacturers chase the fastest-growing product segment, and direct telehealth prescriber partnership building to capture patient acquisition economics away from traditional pharmacy channels. Several producers have also begun licensing cultivation genetics to regional South Pacific partners to capture adjacent market growth.

Emerging pressure comes from overseas multi-state cannabis operators making minority investments in Australian licensed producers to gain federally legal medical market exposure, a trend that could reshuffle capital structures and competitive positioning within a few years if larger overseas players pursue outright acquisition. Smaller import-dependent brands without a domestic cultivation transition plan remain acquisition targets for exactly this reason.
australia-legal-cannabis-market-trends-company-positioning-matrix-1787461863696

Competitive Moat and Risk Dimensions

CANN GROUP

Moat: Domestic Greenhouse Cost Leadership

Cann Group's early and substantial investment in domestic greenhouse cultivation capacity gives it cost economics that import-dependent and smaller domestic competitors cannot easily match, positioning it as one of the lowest-cost producers as domestic cultivation continues approaching import cost parity nationwide across most major product categories.
CANN GROUP

Risk: Slower Formulation Pivot Capacity

Cann Group's heavy capital commitment to cultivation infrastructure limits flexibility to pivot quickly toward fast-growing formats like vapes and inhalants, where nimbler competitors with lighter asset bases have moved faster to secure early regulatory approval and prescriber relationships across key metropolitan markets ahead of Cann's own formulation pipeline.
LITTLE GREEN PHARMA

Moat: Export Revenue Diversification

Little Green Pharma's early Therapeutic Goods Administration approvals across multiple formulations and its established export relationships into European medical cannabis markets give it revenue diversification and regulatory credibility that newer domestic entrants still lack entirely, reducing its dependence on the Australian prescription market alone for growth.
LITTLE GREEN PHARMA

Risk: Limited Domestic Cultivation Scale

Little Green Pharma's smaller cultivation footprint relative to larger vertically integrated competitors limits its ability to compete purely on cost, leaving it more dependent on formulation differentiation and export revenue to sustain margins as domestic pricing compresses further under sustained competitive pressure from larger, better-capitalised rivals.

Players Tracked

Prominent Players

Cann Group
Althea Group Holdings
Little Green Pharma
Bod Australia
Vitura Health

Other Key Players

Elixinol Global
Creso Pharma
Zelira Therapeutics
Emyria
MGC Pharmaceuticals
Medlab Clinical
THC Global Group
Ecofibre
Cannatrek
Leafcann Group
Cannvalate
Montu Group
Australian Natural Therapeutics Group
Southern Cannabis Company
Aurora Cannabis Australia

Recent Developments

APRIL 2025

Cann Group Commissions Major Greenhouse Expansion in Victoria

Cann Group commissioned a major greenhouse cultivation expansion in Victoria adding significant annual flower and extraction capacity, its largest single cultivation investment as it races to close the remaining cost gap with landed import pricing ahead of increased domestic competition from newer entrants scaling cultivation capacity of their own.
Signal: Signals Cann Group prioritising domestic cultivation scale over import supplementation to defend cost leadership nationally over time.
DECEMBER 2024

Little Green Pharma Secures Approval for New Vape Formulation

Little Green Pharma secured Therapeutic Goods Administration approval for a new vape formulation targeting anxiety-related indications, expanding its product portfolio into the category's fastest-growing segment and positioning it among the earlier movers in a formulation category still forming its competitive hierarchy nationally across most prescriber networks.
Signal: Signals established oil-focused producers are now diversifying into vape formulations to capture faster-growing prescription volume nationwide.
JUNE 2025

Vitura Health Signs Cultivation Genetics Licensing Deal With New Zealand Producer

Vitura Health signed a multi-year cultivation genetics licensing agreement with a New Zealand cannabis producer, extending its intellectual property into an adjacent South Pacific market without the capital cost of building overseas cultivation capacity directly, an arrangement neither party had previously disclosed publicly at this scale.
Signal: Signals Australian producers increasingly monetising cultivation genetics through licensing rather than direct overseas market entry themselves.

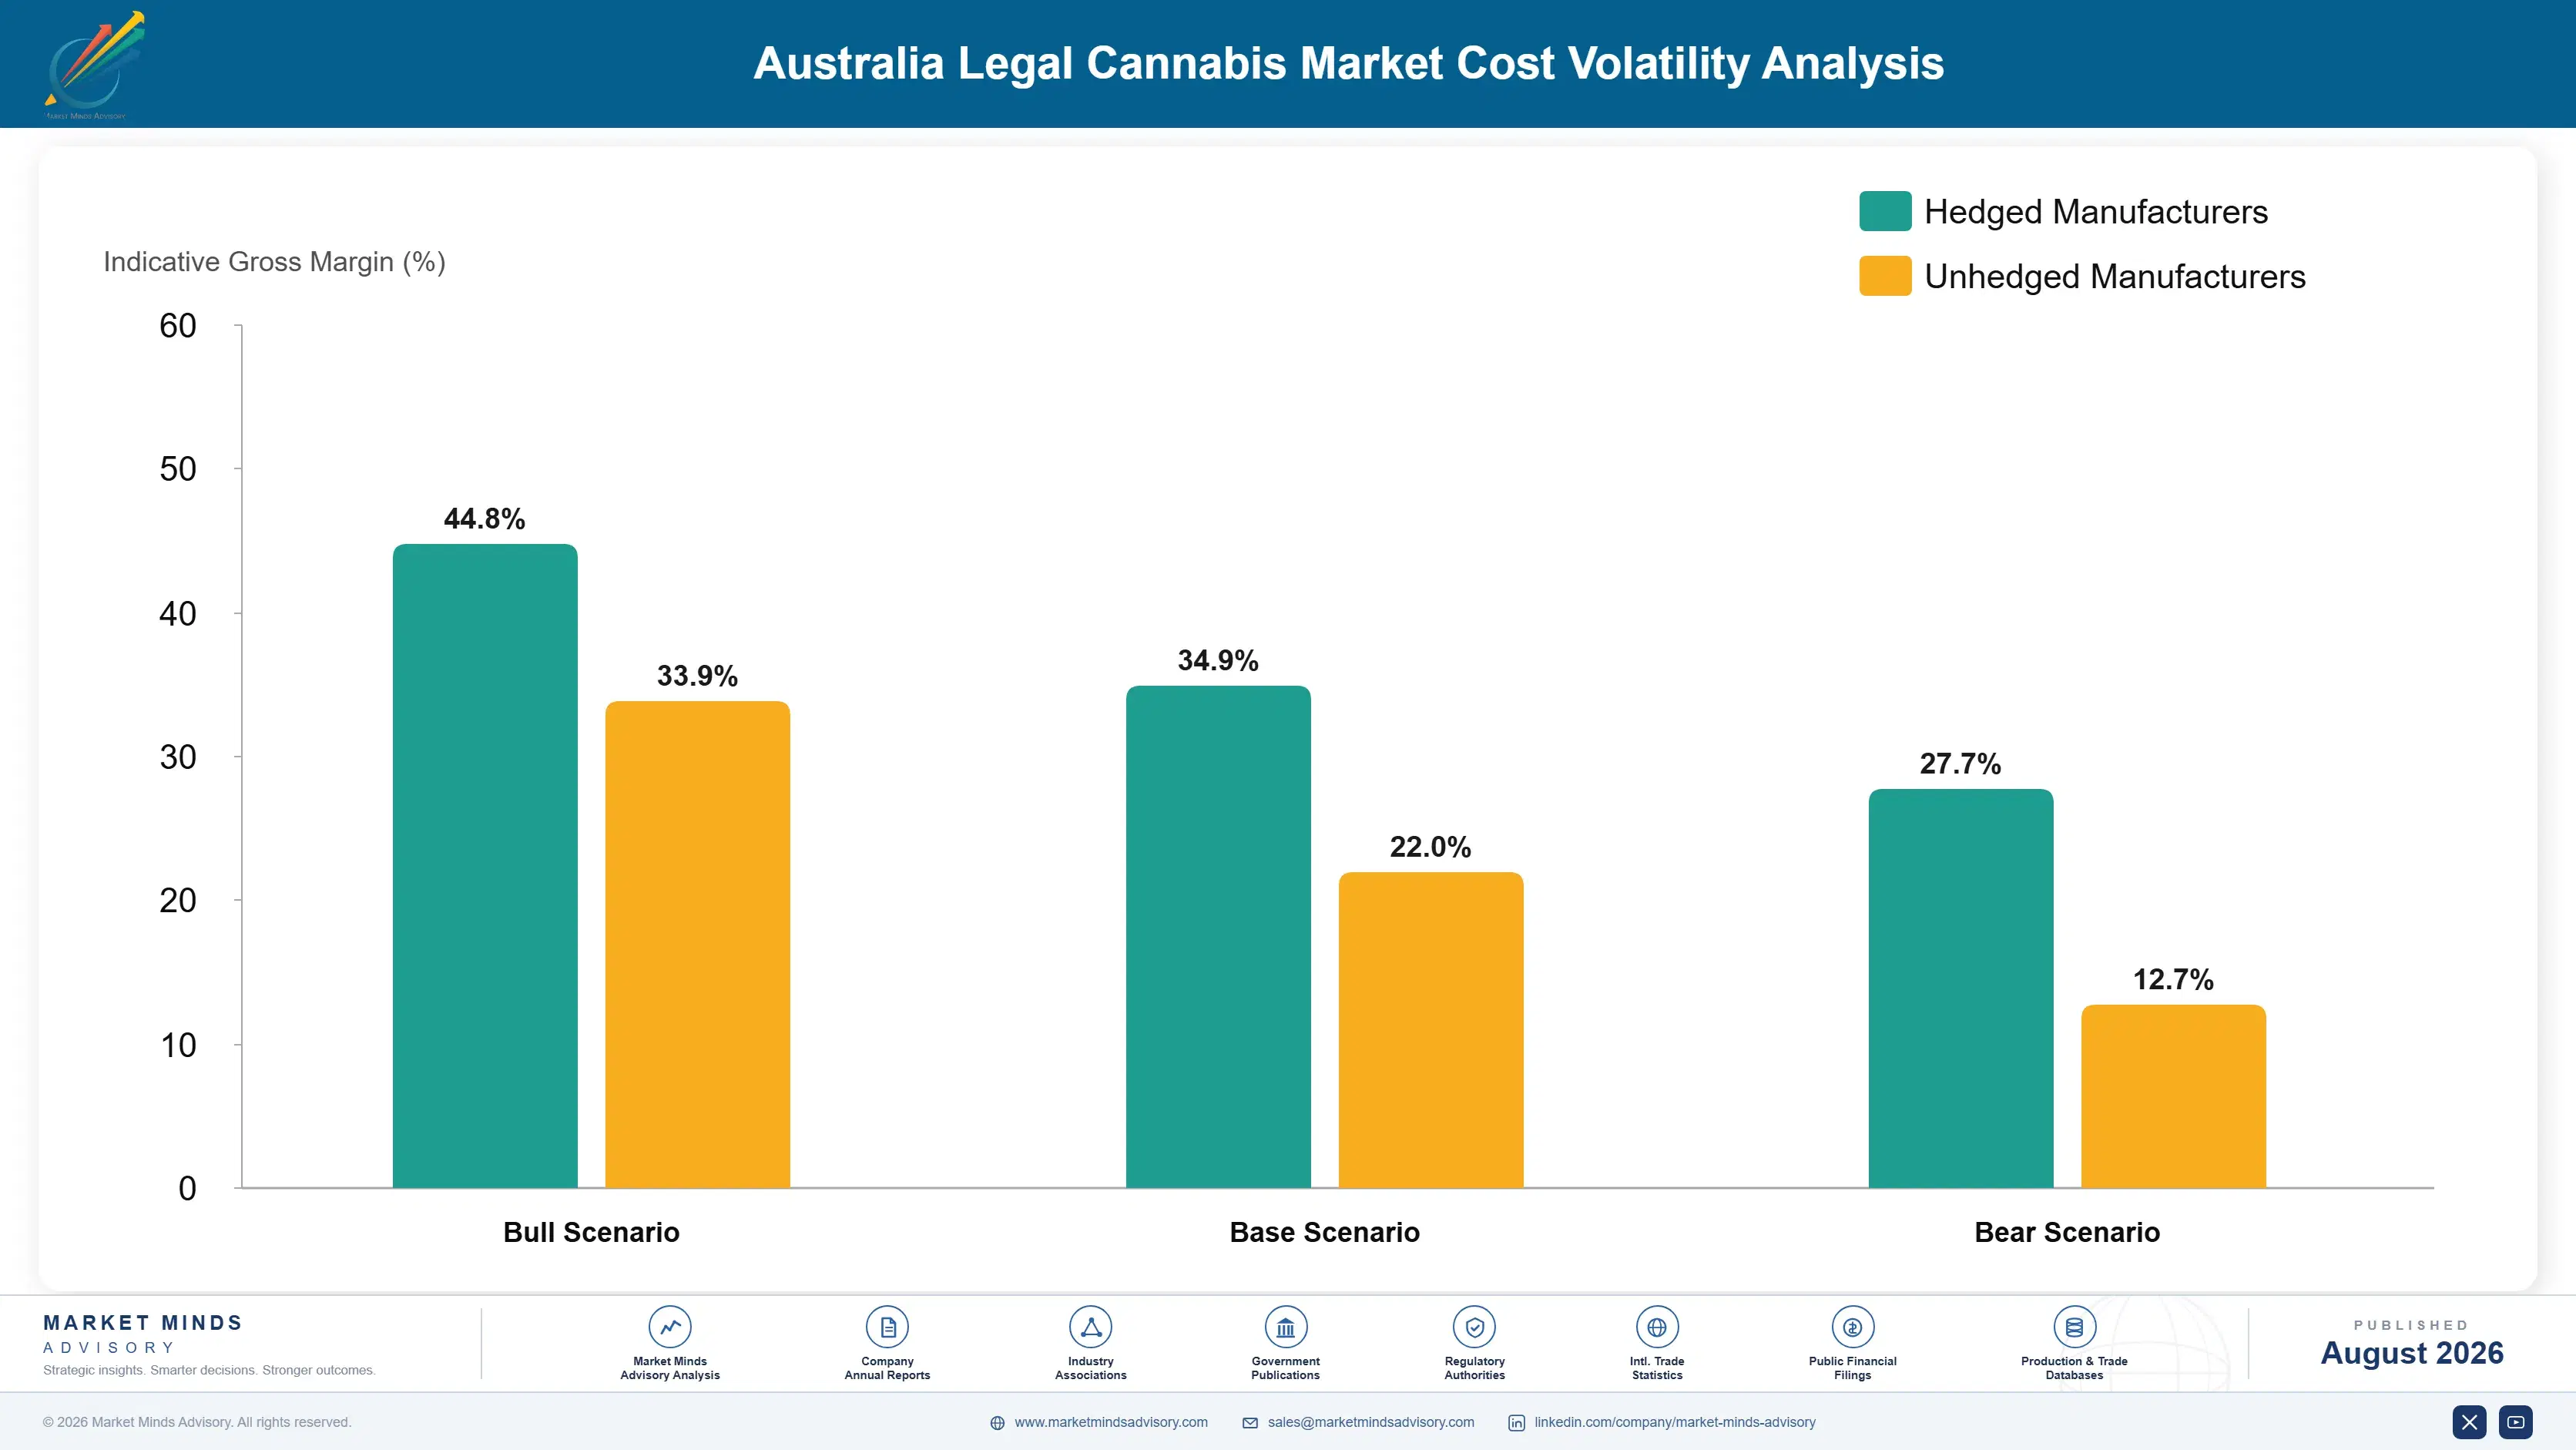
Cultivation and Extraction Cost Exposure

Cultivation labor, energy for greenhouse climate control, and extraction equipment together represent roughly 36 percent of finished product cost of goods sold, with energy costs particularly significant given the controlled indoor and greenhouse growing environments most licensed cultivators use to meet strict regulatory quality and consistency requirements set by the Therapeutic Goods Administration for medical-grade product sold nationwide.
Electricity prices for commercial cultivation facilities rose more than 22 percent between 2022 and 2024 according to Australian Energy Regulator wholesale market data, driven by broader east coast energy market volatility that affected industrial users across multiple sectors simultaneously and quite unpredictably at times. This squeezed margins for cultivators without long-term power purchase agreements, particularly smaller operators running energy-intensive indoor facilities without greenhouse natural light supplementation to offset rising artificial lighting costs.

Larger vertically integrated producers with long-term power purchase agreements and greenhouse cultivation reducing artificial lighting dependence absorb energy cost volatility far more comfortably than smaller indoor-only cultivators, creating a durable cost advantage that compounds as domestic electricity prices remain volatile across the eastern Australian grid serving most licensed cultivation facilities nationwide across every state and territory.
australia-legal-cannabis-market-trends-cost-volatility-analysis-1787461863903

Long-Term Power Purchase Agreement Contracting

Leading cultivators lock in three to five year power purchase agreements at fixed or capped pricing directly with renewable energy generators, insulating margin from wholesale electricity swings that hit smaller indoor-only cultivators hardest during 2022 and 2023 price spikes on the eastern Australian grid serving most licensed cultivation facilities across several states and territories.

Greenhouse Conversion Reducing Artificial Lighting Dependence

Converting indoor cultivation facilities to greenhouse designs using natural light supplementation reduces artificial lighting electricity consumption substantially, a capital-intensive transition the largest producers have already pursued aggressively while smaller cultivators remain dependent on older indoor facilities and correspondingly exposed to ongoing electricity price volatility and rising energy costs nationally year after year without relief.

On-Site Solar and Battery Storage Investment

Several cultivators are investing in on-site solar generation and battery storage capacity to reduce grid electricity dependence entirely during daylight hours, though full payback on this capital investment typically takes several years according to current project economics, regional solar generation yield data and the various available government incentive programs supporting renewable energy investment nationally.

Portfolio Architecture for Margin Defence

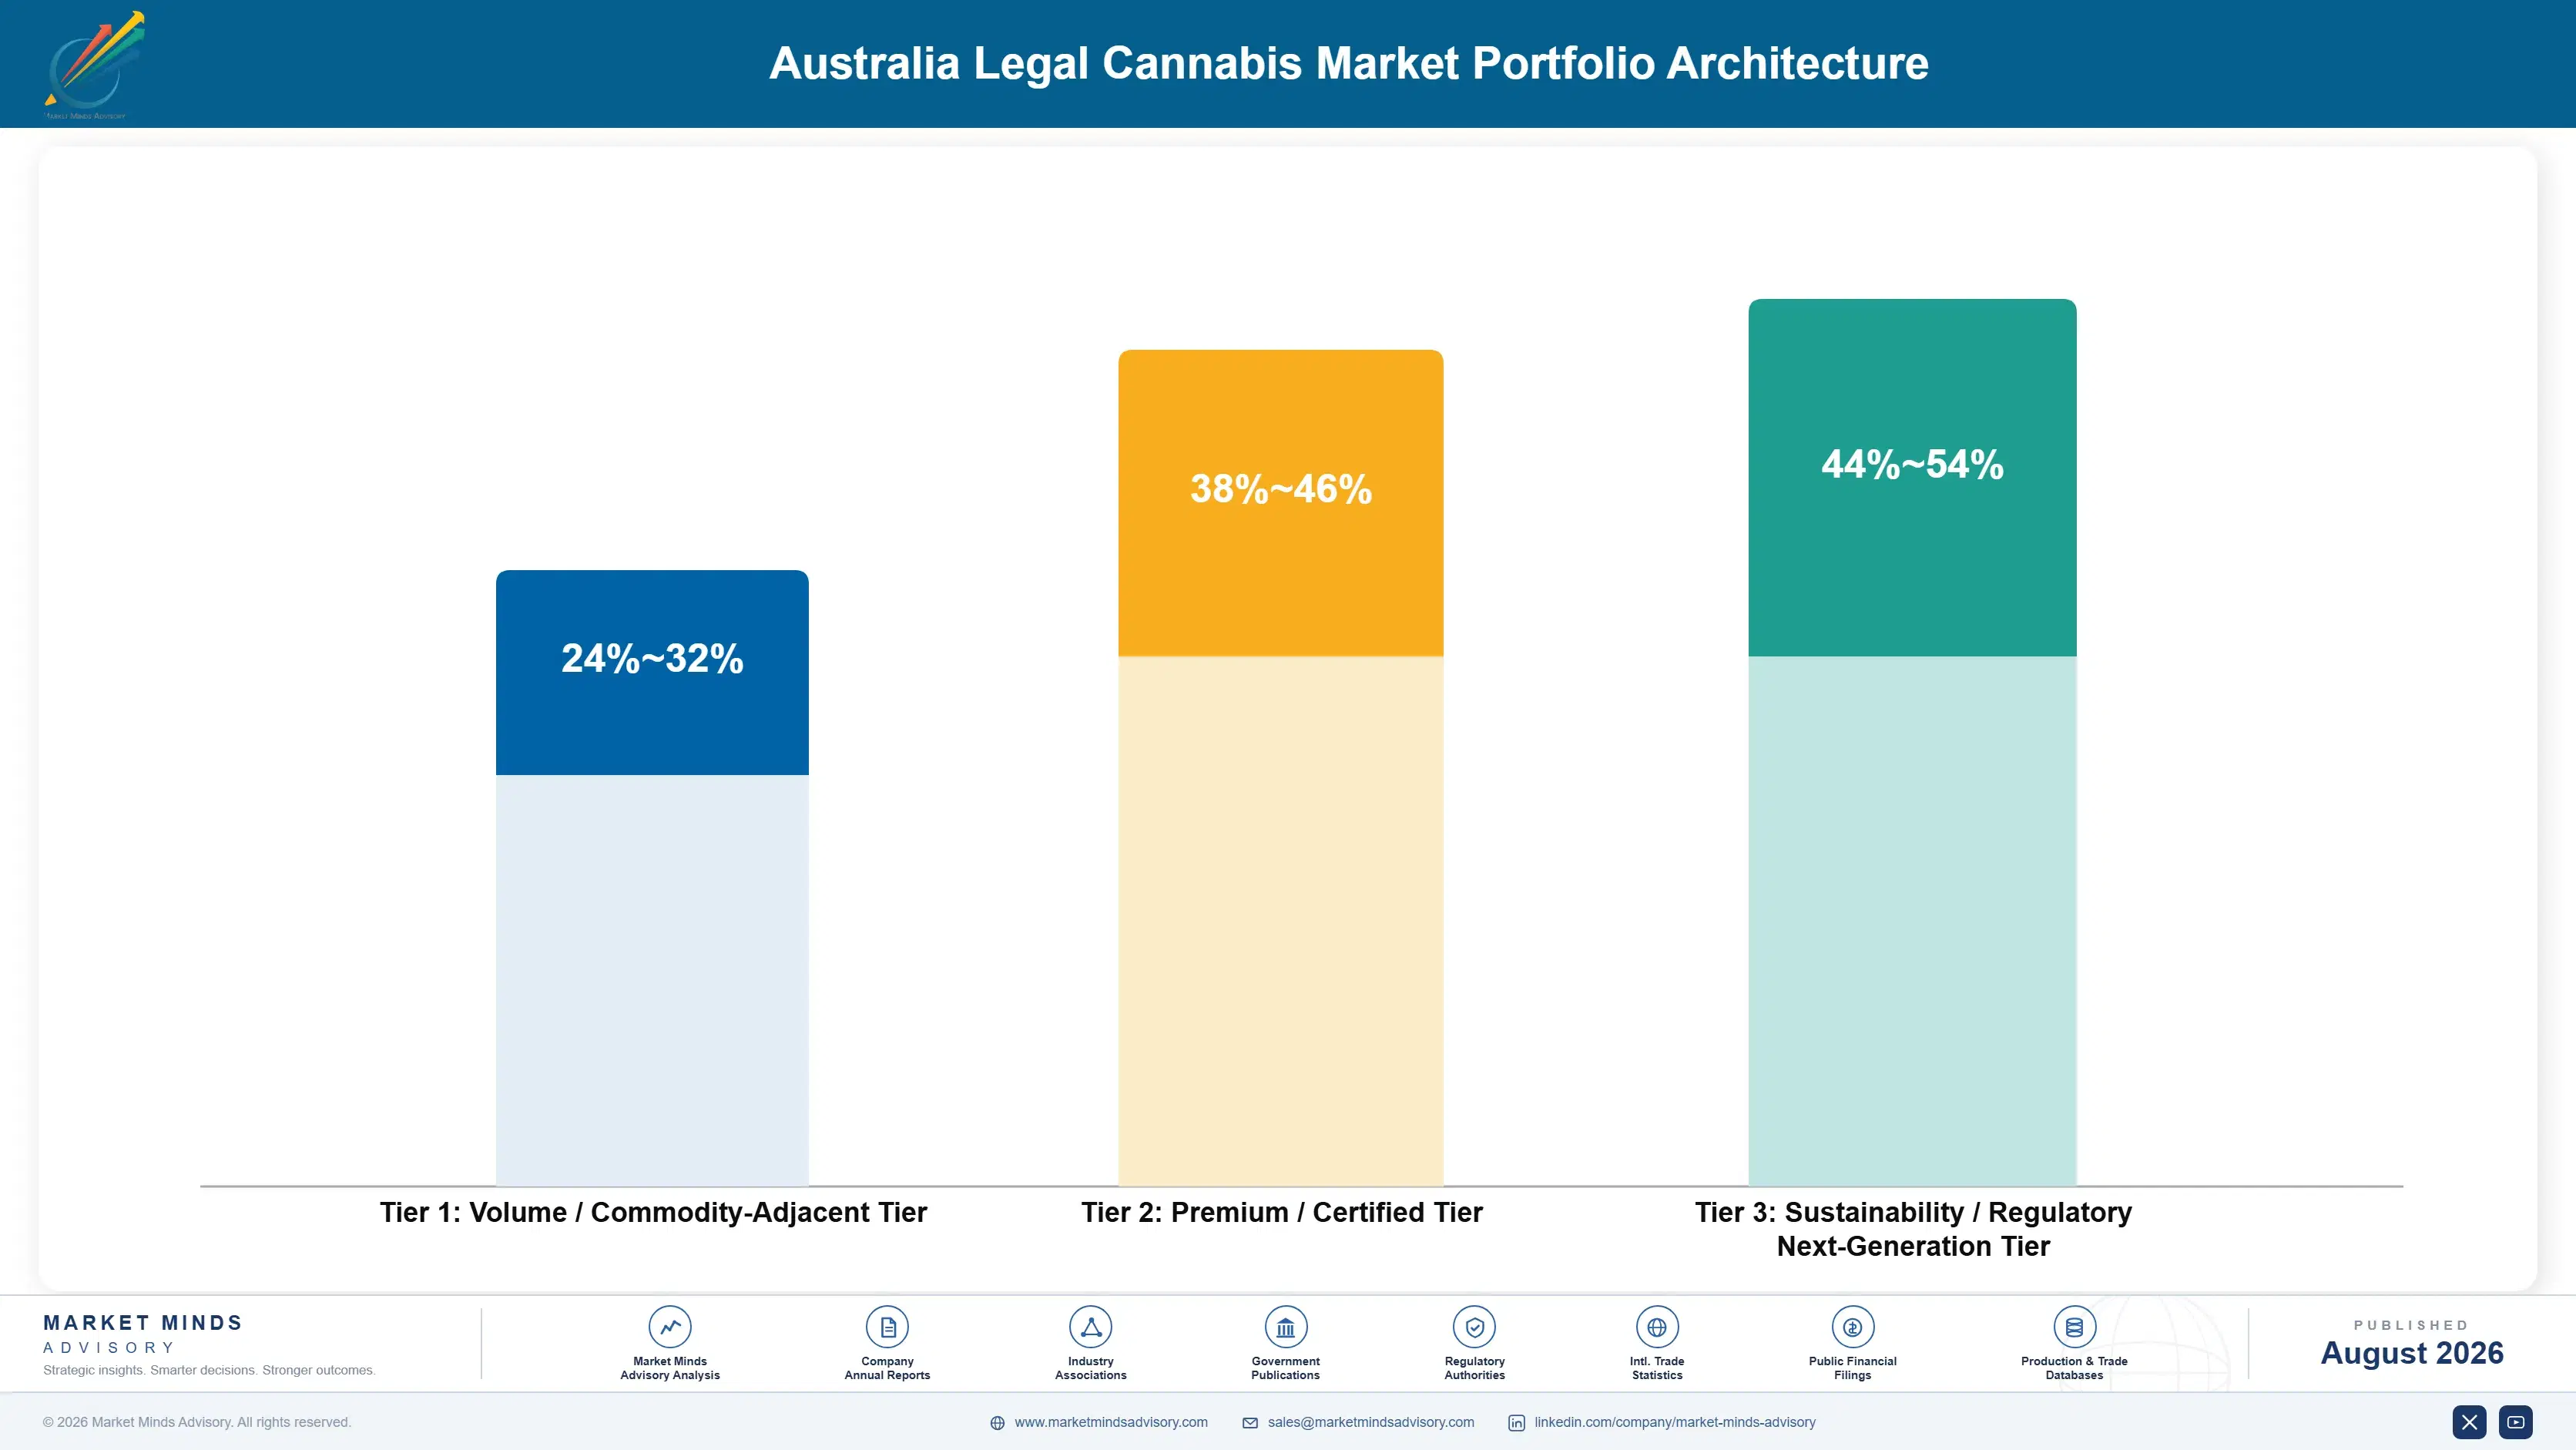
Portfolio economics split into three tiers with materially different gross margin profiles: commodity-adjacent dried flower and standard oils compete increasingly on price as domestic cultivation scales up nationwide, premium and certified formulations command a meaningful markup tied to Therapeutic Goods Administration approval and clinical data, and next-generation vape and fast-onset formats carry the highest margins in the category, reflecting genuine formulation differentiation and first-mover regulatory advantage.
The tension between volume and premium tiers is intensifying as domestic cultivation cost reductions push standard flower and oil pricing steadily lower nationwide, compressing what had been a comfortable margin gap and forcing established producers to defend premium positioning through faster formulation innovation and telehealth prescriber partnerships rather than relying on early-mover brand recognition alone to hold prescriber loyalty.

High-value margin pools concentrate overwhelmingly in vape and fast-onset formulations carrying early regulatory approval and proven prescriber trust, where competitors cannot simply match formulation on cost alone without years of approval process and clinical positioning behind them, giving early movers a durable pricing advantage that persists even as commodity-tier margins continue compressing under sustained cultivation cost reductions across the category.

Volume / Commodity-Adjacent Tier

Standard dried flower and basic oil formulations sold increasingly on price as domestic cultivation capacity scales nationwide, facing intensifying competition between vertically integrated producers and remaining import-dependent brands across the country.
Gross Margin: 24-32%

Premium / Certified Tier

Certified formulations carrying documented Therapeutic Goods Administration approval and clinical substantiation, sold into prescriber channels willing to pay a meaningful markup over standard commodity flower and oil products sold nationally.
Gross Margin: 38-46%

Sustainability / Regulatory / Next-Generation Tier

Vape, inhalant and fast-onset formats representing the newest and most technically defensible portion of the category, commanding correspondingly higher margins as prescriber comfort with these formulations continues expanding steadily nationwide.
Gross Margin: 44-54%
australia-legal-cannabis-market-trends-portfolio-architecture-1787461864428

High-value Sub-segments and Strategic Watch-out

Vapes and Inhalant Formats

Vapes and inhalant formats, growing fastest and commanding the highest margins in the category as prescribers favor faster symptom onset over traditional oil tinctures among younger, metropolitan patient populations across New South Wales, Victoria and Queensland especially, where telehealth adoption runs consistently highest nationwide today.
Gross Margin: 46-54%

Cannabis Oils and Extracts

Cannabis oils and extracts remaining the largest category by prescription volume, expanding steadily as domestic extraction capacity narrows the cost gap with imported oil products across most major brands competing nationally for market share, prescriber loyalty and long-term shelf presence in pharmacies across the country.
Gross Margin: 36-44%

Standard Dried Flower

Standard dried flower sold into mainstream prescription channels, providing steady but increasingly price-competitive volume that underwrites cultivator fixed costs even as growth and pricing power both remain limited relative to premium and next-generation tiers steadily gaining share nationally each successive quarter across most licensed pharmacies.
Gross Margin: 22-28%

Import-Dependent Brands

Import-dependent brands without domestic cultivation transition plans facing substitution risk from vertically integrated competitors; producers concentrated here risk meaningful share loss within the coming decade as domestic cultivation costs keep falling further still, undercutting import economics across every major product category and price tier nationwide.
Gross Margin: 18-24%

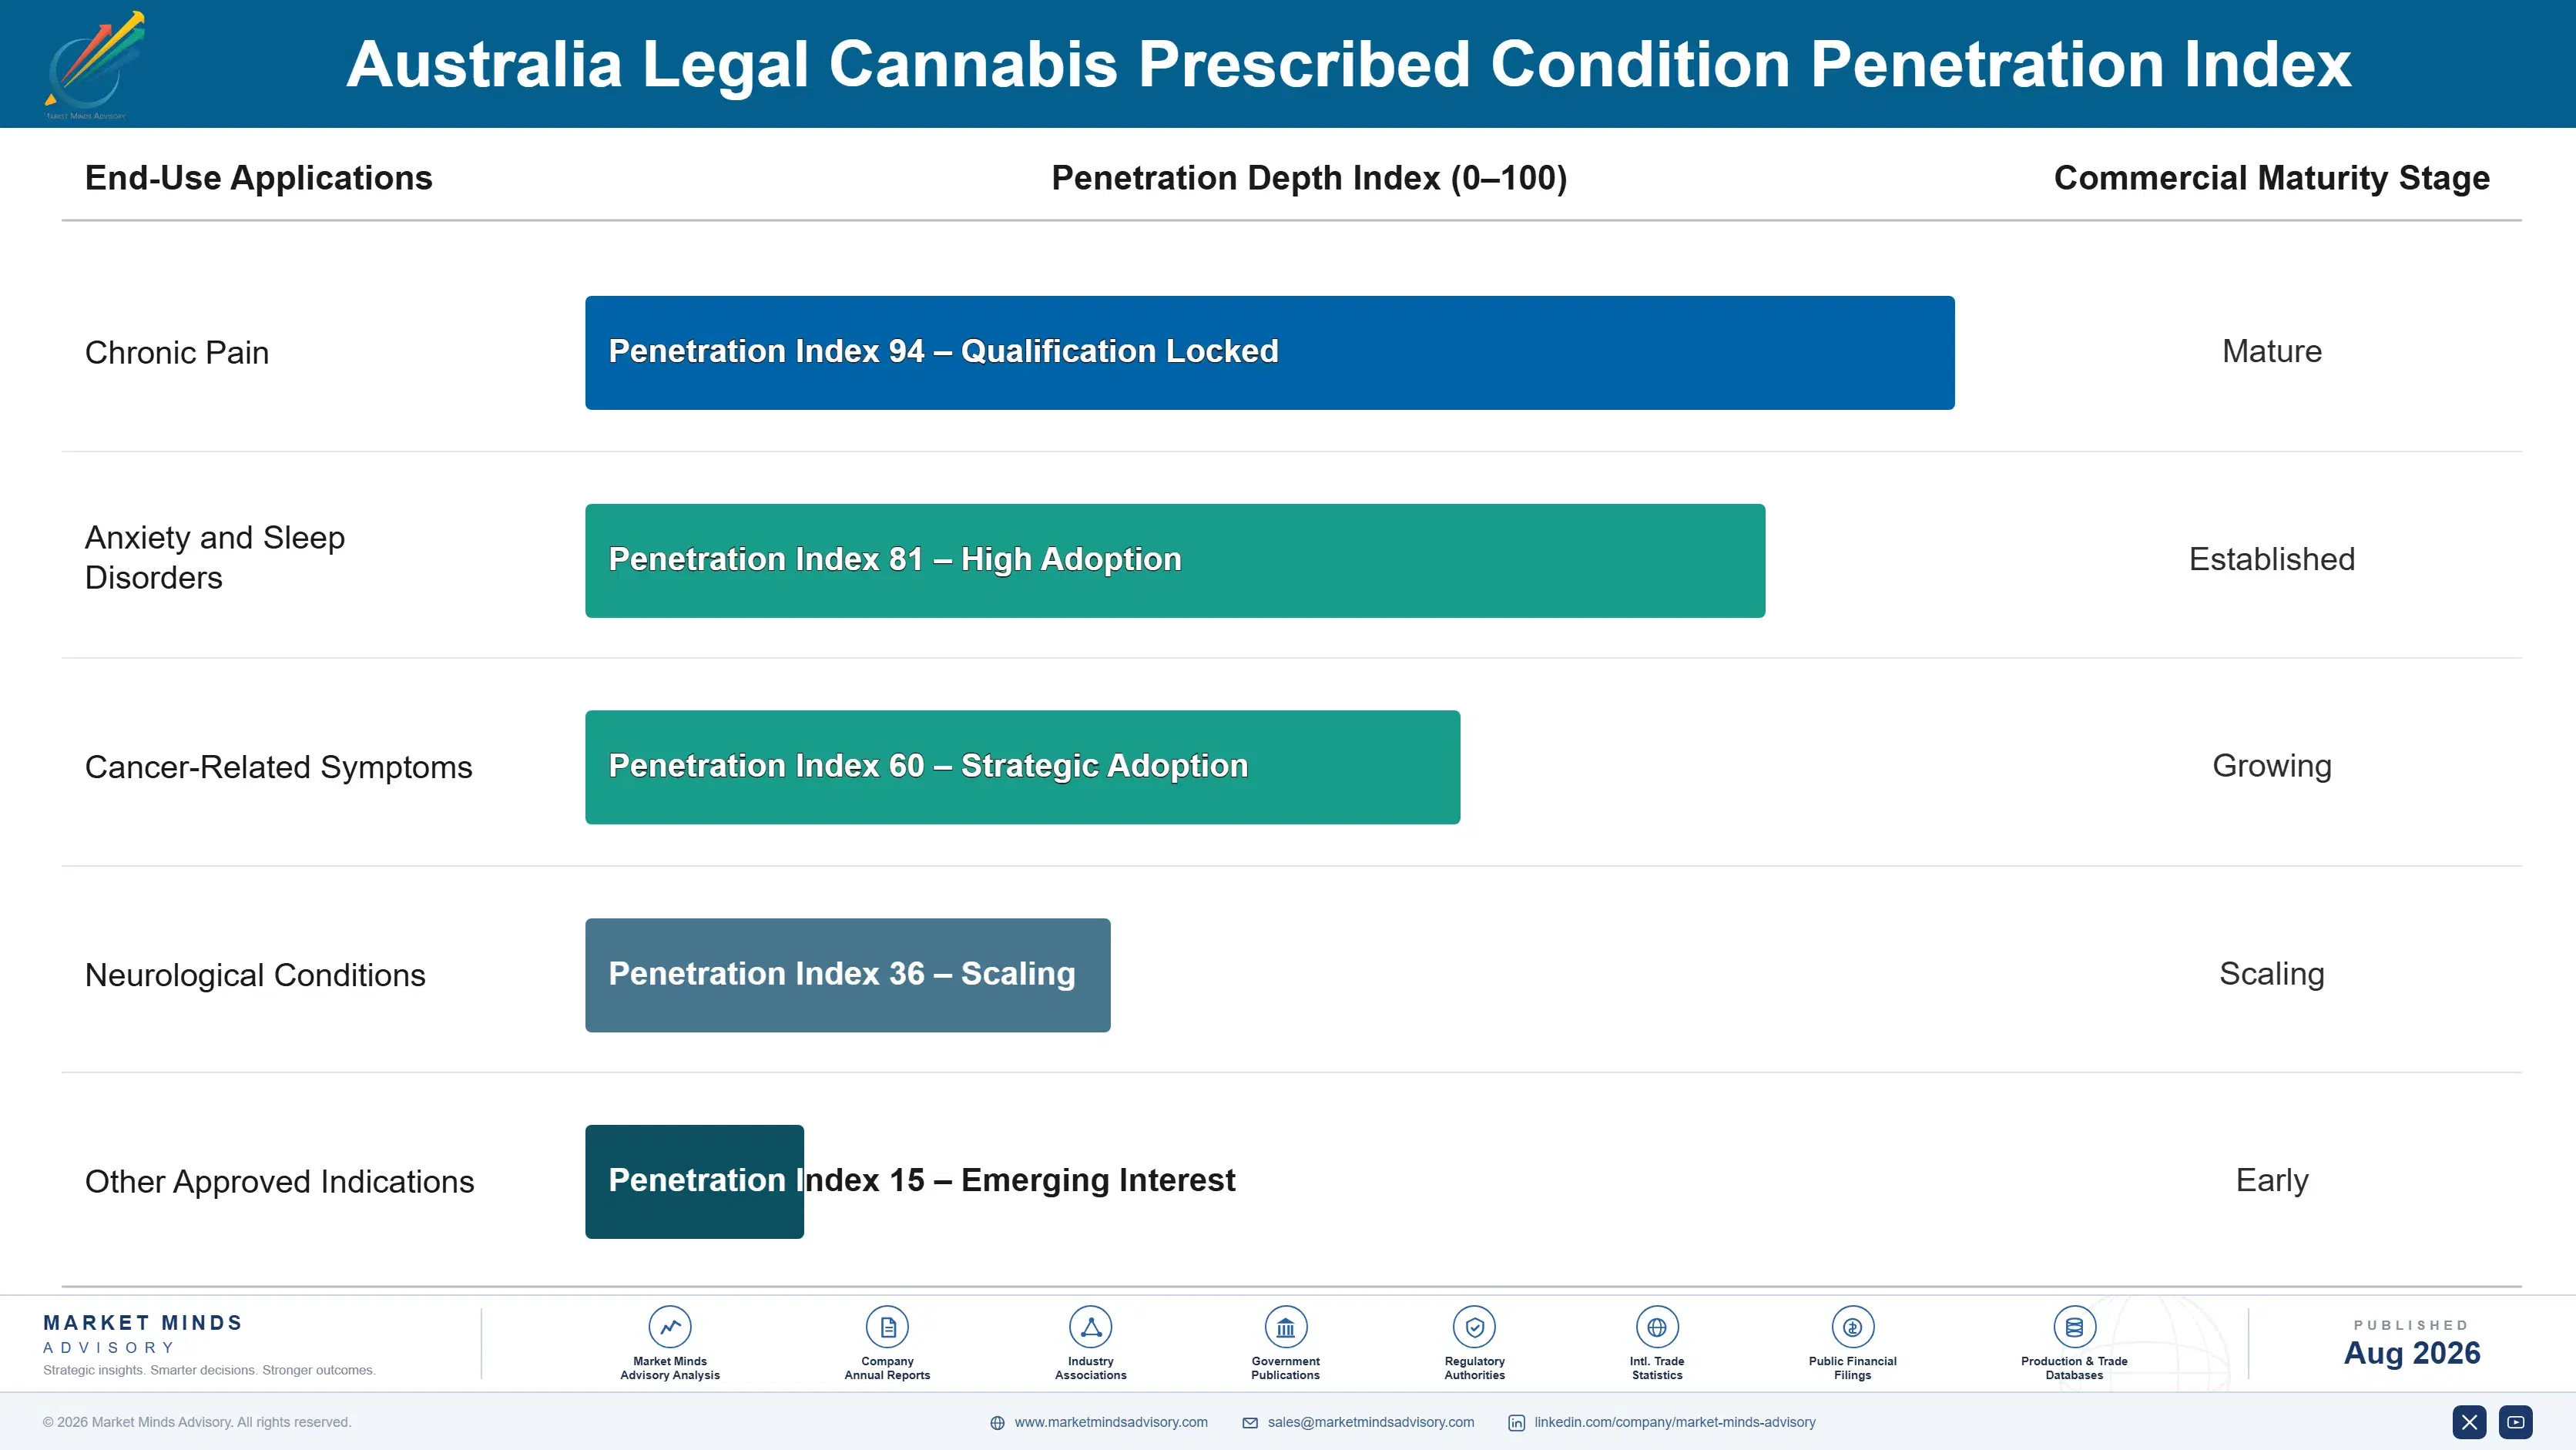
Prescription Renewal Cycles and Loyalty

Once a patient establishes a prescription relationship with a particular brand and formulation, switching cost runs moderate rather than high, since prescription renewal happens regularly and patients can request formulation changes at each renewal appointment with their prescriber without much friction, giving producers less annuity-like revenue predictability than categories with longer qualification cycles and higher switching friction built into the purchasing process itself.
Adoption depth varies sharply by patient segment: chronic pain patients on long-established oil prescriptions tend to stay with a trusted formulation for years absent a genuine efficacy problem worth raising with their prescriber, while newer patients accessing the category through telehealth platforms experiment more freely across formats and brands before eventually settling into a consistent prescription pattern that a producer can then rely on for repeat revenue.

A generational shift in patient profiles is underway as younger patients accessing cannabis through telehealth increasingly demand fast-onset vape and inhalant formats, replacing an older patient cohort who entered the category through traditional general practitioner referral and oil-based prescriptions built on established clinical trust developed over years of in-person consultation and ongoing monitoring by a single familiar practitioner.
australia-legal-cannabis-market-trends-end-use-penetration-index-1787461864996

Where Producers Should Focus Now

These are among the four positions where our research anticipates prominent divergence between winners and laggards over the coming forecast period. Each is grounded in the demand model, the regulatory perimeter, and the announced capacity pipeline.
01 / DOMESTIC CULTIVATION TRANSITION

Reduce Import Dependence Before Costs Diverge Further

Producers still importing finished product rather than building domestic cultivation capacity are ceding margin to vertically integrated competitors whose cost advantage keeps widening as domestic cultivation economics continue improving each year. The capital investment required for cultivation infrastructure is considerable, but the alternative, permanent dependence on landed import costs and currency exposure, is becoming a measurably worse position with each passing year of domestic cost improvement. Producers delaying this transition risk losing prescriber relationships to competitors offering comparable quality at meaningfully lower prices.
02 / VAPE FORMULATION APPROVAL

Prioritise Inhalant Approval Before the Window Closes

Manufacturers without vape or inhalant formulation approval are missing the fastest-growing segment of the category entirely, and the regulatory approval timeline of 12 months or longer means delayed applicants face a widening gap against early movers. Prescribers develop familiarity and comfort with specific brands over time, making early market entry a durable advantage rather than a temporary one. Producers should treat vape formulation approval as a near-term priority rather than a longer-term consideration given how quickly this segment is establishing its competitive hierarchy.
03 / TELEHEALTH PRESCRIBER PARTNERSHIPS

Build Direct Telehealth Channels Now

Producers relying solely on traditional pharmacy distribution are losing patient acquisition share to competitors with direct telehealth prescriber partnerships, since telehealth platforms now originate the majority of new patient prescriptions nationally across most product categories. Building these partnerships requires investment in prescriber education and platform relationships that smaller producers sometimes deprioritise in favor of cultivation investment alone. But patient acquisition economics through telehealth are simply better than passive pharmacy shelf placement, making this a genuine near-term priority rather than a secondary consideration.
04 / ENERGY COST HEDGING DISCIPLINE

Lock Long-Term Power Agreements Now

Cultivators without long-term power purchase agreements remain exposed to electricity price volatility that has already squeezed margins across the category since 2022, and the pattern is likely to persist as the eastern Australian grid continues experiencing broader volatility each year. Producers that lock in multi-year power agreements and invest in greenhouse conversion protect margin predictability that increasingly matters as domestic cultivation cost competition intensifies. Those same producers are positioning themselves to outlast competitors still exposed to spot-market electricity pricing swings.

Engagement Snapshot From the Field

A live engagement with an industry participant carrying material or product regulatory and market exposure ahead of a defining policy shift, showing how our research translates into a defensible multi-year portfolio strategy.
MARKET MINDS ADVISORY · CLIENT ENGAGEMENT SUMMARY
Australia Legal Cannabis Producer Strategic Portfolio Review and Transition Roadmap 2026·Investment Scenario on Australia Legal Cannabis Exposure Evaluation 2025-26
CLIENT PROFILE
The client is a mid-sized Australian medical cannabis cultivator generating approximately 45 million dollars in annual revenue (client-reported, unverified by MMA), operating a single greenhouse facility in New South Wales and relying on imported oil concentrate for roughly half its finished product formulations sold through pharmacy and telehealth channels across most Australian states and territories.
STRATEGIC CHALLENGE
The client faced margin compression as domestic competitors with full vertical integration undercut its pricing on oil-based products, while its own import dependence for concentrate left it exposed to currency volatility and landed cost premiums that vertically integrated competitors no longer carried on comparable products sold nationwide across most major pharmacy accounts.
MMA APPROACH
MMA conducted a cost structure analysis comparing the client's import-dependent extraction economics against domestic vertical integration scenarios, benchmarking capital requirements, payback timelines and margin impact against category-leading vertically integrated producers already operating at comparable scale nationally, then modeled the optimal sequencing for a phased extraction capacity build-out over two years.
KEY FINDINGS
  1. Building in-house extraction capacity would require approximately 8 million dollars in capital investment with a projected payback period of roughly three years.
  2. Import dependence was costing the client an estimated 18 percent margin disadvantage per unit relative to vertically integrated competitors selling comparable products.
  3. Telehealth prescriber partnerships currently generated under 20 percent of the client's new patient volume, well below the category average of 60 percent.
  4. Vape formulation approval, not yet pursued by the client, represented the single fastest path to differentiated margin given minimal current competition in that specific format.
CLIENT PROFILE
The client is a mid-sized Australian medical cannabis cultivator generating approximately 45 million dollars in annual revenue (client-reported, unverified by MMA), operating a single greenhouse facility in New South Wales and relying on imported oil concentrate for roughly half its finished product formulations sold through pharmacy and telehealth channels across most Australian states and territories.
STRATEGIC CHALLENGE
The client faced margin compression as domestic competitors with full vertical integration undercut its pricing on oil-based products, while its own import dependence for concentrate left it exposed to currency volatility and landed cost premiums that vertically integrated competitors no longer carried on comparable products sold nationwide across most major pharmacy accounts.
MMA APPROACH
MMA conducted a cost structure analysis comparing the client's import-dependent extraction economics against domestic vertical integration scenarios, benchmarking capital requirements, payback timelines and margin impact against category-leading vertically integrated producers already operating at comparable scale nationally, then modeled the optimal sequencing for a phased extraction capacity build-out over two years.
KEY FINDINGS
  1. Building in-house extraction capacity would require approximately 8 million dollars in capital investment with a projected payback period of roughly three years.
  2. Import dependence was costing the client an estimated 18 percent margin disadvantage per unit relative to vertically integrated competitors selling comparable products.
  3. Telehealth prescriber partnerships currently generated under 20 percent of the client's new patient volume, well below the category average of 60 percent.
  4. Vape formulation approval, not yet pursued by the client, represented the single fastest path to differentiated margin given minimal current competition in that specific format.
RECOMMENDED STRATEGY
Phase 1: Phase 1 (Months 1 to 6): Secure project financing and begin construction of in-house extraction capacity at the existing facility. Phase 2: Phase 2 (Months 7 to 18): Commission the new extraction capacity and pursue Therapeutic Goods Administration approval for a vape formulation. Phase 3: Phase 3 (Months 19 to 24): Build direct telehealth prescriber partnerships to expand patient acquisition beyond traditional pharmacy channels alone.
OUTCOME
The client commissioned in-house extraction capacity within twenty months and secured vape formulation approval shortly after (client-reported, unverified by MMA). Margin per unit improved as import dependence fell, and telehealth-originated patient volume grew considerably as new prescriber partnerships took effect across the client's core markets.

Frequently Asked Questions

Foundational context covering the market sizes, CAGR, scope, country, region and competition that inform every finding below. This section is provided to cover basics and most often pre-purchase conversations, answered from the MMA Primary Research Dataset.

What is the current size of the Australia Legal Cannabis Market?

Australia's legal cannabis market reached an estimated 2.4 billion dollars in 2025. Growth is driven by domestic cultivation scale-up and expanding telehealth prescriber access across the country.

How large will the Australia Legal Cannabis Market be by 2036?

MMA projects the market will reach approximately 10.6 billion dollars by 2036, growing roughly 3.9 times from its 2026 base. Vape and inhalant formats are expected to drive most incremental growth.

What is the CAGR for the Australia Legal Cannabis Market 2026 to 2036?

The market is forecast to grow at a 14.5 percent compound annual rate between 2026 and 2036. Bull-case scenarios reach 15.9 percent if federal recreational legalization discussion gains political momentum.

Which segment is growing fastest?

Vapes and inhalants lead at an 18.4 percent CAGR, roughly 1.3 times the overall market rate. Faster symptom onset and expanding regulatory approval are the primary drivers behind that lead.

Who are the major companies in the Australia Legal Cannabis Market?

Leading producers include Cann Group, Althea Group Holdings, Little Green Pharma, Bod Australia and Vitura Health. Together they hold roughly 52 percent of national prescription volume.

Which country is growing fastest?

Australia itself is the defined market and grows at the headline 14.5 percent CAGR. Domestic cultivation scale-up and telehealth prescriber expansion are the primary drivers of that growth nationally.

Report Segmentation Architecture

The full report scope spans multiple orthogonal segmentation dimensions, with cross-tabulated demand data provided for each dimension pair. Coverage extends further to regional breakdowns, trend trajectories, and the competitive detail needed to support segment-level decision-making.

By Product Delivery Format

  • Dried Flower
  • Cannabis Oils and Extracts
  • Vapes and Inhalants
  • Edibles and Beverages
  • Topicals
  • Capsules and Tablets

By Prescribed Condition

  • Chronic Pain
  • Anxiety and Sleep Disorders
  • Cancer-Related Symptoms
  • Neurological Conditions
  • Other Approved Indications

By Commercial Dimension

  • Licensed Pharmacy Distribution
  • Telehealth Prescriber Channel
  • Domestic Cultivation
  • Import-Dependent Supply

By Region

  • North America
  • Western Europe
  • East Asia
  • South Asia and Pacific
  • Latin America
  • Middle East and Africa
  • Eastern Europe

Scope, Methodology, and Coverage

Every figure in this report is reproducible from documented input assumptions. The scope below maps the historical period, the forecast horizon, the segmentation dimensions, and the countries covered, alongside the underlying primary and qualitative methodology.
Historical Period
2020 to 2025
Forecast Period
2026 to 2036
Base Year
2025 (USD billions; MMA Primary Research Dataset, August 2026)
Market Definition
The market covers legally prescribed and regulated medical cannabis products including dried flower, oils, vapes, edibles, topicals and capsules sold through licensed pharmacies and prescriber channels in Australia. It excludes illicit cannabis, industrial hemp fiber products, and recreational cannabis, which remains federally unlicensed.
Quantitative Units
USD billions (current prices); kilograms for cultivation volume-referenced segments
Segmentation Dimensions
By Product Delivery Format; By Prescribed Condition; By Commercial Dimension; By Region
Regions Covered
North America, Western Europe, East Asia, South Asia and Pacific, Latin America, Middle East and Africa, Eastern Europe
Countries Covered
USA, China, Germany, France, UK, Japan, South Korea, India, Australia, Canada, Brazil, Mexico, Indonesia, Vietnam, Thailand, Malaysia, UAE, Saudi Arabia, South Africa, Nigeria, Turkey, Poland, Netherlands, Italy, Spain, Sweden, Switzerland, Argentina, Colombia, Singapore, and additional markets relevant to this sector
Key Companies Profiled
Cann Group, Althea Group Holdings, Little Green Pharma, Bod Australia, Vitura Health, Elixinol Global, Creso Pharma, Zelira Therapeutics, Emyria, MGC Pharmaceuticals, Medlab Clinical, THC Global Group, Ecofibre, Cannatrek, Leafcann Group, Cannvalate, Montu Group, Australian Natural Therapeutics Group, Southern Cannabis Company, Aurora Cannabis Australia
Quantitative Methodology
Primary survey, n=3,800 respondents, Q4 2025, six countries; demand-side model with trade association cross-validation
Qualitative Methodology
47 expert interviews, Q4 2025; applied to validate demand model assumptions, identify emerging dynamics, and assess competitive positioning
Report Format
PDF and XLSX data workbook (Word format preview document)
Publisher
Market Minds Advisory
Report Code
MMA-2026-AGR-104
Published
August 2026
Contact
sales@marketmindsadvisory.com | www.marketmindsadvisory.com

Purchase the full Australia Legal Cannabis Market Report (2026 to 2036).

The full report delivers detailed segment-level sizing across all six cannabis product delivery formats, country-level forecasts for thirty markets, and a competitive benchmarking module covering all twenty profiled producers on a single consistent revenue basis. It includes primary survey data from 3,800 respondents across six countries alongside 47 qualitative expert interviews conducted in the fourth quarter of 2025. Analysts provide a standalone Therapeutic Goods Administration approval and prescriber access tracker covering Australia specifically. Clients also receive quarterly update briefings through the twelve months following publication.
Segment-level sizing across six product delivery formats
Country-level forecasts spanning thirty individual markets
Competitive benchmarking across twenty profiled cannabis producers
Standalone regulatory approval and prescriber access tracker
Quarterly post-publication analyst update briefings included
Primary survey and expert interview datasets

Built For The People Who Decide

From boardroom strategy to bench-side execution, this report is read cover-to-cover by leaders shaping the next decade of their industry, turning demand scenarios, market dynamics and valuation benchmarks into decisions.
CXOs/ Presidents/ VPs/ Managers
M&A and Corporate Development
Strategy Teams and R&D Heads
Procurement and Product Directors
Regulatory and Compliance Leaders
Investor Relations and Equity Analysts