Market Minds Advisory
Australia Collagen Peptide Market

Australia Collagen Peptide Market: Australia Collagen Peptide Market. Beauty-From-Within Demand, TGA Claim Rules, and Imported Ingredient Supply Shape Value.

Australian collagen peptide demand grows with beauty-from-within, joint health, and sports interest, while TGA claim rules, marine and bovine ingredient sourcing, private label pressure, and evidence quality decide which brands hold shopper trust.

Lead Analyst

Published

September 2026

Make Smarter Decisions with Customized Research Insights

Request a free sample report and evaluate market opportunities, growth trends, and competitive dynamics relevant to your business needs.

2025 MARKET VALUE$0.1BMarket Size 2025
2036 FORECAST VALUE$0.3BBase Case , 2026 to 2036
CAGR 2026 TO 20369.2 %Bull 10.6% / Bear 7.8%
INCREMENTAL OPPORTUNITY$0.2BNet 10- year value creation
EXPANSION MULTIPLE2.41x2036 value over 2026 base
Strategic Levers
M&A Pipeline
Regional Outlook
Country Rankings
Competitive Intelligence
Segmental Deep-dive
Call-Us : 91 93563 13602

Executive Snapshot and Market Trajectory.

Collagen peptides are protein fragments from hides, bones, and fish skins, sold as powders, drinks, and gummies for skin, joints, and recovery. Australians buy more supplements per person than most, and collagen has moved from niche to mainstream shelves. The debate is about evidence, sourcing, and price.
Marine collagen peptides grow fastest, since shoppers seek pescatarian and beauty-focused options that feel lighter than bovine powders. This file counts Australian demand, so South Asia and Pacific holds nearly all value, while other regions count only ingredient supply and technology linked to Australian customers. Beauty sets demand. Claims set limits. Imports set cost. Brands reward consistency over novelty. Supply contracts decide renewal. Delivery reliability decides supplier rankings.
Competition is fairly concentrated, with a Swiss consumer nutrition group, two Australian complementary medicine brands, a family-owned organic wellness brand, and an Australian vitamin brand leading alongside ingredient suppliers and private label on brand trust, claim compliance, and price. Regulation covers therapeutic goods and food standards. Brands own shoppers. Ingredient makers own peptides. Margins follow sourcing discipline. Buyers review suppliers every season. Batch records protect future sales. Cost control separates leaders from followers.
Market Definition
The market covers Australian consumer demand for collagen peptide products, valued at manufacturer level for finished goods sold through pharmacies, supermarkets, health stores, and online channels, including bovine collagen peptide powders, marine collagen peptides, type II and joint-focused collagen, ready-to-drink and functional food collagen products, and collagen gummies and chewables. The scope excludes gelatin for cooking, collagen for cosmetics applied to skin, pharmaceutical collagen implants, pet products, and exports.
Base Year Value
$0.1B in 2025 (MMA Primary Research Dataset, September 2026)
Forecast Period
2026 to 2036, eleven discrete annual values
CAGR
9.2% base case. Bull 10.6%. Bear 7.8%.
Fastest Growth Segment
Marine Collagen Peptides: 11.6% CAGR
Fastest Growth Country
Australia: 9.2% CAGR
Fastest Growth Region
South Asia and Pacific: 11.0% CAGR
Largest Region
South Asia and Pacific: 88% of 2025 global value
Market Leaders
Nestlé Health Science, Blackmores, Swisse Wellness, Nutra Organics, Bioglan. Source: MMA Analysis, company annual reports.
Primary Survey
n=3,800 procurement and R&D decision-makers, Q4 2025, six countries
Methodology
Demand-side build-up, cross-validated against public data, 47 expert interviews

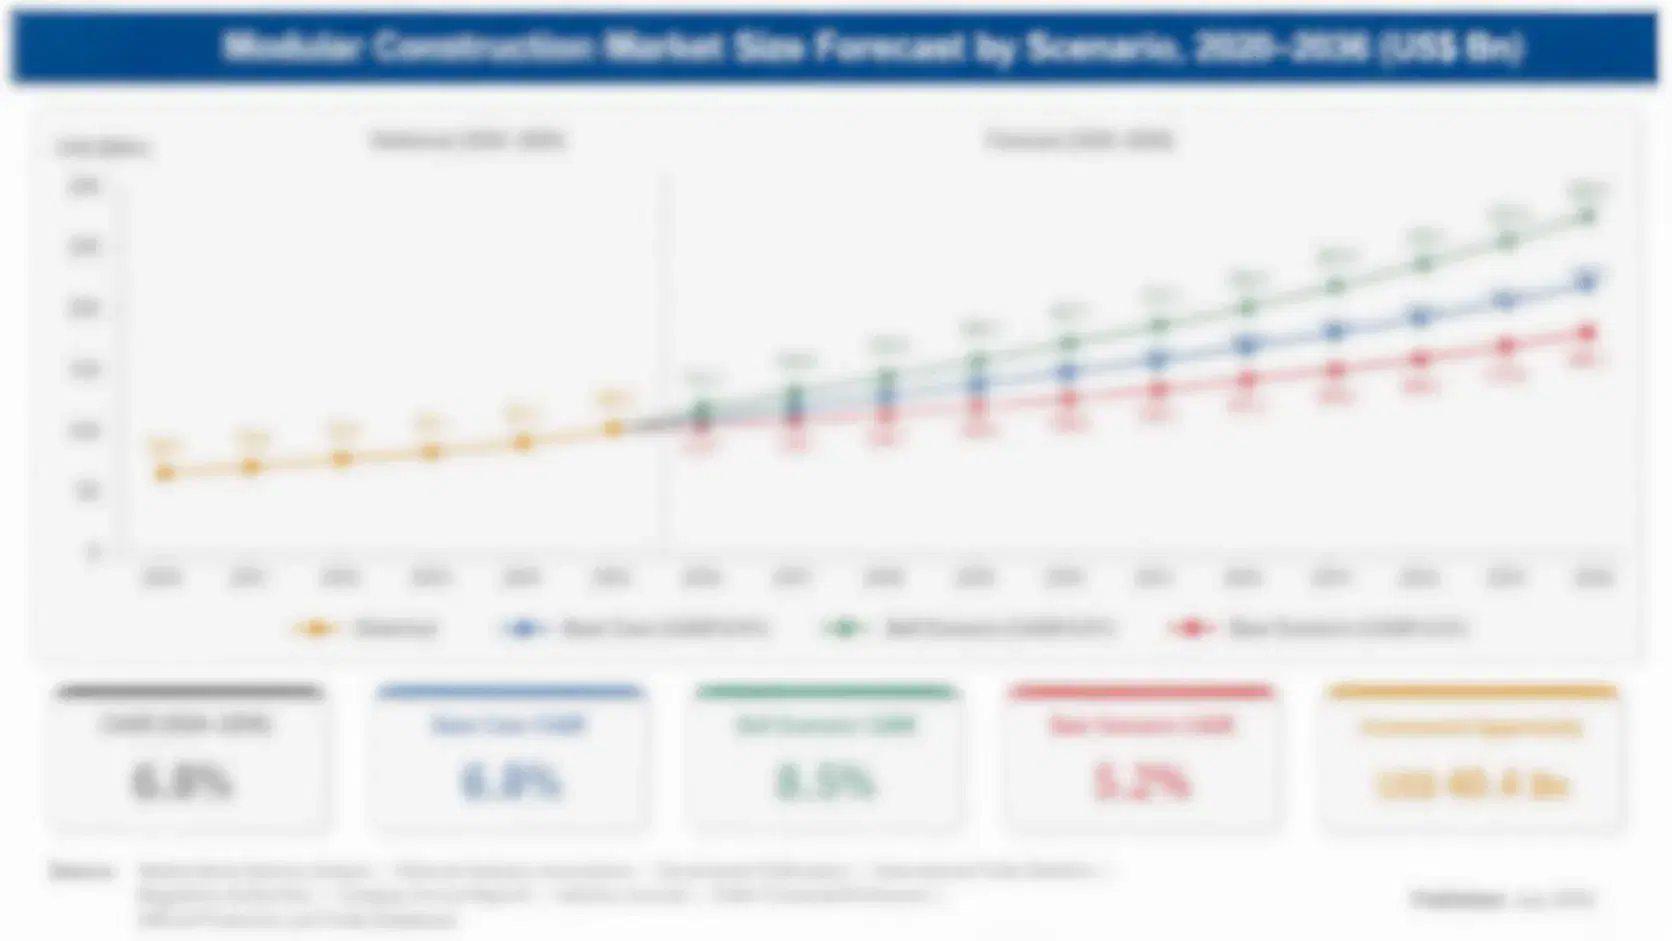
Australia Collagen Peptide Market Forecast Scenarios

australia-collagen-peptide-market-size-forecast-scenario-1789839635652
From 2020 to 2025, Australian collagen peptide demand grew faster than the wider supplement market as social media promoted beauty-from-within, pharmacy and supermarket ranges widened, and ready-to-drink and gummy formats brought new users. Ingredient and freight costs rose sharply from 2021, and TGA scrutiny of claims increased, though brands passed on part of the increase. Growth ran slightly below the
The base case rests on three commercial mechanisms. First, women aged 30 to 55 keep adding beauty-from-within products, and collagen moves into daily routines. Second, ageing consumers and active adults buy collagen for joints and recovery through pharmacies and sports channels. Third, ready-to-drink, gummy, and functional food formats widen use beyond powders. Brands plan ingredient contracts, claim files, and channel partnerships around all three, and customer programmes follow. Clear specifications build buyer trust.
The bull case needs stronger clinical evidence and stable ingredient costs, which would lift volumes and margins. The bear case is a claim enforcement wave combined with a private label price war, which would squeeze branded margins. Clear specifications build buyer trust. Small brands feel every input swing. Technical reach compounds over time. Brands reward consistency over novelty.

Beauty Demand, TGA Claim Rules, and Ingredient Sourcing Decide Australian Collagen Winners

The Australian collagen market spans a supply chain from raw material to shopper. Global suppliers hydrolyse bovine hides, marine skins and scales into peptides, importers and contract manufacturers blend them into powders, drinks, and gummies, and brands sell through pharmacies, supermarkets, health stores, and online channels. Some raw material comes from Australian beef by-products. Supply contracts decide renewal. Delivery reliability decides supplier rankings.
MARKET CONCENTRATION44% CR5Leading five brands hold a moderate combined share
IMPORTED INGREDIENT SHARE85%Portion of collagen peptide ingredient volume imported into Australia
PHARMACY CHANNEL SHARE38%Portion of collagen product sales made through pharmacies
TYPICAL DAILY DOSE5-15 gUsual collagen peptide amount per serving for adults
PRIVATE LABEL SHARE16%Portion of collagen product sales sold under retailer brands
PRODUCT LISTING CYCLE6 monthsTypical time to list a new therapeutic goods product
Brand trust, claim compliance, and sourcing decide value. Shoppers judge collagen on brand reputation, ingredient source, taste, price per serving, and evidence for skin or joint claims, so a brand needs quality suppliers, TGA-compliant claims, and strong channel relationships. Large groups win on distribution and marketing, while niche brands win on sourcing stories. Brands with consistent quality and clean claim records win because regulators and shoppers watch closely.
Shoppers judge collagen on effect, taste, source, and price. Beauty buyers want visible skin benefits, joint buyers want mobility, and sports buyers want recovery support. Price sensitivity is high because private label sells similar peptides at 25% to 40% below brands, though marine and functional formats can cost 20% to 80% more than bovine powders, which pushes brands toward stories, formats, and subscriptions.
"Collagen sells on a promise of skin and joints, and Australia polices promises harder than most markets. The brands that will keep shelf space are the ones that pair credible sourcing with claims they can defend to a regulator, not the ones with the loudest influencer."
Senior Analyst, Healthcare and Nutrition Practice · MMA Collagen Peptides Practice · September 2026

Market Trends

Marine Collagen Attracts Beauty and Pescatarian Shoppers in Premium Ranges

Australian shoppers seeking lighter, pescatarian, or beauty-focused collagen choose marine peptides from fish skin and scales, sold in premium sachets, powders, and drinks. Marine collagen peptides grow about 11.6% a year and sell at premiums of 30% to 90% over bovine powders. The trend needs credible sourcing and fish allergen labelling, and it rewards brands with traceable marine supply and clear beauty claims. Margins follow sourcing discipline. Buyers review suppliers every season. Batch records protect future sales. Cost control separates leaders from followers. Clear specifications build buyer trust. Small brands feel every input swing.
Market Impact: 17% of Australians are 65 plus

Ready-to-Drink and Functional Food Collagen Formats Widen Everyday Use

Brands launch ready-to-drink shots, collagen coffee, bars, and gummies that suit commuters, gym-goers, and shoppers who dislike powders. Ready-to-drink and functional food collagen products grow about 10.2% a year. The trend needs taste masking and stability, and it rewards brands with contract manufacturers, supermarket relationships, and formats that keep collagen dose above 5 grams per serving. Technical reach compounds over time. Brands reward consistency over novelty. Supply contracts decide renewal. Delivery reliability decides supplier rankings. Margins follow sourcing discipline. Buyers review suppliers every season. Batch records protect future sales. Cost control separates leaders from followers.
Market Impact: pharmacies hold 38% of sales

Market Opportunities and Growth Drivers

Beauty-From-Within and Ageing Trends Sustain Strong Australian Supplement Spending

Australians spend heavily on complementary medicines, and beauty-from-within and healthy ageing sit among the fastest-growing themes. Women aged 30 to 55 are the core collagen buyer group, and Australia's population aged 65 and over exceeds 17%. The driver sustains steady demand for collagen powders and joint products and rewards brands with credible claims, strong pharmacy links, and clear benefit messages. Clear specifications build buyer trust. Small brands feel every input swing. Technical reach compounds over time. Brands reward consistency over novelty. Supply contracts decide renewal. Delivery reliability decides supplier rankings. Margins follow sourcing discipline.
Market Impact: clinical studies cost $0.5-3 million

Pharmacy and Supermarket Distribution Expands Collagen Reach Beyond Health Stores

Large pharmacy chains, supermarkets, and online marketplaces added collagen ranges and private label, widening reach to mainstream shoppers and exporters buying for Asian customers. Pharmacies hold about 38% of collagen sales. The driver sustains volume and rewards brands with distribution agreements, promotion support, and formats designed for shelf and online sales. Buyers review suppliers every season. Batch records protect future sales. Cost control separates leaders from followers. Clear specifications build buyer trust. Small brands feel every input swing. Technical reach compounds over time. Brands reward consistency over novelty. Supply contracts decide renewal.
Market Impact: private label sells 25-40% cheaper

Market Restraints and Challenges

TGA Claim Rules and Weak Evidence Limit Marketing, Invite Enforcement

Collagen products are regulated as listed complementary medicines or foods, and the TGA and advertising code limit claims about skin and joints without evidence, while clinical results are mixed. The root cause is strict therapeutic goods law and modest evidence. Brands respond with clinical studies and careful wording, though studies cost $0.5 million to $3 million and enforcement can force label and advertising changes. Delivery reliability decides supplier rankings. Margins follow sourcing discipline. Buyers review suppliers every season. Batch records protect future sales. Cost control separates leaders from followers. Clear specifications build buyer trust.
Market Impact: marine collagen grows about 11.6% yearly

Imported Ingredient Costs and Private Label Competition Squeeze Brand Margins

About 85% of collagen peptide ingredient volume is imported, freight and currency swings of 10% to 25% hit cost, and private label sells at prices 25% to 40% below brands. The root cause is low local supply and low differentiation. Brands respond with premium formats and stronger sourcing stories, though price wars still compress branded margins. Small brands feel every input swing. Technical reach compounds over time. Brands reward consistency over novelty. Supply contracts decide renewal. Delivery reliability decides supplier rankings. Margins follow sourcing discipline. Buyers review suppliers every season. Batch records protect future sales.
Market Impact: ready-to-drink collagen grows about 10.2% yearly
3 additional market trends, 2 additional growth drivers, and 4 additional restraints and challenges are covered in the full report. Contact sales@marketmindsadvisory.com to access the complete intelligence.

Segment CAGR and Growth Architecture

The Australia collagen peptide market is segmented by collagen source and product form, which shows where premium sourcing and convenient formats create pricing power. Five segments cover bovine powders, marine collagen peptides, type II and joint-focused collagen, ready-to-drink and functional food products, and gummies and chewables. Two segments grow fastest on beauty positioning and convenience formats.
australia-collagen-peptide-market-market-share-analysis-1789839635824

Marine Collagen Peptides

Marine Collagen Peptides is the fastest-growing segment at 11.6% a year, about 1.26 times the overall market rate. Shoppers seeking beauty-focused and pescatarian choices buy fish-based peptides in premium formats, and premiums of 30% to 90% over bovine powders support gross margins of 60% to 72%. Traceable sourcing and fish allergen labelling are the main constraints. Brands with credible marine supply win. Cost control separates leaders from followers. Clear specifications build buyer trust. Small brands feel every input swing. Technical reach compounds over time. Brands reward consistency over novelty. Supply contracts decide renewal. Delivery reliability decides supplier rankings. Margins follow sourcing discipline. Buyers review suppliers every season. Batch records protect future sales.
CAGR 11.6%

Ready-to-Drink and Functional Food Collagen Products

Ready-to-Drink and Functional Food Collagen Products grows at 10.2% a year, because commuters, gym-goers, and shoppers who dislike powders want convenient collagen shots, coffees, bars, and gummies, and buyers accept premiums of 40% to 100% per serving over powders. Taste masking and shelf stability are the main constraints, since peptides can taste bitter and lose clarity. Brands with contract manufacturers and supermarket links hold price better than followers. Cost control separates leaders from followers. Clear specifications build buyer trust. Small brands feel every input swing. Technical reach compounds over time. Brands reward consistency over novelty. Supply contracts decide renewal. Delivery reliability decides supplier rankings. Margins follow sourcing discipline. Buyers review suppliers every season.
CAGR 10.2%
Full segment breakdown across 5 segments available in the complete report.

Regional Architecture and Country Demand Map

South Asia and Pacific holds nearly all value because this file counts Australian demand, and its share sits far above the usual band. The other six regions count only ingredient supply, licensed brands, and technology linked to Australian customers, and all sit below their usual bands.

South Asia and Pacific

South Asia and Pacific holds 88% share, far above its usual band, because this file covers Australian demand and the value counted here is finished collagen products sold to Australian shoppers through pharmacies, supermarkets, health stores, and online channels, with Nestlé Health Science, Blackmores, Swisse Wellness, Nutra Organics, and Bioglan leading. Growth exceeds the global rate as beauty-from-within spreads. Claim rules, imported cost, and private label restrain margins. Batch records protect future sales. Cost control separates leaders from followers. Clear specifications build buyer trust. Small brands feel every input swing. Technical reach compounds over time. Brands reward consistency over novelty. Supply contracts decide renewal. Delivery reliability decides supplier rankings. Margins follow sourcing discipline.
Share: 88% | CAGR: 11.0% (2026 to 2036)

Western Europe

Western Europe holds 3% share, below its usual band, because this file covers Australian demand, and the value counted here is bovine collagen peptide supply and technology sold to Australian brands by Gelita, Rousselot, PB Leiner, Weishardt, and Ewald-Gelatine. Growth trails the global rate. Freight cost, currency exposure, and export licensing restrain margins, and volumes tied to Australia remain modest. Buyers review suppliers every season. Batch records protect future sales. Cost control separates leaders from followers. Clear specifications build buyer trust. Small brands feel every input swing. Technical reach compounds over time. Brands reward consistency over novelty. Supply contracts decide renewal. Delivery reliability decides supplier rankings. Margins follow sourcing discipline. Buyers review suppliers every season.
Share: 3% | CAGR: 7.7% (2026 to 2036)
Regional intelligence for 5 additional markets available in the complete report: North America, East Asia, Latin America, Middle East and Africa, Eastern Europe. Contact sales@marketmindsadvisory.com.
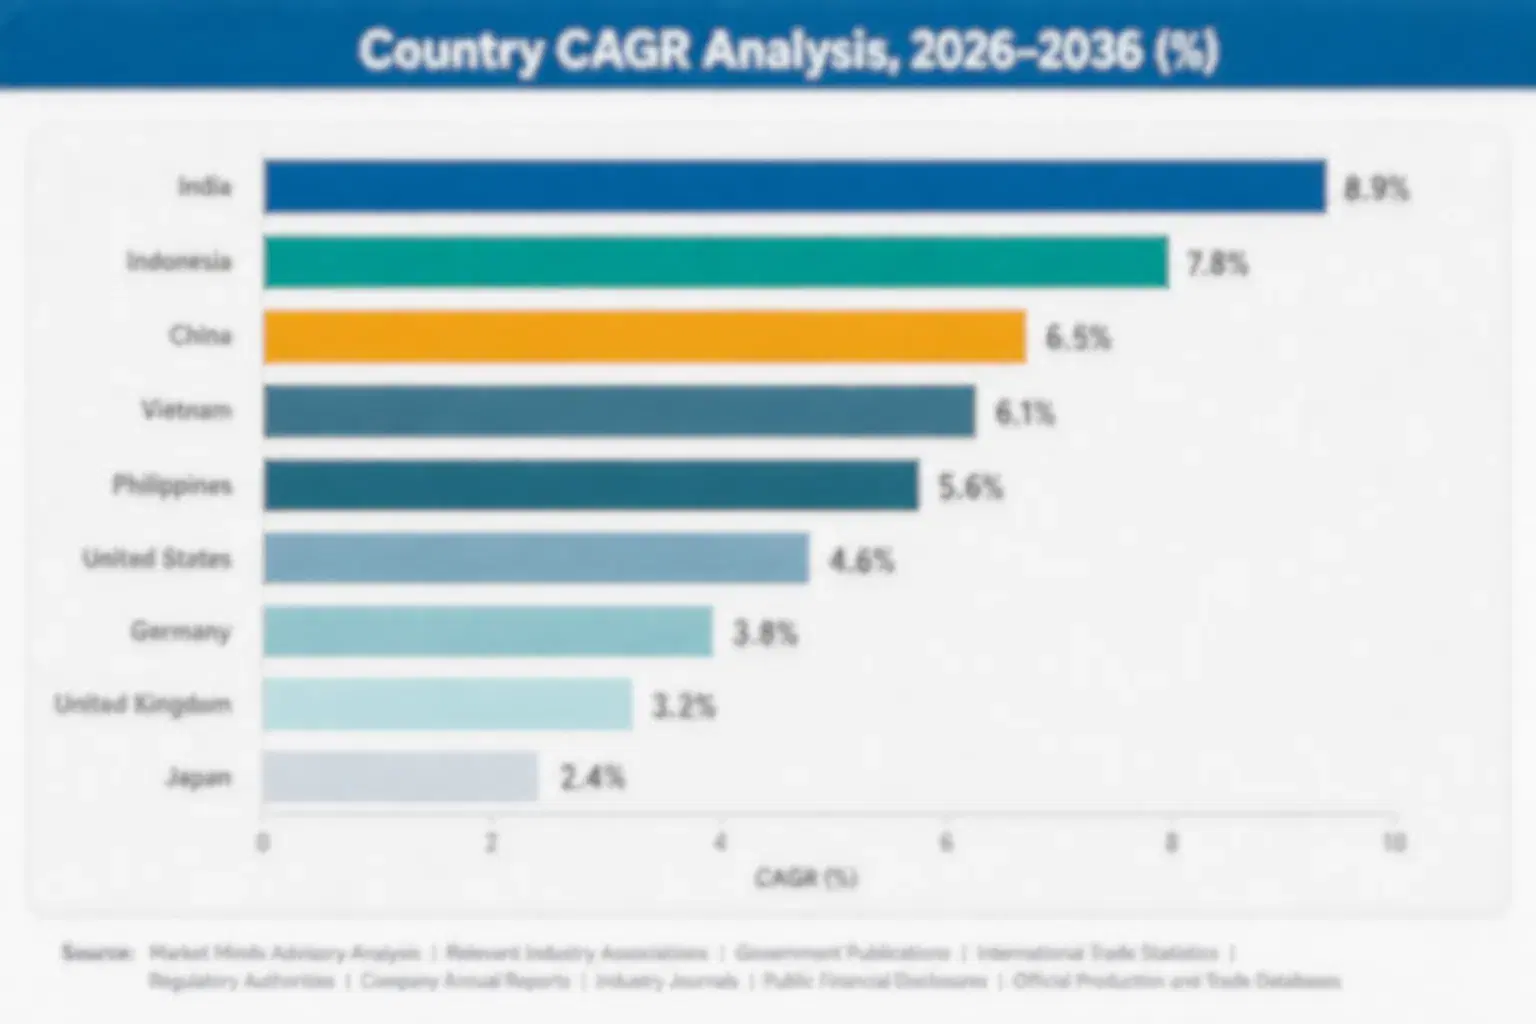
australia-collagen-peptide-market-country-cagr-analysis-1789839636004

Four Margin Routes for Australian Collagen Brands

Margin in Australian collagen comes from premium sourcing, defensible claims, convenient formats, and channel partnerships rather than volume alone. The routes below apply to national brands, pharmacy chains, and ingredient suppliers, and each can start inside one planning cycle, with clear measures in gross margin points, cost per serving, and retail placements won. Delivery reliability decides supplier rankings.

Building Traceable Marine Collagen Ranges for Beauty and Pescatarian Shoppers

Marine collagen peptides price 30% to 90% above bovine powders and earn gross margins of 60% to 72% against 48% to 58%, so brands that invest in traceable marine supply, allergen labelling, and beauty claims report gross margin gains of 5 to 9 points on the mix. Range development costs $0.3 million to $1.2 million. A pilot at two pharmacy chains confirms demand. Margins follow sourcing discipline. Buyers review suppliers every season. Batch records protect future sales. Cost control separates leaders from followers. Clear specifications build buyer trust. Small brands feel every input swing.
Market Impact: marine ranges lift gross margin by 5-9 points

Funding Clinical Studies and Claim Files That Withstand TGA Review

TGA and advertising rules limit claims without evidence, so brands that fund clinical studies, keep claim files, and use careful wording defend shelf space and avoid enforcement costs. Studies cost $0.5 million to $3 million. Brands should test their flagship product with 100 or more participants, publish results, and review all advertising against the code quarterly to protect sales. Technical reach compounds over time. Brands reward consistency over novelty. Supply contracts decide renewal. Delivery reliability decides supplier rankings. Margins follow sourcing discipline. Buyers review suppliers every season. Batch records protect future sales.
Market Impact: defensible claims protect sales worth 10-20% of revenue

Launching Ready-to-Drink and Gummy Formats Through Supermarkets and Pharmacies

Ready-to-drink and gummy formats grow about 10.2% a year and sell at premiums of 40% to 100% per serving over powders, so brands that partner with contract manufacturers and supermarket buyers reach commuters and gym-goers. Format development costs $0.5 million to $2 million. Brands should launch two flavours first, keep collagen above 5 grams per serving, and track repeat purchase monthly. Cost control separates leaders from followers. Clear specifications build buyer trust. Small brands feel every input swing. Technical reach compounds over time. Brands reward consistency over novelty. Supply contracts decide renewal.
Market Impact: new formats earn premiums of 40-100% per serving

Contracting Ingredient Supply and Hedging Currency Before Import Costs Swing

About 85% of ingredient volume is imported and freight and currency swings of 10% to 25% hit cost, so brands that contract suppliers, hold stock, and hedge currency cut cost volatility by roughly a third. Retailers accept price changes slowly, so contracts matter more than list prices. Brands that skip planning absorb 3% lower margins in swing years and risk shelf space. Delivery reliability decides supplier rankings. Margins follow sourcing discipline. Buyers review suppliers every season. Batch records protect future sales. Cost control separates leaders from followers. Clear specifications build buyer trust.
Market Impact: contracts cut cost volatility by roughly 33% yearly

Who Controls the Margin Pool

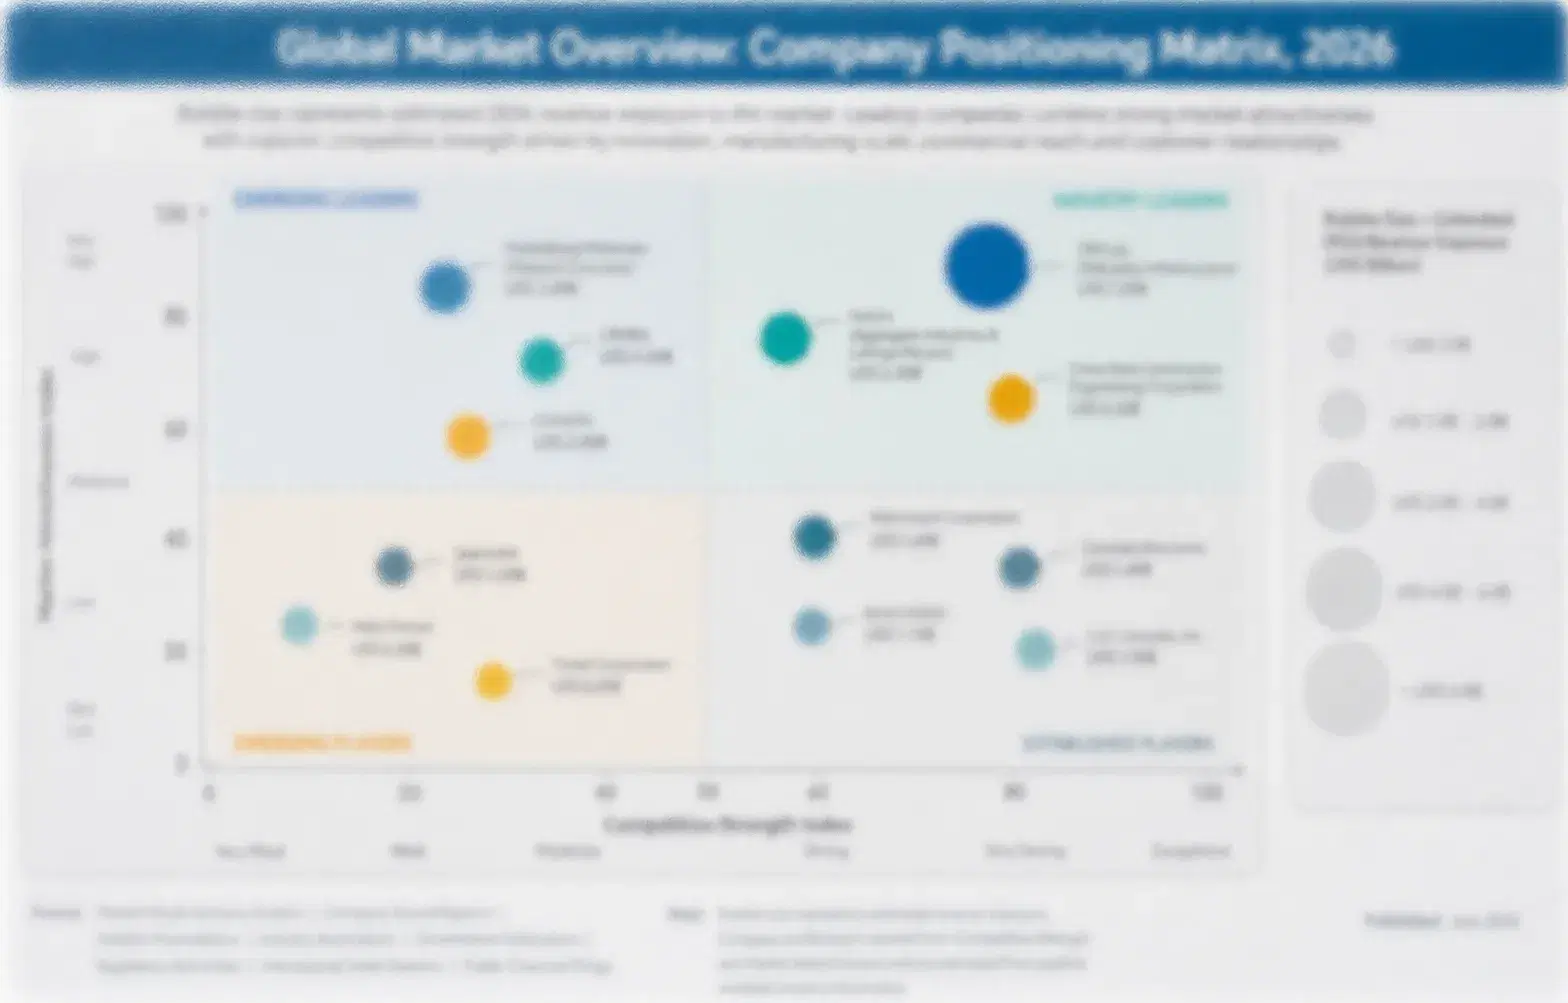
The Australian collagen peptide market is moderately concentrated, with a CR5 of 44%, and ingredient suppliers, private label, and niche brands sit outside the leading five. This assessment measures participants on estimated finished collagen product sales value in Australia, held constant across all players. Nestlé Health Science leads through brand strength and distribution, while Blackmores, Swisse Wellness, Nutra Organics, and Bioglan follow, with a clear gap between the leader and
Competition runs on four dimensions today: brand trust and claim compliance, ingredient source and quality, format innovation, and channel access. Large groups win on distribution and marketing, while niche brands win on sourcing stories. Imitators copy popular flavours and formats quickly, so premiums outside proven marine and ready-to-drink ranges erode within a season, and price competition appears in private label powders. Small brands feel every input swing.

Emerging pressure comes from pharmacy and supermarket private label, ingredient suppliers launching own brands, and direct-to-consumer start-ups. Rankings shift where a brand wins a large chain listing, passes a regulator review, or loses trust after a quality issue. Niche brands can move up quickly, since sourcing stories and social reach matter more than legacy scale. Technical reach compounds over time.
australia-collagen-peptide-market-company-positioning-matrix-1789839636184

Competitive Moat and Risk Dimensions

NESTLÉ HEALTH SCIENCE

Moat: Brand Strength and Global Sourcing

Nestlé Health Science, part of a Swiss consumer nutrition group, owns a leading collagen brand and has global ingredient sourcing, research resources, and distribution relationships in Australia. Its brand recognition, quality systems, and marketing scale give it credibility, and its range of formats supports growth across powders, drinks, and bars.
NESTLÉ HEALTH SCIENCE

Risk: Private Label and Claim Scrutiny

Nestlé Health Science faces private label competition and rising regulatory scrutiny of claims, and imported cost swings affect margins. Local brands with stronger Australian identity can win shelf space, and any quality issue would harm trust quickly. Brands reward consistency over novelty. Supply contracts decide renewal. Delivery reliability decides supplier rankings.
BLACKMORES

Moat: Australian Trust and Pharmacy Reach

Blackmores, an Australian complementary medicine brand owned by a Japanese beverage and health group, has strong trust with Australian shoppers and deep relationships with pharmacies and practitioners. Its regulatory expertise, local manufacturing, and brand heritage support collagen and joint health ranges, and its export links to Asia widen its base.
BLACKMORES

Risk: Ingredient Cost and Crowded Category

Blackmores depends on imported collagen ingredients whose costs swing and competes in a crowded category with strong private label. Global rivals with stronger sourcing stories or format innovation can win younger shoppers. Margins follow sourcing discipline. Buyers review suppliers every season. Batch records protect future sales. Cost control separates leaders from followers.

Players Tracked

Prominent Players

Nestlé Health Science
Blackmores
Swisse Wellness
Nutra Organics
Bioglan

Other Key Players

Gelita
Rousselot
Nitta Gelatin
PB Leiner
Weishardt
Darling Ingredients
Tessenderlo Group
Ewald-Gelatine
Junca Gelatines
Italgelatine
Youtheory
Ancient Nutrition
Neocell
Amway
Herbalife

Recent Developments

JANUARY 2026

Nestlé Health Science Expands Collagen Range With Marine Peptide Sachets for Australian Retail

Nestlé Health Science expanded its collagen range with marine peptide sachets for Australian retail. It is a product line extension, and it tests whether premium marine formats can hold price against bovine powders. Sales volumes were not disclosed. Clear specifications build buyer trust. Small brands feel every input swing.
Signal: Confirms that global brands are adding marine collagen formats to premium ranges to reach beauty-focused Australian shoppers.
FEBRUARY 2026

Blackmores Launches Collagen Joint and Skin Products Through Australian Pharmacy Chains

Blackmores launched collagen joint and skin products through Australian pharmacy chains, backed by claim files and pharmacist training. It is a product launch, and it tests whether pharmacy credibility can defend premium prices. Sales volumes were not disclosed. Technical reach compounds over time. Brands reward consistency over novelty.
Signal: Indicates Australian brands are using pharmacy credibility and claim files to defend collagen premiums against private label.
MARCH 2026

Gelita Signs Collagen Peptide Supply Agreements With Australian Contract Manufacturers

Gelita signed collagen peptide supply agreements with Australian contract manufacturers, fixing part of annual needs at agreed prices. It is a supply agreement programme, not an acquisition, and it tests whether local supply agreements support brand growth. Volumes were not disclosed. Supply contracts decide renewal. Margins follow sourcing discipline.
Signal: Shows global peptide suppliers are contracting Australian manufacturers directly to secure demand and cut lead times for local brands.

What Drives Australian Collagen Product Costs

Collagen peptide ingredients account for roughly 30% of cost of goods, flavours, sweeteners, and functional additives about 12%, packaging including sachets, tubs, and cans about 16%, contract manufacturing about 14%, and freight, testing, and compliance about 28%. Peptides come from Europe, Brazil, China, and Japan, and marine collagen from Asia. Batch records protect future sales. Cost control separates leaders from followers.
The clearest recent shock came from freight and currency. Australian Bureau of Statistics import price data showed freight and imported ingredient costs rising sharply after 2021, and Nestlé reported in its annual report that supply chain and input costs affected margins. Brands raised prices by 5% to 12% and some reduced serving sizes. Clear specifications build buyer trust. Small brands feel every input swing. Technical reach compounds over time. Supply contracts decide renewal.

The competitive disadvantage falls on small brands, which buy ingredients in small lots, lack hedging, and rely on a few retailers. Large brands hold supply contracts, own bargaining power with contract manufacturers, and spread testing cost across many products. Exposure also varies by segment, since marine collagen depends on Asian supply while bovine powder has more global suppliers. Margins follow sourcing discipline.
australia-collagen-peptide-market-cost-volatility-analysis-1789839636369

Contracting Ingredient Supply and Holding Stock

Brands sign multi-year supply agreements with peptide producers, hold buffer stock, and diversify origins across Europe, Brazil, and Asia. Contracts cut spot purchases by roughly half, though they need working capital that only larger brands usually provide. Supplier loyalty improves supply reliability in freight disruptions. Buyers review suppliers every season. Batch records protect future sales.

Hedging Currency and Writing Price Adjustment Clauses

Brands hedge currency exposure and write price adjustment clauses into retailer agreements with caps and floors. Hedging and clauses cut margin swings by 10% to 20% in volatile years. The main challenge is retailer acceptance, so brands publish cost drivers, offer volume terms, and pair pricing with supply guarantees. Cost control separates leaders from followers.

Using Local Contract Manufacturing to Cut Lead Times

Brands use Australian contract manufacturers for blending, filling, and gummy production to shorten lead times and cut freight on finished goods. Local manufacturing cuts lead times by 20% to 40% and reduces inventory. The main challenge is minimum order size, so brands consolidate ranges and forecast with retailers. Clear specifications build buyer trust. Small brands feel every input swing.

Portfolio Architecture for Margin Defence

Margins run from moderate returns on bovine powders sold in tubs to very strong returns on marine collagen and ready-to-drink formats sold through pharmacies and online channels. Three tiers separate volume products, certified premium lines, and next-generation formats, and each tier draws on different shopper groups, ingredient supply, and retailer terms. Supply contracts decide renewal. Delivery reliability decides supplier rankings.
The tension between volume and premium is sharp. Volume bovine powders protect factory utilisation and retailer relationships but face constant price pressure from private label and imported cost swings, while premium marine and ready-to-drink products earn higher margins on smaller volumes and depend on sourcing stories, formats, and claim compliance. Brands that run only volume struggle to fund evidence, while brands that run only premium lack the scale to hold shelf space.

High-value pools concentrate in marine collagen peptides sold to beauty-focused shoppers and in ready-to-drink and functional formats sold through supermarkets and pharmacies. They gather where buyers pay for source, convenience, and trust rather than grams. Type II joint collagen adds further value, since older shoppers ask for targeted, evidence-backed products. Margins follow sourcing discipline. Buyers review suppliers every season.

Volume / Commodity-Adjacent Tier

Bovine collagen peptide powders sold in tubs and pouches through supermarkets and pharmacies under retailer agreements, with moderate margins, imported cost exposure, and private label price competition, where shoppers switch on price. Batch records protect future sales.
Gross Margin: 44%-54%

Premium / Certified Tier

Type II and joint-focused collagen with clinical claims, documented sourcing, and pharmacist support, sold through pharmacies to older shoppers that require reliable quality, stable pricing, and credible evidence. Cost control separates leaders from followers.
Gross Margin: 52%-64%

Sustainability / Regulatory / Next-Generation Tier

Marine collagen peptides and ready-to-drink formats with traceable sourcing, allergen labelling, and convenient packaging, sold to shoppers that pay premiums for beauty benefits, taste, and stronger sustainability credentials. Clear specifications build buyer trust.
Gross Margin: 60%-72%
australia-collagen-peptide-market-portfolio-architecture-1789839636559

High-value Sub-segments and Strategic Watch-out

Marine Collagen Peptides

Marine collagen peptides combine the fastest growth with strong pricing, since beauty-focused and pescatarian shoppers pay 30% to 90% premiums over bovine powders. Traceable sourcing and allergen labelling limit competition, and brands with credible marine supply win. Volume compounds as beauty-from-within spreads across age groups. Supply contracts decide renewal.
Gross Margin: 60%-72%

Ready-to-Drink and Functional Food Collagen Products

Ready-to-drink and functional food collagen products deliver strong growth and healthy pricing, since commuters and gym-goers pay 40% to 100% premiums per serving over powders. Taste masking and stability form the entry barrier, and brands with contract manufacturers win. Repeat purchase builds through supermarket ranges and subscriptions.
Gross Margin: 52%-66%

Bovine Collagen Peptide Powders

Bovine collagen peptide powders form the volume core, sold in tubs to a broad shopper base at moderate margins. Volumes grow steadily, and value grows about 6.8% a year through mainstream adoption. Imported cost, private label price, and retailer terms decide profit, and brands anchor factory utilisation on the
Gross Margin: 44%-54%

Collagen Gummies and Chewables

Collagen gummies and chewables are the strategic watch-out, since dose per gummy is often under 2 grams, claim scrutiny is rising, and sugar and sweetener content can conflict with wellness positioning. Brands should prove dose and evidence before scaling, because regulators and reviewers challenge low-dose products.
Gross Margin: 48%-60%

Why Australian Shoppers Keep Reordering Collagen

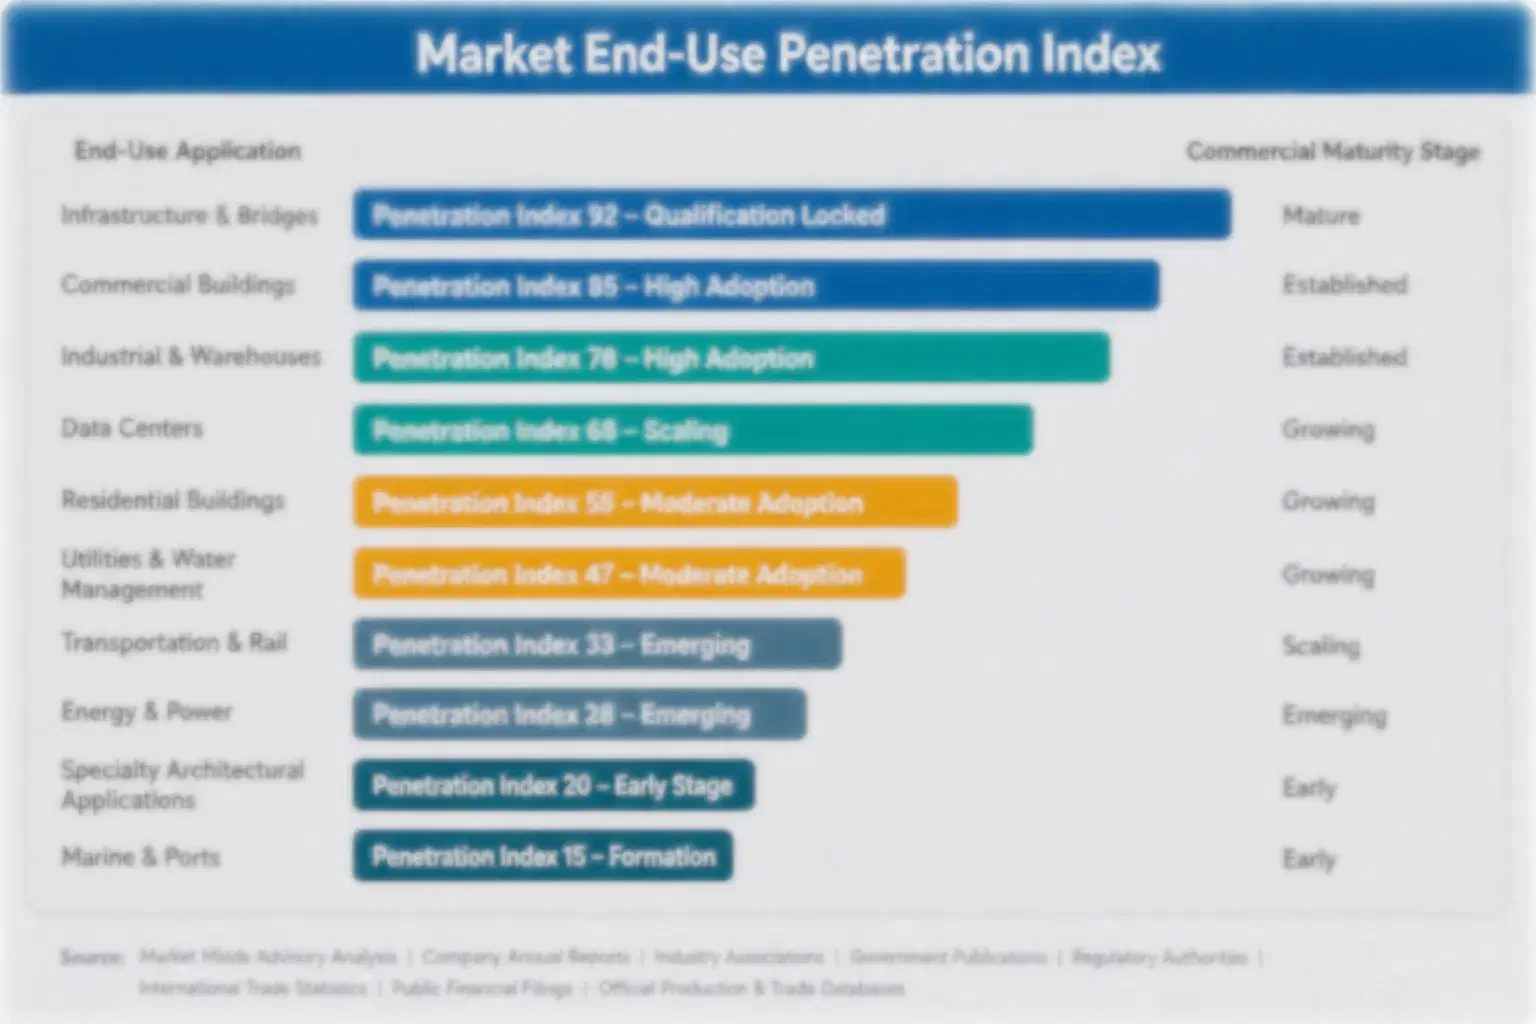
Collagen demand behaves like an annuity attached to daily routines and beauty or joint goals. Once a shopper settles on a product whose taste, dose, and results they trust, they repeat the purchase every month, and switching means new taste trials and doubts about results. Retailers use last quarter's sell-through and review scores to fix ranges, so brands with loyal repeat customers earn steadier volume than sellers reliant
Adoption stickiness differs by shopper vertical. Daily beauty users and older joint-health buyers are the deepest, since collagen is part of a routine and a pharmacist or practitioner often guides the choice, and they change only when taste or price fails. Sports buyers follow influencers. Occasional buyers are shallower and switch on price, while gift buyers buy opportunistically. Delivery reliability decides supplier rankings.

Buyer profiles are shifting between generations. Older shoppers bought collagen on practitioner advice and habit, while younger shoppers ask for marine sources, convenient formats, third-party testing, and sustainable sourcing on social media. Retail buyers add a third group that demands claim files. Brands that publish dose and testing data win younger shoppers and keep them as scrutiny grows.
australia-collagen-peptide-market-end-use-penetration-index-1789839636742

MMA Verdict on Australian Collagen Strategy

These are among the four positions where our research anticipates prominent divergence between winners and laggards over the coming forecast period. Each is grounded in the demand model, the regulatory perimeter, and the announced capacity pipeline.
01 / MARINE COLLAGEN POSITIONING

Build Traceable Marine Collagen Ranges Before Beauty Shoppers Choose Rival Brands

Marine Collagen Peptides grows at 11.6% a year, about 1.26 times the overall market rate, and brands that invest in traceable marine supply, allergen labelling, and beauty claims earn gross margins of 60% to 72% against 48% to 58% for bovine powders. Winners will fund range development costing $0.3 million to $1.2 million and pilot at two pharmacy chains each year. Brands with bovine powders alone will fight on price, and rivals with marine ranges will capture the fastest-growing shoppers.
02 / CLAIM COMPLIANCE STRATEGY

Fund Clinical Studies and Claim Files That Withstand TGA Review Before Enforcement

TGA and advertising rules limit claims without evidence, while regulatory reviews of collagen advertising are increasing. Brands should invest $0.5 million to $3 million in studies, test their flagship product with 100 or more participants, publish results, and review all advertising against the code quarterly across every channel they use. Those that rely on influencer claims will face enforcement and lost shelf space, and brands with defensible evidence will hold retailer trust and margin through every regulatory review and every retailer audit.
03 / FORMAT INNOVATION STRATEGY

Launch Ready-to-Drink and Gummy Formats Before Rivals Fill Supermarket Shelves

Ready-to-drink and gummy formats grow about 10.2% a year and sell at premiums of 40% to 100% per serving over powders, while commuters and gym-goers prefer convenience. Brands should invest $0.5 million to $2 million in format development, launch two flavours first, keep collagen above 5 grams per serving, and track repeat purchase monthly across every retailer. Those that rely on powders alone will lose new shoppers, and brands with convenient formats will win shelf space and repeat customers in every channel.
04 / IMPORT COST MANAGEMENT

Contract Ingredient Supply and Hedge Currency Before Import Costs Swing Again

About 85% of ingredient volume is imported and freight and currency swings of 10% to 25% hit cost, while retailers accept price changes slowly. Brands should contract suppliers, hold buffer stock, hedge currency, and write price adjustment clauses into retailer agreements, cutting cost volatility by roughly a third. Those that buy on the spot market will absorb 3% lower margins in swing years or lose shelf space to private label, and rivals with cover will hold price, supply, and trust.

Engagement Snapshot From the Field

A live engagement with an industry participant carrying material or product regulatory and market exposure ahead of a defining policy shift, showing how our research translates into a defensible multi-year portfolio strategy.
MARKET MINDS ADVISORY · CLIENT ENGAGEMENT SUMMARY
Australia Collagen Peptide Producer Strategic Portfolio Review and Transition Roadmap 2026·Investment Scenario on Australia Collagen Peptide Exposure Evaluation 2025-26
CLIENT PROFILE
The client is a mid-sized Australian supplement brand with annual sales near A$120 million (client-reported, unverified by MMA), selling bovine collagen powders through pharmacies and online channels. It had no marine or ready-to-drink range, bought ingredients in small lots, and had two retailers accounting for 47% of collagen sales. Delivery reliability decides supplier rankings. Margins follow sourcing discipline.
STRATEGIC CHALLENGE
Private label had taken share at prices 30% below the brand, ingredient and freight costs had risen 30% in three years, and regulators were reviewing collagen claims. Management needed to decide whether to build marine and ready-to-drink ranges, fund clinical evidence, or contract ingredients, with limited capital and one contract manufacturer. Buyers review suppliers every season.
MMA APPROACH
MMA analysed sales, cost, and review data across 22 products, interviewed 10 pharmacy and supermarket buyers, six ingredient suppliers, and five regulatory advisers, and ran a shopper survey on source, format, and price across three countries. It modelled margin by product and channel, tested currency scenarios, and ranked options by payback and regulatory risk.
KEY FINDINGS
  1. A marine collagen range could reach 18% of collagen sales in three years at margins near 66% (client-reported, unverified by MMA). Batch records protect future sales.
  2. A clinical study on the flagship product could protect sales worth about 15% of revenue against claim challenges. Cost control separates leaders from followers.
  3. Ready-to-drink formats could add premiums of about 60% per serving and reach new shoppers in supermarkets. Clear specifications build buyer trust. Small brands feel every input swing.
  4. Ingredient contracts and currency hedging would cut cost volatility by about a third across the range. Technical reach compounds over time. Brands reward consistency over novelty.
CLIENT PROFILE
The client is a mid-sized Australian supplement brand with annual sales near A$120 million (client-reported, unverified by MMA), selling bovine collagen powders through pharmacies and online channels. It had no marine or ready-to-drink range, bought ingredients in small lots, and had two retailers accounting for 47% of collagen sales. Delivery reliability decides supplier rankings. Margins follow sourcing discipline.
STRATEGIC CHALLENGE
Private label had taken share at prices 30% below the brand, ingredient and freight costs had risen 30% in three years, and regulators were reviewing collagen claims. Management needed to decide whether to build marine and ready-to-drink ranges, fund clinical evidence, or contract ingredients, with limited capital and one contract manufacturer. Buyers review suppliers every season.
MMA APPROACH
MMA analysed sales, cost, and review data across 22 products, interviewed 10 pharmacy and supermarket buyers, six ingredient suppliers, and five regulatory advisers, and ran a shopper survey on source, format, and price across three countries. It modelled margin by product and channel, tested currency scenarios, and ranked options by payback and regulatory risk.
KEY FINDINGS
  1. A marine collagen range could reach 18% of collagen sales in three years at margins near 66% (client-reported, unverified by MMA). Batch records protect future sales.
  2. A clinical study on the flagship product could protect sales worth about 15% of revenue against claim challenges. Cost control separates leaders from followers.
  3. Ready-to-drink formats could add premiums of about 60% per serving and reach new shoppers in supermarkets. Clear specifications build buyer trust. Small brands feel every input swing.
  4. Ingredient contracts and currency hedging would cut cost volatility by about a third across the range. Technical reach compounds over time. Brands reward consistency over novelty.
RECOMMENDED STRATEGY
Phase 1: Phase 1 (Months 1-6): Design clinical studies, sign ingredient contracts, and select marine suppliers. Supply contracts decide renewal. Delivery reliability decides supplier rankings. Phase 2: Phase 2 (Months 7-24): Launch marine and ready-to-drink ranges to two retailers with claim files. Margins follow sourcing discipline. Buyers review suppliers every season. Phase 3: Phase 3 (Months 25-42): Scale marine and format ranges, extend price clauses, and review claims quarterly. Batch records protect future sales.
OUTCOME
Within 42 months, marine and ready-to-drink ranges reached 28% of collagen sales, cost volatility fell by 30%, and gross margin on the range rose to 61% (client-reported, unverified by MMA). The client won five retailer programmes, cut top-two retailer share to 39%, and raised repeat purchase by 17%.

Frequently Asked Questions

Foundational context covering the market sizes, CAGR, scope, country, region and competition that inform every finding below. This section is provided to cover basics and most often pre-purchase conversations, answered from the MMA Primary Research Dataset.

What is the current size of the Australia Collagen Peptide Market?

The Australia collagen peptide market was valued at $0.11 billion in 2025 on a manufacturer-value basis. Growth is supported by beauty-from-within and joint health interest despite claim scrutiny and imported ingredient costs.

How large will the Australia Collagen Peptide Market be by 2036?

The market is projected to reach $0.29 billion by 2036, up from $0.12 billion in 2026. The increase of $0.17 billion reflects marine collagen, ready-to-drink formats, and wider pharmacy and supermarket reach.

What is the CAGR for the Australia Collagen Peptide Market 2026 to 2036?

The market is forecast to grow at a 9.2% CAGR from 2026 to 2036. The bull case reaches 10.6% and the bear case 7.8%, depending on clinical evidence and claim enforcement.

Which segment is growing fastest?

Marine Collagen Peptides is the fastest-growing segment at 11.6% CAGR, roughly 1.26 times the overall market rate. Ready-to-Drink and Functional Food Collagen Products follows at 10.2% CAGR each year.

Who are the major companies in the Australia Collagen Peptide Market?

Major companies include Nestlé Health Science, Blackmores, Swisse Wellness, Nutra Organics, and Bioglan. Ingredient suppliers Gelita, Rousselot, Nitta Gelatin, PB Leiner, and Weishardt also hold meaningful positions.

Which country is growing fastest?

This file covers Australia only, where demand grows at a 9.2% CAGR. Among supplying countries, Japan and China grow fastest as Australian brands source more marine collagen peptides from Asia.

Report Segmentation Architecture

The full report scope spans multiple orthogonal segmentation dimensions, with cross-tabulated demand data provided for each dimension pair. Coverage extends further to regional breakdowns, trend trajectories, and the competitive detail needed to support segment-level decision-making.

By Primary Market Dimension

  • Bovine Collagen Peptide Powders
  • Marine Collagen Peptides
  • Type II and Joint-Focused Collagen
  • Ready-to-Drink and Functional Food Collagen Products
  • Collagen Gummies and Chewables

By End-Use Industry

  • Beauty and Skin Health
  • Joint and Bone Health
  • Sports and Active Nutrition
  • Healthy Ageing
  • General Wellness

By Commercial Dimension

  • Pharmacies
  • Supermarkets
  • Health Food Stores
  • Online and Subscription Sales
  • Private Label Supply

By Region

  • South Asia and Pacific
  • Western Europe
  • North America
  • East Asia
  • Latin America
  • Middle East and Africa
  • Eastern Europe

Scope, Methodology, and Coverage

Every figure in this report is reproducible from documented input assumptions. The scope below maps the historical period, the forecast horizon, the segmentation dimensions, and the countries covered, alongside the underlying primary and qualitative methodology.
Historical Period
2020 to 2025
Forecast Period
2026 to 2036
Base Year
2025 (USD billions; MMA Primary Research Dataset, September 2026)
Market Definition
The market covers Australian consumer demand for collagen peptide products, valued at manufacturer level for finished goods sold through pharmacies, supermarkets, health stores, and online channels, including bovine collagen peptide powders, marine collagen peptides, type II and joint-focused collagen, ready-to-drink and functional food collagen products, and collagen gummies and chewables. The scope excludes gelatin for cooking, collagen for cosmetics applied to skin, pharmaceutical collagen implants, pet products, and exports.
Quantitative Units
USD billions (manufacturer value); tonnes of peptide for volume references
Segmentation Dimensions
By Source and Product Form; By End-Use Industry; By Commercial Dimension; By Region
Regions Covered
South Asia and Pacific, Western Europe, North America, East Asia, Latin America, Middle East and Africa, Eastern Europe
Countries Covered
Australia, with supply chain links to Germany, Belgium, France, Brazil, Japan, China, the United States, and additional markets relevant to this sector
Key Companies Profiled
Nestlé Health Science, Blackmores, Swisse Wellness, Nutra Organics, Bioglan, Gelita, Rousselot, Nitta Gelatin, PB Leiner, Weishardt, Darling Ingredients, Tessenderlo Group, Ewald-Gelatine, Junca Gelatines, Italgelatine, Youtheory, Ancient Nutrition, Neocell, Amway, Herbalife
Quantitative Methodology
Primary survey, n=3,800 respondents, Q4 2025, six countries; demand-side model with trade association cross-validation
Qualitative Methodology
47 expert interviews, Q4 2025; applied to validate demand model assumptions, identify emerging dynamics, and assess competitive positioning
Report Format
PDF and XLSX data workbook (Word format preview document)
Publisher
Market Minds Advisory
Report Code
MMA-2026-HLT-575
Published
September 2026
Contact
sales@marketmindsadvisory.com | www.marketmindsadvisory.com

Purchase the full Australia Collagen Peptide Market Report (2026 to 2036).

The full report delivers a detailed assessment of the Australia collagen peptide market through 2036, covering source, end-use, and channel forecasts, competitive benchmarking of leading brands, and input cost analysis. It combines MMA primary research, including a six-country survey of 3,800 respondents and 47 expert interviews, with public statistical and company data. Analysts also model currency scenarios, claim enforcement paths, and marine collagen adoption. Clients receive segment margin ranges, sourcing maps, and a case study on portfolio strategy. Retailer programme and sourcing contract frameworks are also included for planning.
Ten-year source and end-use demand forecasts
Peptide, packaging, and freight cost tracking
Competitive benchmarking of top twenty brands
TGA claim and advertising rule tracker updates
Regional supply chain comparative analysis included
Quarterly primary survey data update access

Built For The People Who Decide

From boardroom strategy to bench-side execution, this report is read cover-to-cover by leaders shaping the next decade of their industry, turning demand scenarios, market dynamics and valuation benchmarks into decisions.
CXOs/ Presidents/ VPs/ Managers
M&A and Corporate Development
Strategy Teams and R&D Heads
Procurement and Product Directors
Regulatory and Compliance Leaders
Investor Relations and Equity Analysts