

Market Minds Advisory
At-Home Heart Health Testing Market

At-Home Heart Health Testing Market: Consumer Alerts, Prescribed Patches, and Who Pays for the Follow-Up

A smartwatch tells millions of people that their heart rhythm looks irregular, and roughly two-thirds of those alerts do not survive clinical review, leaving cardiology to absorb the entire difference.

Lead Analyst

Alice Ballenger

Published

September 2026

Make Smarter Decisions with Customized Research Insights

Request a free sample report and evaluate market opportunities, growth trends, and competitive dynamics relevant to your business needs.

2025 MARKET VALUE$9.4BMarket Size 2025
2036 FORECAST VALUE$26.8BBase Case , 2026 to 2036
CAGR 2026 TO 203610.0 %Bull 11.3% / Bear 8.8%
INCREMENTAL OPPORTUNITY$16.5BNet 10- year value creation
EXPANSION MULTIPLE2.59x2036 value over 2026 base
Strategic Levers
M&A Pipeline
Regional Outlook
Country Rankings
Competitive Intelligence
Segmental Deep-dive
Call-Us : 91 93563 13602

Executive Snapshot and Market Trajectory

Two markets sit inside this one and they behave nothing alike. Consumer devices sell to people who buy them; prescribed monitors sell to a reimbursement schedule. Confusing the two has cost several participants a great deal of money over the past five years. Separate businesses, one name.
Prescribed ambulatory ECG patch monitoring compounds at 15.0%, a full 1.50x the market rate, because dedicated reimbursement codes established in 2021 converted a service billed by exception into one billed routinely. East Asia holds the largest share at 32%, on home blood pressure measurement that Japanese hypertension guidelines adopted as the primary standard two decades before Western ones did. Prescribed patch monitoring is barely established anywhere across the region.
Concentration is moderate at 44%, with Omron holding the validated blood pressure position and iRhythm the prescribed patch one. Apple and AliveCor reach far more people than either of them, and bill almost nobody. Who pays for the clinical work a consumer alert generates is the market's central question, and at present nobody does. Roughly 66% of consumer alerts fail confirmation, and nobody bills for resolving them. That gap is the market's central commercial question.
Market Definition
This market covers testing and monitoring of cardiovascular status performed in the home, spanning home blood pressure monitoring devices, consumer wearable cardiac rhythm monitoring, prescribed ambulatory ECG patch monitoring, at-home cardiac biomarker test kits, and home cardiac diagnostic services with interpretation software. Implantable device telemetry, in-clinic diagnostic equipment, hospital telemetry systems, cardiac imaging of any kind, general fitness tracking without a cardiac diagnostic claim, and therapeutic devices are excluded.
Base Year Value
$9.4B in 2025 (MMA Primary Research Dataset, August 2026)
Forecast Period
2026 to 2036, eleven discrete annual values
CAGR
10.0% base case. Bull 11.3%. Bear 8.8%.
Fastest Growth Segment
Prescribed Ambulatory ECG Patch Monitoring: 15.0% CAGR
Fastest Growth Country
India: 13.4% CAGR
Fastest Growth Region
South Asia and Pacific: 12.2% CAGR
Largest Region
East Asia: 32% of 2025 global value
Market Leaders
Omron Healthcare, iRhythm Technologies, Apple, AliveCor, and Withings. Source: MMA Primary Research Dataset, July 2026.
Primary Survey
n=3,800 procurement and R&D decision-makers, Q4 2025, six countries
Methodology
Demand-side build-up, cross-validated against public data, 47 expert interviews

At-Home Testing Market Forecast Scenarios

at-home-heart-health-testing-market-size-forecast-scenario-1787305668881
Between 2020 and 2025 the market expanded rapidly on pandemic-driven infectious disease testing before normalizing sharply as COVID-19 self-test demand fell, then re-accelerated through 2024 and 2025 as cancer screening and STI self-test categories gained FDA clearances and payer coverage that had not existed before the pandemic reshaped consumer testing habits. Vendors report order volumes largely normalized to a new, higher baseline by early 2024.
The base case assumes steady 9.5% annual growth through 2036, anchored to three mechanisms: expanding FDA clearance of higher-complexity self-collection kits for cancer and STI screening, growing insurer reimbursement that removes the out-of-pocket cost barrier for consumers, and telehealth platforms increasingly bundling self-test kits directly into virtual care visits rather than referring patients to separate laboratory appointments. Group purchasing and payer contract activity have reinforced this trajectory across most recent quarters.
The bull case centers on national screening programs in East Asia formally adopting self-collected kits as a reimbursed alternative to in-clinic testing. The bear case centers on regulatory delays at the FDA and equivalent bodies slowing new product clearances, stretching launch timelines by a year or more across the highest-growth segments. Neither scenario shifts the leading five manufacturers' relative rankings materially within the decade.

Home Cardiac Testing: Alerts, Patches and Payers

The consumer half of this market has an accuracy problem that nobody wants to state plainly. Wrist-worn rhythm detection produces alerts at enormous scale, and roughly 34% of those alerts survive subsequent clinical review. The technology is not defective; it is screening an unselected population where the condition is uncommon, which is exactly the situation that produces low confirmation rates. Millions of alerts a year reach people with no cardiac history.
TOP FIVE CONCENTRATION44%Split between consumer electronics and prescribed monitoring specialists
PATCH WEAR DURATION14 daysDays a prescribed ambulatory monitor stays on the patient
ALERT CONFIRMATION RATE34%Consumer rhythm alerts confirmed on subsequent clinical review
HOUSEHOLD MONITOR PENETRATION41%Hypertensive households owning a validated blood pressure monitor
REIMBURSED VOLUME SHARE38%Home testing volume billed through clinical reimbursement channels
DEVICE REPLACEMENT INTERVAL5 yearsTypical life before a household replaces its monitoring device
Somebody then has to work through them. A patient who receives a notification contacts a physician, and that physician orders a proper recording to find out whether anything is there. In most health systems no code covers reviewing a consumer alert, so the triage work is absorbed by primary care and cardiology without payment. That is the most commercially interesting unsolved problem in this market.
The prescribed side works entirely differently. A patch worn for fourteen days is ordered by a physician, billed under codes established in 2021, read by an algorithm and confirmed by a technician, and returns a report the ordering clinician can act on. Diagnostic yield is far better than a 24-hour Holter recording, and reimbursement exists. That combination is why the segment compounds at 15.0%.
"The consumer companies solved detection and left diagnosis to everybody else. A watch can tell you something looks wrong; it cannot tell you what to do, and no health system has funded the person who answers that question. Whoever builds and gets paid for the triage layer between the alert and the cardiologist takes this market."
Principal Analyst, Cardiovascular Diagnostics and Remote Monitoring Practice · M

Market Trends

Reimbursement codes turned long-term monitoring into routine practice

Dedicated payment for long-term continuous ECG monitoring established at the start of 2021 changed the economics of ordering one. Before that, extended recording was billed by exception and reimbursed unpredictably, which made clinicians default to shorter in-clinic recordings they knew would be paid. Afterward the fourteen-day patch became the standard first investigation for suspected arrhythmia in most United States practices. The segment compounds at 15.0% against a market rate of 10.0%, and almost none of that reflects any change in the underlying device technology. The device has changed very little; the billing environment around it changed completely.
Market Impact: Household penetration reaching 41%

Consumer alerts generate clinical work that nobody bills

Roughly 34% of consumer rhythm alerts are confirmed on subsequent clinical review, which means the majority generate an appointment, a conversation and often a proper recording that finds nothing. Primary care and cardiology absorb that work without a reimbursement pathway, and interviewed clinicians described it as a growing and largely invisible burden. Several health systems have begun building structured triage protocols to manage the volume. Whoever gets that triage layer reimbursed converts an enormous cost into a service line, and no participant has managed it yet. Reimbursement classification rather than clinical feasibility is what stands in the way.
Market Impact: Wear duration 14 versus 1 day

Market Opportunities and Growth Drivers

Out-of-office blood pressure confirmation became guideline practice

Diagnosing hypertension on clinic readings alone is no longer recommended in most major guidelines, because white coat and masked hypertension together misclassify a substantial share of patients. Confirmation now requires home or ambulatory measurement, which puts a validated device into the household as a condition of diagnosis rather than as an optional purchase. Japan adopted this position two decades before Western guidelines followed. Household penetration among hypertensive patients sits near 41% and continues rising, which sustains the market's largest segment by volume. Every newly diagnosed hypertensive patient now represents a device purchase that guidelines effectively require rather than merely suggest.
Market Impact: Codes covering 15.0% growth segment

Patch monitoring displaces in-clinic Holter recording

A fourteen-day patch detects arrhythmias that a 24-hour Holter recording misses, simply because intermittent events need time to appear. It also removes the wires, the clinic visit for fitting and the return appointment. Diagnostic yield improvement is large enough that clinicians order patches as a first investigation rather than escalating to them, and Holter volume has been declining across developed markets as a direct result. The substitution is close to complete in United States practice and moving steadily through Europe and Japan. Nothing about the patch is technically difficult, which is why substitution moved as fast as reimbursement allowed.
Market Impact: Confirmation rate near 34% clinically

Market Restraints and Challenges

Ambulatory monitoring reimbursement has been reset downward before

The fastest-growing segment in this market depends on a payment schedule that a single administrative decision can change, and rates for ambulatory cardiac monitoring have been revised downward within the past decade. The root cause is that the service is billed through codes whose valuation is periodically reviewed against utilisation, and rapid volume growth invites exactly that review. Commercial impact would fall hardest on participants whose revenue concentrates in one code family. Participants respond by diversifying across monitoring durations, pursuing international reimbursement and building direct employer and health system contracts.
Market Impact: Segment compounding at 15.0% annually

Consumer accuracy limits confine devices to screening roles

Wrist-based rhythm detection screens an unselected population where the underlying condition is uncommon, and roughly 34% alert confirmation follows arithmetically from that rather than from any engineering shortfall. The root cause is population prevalence, which no sensor improvement addresses. Commercial impact is that consumer devices cannot support a diagnostic claim, cannot be billed as a diagnostic test and cannot replace prescribed monitoring. Participants respond by positioning consumer devices as a route into prescribed pathways and by pursuing regulatory qualification for narrower, higher-prevalence populations. Narrowing to higher-prevalence groups raises confirmation rates arithmetically, which is the only route available.
Market Impact: Roughly 66% of alerts unconfirmed
3 additional market trends, 4 additional growth drivers, and 2 additional restraints and challenges are covered in the full report. Contact sales@marketmindsadvisory.com to access the complete intelligence.

Segment CAGR and Growth Architecture

Five monitoring modalities divide this market, and the dividing line that matters commercially is not technology but who pays. Two segments sell to consumers directly, two sell against a reimbursement schedule, and one sits between them supplying the interpretation that turns raw signal into something a clinician can act on. That payment distinction runs deeper than any technical one.
at-home-heart-health-testing-market-market-share-analysis-1787305669415

Prescribed Ambulatory ECG Patch Monitoring

Compounding at 15.0%, a full 1.50x the market rate, this segment covers physician-ordered wearable recorders worn for up to fourteen days and returned for algorithmic and technician analysis. Dedicated reimbursement established in 2021 is the reason for the growth rather than any device advance, since extended recording had previously been billed unpredictably. Diagnostic yield well above 24-hour Holter recording drives clinical preference, and Holter volume has fallen accordingly across developed markets. The economics depend entirely on a payment schedule that periodic administrative review could revise, which is the segment's principal risk rather than any competitive threat. Ordering clinicians select on report clarity and false positive burden rather than on any hardware attribute the patient experiences.
CAGR 15.0%

Home Cardiac Diagnostic Services and Interpretation

Growing at 13.4%, this segment supplies the analysis layer: algorithmic rhythm classification, technician confirmation, report generation and increasingly the triage of consumer-generated alerts. It is where clinical value concentrates, because raw signal from any device is worth very little until somebody has determined what it shows and communicated it to a clinician who can act. The consumer alert burden creates the largest unaddressed opportunity here, with roughly 66% of alerts requiring review that no reimbursement pathway currently funds. Participants solving that funding question convert an industry-wide cost into a billable service. Accumulated analysed recording volume improves classification accuracy in ways smaller participants cannot shortcut, which makes this the most defensible position available in the whole market.
CAGR 13.4%
Full segment breakdown across 5 segments available in the complete report.

Regional Architecture and Country Demand Map

Regional distribution follows clinical guideline position and reimbursement design rather than cardiovascular disease burden, which is broadly similar across developed markets. Where home measurement is written into diagnostic guidelines, household device penetration runs far ahead of markets where it remains optional. Reimbursement design decides the rest of the picture.

East Asia

Thirty-two per cent of global value, the largest regional position, and home blood pressure measurement explains most of it. Note: this share sits above the 22 to 30% band because Japanese hypertension guidelines adopted home measurement as the primary diagnostic standard roughly two decades before Western equivalents, producing household penetration no other market approaches. Omron built a global business from that domestic base. China's hypertensive population is the largest anywhere and household device ownership is rising quickly, supplied mainly by domestic manufacturers at price points international participants cannot match. Prescribed patch monitoring is comparatively underdeveloped across the region. Consumer wearable rhythm detection is growing quickly from a small base across South Korea and Taiwan, supported by high smartwatch ownership.
Share: 32% | CAGR: 10.8% (2026 to 2036)

North America

Twenty-seven per cent of value and the region where prescribed monitoring rather than consumer devices carries the economics. Dedicated reimbursement for long-term continuous ECG monitoring established in 2021 made the fourteen-day patch a standard first investigation, and iRhythm built the deepest position on that pathway. Consumer wearable penetration is also the highest anywhere, which means the unfunded alert triage burden falls heaviest here. Interviewed clinicians described that burden growing faster than any structured response to it, and several health systems now run dedicated protocols. Consumer wearable ownership creates the largest alert volume anywhere, and no reimbursement pathway funds reviewing it. Several health systems now run dedicated triage protocols in response.
Share: 27% | CAGR: 11.0% (2026 to 2036)
Regional intelligence for 5 additional markets available in the complete report: Western Europe, South Asia and Pacific, Latin America, Middle East and Africa, Eastern Europe. Contact sales@marketmindsadvisory.com.
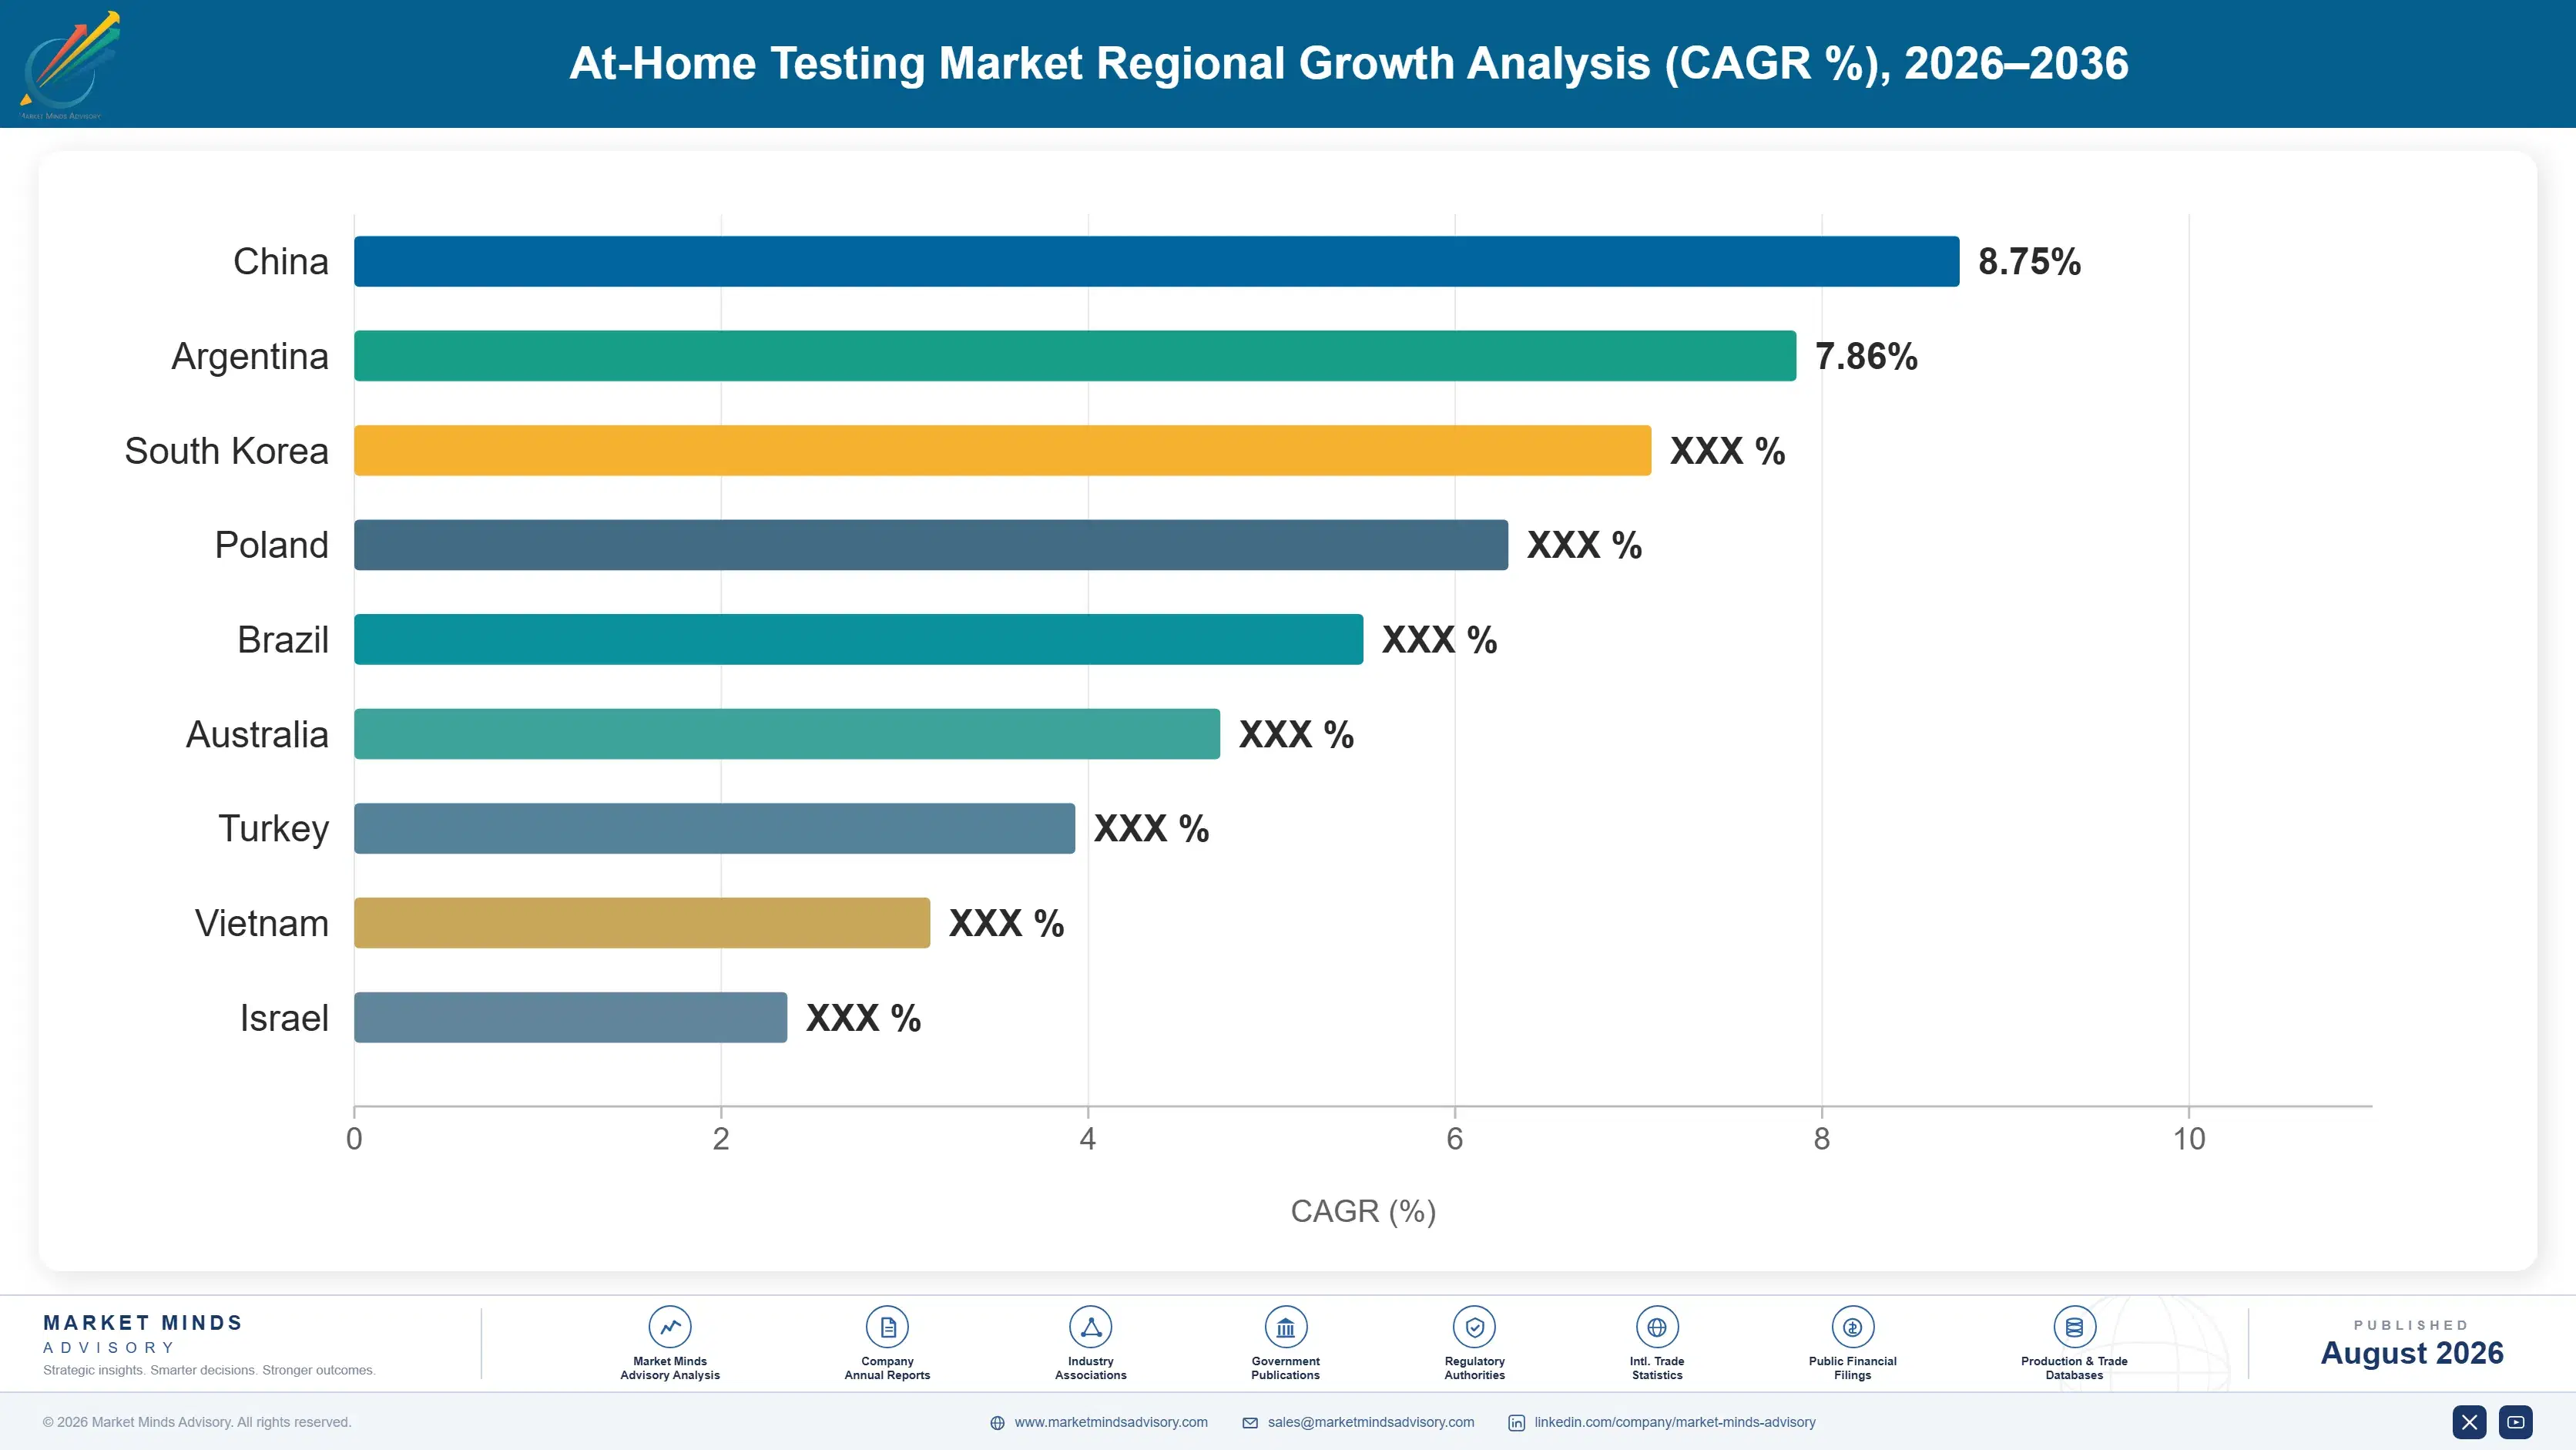
at-home-heart-health-testing-market-country-cagr-analysis-1787305669932

Where Home Cardiac Testing Value Concentrates

Detection is solved and largely commoditised. What remains valuable is the interpretation layer that turns signal into a clinical decision, the reimbursement pathway that pays somebody for making it, and the conversion of consumer alert volume into prescribed diagnostic episodes that a payer will actually fund. Sensors are no longer where anybody wins. Detection is finished as a contest.

Build and bill the alert triage layer

Roughly 66% of consumer rhythm alerts are not confirmed clinically, and every one still generates an appointment and often a proper recording. Primary care absorbs that work unpaid today. A structured triage service, staffed appropriately and priced against the cardiology appointments it prevents, converts an industry-wide cost into a service line, and health systems interviewed valued avoided referrals at $180 to $240 each. The obstacle is reimbursement classification rather than clinical feasibility, and solving it once creates a category nobody currently occupies. Pilot evidence rather than clinical argument is what moves a classification submission.
Market Impact: Avoided referrals worth $180 to $240 each time

Convert consumer alerts into prescribed diagnostic episodes

A consumer device cannot support a diagnostic claim and cannot be billed as a diagnostic test, which caps what any participant earns from it directly. Its commercial value lies in generating prescribed episodes: an alert that leads to a physician ordering a fourteen-day patch produces reimbursed revenue that the alert itself never could. Participants that own both ends capture roughly 4x the revenue per identified patient compared with those holding only the consumer relationship. Referral pathway design rather than sensor accuracy determines that conversion rate. A partnership reaches revenue considerably faster than building prescribed capability internally does.
Market Impact: Roughly 4x revenue per identified patient overall now

Diversify beyond a single reimbursement code family

The 15.0% growth in prescribed patch monitoring rests on a payment schedule that periodic administrative review can revise, and rates in this area have been reduced within the past decade. Participants concentrated in one code family carry unhedged exposure to a decision they cannot influence. Diversification across monitoring durations, international reimbursement pathways and direct employer or health system contracting spreads that risk. It also builds pricing evidence outside the schedule, which is the only durable defence when a valuation review eventually arrives. Direct contracting also builds pricing evidence that survives a schedule change.
Market Impact: A single code family carrying the 15.0% growth

Sell interpretation quality rather than device specification

Every participant in prescribed monitoring records adequate signal; the differences that matter to a cardiologist are classification accuracy, report clarity and how much unnecessary review the service creates. Interpretation services compound at 13.4% precisely because that layer carries the clinical value. Cardiologists interviewed identified report quality and false positive burden as their primary selection criteria, well ahead of any hardware specification. Participants competing on electrode design and wear comfort are competing on attributes the ordering clinician never experiences directly. Cardiologists never touch the electrode; they read the report and count its false positives.
Market Impact: Interpretation layer growing at 13.4% every single year

Who Controls the Margin Pool

The top five hold 44% of the market measured on revenue from at-home cardiac testing products and services, the basis used throughout this section. Concentration is moderate and the participants are not really competing with each other: Omron leads a validated device category sold at retail, iRhythm leads a reimbursed clinical service, and Apple reaches more people than both combined while billing almost nobody. The gap between leader and challenger differs entirely by segment.
Competitive activity runs along three lines. Consumer electronics participants are pursuing regulatory qualification to move features from wellness claims toward clinical ones. Prescribed monitoring participants are extending internationally to reduce dependence on a single reimbursement schedule. And several are building interpretation and triage services, on the correct view that the analysis layer rather than the sensor carries defensible value.

Pressure is emerging from two directions. Chinese and Indian manufacturers compete on price in blood pressure monitoring, the largest volume segment, where validation rather than brand increasingly decides clinical acceptability. And any participant that gets alert triage reimbursed would occupy a position between consumer devices and cardiology that nobody currently holds. Rankings shift on that second question far more than on the first.
at-home-heart-health-testing-market-company-positioning-matrix-1787305670451

Competitive Moat and Risk Dimensions

OMRON HEALTHCARE

Moat: Validated measurement installed base

Decades of clinical validation studies and a position written into Japanese hypertension guidance give the company a credibility in home blood pressure measurement that competitors cannot assert without comparable evidence. Clinicians recommending a device recommend a validated one, and validation is expensive, slow and specific to each model rather than transferable across a product line.
OMRON HEALTHCARE

Risk: Slowest growing category exposure

Blood pressure monitoring compounds at 5.4%, the slowest segment in this market, and the devices themselves are commoditising as Chinese and Indian manufacturers reach adequate validation at far lower price points. Growth requires moving into rhythm monitoring or interpretation services, where the company competes against consumer electronics reach and reimbursed clinical services it has not previously operated.
IRHYTHM TECHNOLOGIES

Moat: Reimbursed pathway and dataset

The company built its position alongside the reimbursement codes that made long-term monitoring routine, and it holds an analysed recording dataset that improves classification accuracy in ways smaller volumes cannot match. Ordering clinicians value report quality and low false positive burden above hardware attributes, and that is precisely where accumulated data confers advantage that competitors must earn slowly.
IRHYTHM TECHNOLOGIES

Risk: Single schedule dependency

Revenue concentrates in one reimbursement code family whose valuation is periodically reviewed against utilisation, and rapid volume growth is exactly what triggers such reviews. Rates in ambulatory cardiac monitoring have been reduced before. International expansion and direct health system contracting reduce the exposure but have not yet displaced the schedule as the primary revenue determinant.

Players Tracked

Prominent Players

Omron Healthcare
iRhythm Technologies
Apple
AliveCor
Withings

Other Key Players

Philips
Boston Scientific
Baxter
A&D Medical
Beurer
Microlife
Samsung Electronics
Garmin
Everlywell
LetsGetChecked
Roche Diagnostics
Abbott
Nihon Kohden
VitalConnect
Huawei

Recent Developments

JANUARY 2021

Dedicated payment established for long-term ECG monitoring

National payment rates took effect for long-term continuous electrocardiographic monitoring under newly established procedure codes, replacing the unpredictable case-by-case billing that had constrained ordering. Clinicians could plan on reimbursement for extended recording, and the fourteen-day patch became a standard first investigation for suspected arrhythmia across United States practice.
Signal: A billing code rather than any device advance created this market's fastest-growing segment outright and quickly
DECEMBER 2022

Trade commission issues exclusion order in rhythm patent dispute

The United States International Trade Commission issued a limited exclusion order in a patent dispute over wearable cardiac rhythm detection, a regulatory enforcement action rather than a commercial transaction. Subsequent patent office proceedings altered the practical effect, but the dispute signalled how contested consumer rhythm detection had become.
Signal: Consumer rhythm detection is contested intellectual property rather than a settled and freely available technical capability
JUNE 2024

Consumer rhythm feature qualified for clinical trial use

A consumer smartwatch atrial fibrillation feature received United States regulatory qualification as a tool for use in clinical trials, the first consumer wearable capability to reach that status. The qualification does not create a diagnostic claim, but it establishes consumer-generated rhythm data as acceptable evidence in a regulated research setting.
Signal: Consumer data is gaining regulatory standing well ahead of any reimbursement pathway that would fund it

What Actually Costs Money Here

Cost structures diverge completely between the two halves of this market. For blood pressure devices and consumer hardware, sensors, electronics and assembly account for roughly 52% of cost of goods, sourced overwhelmingly from Chinese and Southeast Asian contract manufacturers. For prescribed patch monitoring the dominant cost is analysis: technician review, algorithm operation and report production absorb around 39% of service revenue, and none of it scales freely.
Adhesive and sensor component supply tightened noticeably through 2022 as medical-grade adhesive capacity was allocated across competing wearable applications, and several monitoring participants reported extended lead times in their annual filings. Semiconductor availability for consumer wearable devices had constrained production earlier in the same period. Technician wage inflation for cardiac rhythm analysis has run above general healthcare labour costs, reflecting a genuinely narrow qualified workforce.

Exposure separates by revenue model rather than by geography. Hardware participants carry component and assembly cost with limited pricing power against retail competition, and a component interruption costs them shelf position. Service participants carry labour and algorithm operating cost, where analysis quality decides clinical preference and understaffing shows immediately in report turnaround. Participants running both models carry each exposure without either one hedging the other meaningfully.
at-home-heart-health-testing-market-cost-volatility-analysis-1787305670646

Raise algorithmic first-pass classification rates

Every recording a technician reviews manually costs labour that scales linearly with volume. Improving algorithmic classification so fewer strips require human confirmation converts a variable cost into a fixed development one. Clinical acceptability sets the floor, since a missed arrhythmia is far more costly than a reviewed false positive, and regulators examine that trade closely.

Qualify second adhesive and sensor suppliers

Medical-grade adhesive capacity is allocated across many wearable applications and tightened materially during recent demand peaks. Qualifying alternative suppliers requires biocompatibility testing and regulatory notification, work most participants defer until an interruption forces it. Skin contact performance varies enough between adhesives that substitution is a clinical decision rather than a purely procurement one. Most participants underestimate that.

Build analysis capacity across time zones

Cardiac rhythm analysis technicians are a narrow workforce with wage inflation above healthcare averages, and turnaround expectations keep tightening. Distributing analysis capacity across regions accesses larger labour pools and shortens turnaround by using working hours a single location cannot. Regulatory and privacy requirements govern where recordings may be reviewed and constrain the options considerably.

Portfolio Architecture for Margin Defence

Margin architecture in this market separates by whether revenue comes from a shelf or from a claim. Consumer hardware sold at retail competes against Chinese and Indian manufacturers reaching adequate validation at far lower cost, and gross margins sit in the thirties as a result. Reimbursed monitoring services price against a payment schedule rather than against competitors, and clear well above seventy per cent once analysis capacity is loaded.
The tension is between reach and revenue per patient. Consumer devices touch enormous populations and monetise each one thinly, generating alerts whose clinical resolution somebody else funds. Prescribed monitoring touches a fraction of that population and earns several times more per patient. The participants who own both ends capture roughly four times the revenue per identified patient of those holding only the consumer relationship.

High-value pools concentrate in the interpretation layer rather than in any device. Algorithmic classification, technician confirmation, report quality and alert triage all sit there, and they are what an ordering clinician actually experiences and selects on. Hardware attributes including electrode design and wear comfort matter to the patient wearing the device and almost not at all to the physician deciding which service to use.

Volume / Commodity-Adjacent Tier

Home blood pressure monitors and consumer wearable hardware sold through retail and online channels, where validation is table stakes and Chinese and Indian manufacturers set achievable price points across most markets.
Gross Margin: 28-40%

Premium / Certified Tier

Prescribed ambulatory patch monitoring billed against dedicated reimbursement codes, defended by clinical validation, ordering clinician relationships and the operational capacity to return analysed reports reliably. Everything here depends on a payment schedule nobody in the industry controls.
Gross Margin: 62-74%

Sustainability / Regulatory / Next-Generation Tier

Interpretation services, algorithmic classification and alert triage layers, defended by accumulated analysed recording data and by regulatory clearances that new entrants must earn slowly rather than purchase. Analysed recording volume compounds this advantage over time.
Gross Margin: 74-86%
at-home-heart-health-testing-market-portfolio-architecture-1787305671151

High-value Sub-segments and Strategic Watch-out

Home Cardiac Diagnostic Services and Interpretation

High value at 13.4% growth, carrying the clinical value that ordering physicians actually select on. Report quality and false positive burden decide preference, and accumulated analysed data improves both in ways new entrants cannot shortcut. This is where the alert triage opportunity would eventually land.
Gross Margin: 74-86%

Prescribed Ambulatory ECG Patch Monitoring

The fastest growth at 15.0% and strong margins, but resting entirely on a payment schedule that periodic administrative review can revise downward. Diversification across durations and geographies is the only available hedge. Growth here is entirely a reimbursement story rather than a technology one. Nothing else moves it.
Gross Margin: 62-74%

Home Blood Pressure Monitoring Devices

The volume core at 5.4%, holding the largest installed base and the strongest guideline position of anything here. Margins are the market's thinnest and commoditisation is advancing steadily from Chinese and Indian manufacturers. Guideline position rather than product quality sustains it. Validation is now table stakes rather than differentiation.
Gross Margin: 28-40%

Consumer Wearable Cardiac Rhythm Monitoring

The strategic watch-out at 12.6%. Enormous reach and negligible revenue per user, generating alerts whose clinical resolution nobody funds. Value depends entirely on converting alerts into prescribed episodes somebody will pay for. Reach without revenue is the defining problem here. Conversion into prescribed episodes is the only route out.
Gross Margin: 44-58%

Who Buys and What Recurs

Recurring revenue looks very different across the two halves of this market. Consumer devices are replaced roughly every five years and generate almost nothing between purchases, which makes them a hardware business wearing a health label. Prescribed monitoring generates revenue per episode and repeats whenever a clinician orders again, which happens often in patients under active arrhythmia management. Episode frequency rather than device longevity drives the economics that matter.
Adoption depth varies sharply by clinical setting. Cardiology practices managing arrhythmia order repeatedly and standardise on one monitoring service, which makes those accounts durable and worth pursuing individually. Primary care orders occasionally and switches readily on turnaround or convenience. Consumer purchase sits outside clinical influence entirely, driven by retail placement and by whichever smartwatch a household already owns for reasons unrelated to cardiac health.

Buyer profiles are shifting generationally in ways that reshape demand. Younger patients arrive at appointments holding their own rhythm data and expect clinicians to engage with it, which changes the consultation before any device is prescribed. Older hypertensive patients, historically resistant to home measurement, now adopt it at rates guidelines assumed but did not previously achieve. Both shifts increase clinical workload with no funding attached.
at-home-heart-health-testing-market-end-use-penetration-index-1787305671637

Where Value Actually Sits

These are among the four positions where our research anticipates prominent divergence between winners and laggards over the coming forecast period. Each is grounded in the demand model, the regulatory perimeter, and the announced capacity pipeline.
01 / ALERT TRIAGE OWNERSHIP

Somebody will get paid to answer the notification

Roughly 66% of all consumer rhythm alerts fail clinical confirmation, and each one still generates an appointment and frequently a proper recording that ultimately finds nothing wrong at all. Primary care and cardiology practices between them absorb all of that clinical work today, without any reimbursement pathway anywhere covering it. Health systems interviewed valued an avoided cardiology referral at $180 to $240 each, which is roughly the price a properly structured triage service could eventually command once reimbursement classification is resolved.
02 / PRESCRIBED EPISODE CONVERSION

The alert is worthless; the episode it triggers is not

A consumer device cannot carry a diagnostic claim or be billed as a diagnostic test at all, which permanently caps direct revenue regardless of how many millions of people wear one every day. Its commercial value lies entirely in generating prescribed diagnostic episodes that reimbursement does cover, and participants owning both ends capture roughly four times the revenue per identified patient. Referral pathway design rather than any improvement in sensor accuracy determines whether that conversion actually happens at meaningful scale.
03 / REIMBURSEMENT CONCENTRATION RISK

One schedule carries the whole growth story

Prescribed patch monitoring compounds at 15.0% on a single payment schedule that periodic administrative review can revise at will, and rates in ambulatory cardiac monitoring have already been reduced once within the past decade. Participants concentrated in a single code family carry entirely unhedged exposure to an administrative decision they have no ability to influence directly. Diversification across monitoring durations, international reimbursement pathways and direct health system contracting is the only real defence available before such a review eventually arrives.
04 / INTERPRETATION LAYER COMPETITION

Clinicians select on reports, not on electrodes

Every serious participant in prescribed monitoring records perfectly adequate signal, so the hardware differences that manufacturers emphasise are simply not what an ordering physician ever experiences from the service. Cardiologists interviewed named report clarity and false positive burden as their primary selection criteria, running well ahead of any device specification ever presented to them. Interpretation services compound at 13.4% precisely because that analysis layer, rather than the sensor sitting beneath it, carries almost all of the defensible clinical value here.

Engagement Snapshot From the Field

A live engagement with an industry participant carrying material or product regulatory and market exposure ahead of a defining policy shift, showing how our research translates into a defensible multi-year portfolio strategy.
MARKET MINDS ADVISORY · CLIENT ENGAGEMENT SUMMARY
At-Home Heart Health Testing Producer Strategic Portfolio Review and Transition Roadmap 2026·Investment Scenario on At-Home Heart Health Testing Exposure Evaluation 2025-26
CLIENT PROFILE
A consumer health technology company with annual revenue near $270 million (client-reported, unverified by MMA), selling a wrist-worn device with a cleared rhythm detection feature to several million users. Direct revenue from the cardiac capability was minimal, and leadership wanted to understand whether the feature could be monetised clinically or whether it should remain a differentiator supporting hardware sales alone.
STRATEGIC CHALLENGE
The feature generated a very large volume of alerts, most of which were not confirmed clinically, and the company had no relationship with the physicians absorbing that work. Leadership needed to know whether building a clinical service around alert resolution was viable, what reimbursement pathway existed, and whether health systems would contract for triage at all.
MMA APPROACH
We interviewed 41 cardiologists and primary care physicians on how consumer alerts reach them and what happens next, alongside 16 health system executives on referral cost and appetite for a triage contract. Reimbursement pathways were mapped across five markets. We modelled a triage service build against a referral partnership with existing prescribed monitoring providers.
KEY FINDINGS
  1. Physicians reported that roughly two-thirds of patients presenting with a consumer alert required a subsequent recording that found no clinically significant arrhythmia at all.
  2. Health system executives valued an avoided cardiology referral at $180 to $240 and expressed genuine willingness to contract for triage if outcome data supported the diversion rate.
  3. No existing reimbursement code covered review of consumer-generated data, making direct billing impossible and health system contracting the only near-term commercial route available.
  4. Referral partnership with a prescribed monitoring provider reached revenue roughly nine months earlier than a service build, at materially lower capital commitment and regulatory exposure.
CLIENT PROFILE
A consumer health technology company with annual revenue near $270 million (client-reported, unverified by MMA), selling a wrist-worn device with a cleared rhythm detection feature to several million users. Direct revenue from the cardiac capability was minimal, and leadership wanted to understand whether the feature could be monetised clinically or whether it should remain a differentiator supporting hardware sales alone.
STRATEGIC CHALLENGE
The feature generated a very large volume of alerts, most of which were not confirmed clinically, and the company had no relationship with the physicians absorbing that work. Leadership needed to know whether building a clinical service around alert resolution was viable, what reimbursement pathway existed, and whether health systems would contract for triage at all.
MMA APPROACH
We interviewed 41 cardiologists and primary care physicians on how consumer alerts reach them and what happens next, alongside 16 health system executives on referral cost and appetite for a triage contract. Reimbursement pathways were mapped across five markets. We modelled a triage service build against a referral partnership with existing prescribed monitoring providers.
KEY FINDINGS
  1. Physicians reported that roughly two-thirds of patients presenting with a consumer alert required a subsequent recording that found no clinically significant arrhythmia at all.
  2. Health system executives valued an avoided cardiology referral at $180 to $240 and expressed genuine willingness to contract for triage if outcome data supported the diversion rate.
  3. No existing reimbursement code covered review of consumer-generated data, making direct billing impossible and health system contracting the only near-term commercial route available.
  4. Referral partnership with a prescribed monitoring provider reached revenue roughly nine months earlier than a service build, at materially lower capital commitment and regulatory exposure.
RECOMMENDED STRATEGY
Phase 1: Phase one: partner with an established prescribed monitoring provider to route confirmed alerts into reimbursed diagnostic episodes rather than building capability internally. Phase 2: Phase two: run a health system triage pilot at three sites, generating the diversion and outcome data that any contracting conversation will ultimately require. Phase 3: Phase three: pursue reimbursement classification for consumer data review, using pilot evidence rather than clinical argument as the submission basis.
OUTCOME
The referral partnership went live within seven months and produced measurable revenue per converted alert for the first time. Two health system triage pilots began and reported referral diversion above the modelled case (client-reported, unverified by MMA). Reimbursement classification work is continuing, and leadership now treats the alert volume as an asset rather than a support burden.

Frequently Asked Questions

Foundational context covering the market sizes, CAGR, scope, country, region and competition that inform every finding below. This section is provided to cover basics and most often pre-purchase conversations, answered from the MMA Primary Research Dataset.

What is the current size of the At-Home Heart Health Testing Market?

The global market is valued at $9.4 billion in 2025, rising to $10.34 billion in 2026. East Asia holds the largest share at 32%, reflecting home blood pressure measurement adopted into guidelines decades ahead of Western markets.

How large will the At-Home Heart Health Testing Market be by 2036?

MMA forecasts $26.82 billion by 2036, an increase of $16.48 billion over the 2026 base and an expansion multiple of 2.59x. Prescribed monitoring and interpretation services carry most of that increase.

What is the CAGR for the At-Home Heart Health Testing Market 2026 to 2036?

The base case compound annual growth rate is 10.0%, with a bull case at 11.3% and a bear case at 8.8%. Historical growth from 2020 to 2025 ran near 8.8%, driven more by reimbursement than by technology.

Which segment is growing fastest?

Prescribed ambulatory ECG patch monitoring compounds at 15.0%, a full 1.50x the market rate. Dedicated reimbursement codes established in 2021 made fourteen-day recording a standard first investigation rather than an exception.

Who are the major companies in the At-Home Heart Health Testing Market?

Omron Healthcare, iRhythm Technologies, Apple, AliveCor and Withings together hold 44% of revenue from at-home cardiac testing products and services. The five compete in largely separate parts of the market.

Which country is growing fastest?

India compounds at 13.4%, faster than any other country covered, driven by a large undiagnosed hypertensive population and domestically manufactured monitors reaching mass-market price points. Private diagnostic chains are adding home collection rapidly.

Report Segmentation Architecture

The full report scope spans multiple orthogonal segmentation dimensions, with cross-tabulated demand data provided for each dimension pair. Coverage extends further to regional breakdowns, trend trajectories, and the competitive detail needed to support segment-level decision-making.

By Monitoring Modality

  • Home Blood Pressure Monitoring Devices
  • Consumer Wearable Cardiac Rhythm Monitoring
  • Prescribed Ambulatory ECG Patch Monitoring
  • At-Home Cardiac Biomarker Test Kits
  • Home Cardiac Diagnostic Services and Interpretation

By End-Use Industry

  • Cardiology Specialist Practices
  • Primary Care and General Practice
  • Integrated Health Systems
  • Private Diagnostic Chains
  • Employer and Population Health Programmes
  • Direct Consumer Households

By Commercial Dimension

  • Clinical Reimbursement Billing
  • Retail and Pharmacy Distribution
  • Online Direct-to-Consumer Sales
  • Health System Service Contracts
  • Employer and Insurer Programmes
  • Private Self-Pay Purchase

By Region

  • East Asia
  • North America
  • Western Europe
  • South Asia and Pacific
  • Latin America
  • Middle East and Africa
  • Eastern Europe

Scope, Methodology, and Coverage

Every figure in this report is reproducible from documented input assumptions. The scope below maps the historical period, the forecast horizon, the segmentation dimensions, and the countries covered, alongside the underlying primary and qualitative methodology.
Historical Period
2020 to 2025
Forecast Period
2026 to 2036
Base Year
2025 (USD billions; MMA Primary Research Dataset, August 2026)
Market Definition
This market comprises testing and monitoring of cardiovascular status performed in the patient's home, measured at manufacturer or service revenue across clinical reimbursement billing, retail and pharmacy distribution, online direct-to-consumer sales, health system service contracts, employer and insurer programmes, and private self-pay purchase. Coverage spans home blood pressure monitoring devices including upper arm and wrist configurations meeting recognised validation protocols, consumer wearable cardiac rhythm monitoring delivered through smartwatches and handheld recorders carrying regulatory clearance, prescribed ambulatory electrocardiographic patch monitoring worn for extended periods and returned for analysis, at-home cardiac biomarker test kits covering lipid panels, natriuretic peptides and inflammatory markers collected by the patient, and home cardiac diagnostic services including algorithmic classification, technician confirmation, report generation and alert triage. Implantable cardiac device telemetry and remote programming, in-clinic diagnostic equipment including Holter recorders fitted and read in facilities, hospital telemetry and inpatient monitoring, cardiac imaging of every modality, general fitness and activity tracking carrying no cardiac diagnostic claim, and therapeutic devices including home defibrillators fall outside scope.
Quantitative Units
USD millions (current prices); devices shipped by modality; monitoring episodes billed; household penetration among diagnosed patients; alert volume and confirmation rate; reimbursed share of volume; device replacement interval
Segmentation Dimensions
By Monitoring Modality; By End-Use Industry; By Commercial Dimension; By Region
Regions Covered
East Asia, North America, Western Europe, South Asia and Pacific, Latin America, Middle East and Africa, Eastern Europe
Countries Covered
Japan, China, South Korea, Taiwan, United States, Canada, Germany, United Kingdom, France, Italy, Spain, Netherlands, Sweden, Switzerland, Belgium, India, Australia, Singapore, Thailand, Malaysia, Indonesia, Brazil, Mexico, Argentina, Chile, Colombia, Saudi Arabia, United Arab Emirates, South Africa, Egypt, Poland, Czechia, Hungary, Romania, Turkey, and additional markets relevant to cardiovascular diagnostics analysis
Key Companies Profiled
Omron Healthcare, iRhythm Technologies, Apple, AliveCor, Withings, Philips, Boston Scientific, Baxter, A&D Medical, Beurer, Microlife, Samsung Electronics, Garmin, Everlywell, LetsGetChecked, Roche Diagnostics, Abbott, Nihon Kohden, VitalConnect, Huawei
Quantitative Methodology
Primary survey, n=3,800 respondents, Q4 2025, six countries; demand-side model with trade association cross-validation
Qualitative Methodology
47 expert interviews, Q4 2025; applied to validate demand model assumptions, identify emerging dynamics, and assess competitive positioning
Report Format
PDF and XLSX data workbook (Word format preview document)
Publisher
Market Minds Advisory
Report Code
MMA-2026-MED-458
Published
August 2026
Contact
sales@marketmindsadvisory.com | www.marketmindsadvisory.com

Purchase the full At-Home Heart Health Testing Market Report (2026 to 2036).

The full MMA report separates the consumer market from the reimbursed one and quantifies the clinical work that sits unfunded between them. It sizes five monitoring modalities and seven regions to 2036, modelling devices shipped, monitoring episodes billed, household penetration, alert volume and confirmation, reimbursed share and replacement intervals separately. Competitive assessment covers twenty participants on one consistent revenue basis. Cost exposure is traced through components, adhesives and analysis labour. Four commercial levers and a strategic verdict close the report, grounded in 47 expert interviews and a 3,800-respondent survey.
Five monitoring modalities sized separately through 2036
Reimbursement pathways mapped across every covered market
Consumer alert volume quantified against clinical confirmation rates
Twenty participants assessed on one consistent revenue basis
Alert triage economics modelled against avoided referral cost
Anonymised commercialisation engagement with tested partnership recommendations

Built For The People Who Decide

From boardroom strategy to bench-side execution, this report is read cover-to-cover by leaders shaping the next decade of their industry, turning demand scenarios, market dynamics and valuation benchmarks into decisions.
CXOs/ Presidents/ VPs/ Managers
M&A and Corporate Development
Strategy Teams and R&D Heads
Procurement and Product Directors
Regulatory and Compliance Leaders
Investor Relations and Equity Analysts