Market Minds Advisory
Asia-Pacific Waterproofing Chemicals Market

Asia-Pacific Waterproofing Chemicals Market: Infrastructure Demand Outpaces Certified Application

China and India pour record volumes of infrastructure concrete every year, but skilled waterproofing installers who can apply premium polyurethane membranes correctly remain scarce enough that quality failures plague a meaningful share of major projects.

Lead Analyst

Bilal Shaikh

Published

September 2026

Make Smarter Decisions with Customized Research Insights

Request a free sample report and evaluate market opportunities, growth trends, and competitive dynamics relevant to your business needs.

2025 MARKET VALUE$4.8BMarket Size 2025
2036 FORECAST VALUE$10.2BBase Case , 2026 to 2036
CAGR 2026 TO 20367.1 %Bull 8.5% / Bear 5.8%
INCREMENTAL OPPORTUNITY$5.1BNet 10- year value creation
EXPANSION MULTIPLE1.99x2036 value over 2026 base
Strategic Levers
M&A Pipeline
Regional Outlook
Country Rankings
Competitive Intelligence
Segmental Deep-dive
Call-Us : 91 93563 13602

Executive Snapshot and Market Trajectory

Asia-Pacific's waterproofing chemicals market is being reshaped by an infrastructure build-out large enough that certified applicator capacity, not raw chemical supply, has become the binding constraint on how quickly projects can specify premium membrane systems. Manufacturers unable to guarantee installation quality increasingly lose specification to rivals who can.
Polyurethane systems grow fastest at 11.2%, roughly 1.58 times the overall rate, as tunnel, metro, and high-rise projects increasingly demand continuous membrane performance that bituminous alternatives cannot reliably match. East Asia holds the largest regional share at 32%, anchored by China's infrastructure investment, while South Asia and Pacific follows as India's Smart Cities Mission converts municipal spending directly into certified demand. That weight reflects genuine construction volume rather than default geographic assumption.
Competitive intensity remains moderate, with five manufacturers controlling under two-fifths of revenue, led by Sika and BASF through application engineering support networks regional formulators struggle to replicate. Regulatory tightening around waterproofing codes across major Asian economies is pushing buyers toward certified systems, forcing manufacturers to compete increasingly on technical service depth rather than price. Manufacturers lacking documented applicator networks increasingly cede specification to better-organized regional rivals over time.
Market Definition
The waterproofing chemicals market covers formulated products applied to building envelopes, foundations, roofing, and infrastructure to prevent water ingress, including bituminous, polyurethane, cementitious, elastomeric, and acrylic-based systems. It excludes physical waterproofing membranes sold without chemical formulation and structural sealants used primarily for joint movement rather than water exclusion.
Base Year Value
$4.8B in 2025 (MMA Primary Research Dataset, August 2026)
Forecast Period
2026 to 2036, eleven discrete annual values
CAGR
7.1% base case. Bull 8.5%. Bear 5.8%.
Fastest Growth Segment
Polyurethane Waterproofing Chemicals: 11.2% CAGR
Fastest Growth Country
China: 12.8% CAGR
Fastest Growth Region
South Asia and Pacific: 9.4% CAGR
Largest Region
East Asia: 32% of 2025 global value
Market Leaders
Sika, BASF, Saint-Gobain, Soprema, Fosroc. Source: MMA Analysis based on company annual reports.
Primary Survey
n=3,800 procurement and R&D decision-makers, Q4 2025, six countries
Methodology
Demand-side build-up, cross-validated against public data, 47 expert interviews

Asia-Pacific Waterproofing Chemicals Market Forecast Scenarios

asia-pacific-waterproofing-chemicals-market-size-forecast-scenario-1787303022918
Between 2020 and 2025 the market grew at roughly 6.3% annually, accelerating as China's infrastructure investment and India's urban water infrastructure programs converted municipal budgets directly into certified waterproofing chemical specification across major metropolitan construction projects. Rising building code enforcement added further momentum, as developers replaced uncertified legacy coatings with documented waterproofing systems meeting stricter requirements.
The base case carries the market to 7.1% annual growth through three mechanisms. First, tunnel and metro infrastructure keeps expanding across China, India, and Southeast Asia, requiring systems rated for continuous groundwater exposure. Second, tightening codes push developers toward certified waterproofing over cheaper alternatives that previously dominated budget construction. Third, green building certification increasingly rewards documented performance, converting sustainability compliance into a direct specification driver across new commercial developments nationwide.
The bull case, 8.5%, assumes accelerating Chinese and Indian infrastructure spending pulls forward premium system adoption faster than currently modeled. The bear case, 5.8%, assumes construction slowdowns and raw material cost inflation push budget-conscious developers back toward legacy bituminous systems instead of premium polyurethane and elastomeric formats across most project categories. Currency volatility across emerging Asian markets adds a further layer of uncertainty to both scenarios.

Where Infrastructure Spending Meets Certified Chemistry

Three forces converge on this market simultaneously. Tunnel and metro infrastructure keeps expanding across China, India, and Southeast Asia, requiring systems rated for continuous groundwater exposure. Tightening building codes push developers toward certified waterproofing. And green building certification programs increasingly reward documented performance across new commercial developments. Underground transit expansion across multiple Asian megacities keeps adding to this pipeline every yea
MARKET CONCENTRATIONCR5: 38%Top five manufacturers control under two-fifths of revenue
AVERAGE SYSTEM PRICEUSD 4 to 45 per square meterPrices vary sharply by chemistry and application thickness
TOP COUNTRY BY REVENUEChina: 24% of salesSustained regional infrastructure investment concentrates the bulk of spending here
APPLICATOR CERTIFICATION RATE46%Share of installations completed by certified applicators regionally
FEEDSTOCK COST SHARE48% of COGSBitumen, isocyanate, and polymer feedstock dominate production cost
SYSTEM SERVICE LIFE10 to 25 yearsExposure severity and underlying chemistry jointly determine eventual replacement timing
Commercially, this market behaves like a specialty formulation business layered onto infrastructure procurement cycles. Manufacturers compete on application engineering support and certified installer networks as much as on price, since large infrastructure buyers increasingly demand documented long-term performance data before specifying a system into a major tunnel or high-rise project. That technical service depth increasingly separates leading manufacturers from regional commodity formulators. Buyers increasingly treat certification history as a prerequisite before shortlisting a manufacturer.
Over the next decade expect continued expansion beyond building envelope applications into transportation and water infrastructure formats. China and India's sustained infrastructure investment will keep anchoring global demand growth. And certified applicator network depth, more than raw chemistry performance alone, will increasingly determine which manufacturers buyers actually specify into major regional infrastructure programs. Certification depth increasingly separates durable specification relationships from one-time commodity chemical sales.
"A waterproofing failure never announces itself at installation. It shows up years later, underground, where nobody wants to go looking for it."
Director, Construction Chemicals and Building Materials Practice · MMA Chemicals

Market Trends

Tunnel And Metro Projects Demand Continuous Membranes

Metro and tunnel infrastructure projects across China, India, and Southeast Asia increasingly specify polyurethane and elastomeric waterproofing systems capable of continuous groundwater exposure resistance, a requirement that has converted membrane specification from a general building consideration into a core underground infrastructure engineering decision. This shift addresses a genuine risk, since groundwater infiltration in tunnel structures can compromise structural integrity and transit safety over time, and standard bituminous coatings cannot always deliver the continuous coverage such projects need. Several manufacturers have expanded spray-applied polyurethane product lines engineered for underground exposure. Application specification documents increasingly require proof of underground exposure testing.
Market Impact: Anchors 24% of regional production
Green Building Certification Rewards Documented Performance

Developers pursuing green building certification across major Asian markets increasingly specify waterproofing systems with documented environmental and durability performance data, converting certification compliance into a direct chemical specification requirement rather than a general sustainability preference. This shift addresses a genuine documentation gap, since certification bodies require verified long-term performance data that many legacy bituminous systems were never tested to provide at the depth now required. Several manufacturers have expanded certified low-emission product lines with published durability data, positioning documented performance as a durable differentiator across the region's growing green building pipeline.
Market Impact: Adds 14% share via municipal progra

Market Opportunities and Growth Drivers

China's Sustained Infrastructure Investment Keeps Anchoring Demand

China's continued investment in metro systems, high-speed rail, and urban water infrastructure keeps converting public infrastructure budgets directly into certified waterproofing chemical demand, independent of the broader residential construction slowdown affecting other segments of the country's building materials market. This creates durable demand that spans nearly every major Chinese province simultaneously, since infrastructure project pipelines extend years beyond any single budget cycle. Domestic Chinese manufacturers increasingly supply polyurethane and elastomeric systems that previously relied on imported chemistry, converting what was once an imported specialty product into a locally manufactured infrastructure standard.
Market Impact: Leaves 54% of installations uncerti

India's Smart Cities Mission Expands Municipal Demand

India's Smart Cities Mission and related municipal water infrastructure programs keep converting public budgets into certified waterproofing chemical demand across water treatment, storage, and distribution infrastructure that previously relied on uncertified legacy coatings. Domestic Indian manufacturers, led by Pidilite and CICO Technologies, increasingly supply cementitious and acrylic-based systems tailored to municipal budget constraints and monsoon exposure conditions specific to Indian infrastructure. This program-driven demand gives India outsized influence over regional volume growth, since municipal infrastructure decisions convert directly into guaranteed manufacturer orders at meaningful scale. Program officials increasingly specify certified chemistry directly in municipal procurement tender documents.
Market Impact: Adds cost swings exceeding 22% annu

Market Restraints and Challenges

Certified Applicator Shortage Limits System Adoption

Premium polyurethane and elastomeric waterproofing systems require correctly trained applicators to achieve their rated performance, and the region's certified applicator base has not scaled fast enough to match accelerating infrastructure and commercial construction demand, a limitation that leaves manufacturers unable to expand premium system adoption as quickly as chemistry supply allows. The root cause is limited training capacity: certification programs require months of hands-on instruction that few contractors can access at scale. The impact falls hardest on secondary cities, where certified applicators remain scarce relative to primary metropolitan markets. Some manufacturers are responding by expanding regional training academies.
Market Impact: Cuts infiltration incidents by roug

Raw Material Cost Volatility Pressures Margins

Bitumen and isocyanate feedstock prices swing considerably with broader petrochemical commodity cycles, since both feedstocks compete for processing capacity shared with fuel and other specialty chemical manufacturing industries, a volatility that manufacturers cannot always pass through to price-sensitive infrastructure buyers on fixed-budget public contracts. The root cause is genuinely industrial: waterproofing feedstock pricing tracks crude oil and polymer markets that manufacturers do not control directly. The impact falls hardest on smaller regional formulators lacking long-term supply contracts. Some manufacturers are responding by qualifying alternative bio-based polymer feedstock blends. Several manufacturers now hedge feedstock exposure through longer-dated forward purchasing contracts.
Market Impact: Adds certified demand across 41%
3 additional market trends, 3 additional growth drivers, and 4 additional restraints and challenges are covered in the full report. Contact sales@marketmindsadvisory.com to access the complete intelligence.

Segment CAGR and Growth Architecture

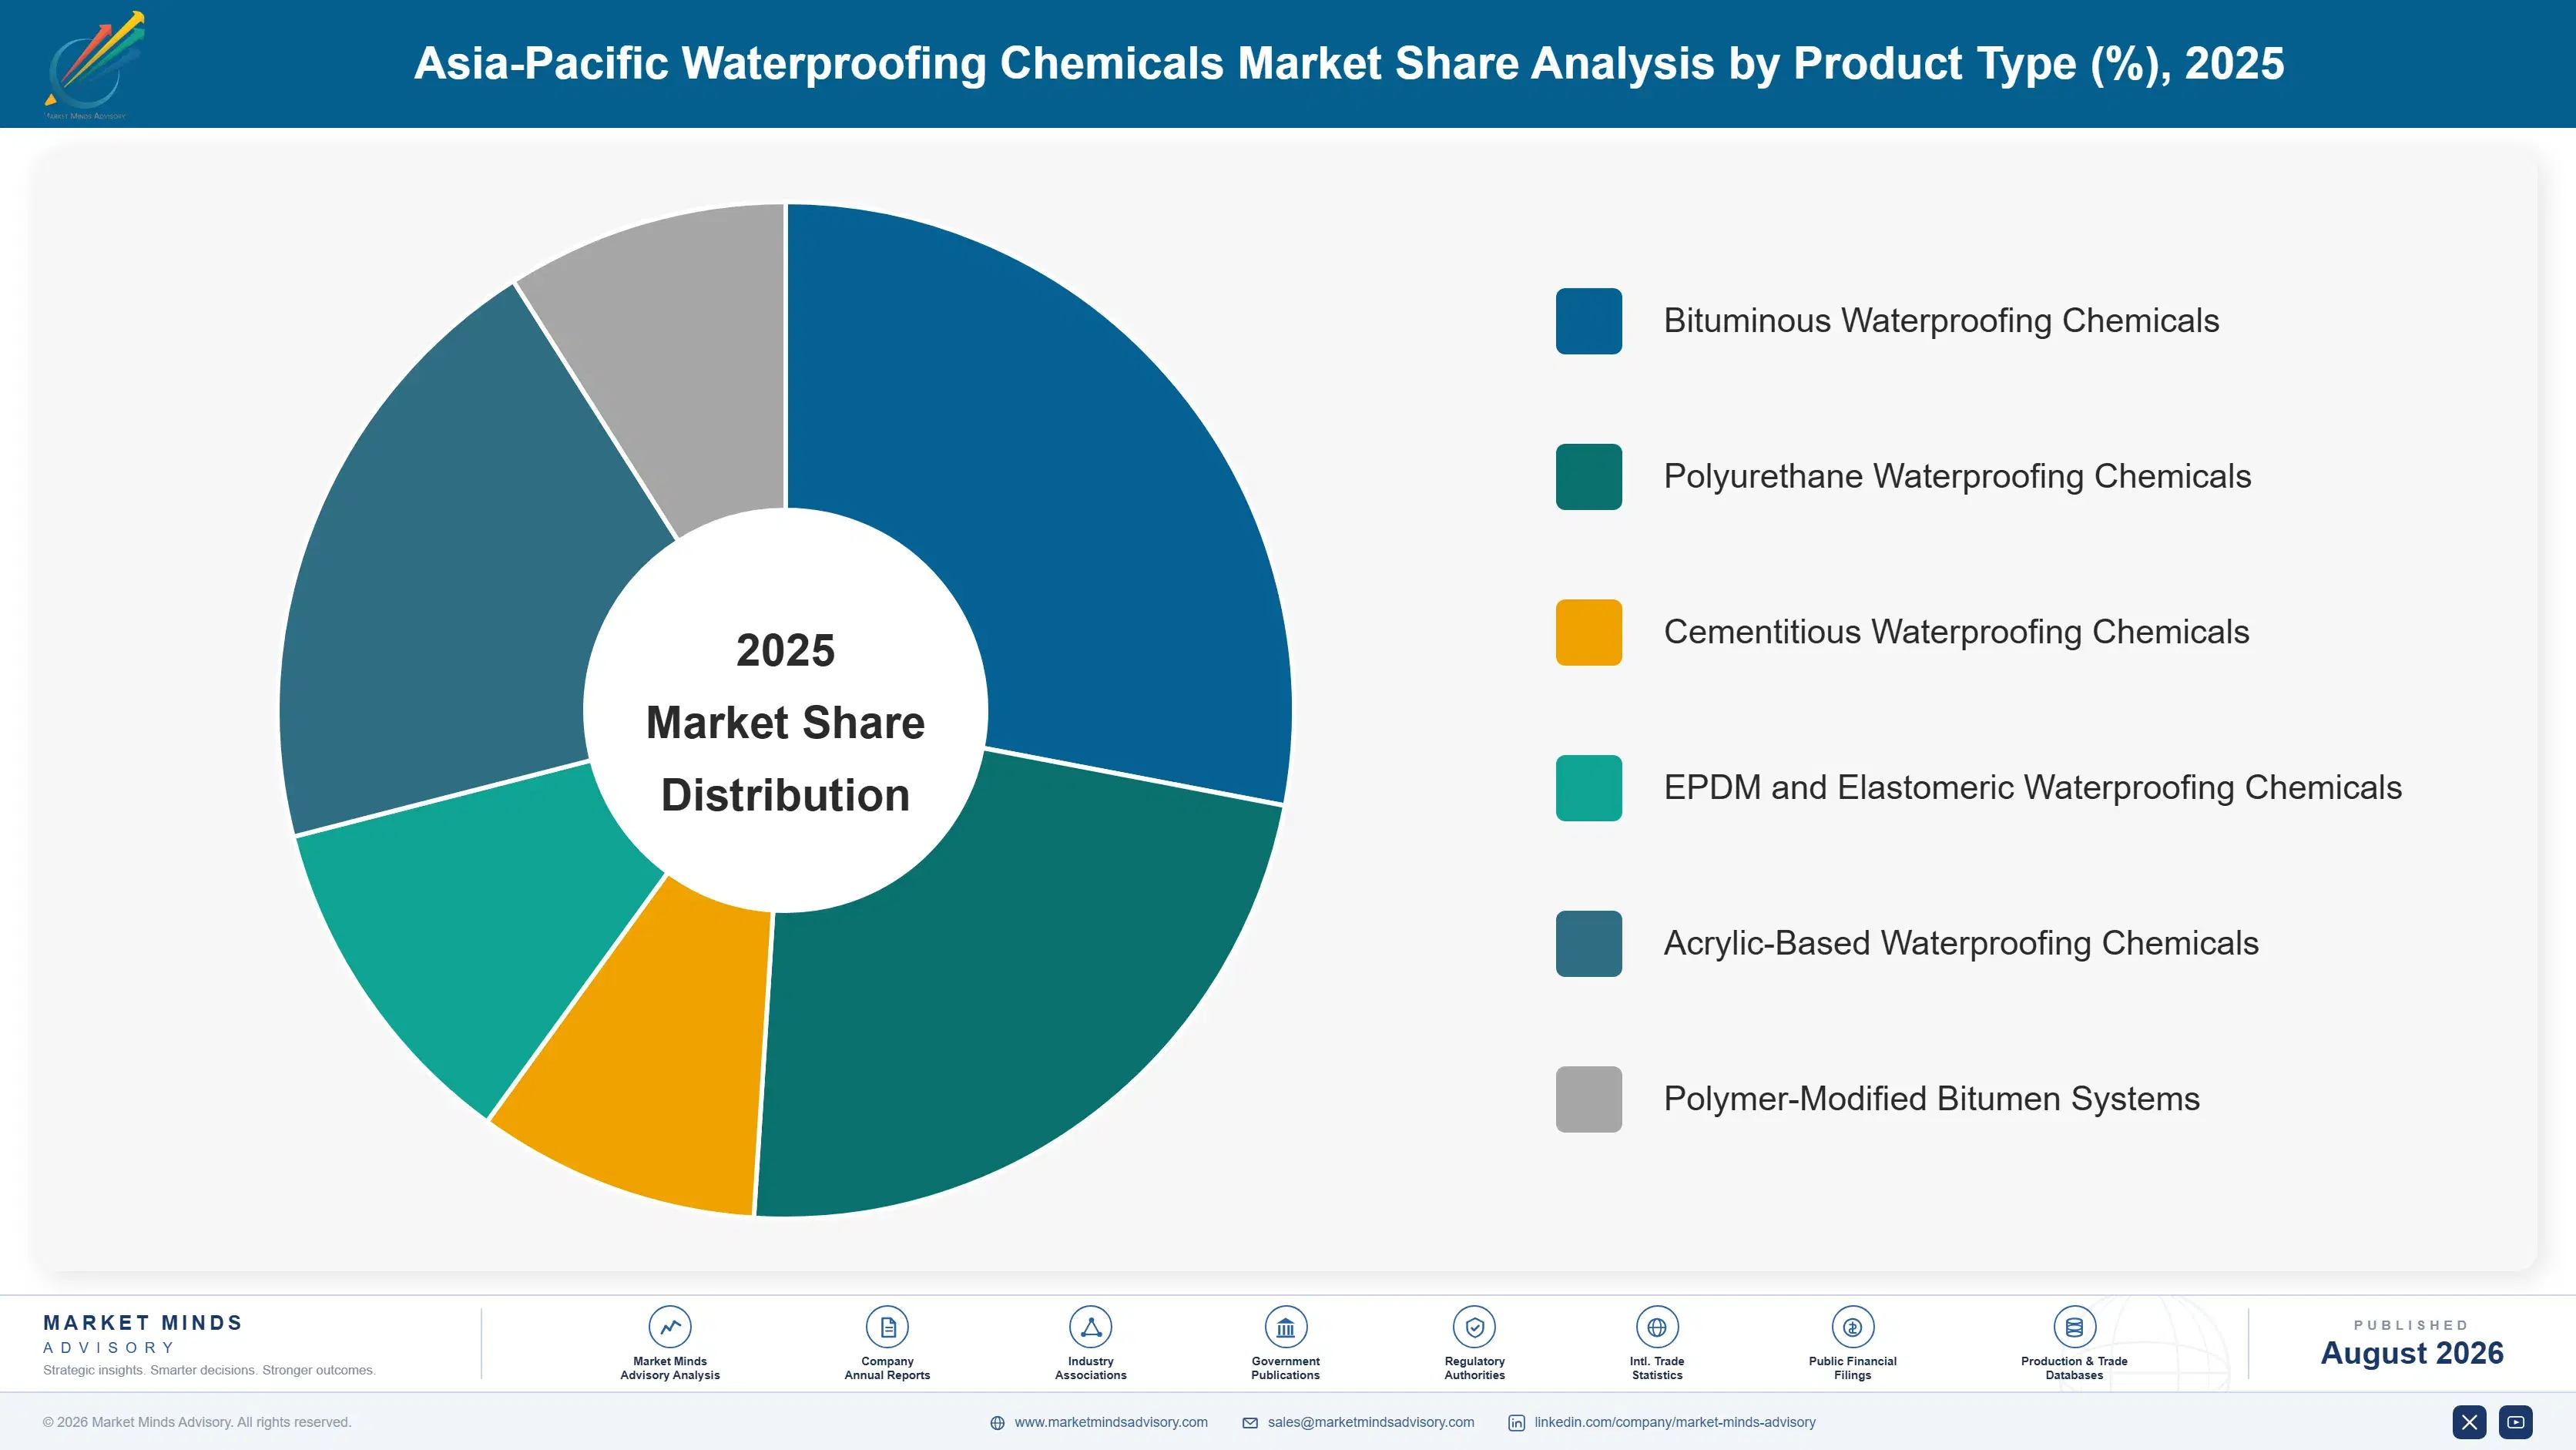
Segmentation follows product chemistry, the single classification logic that determines application method, durability profile, and certification pathway. Bituminous, polyurethane, cementitious, elastomeric, acrylic-based, and polymer-modified bitumen formats each carry distinct performance properties, so commercial position tracks chemistry type rather than end-use application or installation method across every manufacturer profiled. Buyers evaluate manufacturers through this chemistry lens ra
asia-pacific-waterproofing-chemicals-market-market-share-analysis-1787303023478

Polyurethane Waterproofing Chemicals

Polyurethane systems grow fastest at 11.2%, roughly 1.58 times the overall market rate, as tunnel, metro, and high-rise projects increasingly demand continuous membrane coverage that bituminous and cementitious alternatives cannot reliably match at comparable application thickness. This chemistry's elongation and crack-bridging properties make it the preferred choice for structures experiencing thermal movement or settlement over their service life. Sika and BASF lead this segment's infrastructure-grade formulation development, while Soprema and Fosroc compete on spray-applied application technology and regional service depth. Growing tunnel and underground infrastructure investment continues expanding this segment's addressable base considerably beyond its original roofing-only origins. Certified applicator training partnerships continue strengthening this segment's installation reliability across major projects.
CAGR 11.2%

Acrylic-Based Waterproofing Chemicals

Acrylic-based systems grow second-fastest at 9.5%, about 1.34 times the overall rate, as budget-conscious residential and municipal projects increasingly demand water-based formulations that avoid the solvent emissions and higher cost associated with polyurethane alternatives. This chemistry's ease of application and lower training requirement make it the preferred choice for large-area roofing and municipal water storage projects with constrained budgets. Pidilite and Asian Paints lead this segment's residential formulation development, while Berger Paints and Nippon Paint compete on color and coating durability improvements. Growing residential renovation activity across secondary Indian and Southeast Asian cities continues expanding this segment's addressable base well beyond its original coating-only origins. Expanding municipal water storage rehabilitation programs continue reinforcing this segment's steady volume growth.
CAGR 9.5%
Full segment breakdown across 6 segments available in the complete report.

Regional Architecture and Country Demand Map

East Asia leads at 32% of the total, anchored by China's sustained metro and rail infrastructure investment. South Asia and Pacific follows on India's municipal water infrastructure programs. North America and Western Europe hold shares tied to renovation demand, while the remaining three regions complete global distribution.

North America

The United States and Canada anchor North America's 22% share through steady commercial roofing renovation and infrastructure rehabilitation spending rather than the new-build infrastructure surge driving Asian demand, a distinction worth naming since this report's Asia-Pacific title reflects where the fastest chemical volume growth genuinely concentrates. The United States hosts the region's deepest applicator certification infrastructure, with Sika and BASF's American operations serving both commercial and infrastructure channels. Canada's comparable renovation base adds incremental demand beyond American volume. Growth of 6.4% reflects steady renovation-driven demand more than any single regulatory deadline alone across the region. Certification density across both commercial and infrastructure procurement channels keeps this region's premium product mix comparatively wide.
Share: 22% | CAGR: 6.4% (2026 to 2036)

Western Europe

Germany, France, and the United Kingdom anchor Western Europe's 18% share through building envelope renovation programs tied to aging infrastructure stock, a maturity that keeps this region below Asia-Pacific's infrastructure-driven volume even as its certification standards remain among the world's strictest. Sika and Soprema's core European operations serve both domestic renovation and export markets across the continent. Southern European markets contribute meaningful roofing and waterproofing renovation demand beyond the core German and French base. Growth of 5.6%, the softest pace among the seven regions tracked, reflects this underlying market maturity rather than weakening underlying renovation demand overall. Regulatory harmonization across member states keeps certification costs comparatively predictable for manufacturers selling across multiple national markets.
Share: 18% | CAGR: 5.6% (2026 to 2036)
Regional intelligence for 5 additional markets available in the complete report: East Asia, South Asia and Pacific, Latin America, Middle East and Africa, Eastern Europe. Contact sales@marketmindsadvisory.com.
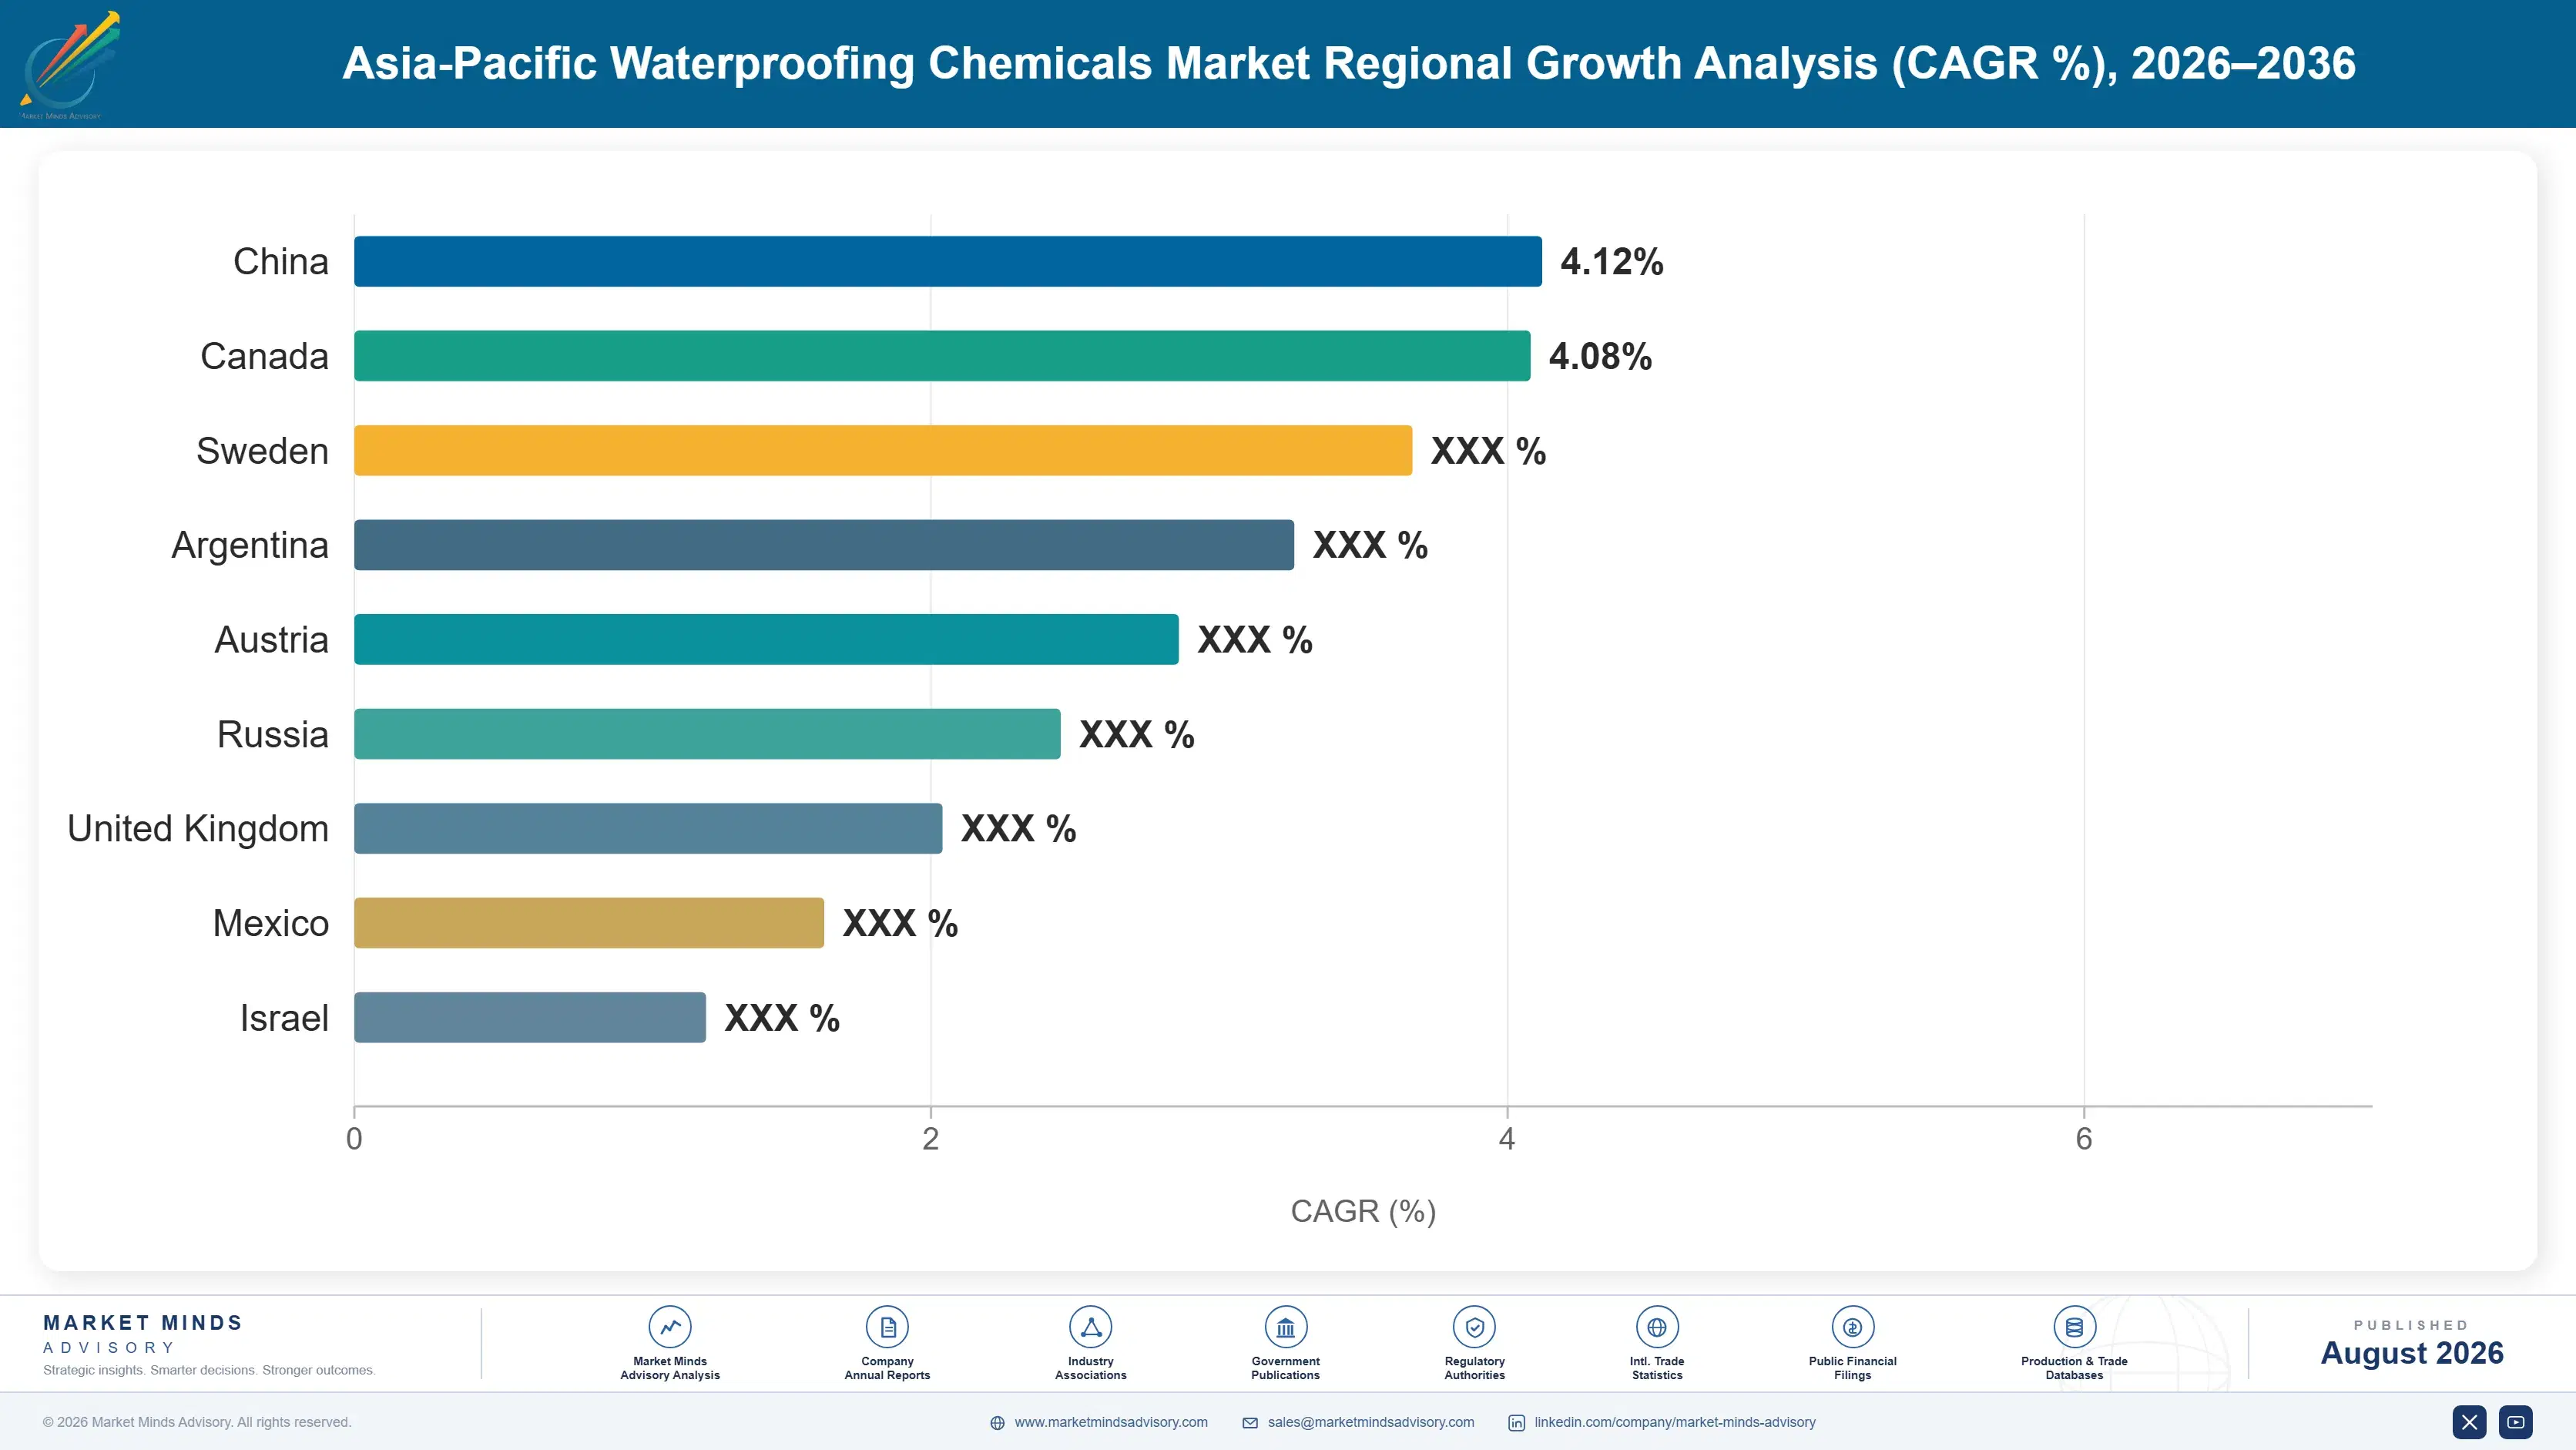
asia-pacific-waterproofing-chemicals-market-country-cagr-analysis-1787303024017

How Manufacturers Can Defend Formulation Margin

Margin increasingly depends on applicator certification networks and technical service depth rather than raw chemical price alone, as infrastructure buyers demand documented performance alongside dependable installation quality. The four levers below target certification, service, and financing revenue that waterproofing chemical manufacturers have left underexploited, converting a commodity chemical sale into a longer, more defensible infrastructure relationship.

Guarantee Certified Applicator Training Commitments Upfront

Manufacturers increasingly build dedicated regional applicator training academies, capturing specification loyalty that manufacturers without training infrastructure leave on the table since infrastructure buyers require documented installer certification before awarding major tunnel and metro contracts. Sika and BASF both report that certified applicator density directly determines which infrastructure contracts they can even bid on, independent of unit pricing. Building this capability requires investment exceeding $3 million per regional academy, but manufacturers who commit early lock in specification relationships before competitors can match the training depth. This capability separates manufacturers who can bid on multi-region programs from those confined to single markets.
Market Impact: Wins infrastructure contracts each

Offer Extended System Performance Warranty Coverage

Manufacturers increasingly offer extended system performance warranties that guarantee documented waterproofing performance beyond the standard product warranty period, capturing premium pricing that manufacturers without performance guarantees leave on the table since risk-averse infrastructure buyers pay meaningfully more for documented performance assurance. Buyers pay 12% to 20% more for systems backed by extended warranties than for equivalent products without guaranteed performance, since warranty-backed protection directly reduces the buyer's liability exposure on major public infrastructure projects. This reputation compounds into durable specification advantage over time. Buyers increasingly treat warranty depth as a proxy for underlying formulation quality when comparing competing bids.
Market Impact: Commands 12% to 20% higher unit pri

Bundle Building Code Compliance Documentation Services

Manufacturers increasingly bundle building code compliance and certification documentation support with chemical sales, capturing service revenue that manufacturers without support services leave on the table since smaller municipal buyers often lack in-house regulatory expertise for green building and infrastructure certification pathways. This service model captures 10% to 16% incremental revenue beyond commodity chemical pricing, since buyers increasingly value manufacturers who can accelerate their own certification timeline rather than suppliers who simply ship chemicals without ongoing support. Building this capability requires investment in regulatory affairs staff, and the margin differential justifies it.
Market Impact: Generates 10% to 16% recurring annu

Expand Regional Manufacturing Near Infrastructure Hubs

Import tariffs and delivery lead time on chemicals manufactured outside major Asian infrastructure hubs have risen enough that regional manufacturing capacity, closer to metro and tunnel construction sites, increasingly beats import economics even at somewhat higher local production cost. Manufacturers building manufacturing capacity in China, India, and Vietnam, rather than relying entirely on centralized production, cut landed cost by roughly 16% while also shortening lead times that matter increasingly to fast-track infrastructure construction schedules. This shift requires upfront capital investment, but manufacturers who move early capture share from import-dependent competitors.
Market Impact: Cuts landed chemical costs by rough

Who Controls the Margin Pool

Five manufacturers control under two-fifths of global revenue, a fragmented picture for a specialty chemicals category served by numerous regional formulators alongside global brands. Sika and BASF lead on scale, though Sika leads infrastructure-grade polyurethane systems while BASF leads broader construction chemicals breadth. Revenue, the basis used throughout this assessment, favors manufacturers with the broadest certified applicator network and technical service capability.
Competitive activity runs across three dimensions. Manufacturers race to expand certified applicator training networks before rivals lock in long-term specification agreements with major infrastructure contractors. Technical service and warranty offerings have become a differentiator, as risk-averse buyers increasingly prefer manufacturers who can document guaranteed installation quality. Regional Indian and Chinese manufacturers are winning standard-range specification deals that once belonged primarily to established Western suppliers.

Pressure is building from two directions that could reshuffle rankings within the decade. Chinese and Indian regional manufacturers, still largely absent from the key player list, are scaling formulation and applicator training capacity to serve domestic infrastructure growth closer to demand. Specialized tunnel and underground waterproofing makers, outside the established building envelope franchise, are proving that infrastructure-grade chemistry can command pricing conventional manufacturers struggle to match, forcing established players toward deeper technical service partnerships.
asia-pacific-waterproofing-chemicals-market-company-positioning-matrix-1787303024549

Competitive Moat and Risk Dimensions

SIKA AG

Moat: Broadest Infrastructure Application Depth

Sika holds one of the broadest infrastructure-grade polyurethane and elastomeric application networks of any manufacturer, spanning nearly every major tunnel and metro market built on decades of underground waterproofing engineering data. That breadth lets it bid on multi-region infrastructure contracts that narrower regional specialists cannot match on documented reliability depth alone.
SIKA AG

Risk: Premium Pricing Limits Budget Reach

Sika's premium engineering-driven positioning leaves it less price-competitive in budget-conscious municipal applications where Indian and Chinese manufacturers increasingly capture volume that Sika's cost structure cannot profitably match without meaningfully compromising the brand's premium performance-driven positioning elsewhere. That gap could widen as regional manufacturers keep scaling technical capability.
BASF SE

Moat: Broad Construction Chemicals Portfolio

BASF holds a particularly broad construction chemicals portfolio spanning waterproofing, admixtures, and repair systems, letting it bundle waterproofing specification with adjacent product categories that narrower waterproofing-only competitors cannot offer. That portfolio breadth strengthens relationships with large contractors managing multiple chemical categories simultaneously. That breadth also cushions revenue against slowdowns in any single construction chemicals category or region.
BASF SE

Risk: Waterproofing A Smaller Focus Area

BASF's waterproofing business competes for internal investment against larger construction chemicals categories within the company, leaving it potentially less agile than waterproofing-focused specialists in responding to fast-moving regional infrastructure opportunities. This internal competition for resources could narrow its addressable focus over time. Competitors focused solely on waterproofing can react to shifting demand faster than a diversified portfolio allows.

Players Tracked

Prominent Players

Sika AG
BASF SE
Saint-Gobain
Soprema Group
Fosroc International Limited

Other Key Players

RPM International Inc.
Sherwin-Williams Company
Mapei S.p.A.
Kemper System America, Inc.
Pidilite Industries Limited
Asian Paints Limited
Nippon Paint Holdings Co., Ltd.
Wacker Chemie AG
Dow Inc.
CICO Technologies Limited
Chembond Chemicals Limited
Berger Paints India Limited
Kansai Paint Co., Ltd.
Sto SE & Co. KGaA
Bostik SA

Recent Developments

FEBRUARY 2025

Sika Expands Polyurethane Production Capacity In China

Sika expanded polyurethane waterproofing production capacity at an existing Chinese facility, aiming to meet growing demand from metro and tunnel infrastructure projects across the country. The expansion added meaningful annual capacity without requiring an entirely new greenfield manufacturing site, ahead of the anticipated demand cycle.
Signal: Signals established global manufacturers a
JUNE 2025

BASF Signs Supply Agreement With An Indian Infrastructure Developer

BASF signed a multi-year supply agreement with a major Indian infrastructure developer to provide waterproofing chemicals across several metro rail construction projects. The agreement was structured as a direct supply contract rather than any joint venture or equity arrangement, ahead of a planned construction ramp.
Signal: Signals established manufacturers are secu
OCTOBER 2025

Pidilite Acquires A Regional Cementitious Systems Specialist

Pidilite completed the acquisition of a regional cementitious waterproofing specialist, adding proprietary formulation technology to its existing product portfolio. The transaction was a full acquisition, not a licensing or minority equity investment arrangement. The specialist brought formulations Pidilite previously lacked internally. Integration should complete within the coming fiscal year.
Signal: Signals established regional manufacturers

What Actually Drives Waterproofing Chemical Cost

Bitumen, isocyanate, and specialty polymer feedstock account for roughly 48% of production cost, sourced from petrochemical processing facilities concentrated in China, the Middle East, and South Korea. Application labor and quality assurance costs add another 20%, while packaging and logistics costs make up most of the remainder across manufacturer operations. Feedstock remains the single largest cost driver.
Isocyanate and bitumen prices spiked in 2021 and 2022 as broader petrochemical commodity inflation raised the cost of feedstock shared with other specialty chemical manufacturing industries competing for the same processing capacity. BASF's 2022 annual report cited elevated feedstock costs as a direct pressure on construction chemicals margins that year, and several manufacturers reported similar pressure, pushing some smaller formulators toward temporary production cutbacks until commodity pricing eased into 2023 and 2024.

Smaller regional formulators carry the sharpest exposure, since they lack the purchase volume to negotiate long-term feedstock supply contracts that Sika and BASF secure directly with petrochemical producers. Geographic exposure varies too: manufacturers sourcing domestic feedstock face lower cost volatility than those dependent on imported isocyanate, a gap that widens whenever global commodity prices spike against relatively stable domestic feedstock pricing.
asia-pacific-waterproofing-chemicals-market-cost-volatility-analysis-1787303024755

Lock Multi-Year Feedstock Supply Agreements

Manufacturers with sufficient purchase volume are negotiating multi-year bitumen and isocyanate supply agreements directly with petrochemical producers, trading pricing flexibility for guaranteed allocation during industry-wide commodity shortages. This approach favors the largest manufacturers disproportionately, since minimum volume commitments required for favorable terms sit well beyond what smaller regional formulators can commit to reliably. Smaller formulators often lack this negotiating leverage.

Qualify Alternative Bio-Based Polymer Blends

Some manufacturers now qualify alternative bio-based polymer blends that reduce pure isocyanate dependency across multiple product lines rather than relying entirely on petroleum-derived formulations, trading some performance optimization for meaningfully improved supply flexibility during recurring feedstock shortages. Larger manufacturers with diverse product portfolios pursue this path most successfully consistently across market cycles. This tradeoff grows more attractive as shortages recur.

Build Regional Manufacturing Capacity Near Demand

Opening manufacturing facilities closer to major Asian infrastructure markets, as several manufacturers have done in China and India, cuts logistics cost and currency exposure even when core feedstock still ships from concentrated global suppliers. This shift requires meaningful capital investment but pays off steadily for regionally integrated manufacturers over the long run as volumes scale steadily.

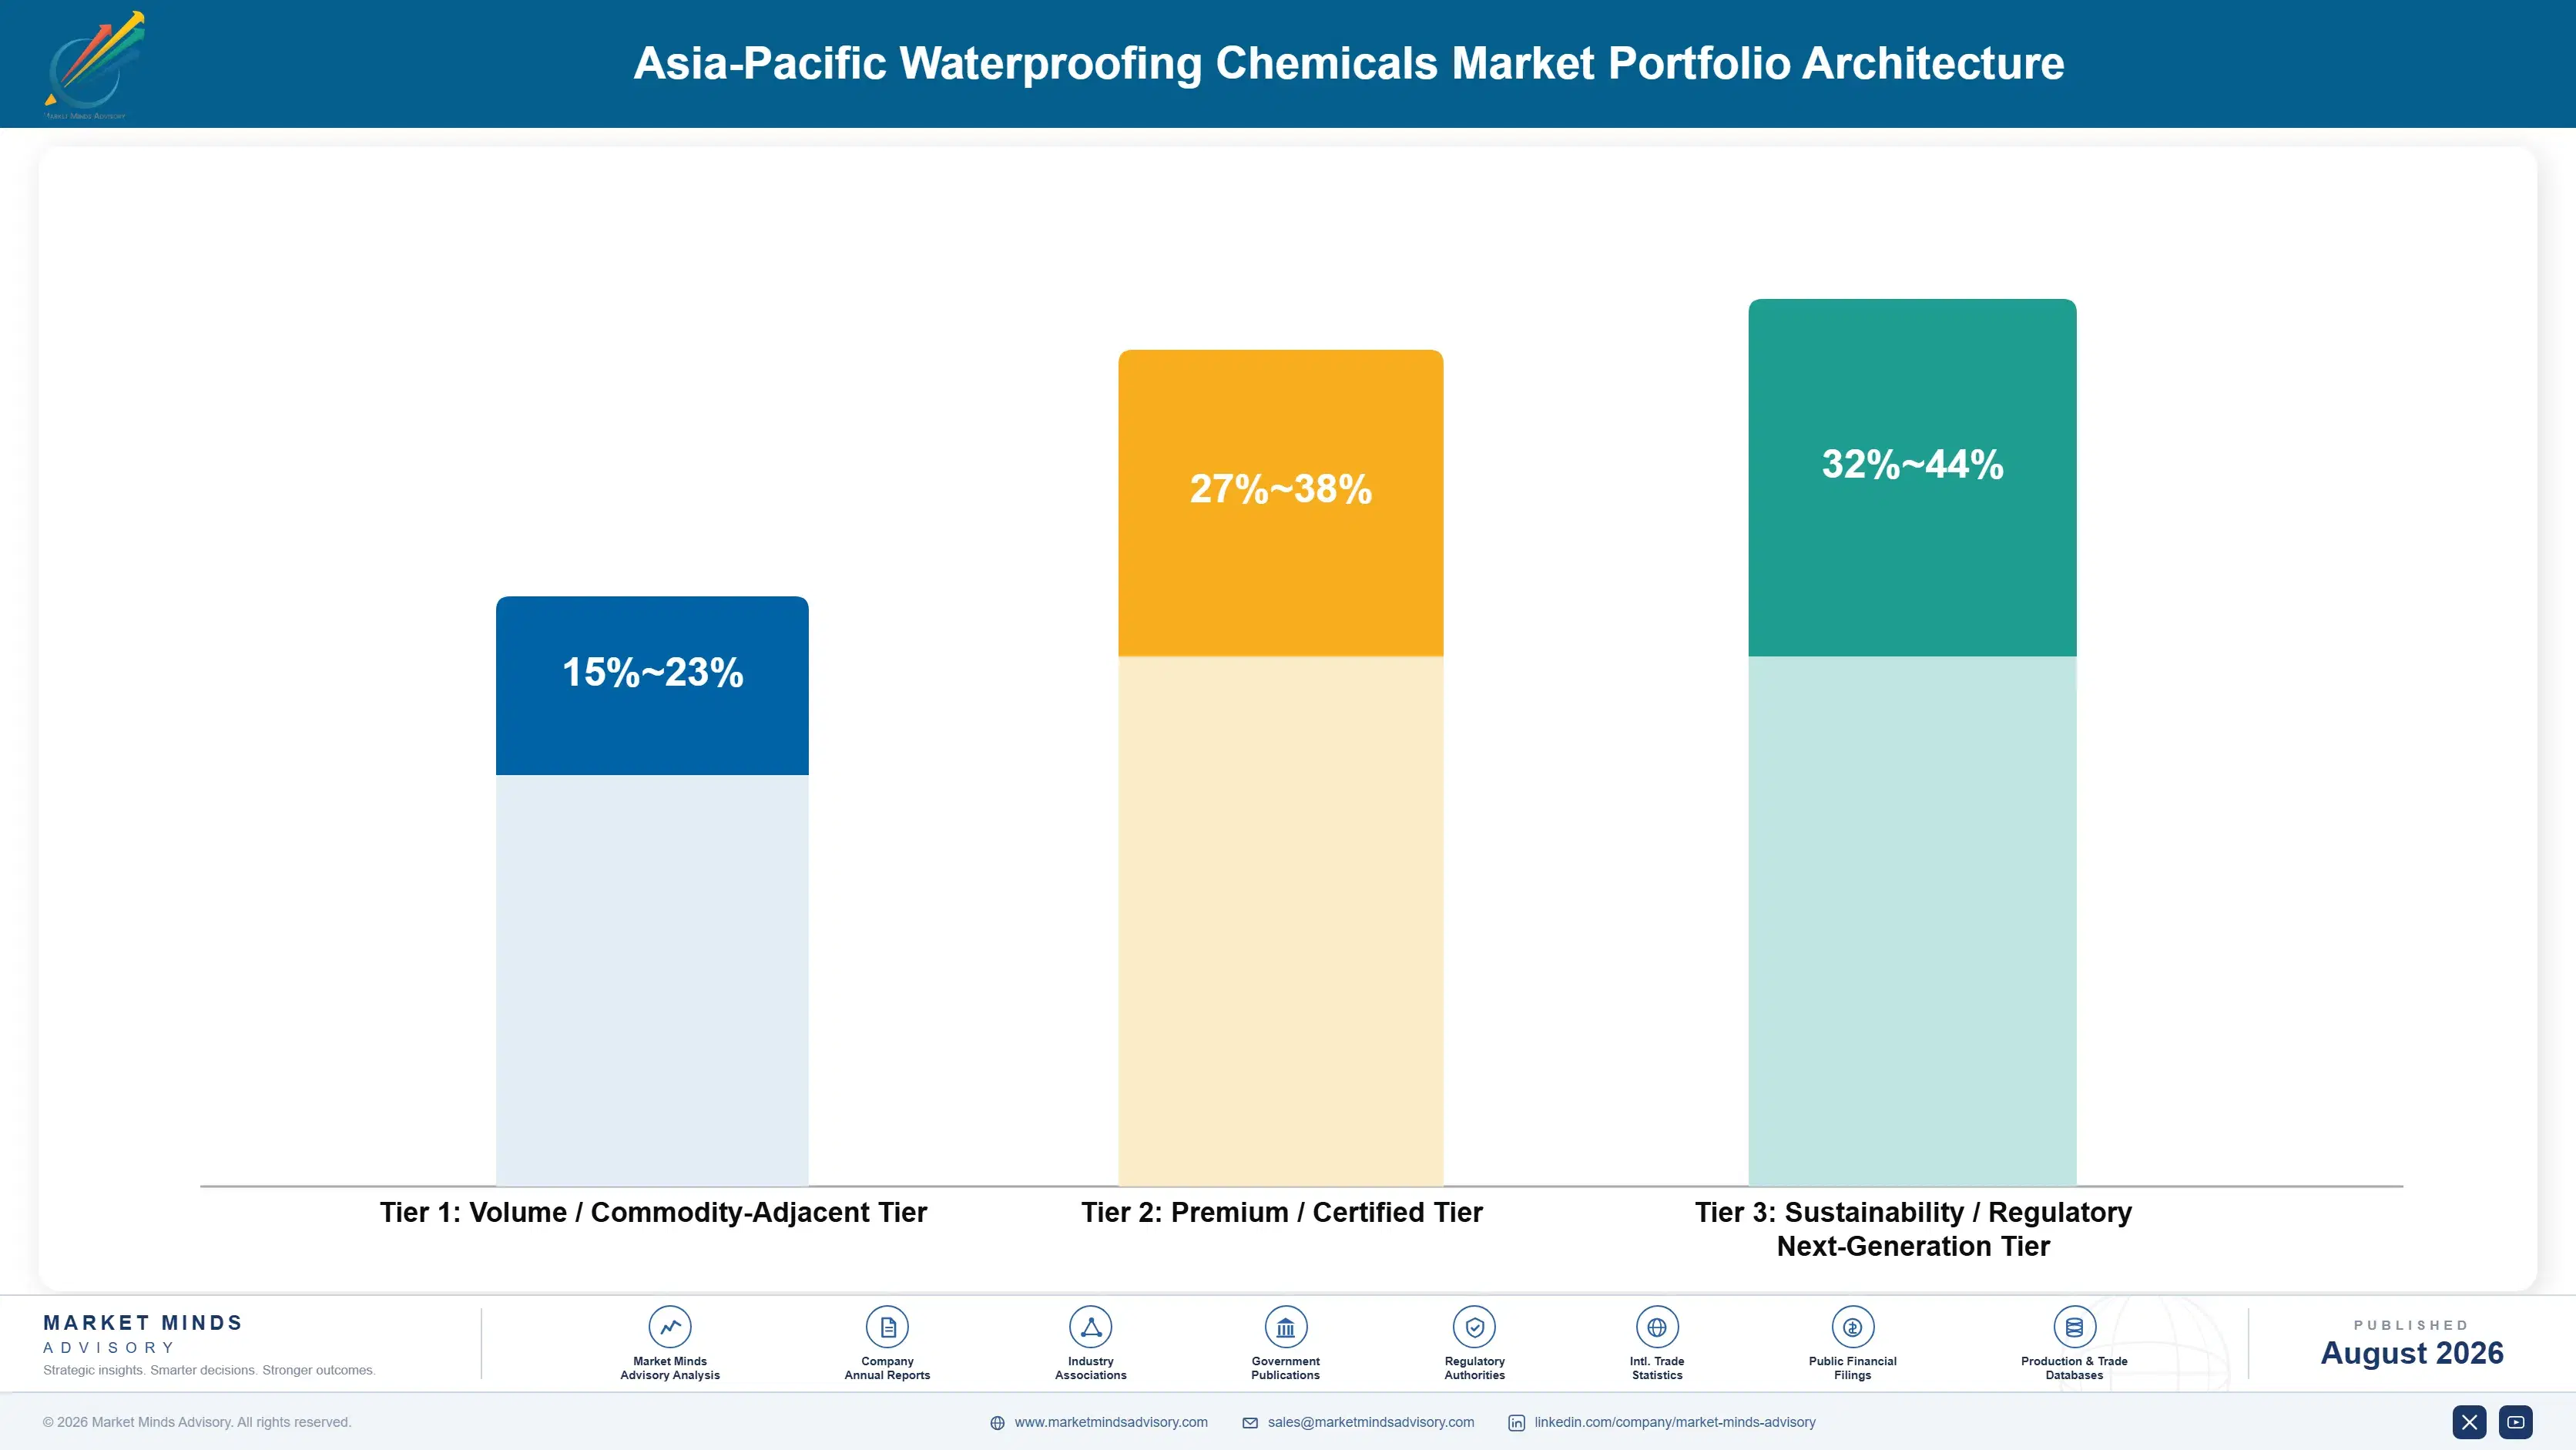
Portfolio Architecture for Margin Defence

The portfolio splits into three tiers with clear margin separation. Volume-tier products, standard bituminous and cementitious formats sold largely on price into commodity residential and municipal channels, compete hard and earn modestly. Premium certified products, covering polyurethane and elastomeric formats meeting documented infrastructure specifications, earn considerably more because application engineering and technical service depth support pricing. Next-generation bio-based and infras
The tension here is common to specialty chemicals businesses: volume revenue funds the manufacturing scale premium products depend on, yet volume growth alone cannot fund the applicator training and infrastructure-grade development investment next-generation solutions require. Manufacturers leaning too heavily into premium positioning risk losing the manufacturing scale that makes market entry viable in price-sensitive municipal channels, while volume players cede premium infrastructure specification to diversified rivals.

High-value pools concentrate where formulation innovation, applicator certification depth, and technical service reliability intersect: infrastructure-grade polyurethane products serving buyers willing to pay for verified, documented performance. That intersection is a minority of revenue globally but expanding quickly, which is why the next-generation tier grows fastest even while representing a modest volume share.

Volume / Commodity-Adjacent Tier

Standard bituminous and cementitious formats sold largely on price into commodity residential and municipal channels, competing directly against low-cost regional formulators across most price-sensitive markets. Margins here compress steadily each year.
Gross Margin: 15%-23%

Premium / Certified Tier

Polyurethane and elastomeric formats meeting documented infrastructure specifications, sold to buyers willing to pay for application engineering depth and proven reliability. This tier increasingly anchors long-term specification relationships and repeat volume.
Gross Margin: 27%-38%

Sustainability / Regulatory / Next-Generation Tier

Bio-based and infrastructure-grade solutions representing the formulation innovation frontier, priced at a premium justified by engineering depth and expanding tunnel and metro application scope. Few manufacturers currently compete here, leaving room for early leadership.
Gross Margin: 32%-44%
asia-pacific-waterproofing-chemicals-market-portfolio-architecture-1787303025269

How Waterproofing Demand Actually Commits

Demand here commits through a long specification and certification cycle rather than a point-of-sale decision. A buyer that qualifies a system for a metro or tunnel program typically commits to that manufacturer for the project's entire construction run, since switching mid-project would require re-engineering application specifications and safety documentation already validated across multiple regulatory reviews. That long-commitment structure makes this market behave like a program-based annui
Adoption depth varies by application category. Infrastructure contractors adopt engineered polyurethane formats readily, given the liability and performance demands that make documented performance data essential rather than optional. Standard residential and municipal buyers adopt more cost-consciously, weighing performance benefit against a purchase price that competes with tighter budgets. Green building developers occupy a distinct position, often prioritizing certification depth over marginal cost differences between comparable systems.

Younger infrastructure engineers increasingly research performance and certification documentation directly rather than relying entirely on manufacturer sales representatives that previous generations depended on for specification guidance. That shift is pushing manufacturers toward more transparent published performance data and digital certification tools, even though long-term specification relationships remain the actual purchasing mechanism for most infrastructure and municipal accounts today.
asia-pacific-waterproofing-chemicals-market-end-use-penetration-index-1787303025784

Where This Market Rewards Application Depth

These are among the four positions where our research anticipates prominent divergence between winners and laggards over the coming forecast period. Each is grounded in the demand model, the regulatory perimeter, and the announced capacity pipeline.
01 / APPLICATOR NETWORK STRATEGY

Winners will build certification capacity before rivals

Raw formulation chemistry alone no longer separates leading manufacturers, since most competitors can eventually match a given performance specification within a few product cycles. What actually separates winners is the depth of certified applicator capacity available to major infrastructure customers, because a technically capable chemistry without reliable installation cannot win the specification decisions that increasingly require documented performance certainty. Manufacturers building dedicated training capability, rather than treating it as an afterthought, will out-earn technically comparable rivals over the coming decade.
02 / REGIONAL MANUFACTURING FOOTPRINT

Local production capacity will decide Asian market access

Trade cost and delivery lead time, not raw manufacturing cost alone, increasingly determine which manufacturers can compete profitably as China and India scale their own infrastructure manufacturing base rapidly. Manufacturers who build regional manufacturing capacity early will capture access that purely import-dependent competitors cannot match, regardless of how competitive their underlying chemical pricing might otherwise be under normal market conditions. Those relying entirely on distant centralized manufacturing will find themselves increasingly unable to serve the fastest-growing Asian markets within this decade.
03 / SERVICE AND CERTIFICATION REVENUE

Certification support will matter more than bulk sales

Manufacturers still competing purely on bulk chemical price are leaving durable revenue on the table that certification support and extended warranty services already capture successfully for service-forward competitors across major markets. These recurring revenue streams persist independent of the lumpy program construction cycles that otherwise define this market's uneven revenue pattern tied to infrastructure build schedules. Companies that build genuine certification and warranty capability early will earn materially more per program relationship over a decade than those still selling only chemicals.
04 / INFRASTRUCTURE CHEMISTRY INVESTMENT

Formulation engineering will matter more than legacy volume

Even where established residential demand keeps growing steadily, long-term margin growth is increasingly shaped by how quickly manufacturers secure infrastructure-grade specification across the fastest-growing tunnel and metro platforms, a technology transition individual manufacturers cannot simply accelerate through marketing alone. Manufacturers who invest early in formulation research and infrastructure-specific engineering will capture positioning ahead of competitors still dependent entirely on legacy residential demand. This constraint will matter more to realized long-term margin than any single near-term pricing decision alone across every application category tracked.

Engagement Snapshot From the Field

A live engagement with an industry participant carrying material or product regulatory and market exposure ahead of a defining policy shift, showing how our research translates into a defensible multi-year portfolio strategy.
MARKET MINDS ADVISORY · CLIENT ENGAGEMENT SUMMARY
Asia-Pacific Waterproofing Chemicals Producer Strategic Portfolio Review and Transition Roadmap 2026·Investment Scenario on Asia-Pacific Waterproofing Chemicals Exposure Evaluation 2025-26
CLIENT PROFILE
A regional waterproofing chemicals manufacturer approached MMA while evaluating whether to expand its cementitious product line into infrastructure-grade polyurethane formats or continue focusing exclusively on its established residential and municipal manufacturing strength. The manufacturer reported annual revenue near USD 52 million, with roughly 71% derived from cementitious and bituminous fabrics sold into residential channels (client-reported, unverified by MMA).
STRATEGIC CHALLENGE
Leadership believed polyurethane expansion would meaningfully capture growing infrastructure demand, but nobody had modeled the additional formulation investment and applicator training timeline against the potential competitive advantage, nor assessed which chemistry would best balance performance against the manufacturer's existing cost structure. This uncertainty delayed the product roadmap decision by several months.
MMA APPROACH
MMA benchmarked infrastructure-grade formulations across four competitor manufacturers against the client's existing manufacturing capability, modeled formulation investment and training timeline scenarios against comparable prior format expansions, and interviewed infrastructure engineers at three regional contractors on real-world preference between standard cementitious and polyurethane formats and reviewed comparable published certification data. Findings were validated against two additional infrastructure procurement case examples.
KEY FINDINGS
  1. A tuned polyurethane formulation building on the manufacturer's existing mixing equipment offered the clearest path to market entry, based on comparable competitor product timelines (client-reported, unverified by MMA).
  2. Engineer interviews revealed stronger specification interest in infrastructure-grade formats than the manufacturer's own market research had previously indicated. This gap influenced the final product roadmap decision.
  3. The formulation timeline for infrastructure-grade entry ran only modestly longer than the manufacturer's residential product refresh cycle, given shared mixing relationships. Shared equipment cut the projected capital investment meaningfully below initial estimates.
  4. Two of the four competitor manufacturers evaluated had secured meaningfully stronger infrastructure program specification after launching polyurethane lines than cementitious-only comparable peers.
CLIENT PROFILE
A regional waterproofing chemicals manufacturer approached MMA while evaluating whether to expand its cementitious product line into infrastructure-grade polyurethane formats or continue focusing exclusively on its established residential and municipal manufacturing strength. The manufacturer reported annual revenue near USD 52 million, with roughly 71% derived from cementitious and bituminous fabrics sold into residential channels (client-reported, unverified by MMA).
STRATEGIC CHALLENGE
Leadership believed polyurethane expansion would meaningfully capture growing infrastructure demand, but nobody had modeled the additional formulation investment and applicator training timeline against the potential competitive advantage, nor assessed which chemistry would best balance performance against the manufacturer's existing cost structure. This uncertainty delayed the product roadmap decision by several months.
MMA APPROACH
MMA benchmarked infrastructure-grade formulations across four competitor manufacturers against the client's existing manufacturing capability, modeled formulation investment and training timeline scenarios against comparable prior format expansions, and interviewed infrastructure engineers at three regional contractors on real-world preference between standard cementitious and polyurethane formats and reviewed comparable published certification data. Findings were validated against two additional infrastructure procurement case examples.
KEY FINDINGS
  1. A tuned polyurethane formulation building on the manufacturer's existing mixing equipment offered the clearest path to market entry, based on comparable competitor product timelines (client-reported, unverified by MMA).
  2. Engineer interviews revealed stronger specification interest in infrastructure-grade formats than the manufacturer's own market research had previously indicated. This gap influenced the final product roadmap decision.
  3. The formulation timeline for infrastructure-grade entry ran only modestly longer than the manufacturer's residential product refresh cycle, given shared mixing relationships. Shared equipment cut the projected capital investment meaningfully below initial estimates.
  4. Two of the four competitor manufacturers evaluated had secured meaningfully stronger infrastructure program specification after launching polyurethane lines than cementitious-only comparable peers.
RECOMMENDED STRATEGY
Phase 1: Phase 1 (0 to 6 months): Finalize the tuned polyurethane formulation and begin certification testing directly with accredited laboratories. Parallel supplier discussions begin during this same window. Phase 2: Phase 2 (6 to 15 months): Complete infrastructure performance validation while maintaining the existing residential product line and customer relationships. Phase 3: Phase 3 (15 to 24 months): Launch the infrastructure-grade line to regional contractors, monitoring early specification wins and field performance data.
OUTCOME
The manufacturer proceeded with the tuned polyurethane formulation and began certification testing on schedule, tracking meaningfully faster than the originally projected timeline, with prototype testing completed ahead of the internal target date. The manufacturer reported strong early contractor interest ahead of the anticipated product launch (client-reported, unverified by MMA).

Frequently Asked Questions

Foundational context covering the market sizes, CAGR, scope, country, region and competition that inform every finding below. This section is provided to cover basics and most often pre-purchase conversations, answered from the MMA Primary Research Dataset.

What is the current size of the Asia-Pacific Waterproofing Chemicals Market?

The market stood at USD 4.8 billion in 2025, based on MMA Primary Research Dataset findings. Infrastructure investment remains the largest driver of overall specification volume.

How large will the Asia-Pacific Waterproofing Chemicals Market be by 2036?

MMA projects the market will reach USD 10.21 billion by 2036 under the base case scenario, representing roughly 1.99 times the 2026 opening value across the eleven-year forecast period.

What is the CAGR for the Asia-Pacific Waterproofing Chemicals Market 2026 to 2036?

The base case CAGR is 7.1% annually. MMA's bull scenario reaches 8.5% while the bear scenario, reflecting applicator constraints, runs closer to 5.8% over the period.

Which segment is growing fastest?

Polyurethane waterproofing chemicals lead at 11.2% CAGR, roughly 1.58 times the overall market rate, as tunnel and metro projects demand continuous membrane coverage at scale.

Who are the major companies in the Asia-Pacific Waterproofing Chemicals Market?

Sika, BASF, Saint-Gobain, Soprema, and Fosroc lead the market, together controlling an estimated 38% of global revenue on a consistent basis measured across every chemistry category.

Which country is growing fastest?

China posts the fastest national growth at 12.8% CAGR, driven by its sustained metro and rail infrastructure investment. Domestic manufacturers increasingly compete for regional export orders.

Report Segmentation Architecture

The full report scope spans multiple orthogonal segmentation dimensions, with cross-tabulated demand data provided for each dimension pair. Coverage extends further to regional breakdowns, trend trajectories, and the competitive detail needed to support segment-level decision-making.

By Product Type

  • Bituminous Waterproofing Chemicals
  • Polyurethane Waterproofing Chemicals
  • Cementitious Waterproofing Chemicals
  • EPDM and Elastomeric Waterproofing Chemicals
  • Acrylic-Based Waterproofing Chemicals
  • Polymer-Modified Bitumen Systems

By End-Use Industry

  • Residential Construction
  • Commercial and Institutional Buildings
  • Transportation and Tunnel Infrastructure
  • Water and Wastewater Infrastructure
  • Industrial Facilities

By Commercial Dimension

  • Direct Infrastructure Contractor Supply
  • Distributor and Retail Channels
  • Certified Applicator Networks
  • Municipal and Government Procurement

By Region

  • North America
  • Western Europe
  • East Asia
  • South Asia and Pacific
  • Latin America
  • Middle East and Africa
  • Eastern Europe

Scope, Methodology, and Coverage

Every figure in this report is reproducible from documented input assumptions. The scope below maps the historical period, the forecast horizon, the segmentation dimensions, and the countries covered, alongside the underlying primary and qualitative methodology.
Historical Period
2020 to 2025
Forecast Period
2026 to 2036
Base Year
2025 (USD billions; MMA Primary Research Dataset, August 2026)
Market Definition
The waterproofing chemicals market covers formulated products applied to building envelopes, foundations, roofing, and infrastructure to prevent water ingress, including bituminous, polyurethane, cementitious, elastomeric, and acrylic-based systems. It excludes physical waterproofing membranes sold without chemical formulation and structural sealants used primarily for joint movement rather than water exclusion.
Quantitative Units
USD billions (current prices); square meters treated where applicable
Segmentation Dimensions
By Product Type; By End-Use Industry; By Commercial Dimension; By Region
Regions Covered
North America, Western Europe, East Asia, South Asia and Pacific, Latin America, Middle East and Africa, Eastern Europe
Countries Covered
China, India, Japan, South Korea, Australia, Vietnam, Indonesia, USA, Canada, Germany, France, UK, Italy, Spain, Brazil, Mexico, UAE, Saudi Arabia, South Africa, Poland, Czech Republic, Hungary, Romania, Russia, and additional markets relevant to this sector
Key Companies Profiled
Sika AG, BASF SE, Saint-Gobain, Soprema Group, Fosroc International Limited, RPM International Inc., Sherwin-Williams Company, Mapei S.p.A., Kemper System America, Inc., Pidilite Industries Limited, Asian Paints Limited, Nippon Paint Holdings Co., Ltd., Wacker Chemie AG, Dow Inc., CICO Technologies Limited, Chembond Chemicals Limited, Berger Paints India Limited, Kansai Paint Co., Ltd., Sto SE & Co. KGaA, Bostik SA
Quantitative Methodology
Primary survey, n=3,800 respondents, Q4 2025, six countries; demand-side model with trade association cross-validation
Qualitative Methodology
47 expert interviews, Q4 2025; applied to validate demand model assumptions, identify emerging dynamics, and assess competitive positioning
Report Format
PDF and XLSX data workbook (Word format preview document)
Publisher
Market Minds Advisory
Report Code
MMA-2026-CHM-137
Published
August 2026
Contact
sales@marketmindsadvisory.com | www.marketmindsadvisory.com

Purchase the full Asia-Pacific Waterproofing Chemicals Market Report (2026 to 2036).

The full MMA Asia-Pacific Waterproofing Chemicals report sizes the market across six product-type categories, five end-use verticals, four commercial channels, and seven regions through 2036. It profiles 20 participants on a consistent revenue basis, scoring the top five on application engineering depth, certification breadth, and applicator network reliability. Scenario models quantify how Chinese infrastructure investment, India's Smart Cities Mission, and green building certification move both demand and realizable pricing. The report also includes delivered-cost modelling by chemistry type, a regional building code tracker, and a competitive benchmarking tool built for manufacturer strategy, contractor procurement, and investor due diligence teams.
Six-category chemistry segmentation with regional cross-tabulation
Building code and certification tracker across twelve major markets
Competitive benchmarking on consistent revenue basis
Delivered-cost modelling by chemistry type and region
Scenario models for infrastructure and green building demand
China and India infrastructure investment analysis by manufacturer

Built For The People Who Decide

From boardroom strategy to bench-side execution, this report is read cover-to-cover by leaders shaping the next decade of their industry, turning demand scenarios, market dynamics and valuation benchmarks into decisions.
CXOs/ Presidents/ VPs/ Managers
M&A and Corporate Development
Strategy Teams and R&D Heads
Procurement and Product Directors
Regulatory and Compliance Leaders
Investor Relations and Equity Analysts