Market Minds Advisory
Asia-Pacific Satellite Launch Vehicle Market

Asia-Pacific Satellite Launch Vehicle Market: Asia-Pacific Satellite Launch Vehicles: Sovereign Demand, Range Capacity and Reusability Arithmetic

Most of this market cannot be bid for, because governments across the region treat orbital access as infrastructure they own rather than a service anyone sells them by the kilogram.

Lead Analyst

Published

September 2026

Make Smarter Decisions with Customized Research Insights

Request a free sample report and evaluate market opportunities, growth trends, and competitive dynamics relevant to your business needs.

2025 MARKET VALUE$4.4BMarket Size 2025
2036 FORECAST VALUE$16.3BBase Case , 2026 to 2036
CAGR 2026 TO 203612.6 %Bull 13.9% / Bear 11.4%
INCREMENTAL OPPORTUNITY$11.3BNet 10- year value creation
EXPANSION MULTIPLE3.26x2036 value over 2026 base
Strategic Levers
M&A Pipeline
Regional Outlook
Country Rankings
Competitive Intelligence
Segmental Deep-dive
Call-Us : 91 93563 13602

Executive Snapshot and Market Trajectory.

Very little of this market can actually be bid for by anyone. Launch across Asia Pacific is overwhelmingly sovereign: national agencies flying national payloads on national vehicles, because governments treat access to orbit as strategic infrastructure rather than as a service somebody else sells them by the kilogram at all.
Two constraints shape it, and neither is rocket availability. Pads, range corridors and launch azimuths cap cadence well before vehicles run short, which is why new sites in Hainan, southern India and Hokkaido matter considerably more than any new engine. Reusability then fails on plain arithmetic at these flight rates. Reusable first stage vehicles grow fastest at 18.9%, half again the market rate of 12.6%.
Five organisations hold 81%, and four of them are state or state-linked, which tells you most of what matters here. The genuinely commercial contest sits in small launch, where Chinese and Indian private firms compete for the payloads sovereign programmes will not carry. Reusability is being pursued across the region on strategic grounds rather than unit economics, because a first stage flying four times a year never amortises what it cost to make recoverable.
Market Definition
This report covers orbital and suborbital launch vehicles manufactured and operated across Asia Pacific, together with the launch services sold against them. Scope includes small launch vehicles, medium-lift expendable vehicles, heavy-lift expendable vehicles, reusable first stage vehicles, solid-propellant vehicles and suborbital or test vehicles. Excluded are satellites and payloads, spaceport construction and ground infrastructure, in-space transportation and orbital transfer vehicles, missile systems, launch insurance and brokerage services, and launch vehicles operated in the region by operators based outside it.
Base Year Value
$4.4B in 2025 (MMA Primary Research Dataset, September 2026)
Forecast Period
2026 to 2036, eleven discrete annual values
CAGR
12.6% base case. Bull 13.9%. Bear 11.4%.
Fastest Growth Segment
Reusable First Stage Vehicles: 18.9% CAGR
Fastest Growth Country
India: 17.4% CAGR
Fastest Growth Region
South Asia and Pacific: 14.6% CAGR
Largest Region
East Asia: 60% of 2025 global value
Market Leaders
China Aerospace Science and Technology Corporation, Mitsubishi Heavy Industries, Indian Space Research Organisation, LandSpace, Galactic Energy. Source: MMA Analysis based on orbital launches conducted and contracted launch value, July 2026.
Primary Survey
n=3,800 procurement and R&D decision-makers, Q4 2025, six countries
Methodology
Demand-side build-up, cross-validated against public data, 47 expert interviews

Asia-Pacific Satellite Launch Vehicle Market Forecast Scenarios

asia-pacific-satellite-launch-vehicle-market-size-forecast-scenario-1790026017750
Growth averaged 11.3% across 2020 to 2025 and it came from two very different sources. Chinese launch cadence rose steadily throughout on state programmes and, from 2023, on commercial vehicles reaching orbit for the first time. Indian activity accelerated after the sector opened to private participation, and Japanese cadence was interrupted by a vehicle transition costing most of two years before recovering from 2024.
Base case growth of 12.6% rests on three mechanisms. Sovereign constellation programmes across China, India and Japan generate launch demand that no commercial operator can bid for and that budget cycles rather than markets determine. New launch site capacity in Hainan, southern India and northern Japan lifts the cadence ceiling that pads and range corridors currently impose. And commercial small launch firms in China and India win payloads national programmes decline to carry on schedule.
The bull case at 13.9% assumes new pad and range capacity comes on stream to schedule and that at least one regional reusable vehicle reaches operational service. The bear case at 11.4% follows from site capacity slipping, which caps cadence regardless of how many vehicles exist, and from reusability programmes consuming development budget without reaching flight rates that justify them.

Sovereign Demand Against Range Capacity

The first thing to understand about this market is how little of it clears commercially. Roughly 19% of regional launch demand is open to competitive bidding at all; the rest is sovereign payloads on sovereign vehicles, priced internally or by policy. That makes conventional market sizing misleading, because most of the value is government programmes rather than transactions anybody could win on price.
FIVE-ORGANISATION CONCENTRATION81%Four of the five leading participants are state linked
CONTESTABLE DEMAND SHARE19%Portion of regional launch demand open to competitive bidding
AVERAGE SMALL LAUNCH PRICEUSD 7.2MDedicated mission pricing across regional small vehicle operators
REGIONAL PAD UTILISATION71%Occupancy of available orbital launch complexes across the region
MEDIAN ANNUAL FLIGHT RATE6 launchesTypical yearly cadence achieved per operational regional vehicle
PROPELLANT COST SHARE8%Propellant portion of delivered launch cost per mission
Cadence is limited by ground infrastructure rather than by vehicles. Pads, range safety corridors, launch azimuths and downrange tracking all constrain how often a region can launch, and regional pad utilisation already runs around 71%. That is why new commercial launch complexes in Hainan, the second small vehicle pad in southern India and spaceport development in northern Japan matter more to regional capacity than any engine programme currently in development.
Reusability does not close on arithmetic here and everyone involved knows it. A recoverable first stage requires recovery infrastructure, refurbishment capability and a flight rate high enough to amortise both, and the median regional vehicle flies around six times a year. Programmes are therefore justified on technology sovereignty and on preparing for a higher-cadence future rather than on a unit economics case that works at today's rates.
"Half the analysis of this region counts rockets. The number that actually binds is how many days a year a range can be cleared, and nobody puts that in a forecast."
Director, Space Launch and Access Practice · MMA Technology / Space Launch Systems Practice · September 2026

Market Trends

Commercial Small Launch Firms Take Payloads Sovereign Programmes Decline

National programmes across the region prioritise state payloads and schedule accordingly, which leaves commercial and research spacecraft waiting for slots that may move by quarters. Private small launch firms in China and India have built businesses on exactly that gap, offering dedicated missions on schedule rather than rideshare slots on somebody else's timeline. Pricing around USD 7.2 million for a dedicated small mission reflects schedule certainty as much as capability. This contested segment represents roughly 19% of regional demand and almost all of the competitive activity. Sovereign schedules move; commercial customers cannot wait.
Market Impact: Covers 1,100 sovereign spacecraft launches

New Launch Site Capacity Lifts The Regional Cadence Ceiling

Regional pad utilisation runs around 71%, and additional complexes are under development in Hainan, southern India and northern Japan specifically to relieve it. Commercial pad availability matters more than state pad availability, because private vehicles have historically queued behind national programmes for range time. New sites designed for commercial cadence change the competitive position of small launch firms substantially, since schedule certainty is what they actually sell. Site development timelines rather than vehicle development now set when regional cadence can rise. Schedule certainty is the entire commercial proposition for these operators.
Market Impact: Adds 11 funded Indian developers

Market Opportunities and Growth Drivers

Sovereign Constellation Programmes Generate Non-Contestable Launch Demand

China, India and Japan are all deploying national satellite constellations for communications, navigation and observation, and every one of those spacecraft flies on a domestic vehicle by policy rather than by tender. Demand therefore follows budget appropriations rather than commercial competitiveness, which makes it forecastable from published programme plans but entirely closed to outside participants. Roughly 1,100 sovereign spacecraft across the region require launch during the forecast period, almost none of which any commercial operator can bid to carry. Budget appropriations rather than competitive merit determine every one of these awards.
Market Impact: Constrains cadence at 71% utilisation

Indian Private Sector Opening Creates A Genuinely New Supplier Base

India's regulatory opening of space activity to private participation has produced launch vehicle developers where none existed five years ago, supported by technology transfer arrangements and by a national space policy that explicitly contemplates commercial operators. Two Indian firms have already flown suborbital or orbital vehicles, and several more are in development. The commercial significance is that a sovereign-dominated market is developing a competitive layer beneath it. Around 11 Indian private launch developers are now active with funded programmes. Technology transfer arrangements have accelerated all of this considerably faster than anyone expected.
Market Impact: Amortises across only 6 flights

Market Restraints and Challenges

Range And Pad Capacity Caps Cadence Regardless Of Vehicles

Regional pad utilisation runs around 71%, and every launch requires a cleared range corridor, an available azimuth and downrange tracking, none of which a vehicle manufacturer controls. The root cause is that launch sites are national infrastructure with long development timelines and competing civil aviation and maritime demands on the same airspace and water. Commercially this means additional vehicles may add no additional launches at all. Participants are responding through new commercial pad development, mobile and sea-based launch platforms, and negotiated range access arrangements. Additional vehicles may produce no additional launches whatsoever.
Market Impact: Contested demand reaches 19% share

Reusability Economics Fail At Regional Flight Rates

A recoverable first stage demands recovery vessels or landing zones, refurbishment facilities and inspection capability, all of which must be amortised across flights, and the median regional vehicle flies around six times a year. The root cause is arithmetic rather than engineering: the fixed cost of recovery infrastructure divided by six flights exceeds the saving on six first stages. Programmes proceed on technology sovereignty grounds instead. Mitigation runs through shared recovery infrastructure, partial reuse of engines only, and designs targeting the cadence a future market might support. Engineering is not the obstacle here.
Market Impact: Relieves 71% pad utilisation constraint
3 additional market trends, 4 additional growth drivers, and 2 additional restraints and challenges are covered in the full report. Contact sales@marketmindsadvisory.com to access the complete intelligence.

Segment CAGR and Growth Architecture

Vehicles are segmented here by class, because class determines the payload the vehicle serves, the customer who buys it and the economics of operating it. Mixing vehicle class with propulsion type or operator ownership produces categories that overlap constantly. Six classes cover the field from suborbital test vehicles through to heavy-lift, and commercial contestability varies enormously across them.
asia-pacific-satellite-launch-vehicle-market-market-share-analysis-1790026018337

Reusable First Stage Vehicles

Growing at 18.9%, half again the market rate of 12.6%, this class is expanding on development programmes rather than on operational flights, because no regional reusable vehicle is yet in routine service. Several Chinese firms have conducted vertical landing tests and one has flown recoverable hardware, while Indian and Japanese programmes remain earlier. The economics do not currently close: recovery infrastructure and refurbishment capability must be amortised across a flight rate the region does not yet generate. Programmes therefore proceed on technology sovereignty and on positioning for a higher-cadence future, which is a legitimate reason to spend but not a commercial one. Policy rather than commercial return is funding all of it.
CAGR 18.9%

Small Launch Vehicles

Small launch grows at 15.2% and contains almost all of the region's genuinely competitive activity. National programmes prioritise state payloads and schedule accordingly, which leaves commercial and research spacecraft waiting, and private firms in China and India have built businesses selling schedule certainty rather than capability. Dedicated mission pricing around USD 7.2 million reflects that. Unit economics are thin and several operators depend on continued investment rather than operating cash flow, but this is where the competitive dynamics of a normal market actually exist. Pad access rather than vehicle availability is the binding constraint on how fast any of them can grow. Investment rather than operating cash flow still sustains several operators.
CAGR 15.2%
Full segment breakdown across 6 segments available in the complete report.

Regional Architecture and Country Demand Map

This is a region-scoped report, so the regional table records where the vehicles and their major content serving Asia Pacific operators are manufactured rather than where demand sits. Regional manufacture is close to total, because launch vehicles are treated as sovereign capability and imported vehicles are effectively not an option.

East Asia

East Asian manufacture accounts for 60% of delivered content, far above the 22 to 30% band used for this region elsewhere in this report, because Chinese, Japanese and South Korean vehicles are built domestically and supply almost nothing from outside. Chinese state and commercial manufacture dominates the figure, with several private firms now flying orbital vehicles alongside the established state family. Japanese manufacture supplies a new flagship vehicle after a difficult transition, and South Korean capability is progressing through its own national programme. Growth of 13.4% sits above the regional market rate, driven by Chinese commercial vehicle entry rather than by state programme expansion alone. Commercial vehicle entry rather than state expansion drives the growth.
Share: 60% | CAGR: 13.4% (2026 to 2036)

South Asia and Pacific

At 29%, far above the 7 to 12% band applied elsewhere, this region's own manufacture is the second largest source and the fastest growing. Indian manufacture covers a full vehicle family from small launch through heavy lift, and the private sector opening has produced roughly 11 funded developers where none existed five years ago. Australian development is earlier and smaller but genuine, with one firm progressing toward orbital flight from a domestic site. Growth of 14.6% is the highest of any source region, reflecting both the Indian private sector emerging and established national programmes raising cadence as new pad capacity arrives. Pad capacity arriving now is what lets cadence actually rise.
Share: 29% | CAGR: 14.6% (2026 to 2036)
Regional intelligence for 5 additional markets available in the complete report: North America, Western Europe, Eastern Europe, Middle East and Africa, Latin America. Contact sales@marketmindsadvisory.com.
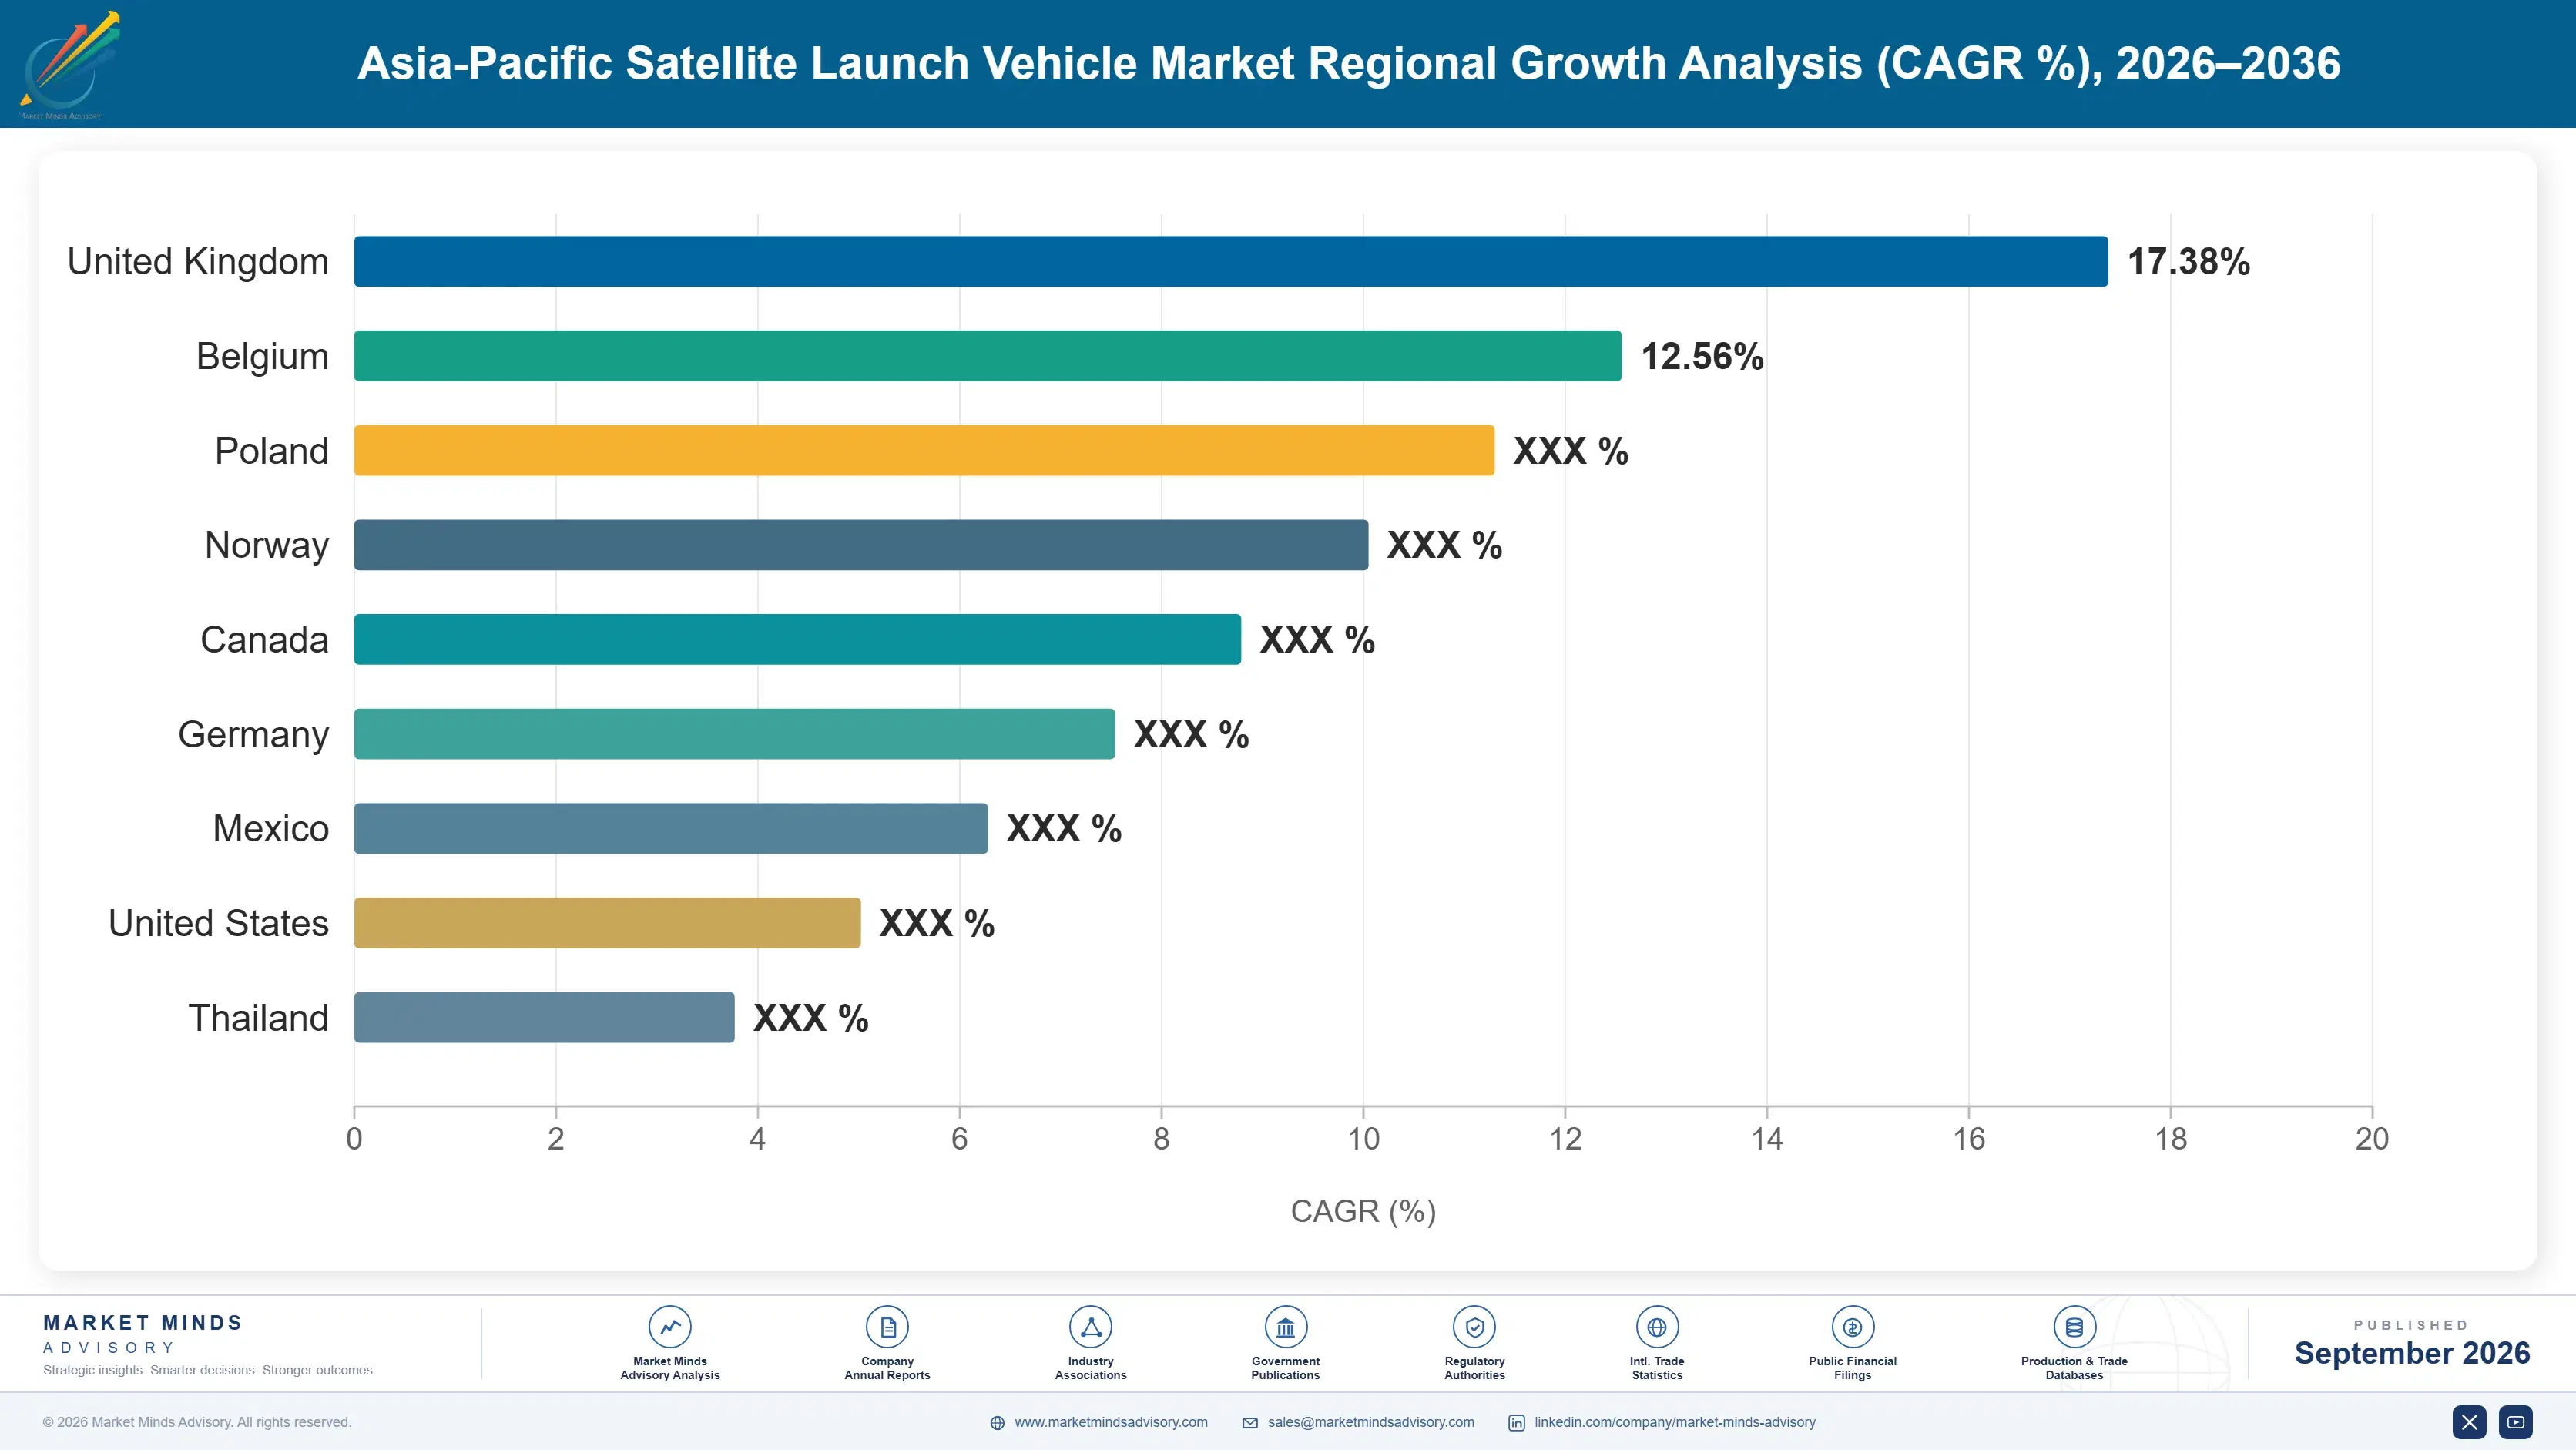
asia-pacific-satellite-launch-vehicle-market-country-cagr-analysis-1790026018868

Where Launch Operators Actually Improve Economics

Launch prices are the visible number in this market and a poor guide to returns. Pad access, cadence discipline and payload aggregation decide economics instead. The four levers below reflect positions operators have used to improve results measurably rather than to win announced contracts. Ground access underpins almost all of them. Announced prices mislead badly here.

Secure Dedicated Commercial Pad Access Early

Regional pad utilisation runs around 71% and private vehicles have historically queued behind national programmes for range time, which destroys the schedule certainty commercial customers are actually paying for. Operators holding dedicated commercial pad access rather than shared allocation achieve launch cadence roughly 2.3 times higher than those relying on negotiated slots. That cadence is what converts a vehicle programme into a business. Securing it means committing to site investment years before flight rates justify it, which most operators cannot fund. Site investment must be committed years before flight rates justify it.
Market Impact: Launch cadence improves roughly 2.3 times higher overall

Sell Schedule Certainty Rather Than Price Per Kilogram

Commercial and research payloads in this region wait for slots on sovereign vehicles that may move by quarters, and that delay costs operators mission value they can quantify precisely. Small launch firms pricing around USD 7.2 million for a dedicated mission are selling a date, not a kilogram, and customers accept premiums of roughly 44% over rideshare equivalents for it. Delivering on that promise requires cadence discipline and pad access, without which the proposition collapses on the first delayed mission. A single delayed mission destroys the entire proposition almost immediately.
Market Impact: Schedule certainty premium reaches roughly 44% higher overall

Aggregate Regional Payloads Into Dedicated Missions

Individual small payloads in the region rarely fill a vehicle, and operators flying partially loaded rockets destroy their own economics. Aggregating payloads from multiple regional customers into a dedicated mission raises effective revenue per flight substantially, and operators running structured aggregation programmes report revenue per launch roughly 38% above those selling missions individually. The work is commercial coordination and manifest management rather than engineering, which vehicle-focused organisations consistently under-resource until the economics force it. Vehicle-focused organisations under-resource this consistently, until the economics eventually force them all to act on it.
Market Impact: Revenue per launch rises roughly 38% higher overall

Defer Reusability Until Cadence Justifies It

Recovery infrastructure, refurbishment capability and inspection capacity must be amortised across flights, and the median regional vehicle flies around six times a year, which does not come close. Operators deferring reusability investment until cadence approaches the level where it closes preserve capital that expendable improvements return faster. Incremental expendable cost reduction has delivered roughly 2.7 times the return on capital that early reusability programmes have achieved regionally. The counterargument is technology positioning, which is legitimate but is not a financial case. Policy arguments and financial cases are different things entirely.
Market Impact: Expendable improvement returns roughly 2.7 times higher overall

Who Controls the Margin Pool

Concentration is 81% for the top five, measured on orbital launches conducted and contracted launch value, the basis used throughout this section, and four of those five are state bodies or state-linked enterprises. That single fact explains most of how this market behaves: pricing reflects policy rather than cost, capacity allocation follows national priority, and the gap to the next tier is a function of mandate rather than competitive performance.
Competition, where it exists, turns on three dimensions. Pad and range access decides who can actually fly on schedule. Schedule certainty decides who wins the commercial payloads that sovereign programmes leave waiting. And payload aggregation capability decides whether a small vehicle flies full or half empty, which is the difference between a business and a demonstration. Vehicle performance rarely decides anything here.

Positions will move in small launch and nowhere else meaningfully. Chinese private operators have reached orbit and are scaling cadence, Indian developers are arriving with regulatory support that did not exist five years ago, and both groups compete for roughly 19% of regional demand. Consolidation among them is likely, because the segment supports far fewer operators than are currently funded and pad access will decide which survive.
asia-pacific-satellite-launch-vehicle-market-company-positioning-matrix-1790026019398

Competitive Moat and Risk Dimensions

CHINA AEROSPACE SCIENCE AND TECHNOLOGY CORPORATION

Moat: State Mandate And Launch Infrastructure

The organisation holds the national launch mandate alongside the established vehicle family and privileged access to the launch complexes that constrain everyone else's cadence. That combination is not contestable by any commercial competitor, and it means state payload demand flows to it by policy rather than through any competitive process that another firm could win.
CHINA AEROSPACE SCIENCE AND TECHNOLOGY CORPORATION

Risk: Commercial Cost Position Gap

Vehicles designed and priced under a state programme carry cost structures that domestic commercial entrants are undercutting on the contested portion of demand. As the commercial share of regional launch grows, that cost gap becomes more visible, and a state enterprise cannot restructure its cost base with the speed a private competitor can apply to the same problem.
LANDSPACE

Moat: Methane Propulsion First-Mover Position

LandSpace reached orbit with methane propulsion ahead of any competitor globally, which gives it operational data on an engine cycle that most reusability programmes depend on. That experience matters commercially because methane handling, engine life and reuse characteristics are learned in flight rather than on test stands, and the company is several flights ahead of regional rivals.
LANDSPACE

Risk: Cadence And Pad Dependence

The company's commercial proposition depends on flight rate, and flight rate depends on pad and range access it does not control. Competing for range time against state programmes has historically meant queuing, and until dedicated commercial pad capacity is genuinely available the business cannot reach the cadence its economics and its reusability ambitions both require.

Players Tracked

Prominent Players

China Aerospace Science and Technology Corporation
Mitsubishi Heavy Industries
Indian Space Research Organisation
LandSpace
Galactic Energy

Other Key Players

China Aerospace Science and Industry Corporation
Space Pioneer
iSpace
Orienspace
CAS Space
Deep Blue Aerospace
Skyroot Aerospace
Agnikul Cosmos
Interstellar Technologies
Space One
Korea Aerospace Research Institute
Innospace
Gilmour Space Technologies
IHI Aerospace
Hanwha Aerospace

Recent Developments

MARCH 2025

Commercial launch complex capacity expands at southern Chinese coastal site

Additional commercial launch pad capacity entered service at a southern Chinese coastal site, dedicated to private operators rather than shared with national programmes. This was infrastructure commissioning rather than any corporate transaction, and it addresses the range access constraint that has limited commercial cadence directly.
Signal: Dedicated commercial pad capacity removes the queuing that has capped private operator cadence for several years now
SEPTEMBER 2024

Indian regulator approves further private launch vehicle development authorisations

India's space regulator granted further authorisations to private launch vehicle developers, extending a policy opening that began in 2020. This was a regulatory decision rather than a corporate event, and it continues building a competitive layer beneath a market that was entirely sovereign a few years ago.
Signal: Regulatory opening is creating genuine competition in a market that had none of it within living memory
JANUARY 2025

Regional operator conducts vertical landing test of recoverable first stage

A regional commercial operator conducted a vertical landing test of a recoverable first stage, progressing toward eventual operational reuse. This was a technical milestone rather than any corporate transaction, and it advances a capability whose unit economics do not yet close at regional flight rates.
Signal: Reusability progress here is real technically while remaining unjustified financially at current regional cadence levels today

What Sets Delivered Launch Cost

Four inputs dominate, and propellant is not among the large ones. Engines and propulsion hardware run roughly 32% of delivered vehicle cost, airframe structures and tankage about 21%, avionics and flight software close to 14%, and integration with range operations labour the remaining 25%. Propellant itself accounts for around 8%. Aluminium, carbon fibre and helium for tank pressurisation come from global markets no regional programme influences.
Helium supply was the constraint that bit hardest. Global helium availability tightened sharply from 2022 as production interruptions coincided with rising demand, and launch operations depend on it for tank pressurisation and purging with no practical substitute. EIA natural gas data shows the production context, since helium is recovered from gas processing. Several regional operators reported launch delays attributable to helium availability rather than vehicle readiness.

Exposure divides by scale and by state backing, which makes it competitive rather than universal. State programmes absorb input cost movements within appropriations and rarely reprice. Commercial operators on fixed-price contracts carry it directly, and their smaller purchase volumes give them worse terms on exactly the constrained inputs. Operators in countries with domestic helium recovery or aluminium production fare better, which is national endowment rather than management.
asia-pacific-satellite-launch-vehicle-market-cost-volatility-analysis-1790026019595

Contract helium supply on multi-year terms ahead of need

Helium has no practical substitute in tank pressurisation and purging, and spot availability disappeared entirely during the recent tightening. Multi-year supply agreements protected operators who signed them while competitors delayed launches. The cost is commitment against a flight rate that may not materialise, which for an operator flying six times a year is a balance sheet decision.

Design propulsion around domestically available propellants

Vehicles designed around propellants a country produces domestically remove an import dependency that constrains cadence during any supply disruption. Methane and liquid oxygen are producible almost anywhere, which is one commercial argument for methane cycles alongside the reuse case. The trade is performance against kerosene or hydrogen alternatives, which matters less at the margins than an inability to fly does.

Pool component purchasing across regional commercial operators

Individual commercial operators buy avionics, valves, composites and specialty alloys in volumes too small to command good terms, while collectively the regional commercial sector buys meaningfully. Pooled purchasing arrangements have improved terms where operators were willing to coordinate. Competitive suspicion is the obstacle rather than any practical difficulty, and it has prevented most attempts from reaching any useful scale.

Portfolio Architecture for Margin Defence

Margin architecture here is distorted by state participation in a way few markets are. Sovereign launch sits outside conventional margin analysis entirely, priced by policy and funded by appropriation. Commercial small launch sits at the bottom of the genuine margin structure, thin and dependent on cadence. Aggregation services, range and launch site operations, and engine technology licensing sit above it, all of which earn without the capital intensity of building vehicles.
The volume-versus-premium tension does not run where it does elsewhere. Volume here means sovereign programme launches that carry no competitive margin and cannot be won or lost. Premium means the contested 19% where schedule certainty commands real pricing, and where an operator that flies on time earns roughly 44% above rideshare equivalents. An operator with capacity but no pad access participates in neither, which is the position several currently occupy.

High-value pools concentrate in three places: payload aggregation and manifest management that raises revenue per flight without touching the vehicle, launch site and range operations where access scarcity gives the holder pricing power over everyone flying, and propulsion technology licensing into programmes that would rather buy an engine cycle than develop one.

Volume / Commodity-Adjacent Tier

Commercial small launch missions sold on price against competitors with similar vehicles and similar cadence problems. Thin margins entirely dependent on flight rate and manifest fill. The ten point range reflects cadence achieved, which varies enormously between operators with and without pad access.
Gross Margin: 6-16%

Premium / Certified Tier

Dedicated missions sold on schedule certainty, medium-lift commercial launch and sovereign programme support contracts. Reliability record and pad access defend pricing here. The eleven point range tracks whether an operator holds dedicated commercial pad allocation or queues for shared range time.
Gross Margin: 20-31%

Sustainability / Regulatory / Next-Generation Tier

Payload aggregation services, launch site and range operations, and propulsion technology licensing. Earned without vehicle capital intensity and priced against access scarcity. The sixteen point range spans a services business and a licensing business with entirely different economics.
Gross Margin: 34-50%
asia-pacific-satellite-launch-vehicle-market-portfolio-architecture-1790026020097

High-value Sub-segments and Strategic Watch-out

Payload Aggregation Services

Best margin available without building vehicles, raising revenue per launch roughly 38% for operators running structured manifest programmes. Commercial coordination rather than engineering is the requirement. The twelve point range reflects how differently aggregation is priced when bundled with launch against sold as a service.
Gross Margin: 38-50%

Launch Site And Range Operations

Access scarcity gives holders pricing power over everyone flying, with regional pad utilisation already around 71% and new capacity slow to arrive. Revenue tracks regional cadence rather than any single operator. The twelve point range reflects state versus commercial site ownership and the pricing latitude each allows.
Gross Margin: 34-46%

Dedicated Small Launch Missions

Fastest genuinely competitive segment at 15.2%, selling schedule certainty at premiums of around 44% over rideshare alternatives. Delivering on that promise requires cadence which pad access governs entirely. The ten point range reflects manifest fill rates, which separate viable operators from mere demonstrations quite sharply indeed.
Gross Margin: 14-24%

Reusable Vehicle Development

Fastest growing at 18.9% on development spending rather than operational flights, with unit economics that do not close at a median six launches a year. Justified on technology sovereignty instead. The ten point range reflects how much development cost is externally funded rather than carried by the operator.
Gross Margin: 4-14%

What Keeps Funding Regional Launch

The annuity here is an appropriation rather than a contract, which makes it unusually secure and unusually political at the same time. Sovereign constellation programmes generate launch demand year after year from published plans, and roughly 1,100 regional spacecraft require launch across the forecast period on vehicles chosen by policy. No commercial operator can bid for that work, but national manufacturers can plan production against it with a confidence no commercial market provides anyone.
Adoption depth separates sharply by customer type. National agencies buy the full relationship, funding vehicle development, launch operations and infrastructure together across decades. Commercial constellation and research customers buy individual missions and shop on schedule, since price differences between regional small launch operators are modest. Foreign customers sit apart entirely: interested in regional pricing, constrained by export control and by their own governments' preferences about where their spacecraft fly from.

The decision maker has changed only on the commercial side. Sovereign launch is still decided by agencies and ministries on the criteria they have always applied. Commercial payload owners, though, increasingly buy on launch date confidence rather than on price per kilogram, which rewards operators nobody would have called technically superior.
asia-pacific-satellite-launch-vehicle-market-end-use-penetration-index-1790026020591

Where Operators Should Place Effort

These are among the four positions where our research anticipates prominent divergence between winners and laggards over the coming forecast period. Each is grounded in the demand model, the regulatory perimeter, and the announced capacity pipeline.
01 / PAD ACCESS PRIORITY

Secure dedicated range access before building more vehicles

Regional pad utilisation runs around 71% and private operators have historically queued behind national programmes for range time, which destroys the schedule certainty commercial customers actually pay for. Operators holding dedicated commercial pad access achieve cadence roughly 2.3 times higher than those relying on negotiated slots, and cadence is what turns a vehicle programme into a business. Securing it means committing to site investment years before flight rates justify the expense, which most operators in this market simply cannot fund alone.
02 / SCHEDULE CERTAINTY SELLING

Price the launch date, not the kilogram to orbit

Commercial and research payloads across the region wait for slots on sovereign vehicles that move by quarters, and that delay costs mission owners value they can quantify precisely. Small launch operators pricing around USD 7.2 million for a dedicated mission are selling a date rather than a mass allocation, and customers pay premiums of roughly 44% over rideshare equivalents for it. The proposition collapses on the first delayed mission, so it depends entirely on cadence discipline and range access holding.
03 / MANIFEST FILL DISCIPLINE

Aggregate payloads or fly half-empty rockets forever

Individual regional small payloads rarely fill a whole vehicle, and operators flying partially loaded rockets destroy their own economics while appearing extremely busy. Structured aggregation across multiple regional customers raises revenue per launch by roughly 38% against selling those missions individually, which for thin-margin small launch operators is the difference between viability and continued dependence on further investment. The work is commercial coordination and manifest management rather than engineering, and vehicle-focused organisations across this region under-resource it with remarkable consistency.
04 / REUSABILITY TIMING JUDGEMENT

Defer recovery investment until cadence can amortise it

Recovery infrastructure, refurbishment capability and inspection capacity must be amortised across flights, and the median regional vehicle flies around six times a year, which does not come remotely close to closing that arithmetic at all. Incremental expendable cost reduction has returned roughly 2.7 times the capital that early regional reusability programmes have achieved. Technology sovereignty remains a legitimate reason to spend anyway, but it should be argued as policy rather than presented to investors as though it were a commercial case.

Engagement Snapshot From the Field

A live engagement with an industry participant carrying material or product regulatory and market exposure ahead of a defining policy shift, showing how our research translates into a defensible multi-year portfolio strategy.
MARKET MINDS ADVISORY · CLIENT ENGAGEMENT SUMMARY
Asia-Pacific Satellite Launch Vehicle Producer Strategic Portfolio Review and Transition Roadmap 2026·Investment Scenario on Asia-Pacific Satellite Launch Vehicle Exposure Evaluation 2025-26
CLIENT PROFILE
A commercial small launch operator with a flown orbital vehicle and roughly USD 90 million in annual revenue (client-reported, unverified by MMA). The company had achieved four launches in its best year against a business plan assuming twelve, and had responded by beginning development of a larger vehicle on the assumption that revenue per flight was the problem it needed to solve.
STRATEGIC CHALLENGE
The flight rate shortfall had nothing to do with the vehicle. Range time allocation put the company behind national programme launches repeatedly, and manifests were averaging well under half the vehicle's capacity because payloads were sold individually rather than aggregated. The board needed to know whether a larger vehicle addressed either problem before committing development capital to it.
MMA APPROACH
MMA reconstructed every launch delay by cause across three years, separating range allocation from vehicle readiness and customer readiness, and modelled revenue under three options: larger vehicle development, dedicated pad investment, and structured payload aggregation. Expert interviews with regional payload owners established what they would pay for a firm launch date.
KEY FINDINGS
  1. Range allocation rather than vehicle readiness accounted for roughly 68% of launch delay across the period examined, and a larger vehicle would not have changed any of it.
  2. Average manifest fill ran at 43% of vehicle capacity, meaning the company was flying rockets barely half loaded while planning a bigger one.
  3. Regional payload owners indicated willingness to pay premiums well above current pricing for a firm launch date, with the premium exceeding the client's entire current margin.
  4. Dedicated pad investment modelled a cadence improvement sufficient to reach the original business plan without any new vehicle development at all or additional capital.
CLIENT PROFILE
A commercial small launch operator with a flown orbital vehicle and roughly USD 90 million in annual revenue (client-reported, unverified by MMA). The company had achieved four launches in its best year against a business plan assuming twelve, and had responded by beginning development of a larger vehicle on the assumption that revenue per flight was the problem it needed to solve.
STRATEGIC CHALLENGE
The flight rate shortfall had nothing to do with the vehicle. Range time allocation put the company behind national programme launches repeatedly, and manifests were averaging well under half the vehicle's capacity because payloads were sold individually rather than aggregated. The board needed to know whether a larger vehicle addressed either problem before committing development capital to it.
MMA APPROACH
MMA reconstructed every launch delay by cause across three years, separating range allocation from vehicle readiness and customer readiness, and modelled revenue under three options: larger vehicle development, dedicated pad investment, and structured payload aggregation. Expert interviews with regional payload owners established what they would pay for a firm launch date.
KEY FINDINGS
  1. Range allocation rather than vehicle readiness accounted for roughly 68% of launch delay across the period examined, and a larger vehicle would not have changed any of it.
  2. Average manifest fill ran at 43% of vehicle capacity, meaning the company was flying rockets barely half loaded while planning a bigger one.
  3. Regional payload owners indicated willingness to pay premiums well above current pricing for a firm launch date, with the premium exceeding the client's entire current margin.
  4. Dedicated pad investment modelled a cadence improvement sufficient to reach the original business plan without any new vehicle development at all or additional capital.
RECOMMENDED STRATEGY
Phase 1: Phase 1 (six months): Pause larger vehicle development and redirect engineering effort toward cadence and turnaround on the existing vehicle instead. Phase 2: Phase 2 (16 months): Commit to dedicated commercial pad access, funded through a customer prepayment structure rather than from the balance sheet alone. Phase 3: Phase 3 (24 months): Build a structured payload aggregation function and reprice dedicated missions explicitly on launch date confidence rather than mass.
OUTCOME
The client reached nine launches in the year following pad access, against four previously (client-reported, unverified by MMA). Manifest fill rose above 70% once aggregation was resourced properly, and repricing on date confidence lifted revenue per launch materially without any change to the vehicle itself.

Frequently Asked Questions

Foundational context covering the market sizes, CAGR, scope, country, region and competition that inform every finding below. This section is provided to cover basics and most often pre-purchase conversations, answered from the MMA Primary Research Dataset.

What is the current size of the Asia-Pacific Satellite Launch Vehicle Market?

The market was worth USD 4.4 billion in 2025 and reaches USD 5.0 billion in 2026. That covers small, medium, heavy, solid-propellant, reusable and suborbital vehicles with the launch services sold against them.

How large will the Asia-Pacific Satellite Launch Vehicle Market be by 2036?

MMA forecasts USD 16.3 billion by 2036, an increase of USD 11.3 billion over the 2026 base. That represents an expansion multiple of 3.26 times across the forecast period.

What is the CAGR for the Asia-Pacific Satellite Launch Vehicle Market 2026 to 2036?

The base case CAGR is 12.6%, with a bull case of 13.9% if new pad capacity arrives on schedule and a regional reusable vehicle enters service. The bear case of 11.4% assumes site capacity slips.

Which segment is growing fastest?

Reusable first stage vehicles grow at 18.9%, half again the market rate of 12.6%. Growth reflects development programmes rather than operational flights, since the economics do not close at regional cadence.

Who are the major companies in the Asia-Pacific Satellite Launch Vehicle Market?

China Aerospace Science and Technology Corporation, Mitsubishi Heavy Industries, the Indian Space Research Organisation, LandSpace and Galactic Energy lead on launches conducted and contracted value. Space Pioneer and Skyroot follow.

Which country is growing fastest?

Within this region-scoped report, India leads at 17.4%, driven by the private sector opening and by new small vehicle pad capacity. Countries outside Asia Pacific are assessed only as supply sources.

Report Segmentation Architecture

The full report scope spans multiple orthogonal segmentation dimensions, with cross-tabulated demand data provided for each dimension pair. Coverage extends further to regional breakdowns, trend trajectories, and the competitive detail needed to support segment-level decision-making.

By Launch Vehicle Class

  • Small Launch Vehicles
  • Medium-Lift Expendable Vehicles
  • Heavy-Lift Expendable Vehicles
  • Reusable First Stage Vehicles
  • Solid-Propellant Vehicles
  • Suborbital And Test Vehicles

By End-Use Industry

  • National Space Agencies
  • Defence And Security Programmes
  • Commercial Communications Operators
  • Earth Observation Operators
  • Research And Academic Institutions

By Commercial Dimension

  • Sovereign Programme Allocation
  • Dedicated Commercial Mission
  • Rideshare And Aggregated Manifest
  • Launch Site And Range Services

By Region

  • East Asia
  • South Asia and Pacific
  • North America
  • Western Europe
  • Eastern Europe
  • Middle East and Africa
  • Latin America

Scope, Methodology, and Coverage

Every figure in this report is reproducible from documented input assumptions. The scope below maps the historical period, the forecast horizon, the segmentation dimensions, and the countries covered, alongside the underlying primary and qualitative methodology.
Historical Period
2020 to 2025
Forecast Period
2026 to 2036
Base Year
2025 (USD billions; MMA Primary Research Dataset, September 2026)
Market Definition
This report covers orbital and suborbital launch vehicles manufactured and operated across Asia Pacific, together with the launch services sold against them. Scope includes small launch vehicles, medium-lift expendable vehicles, heavy-lift expendable vehicles, reusable first stage vehicles, solid-propellant vehicles, and suborbital or test vehicles, with sovereign and commercially contestable demand assessed separately. Excluded are satellites and payloads, spaceport construction and ground infrastructure, in-space transportation and orbital transfer vehicles, missile systems, launch insurance and brokerage, and vehicles operated regionally by operators based elsewhere.
Quantitative Units
USD billions (current prices); orbital launches conducted; launch pricing by vehicle class; annual cadence per vehicle
Segmentation Dimensions
By Launch Vehicle Class; By End-Use Industry; By Commercial Dimension; By Region
Regions Covered
East Asia, South Asia and Pacific, North America, Western Europe, Eastern Europe, Middle East and Africa, Latin America
Countries Covered
China, India, Japan, South Korea, Australia, New Zealand, Singapore, Indonesia, Taiwan, Thailand, Vietnam, Malaysia, with vehicle and component supply origin also assessed across the USA, Germany, France, UK, Italy, Ukraine, Poland, Israel and Brazil
Key Companies Profiled
China Aerospace Science and Technology Corporation, Mitsubishi Heavy Industries, Indian Space Research Organisation, LandSpace, Galactic Energy, China Aerospace Science and Industry Corporation, Space Pioneer, iSpace, Orienspace, CAS Space, Deep Blue Aerospace, Skyroot Aerospace, Agnikul Cosmos, Interstellar Technologies, Space One, Korea Aerospace Research Institute, Innospace, Gilmour Space Technologies, IHI Aerospace, Hanwha Aerospace
Quantitative Methodology
Primary survey, n=3,800 respondents, Q4 2025, six countries; demand-side model with trade association cross-validation
Qualitative Methodology
47 expert interviews, Q4 2025; applied to validate demand model assumptions, identify emerging dynamics, and assess competitive positioning
Report Format
PDF and XLSX data workbook (Word format preview document)
Publisher
Market Minds Advisory
Report Code
MMA-2026-TEC-915
Published
September 2026
Contact
sales@marketmindsadvisory.com | www.marketmindsadvisory.com

Purchase the full Asia-Pacific Satellite Launch Vehicle Market Report (2026 to 2036).

The full report sizes the Asia Pacific launch vehicle market across six vehicle classes with launches conducted and pricing behind every figure, and assesses where the vehicles and their content are manufactured. It separates sovereign demand from commercially contestable demand throughout, because roughly four fifths of regional launch cannot be bid for and sizing the whole as a market badly misleads. Competitive analysis covers 20 participants on launches conducted and contracted value, including pad access and achieved cadence by operator. Range and pad capacity is modelled as the binding cadence constraint by country. Reusability economics are assessed against actual regional flight rates rather than against aspirational cadence assumptions.
Six-class sizing with launches conducted and pricing
Sovereign demand separated from contestable demand
Pad access and achieved cadence by operator
Range capacity modelled as cadence constraint by country
Reusability economics tested against real flight rates
Payload aggregation and manifest fill economics quantified

Built For The People Who Decide

From boardroom strategy to bench-side execution, this report is read cover-to-cover by leaders shaping the next decade of their industry, turning demand scenarios, market dynamics and valuation benchmarks into decisions.
CXOs/ Presidents/ VPs/ Managers
M&A and Corporate Development
Strategy Teams and R&D Heads
Procurement and Product Directors
Regulatory and Compliance Leaders
Investor Relations and Equity Analysts