Market Minds Advisory
Asia-Pacific Insurtech Market

Asia-Pacific Insurtech Market: Too Small For A Human To Touch

A typical embedded policy here sells for about 0.90 dollars and a human touching one claim costs 4.20. Automatic payout is not a refinement; it is the only arithmetic that works.

Lead Analyst

Published

September 2026

Make Smarter Decisions with Customized Research Insights

Request a free sample report and evaluate market opportunities, growth trends, and competitive dynamics relevant to your business needs.

2025 MARKET VALUE$5.8BMarket Size 2025
2036 FORECAST VALUE$27.0BBase Case , 2026 to 2036
CAGR 2026 TO 203615.0 %Bull 16.2% / Bear 13.8%
INCREMENTAL OPPORTUNITY$20.3BNet 10- year value creation
EXPANSION MULTIPLE4.05x2036 value over 2026 base
Strategic Levers
M&A Pipeline
Regional Outlook
Country Rankings
Competitive Intelligence
Segmental Deep-dive
Call-Us : 91 93563 13602

Executive Snapshot and Market Trajectory

Western insurtech chased better pricing. This region went after people who had never bought insurance at all, selling cover of around 0.90 dollars inside transactions those customers were already completing for something else entirely. Nobody in that audience had ever once met an agent.
East Asia carries 44% of value and South Asia and Pacific 38%, both far above their usual bands because this is a region-scoped market. Embedded and platform distribution grows at 22.5%, half again the market rate of 15.0%, as superapps, marketplaces and ride-hailing platforms sell micro cover to audiences no agent network was ever going to reach. Insurers accept the split because the alternative is not reaching any of those customers at all ever.
Concentration reaches only 27% across licensed digital insurers, distribution platforms and technology vendors doing genuinely different things. The binding constraint is claims cost rather than risk cost, since touching one claim manually costs 4.20 dollars against a premium that rarely reaches one. Parametric design and automatic payout are therefore not refinements at all, they are the only construction under which cover of this size can exist at all here.
Market Definition
The market covers revenue earned by insurance technology and digital distribution providers across Asia-Pacific, spanning embedded and platform distribution, automated and parametric claims processing, health services and wellness integration, digital agency and broker platforms, underwriting analytics and pricing tools, and policy administration and core systems. Underwriting profit and premium retained by licensed insurers on their own balance sheets, reinsurance, traditional agency commission on conventional products, and health provider revenue are excluded.
Base Year Value
$5.8B in 2025 (MMA Primary Research Dataset, August 2026)
Forecast Period
2026 to 2036, eleven discrete annual values
CAGR
15.0% base case. Bull 16.2%. Bear 13.8%.
Fastest Growth Segment
Embedded and Platform Distribution: 22.5% CAGR
Fastest Growth Country
India: 17.0% CAGR
Fastest Growth Region
South Asia and Pacific: 17.2% CAGR
Largest Region
East Asia: 44% of 2025 global value
Market Leaders
ZhongAn Online, PB Fintech, Grab Financial Group, Bolttech, Waterdrop. Source: MMA Analysis based on disclosed insurtech technology, distribution and services revenue, company annual reports 2025.
Primary Survey
n=3,800 procurement and R&D decision-makers, Q4 2025, six countries
Methodology
Demand-side build-up, cross-validated against public data, 47 expert interviews

Insurtech Market Forecast Scenarios

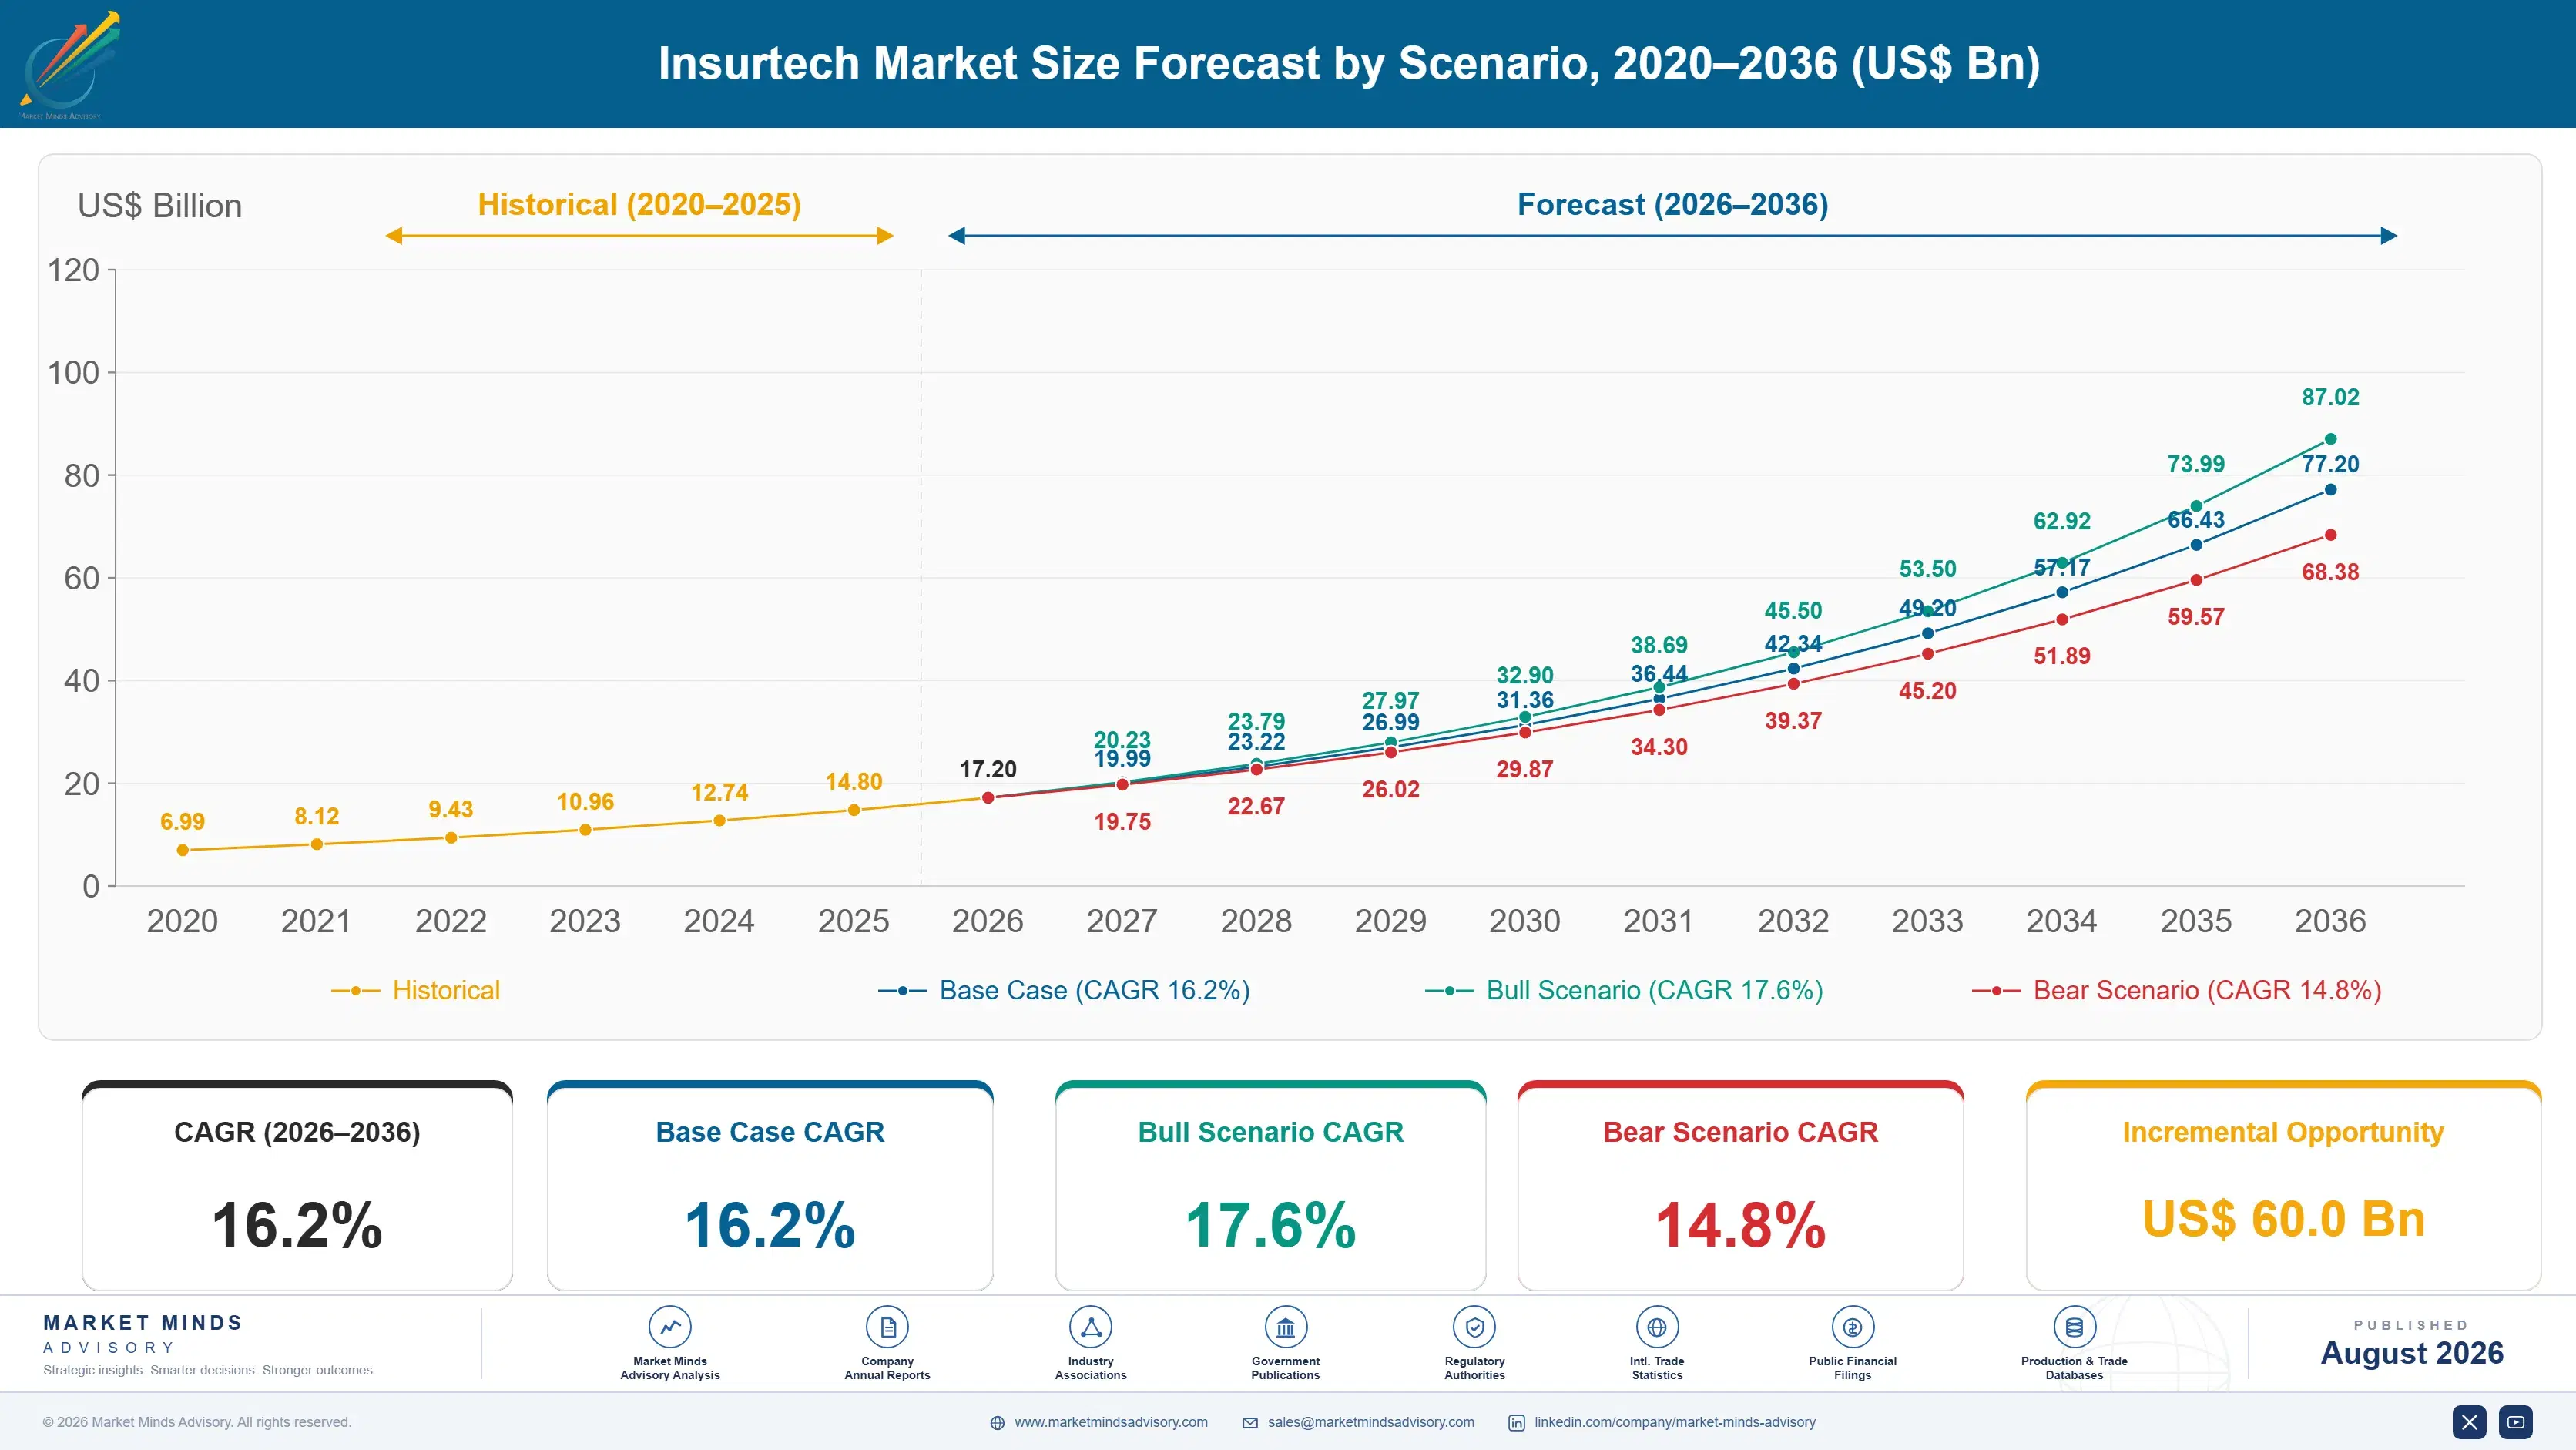
asia-pacific-insurtech-market-size-forecast-scenario-1787914675332
Insurtech demand grew unevenly from 2020 to 2025, with early-stage standalone digital-carrier experimentation giving way to accelerating embedded and parametric technology demand from 2023 onward. The market grew at a 14.7% historical CAGR, trailing the forecast pace as embedded-integration capacity only scaled meaningfully in the final two years. Buyers report growing confidence in multi-year platform planning.
The base case carries insurtech to a 16.2% CAGR through 2036 on three mechanisms. First, distribution partners keep expanding documented embedded-integration specification following point-of-sale conversion evidence. Second, insurers keep scaling capacity to meet growing AI-driven underwriting requirements across digital-first product lines. Third, emerging market carriers keep expanding capacity to serve growing underinsured populations through mobile-linked platforms. Together these mechanisms reinforce each other across multiple technology categories. Buyers increasingly treat documented integration speed as a permanent purchasing baseline.
The bull case, 17.6%, assumes embedded and parametric demand accelerates faster than currently projected as more carriers commit to expanded platform sourcing. The bear case, 14.8%, assumes integration cost volatility and legacy-system inertia cap adoption economics, keeping growth concentrated in standard core-administration volume alone. Either outcome depends heavily on relative integration cost conditions. Buyers increasingly treat documented integration stability as a core purchasing requirement.

Claims Cost Beats Risk Cost

The economics close only if nobody touches the claim. An embedded policy here sells for roughly 0.90 dollars while a single manual claim interaction costs around 4.20, which means one human review destroys the margin on hundreds of policies. Parametric design and automatic payout are therefore not product refinements. They are the only construction under which micro cover exists at all, and around 58% of claims now settle without a form.
FIVE-FIRM CONCENTRATION27%Share of category revenue held by the largest regional providers
AVERAGE EMBEDDED PREMIUM0.90Price of a typical micro cover sold at checkout
MANUAL CLAIM COST4.20Expense in dollars of touching one claim with a human
AUTOMATIC PAYOUT SHARE58%Claims settled from a data feed without any form
PLATFORM TAKE RATE34%Premium retained by the channel rather than the insurer
OUT-OF-POCKET HEALTH SPEND44%Regional medical cost paid directly by households themselves
Distribution rather than underwriting is what this region built. Superapps, marketplaces, ride-hailing platforms and mobile operators sell cover inside transactions customers were already completing, which removes acquisition cost and reaches households no agent would visit. Ride cancellation, parcel protection, device screen damage and flight delay all work this way. The platform keeps around 34% of premium for the moment rather than the product.
Health anchors this market for an uncomfortable reason. Households across much of the region pay roughly 44% of medical costs directly out of pocket, because public provision is thin and private cover was a professional class product. That gap is the largest opportunity in this market and the hardest to serve, since those who need it most can least afford anything priced to the actual risk.
"Show me a regional insurtech deck and it will talk about underwriting models. Then look at the operating account and it is a distribution agreement and a claims robot. The models are a rounding error next to what the platform takes off the top."
Director, Asia Insurance Technology Practice · MMA Insurance Technology and Distribution Practice · August 2026

Market Trends

Platforms Sell Cover Inside Somebody Else's Transaction

Superapps, marketplaces and ride-hailing applications place micro cover at the point a customer is already buying something else, which removes acquisition cost entirely and reaches households no agent network would ever have visited. That segment grows at 22.5%. The platform keeps roughly 34% of premium for supplying the moment rather than the product, and insurers accept that because the alternative is not reaching those customers at all. Nobody in this arrangement is doing anything the other could do alone, which is why both sides keep renewing it despite disliking the terms.
Market Impact: Grows Indian revenue at 17.0%
Claims Robots Rather Than Underwriting Models

Settling a claim from a flight data feed, a delivery scan or a device diagnostic costs almost nothing, while a single human interaction costs around 4.20 dollars against premiums rarely reaching one dollar. That segment grows at 19.5% and around 58% of claims now settle automatically. Providers investing in pricing sophistication while handling claims manually are optimising the smaller number and ignoring the one that decides viability. Nothing about a more accurate premium rescues a product where the handling cost exceeds the price several times over on every single claim.
Market Impact: Addresses 44% out-of-pocket spending

Market Opportunities and Growth Drivers

State-Built Distribution Rails Reach Uninsured Households

Indian reforms have created digital insurance marketplace infrastructure, composite micro products and a distribution force recruited specifically to reach households conventional channels never approached, which is an ambition no other market has attempted at comparable scale. India grows fastest at 17.0%. Providers connected to that infrastructure reach customers at costs no private distribution arrangement could match, and the rails themselves belong to nobody commercial. Integration is unglamorous, standards-driven and considerably slower than any commercial partnership would be, which is precisely why the providers that started early hold a position nobody can simply purchase.
Market Impact: Costs insurers 34% of premium

Out-Of-Pocket Health Spending Creates The Largest Gap

Households across much of the region pay around 44% of medical costs directly, because public provision is thin and private cover remained a professional class product for decades. That gap is the largest opportunity in this market and the hardest to serve properly. Health integration grows at 16.2%, generally through capped benefit products, outpatient packages and provider network arrangements rather than through anything resembling comprehensive medical cover. Insurers insisting on conventional indemnity structures are addressing a market that cannot afford them, which is a comfortable position to hold and a commercially useless one.
Market Impact: Restructures models across 4 markets

Market Restraints and Challenges

Platform Take Rates Squeeze The Underwriter Steadily

Channels keep around 34% of premium for supplying access to a customer they own outright, and that share has risen as platforms discovered how little alternative distribution exists for products of this size. Root cause is that the platform holds the relationship and the insurer holds only the licence. Commercial impact is thin retained margin. Mitigation involves direct renewal contact and owned channels, both of which compete with the partner supplying the volume. Every renewal has moved the split further in one direction and nobody has moved it back yet.
Market Impact: Yields platforms 34% of premium

Regulators Are Deciding How Much Platforms May Decide

Rules across several markets now limit how much of an insurance decision a non-licensed distributor may make, following a period when platforms effectively designed, priced and sold products while a licensed insurer carried the paper. Root cause is supervisory concern about who is genuinely responsible. Commercial impact falls on platform-led models specifically. Mitigation involves licensing the platform or restructuring the arrangement, and both reduce the speed that made these models attractive. Several platform-led arrangements have already been restructured across 4 markets, and none of them became any faster afterwards at all.
Market Impact: Settles 58% of claims automatically
3 additional market trends, 4 additional growth drivers, and 2 additional restraints and challenges are covered in the full report. Contact sales@marketmindsadvisory.com to access the complete intelligence.

Segment CAGR and Growth Architecture

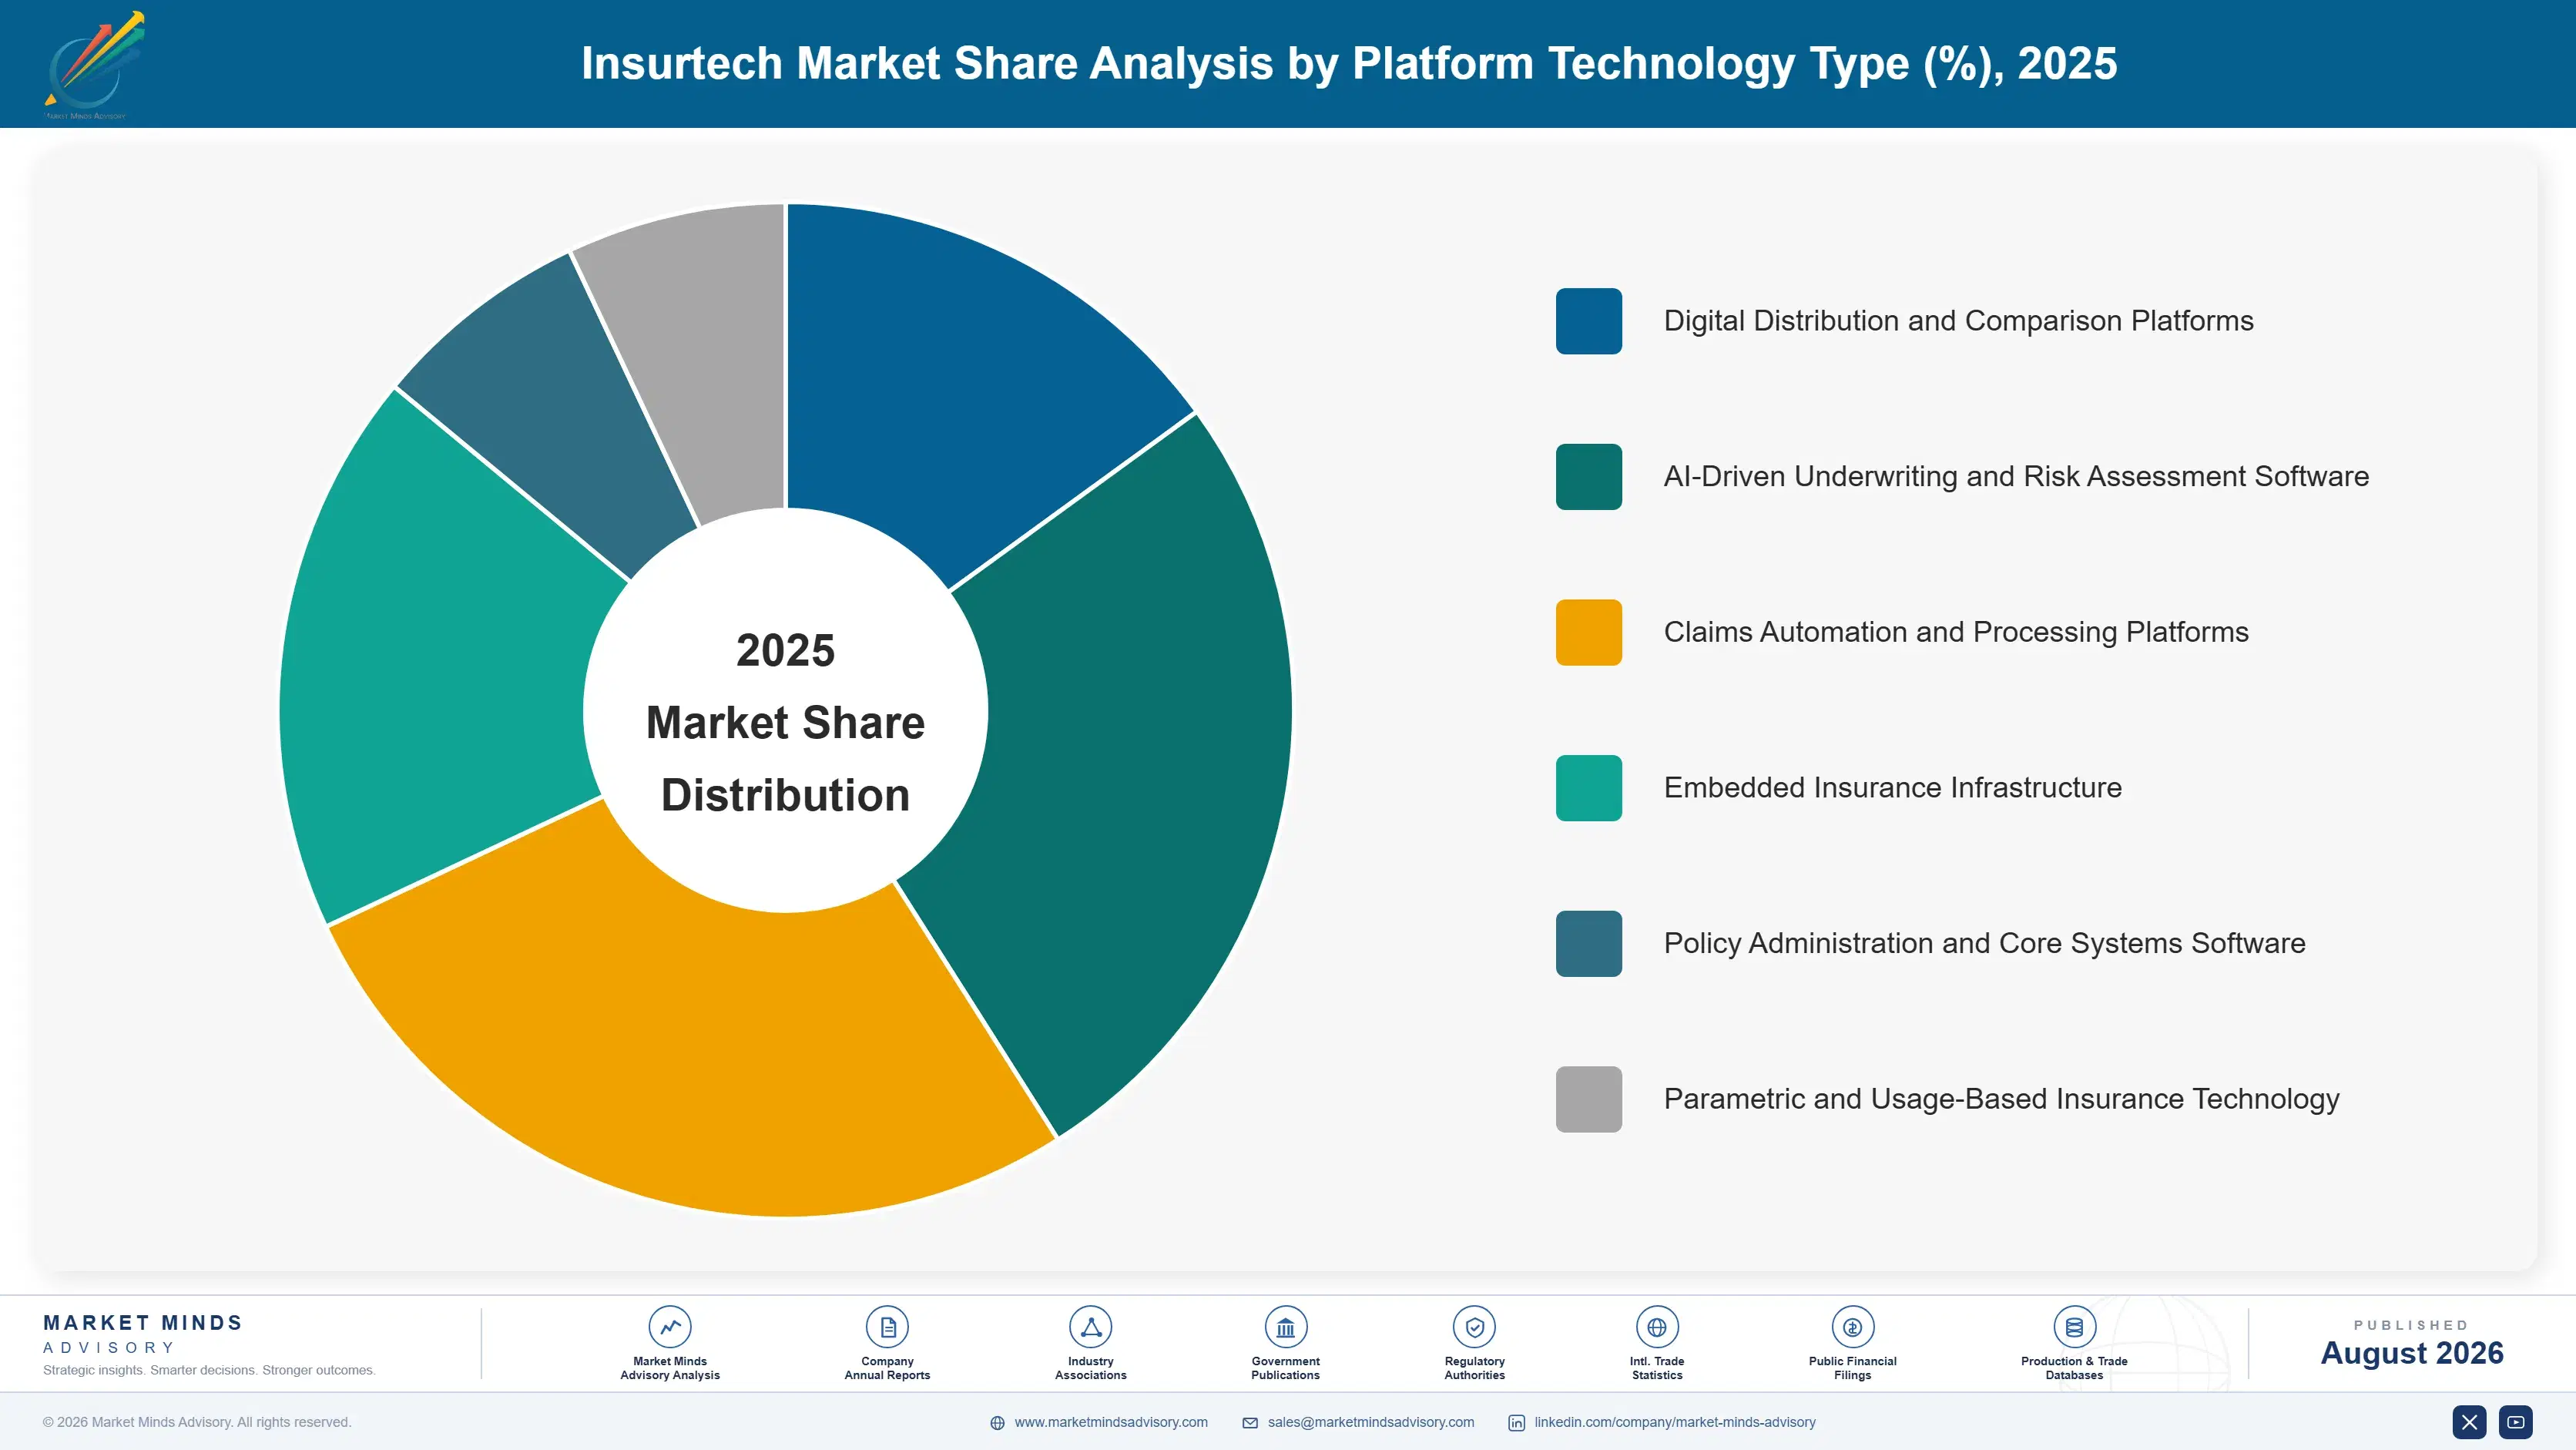
Segmentation follows the type of capability supplied, since revenue model, regulatory position and buyer all differ by capability rather than by insurance line or country. Six categories cover the market without overlap. Insurance line, customer segment and country are treated as separate commercial dimensions throughout this report rather than as segmentation logic in their own right here.
asia-pacific-insurtech-market-market-share-analysis-1787914675860

Embedded and Platform Distribution

Embedded distribution grows at 22.5%, half again the market rate of 15.0%, by placing cover inside transactions customers were already completing, which removes acquisition cost entirely and reaches households that no agent network in this region was ever going to visit. Platforms keep around 34% of premium for supplying the moment rather than the product itself. Insurers accept that split because the alternative is simply not reaching those customers, and several regulators are now asking pointed questions about who is really making the decisions. A one dollar policy cannot support any acquisition spending whatsoever, which is the entire reason this channel exists and the entire reason its terms keep worsening.
CAGR 22.5%

Automated and Parametric Claims Processing

Automated claims handling grows at 19.5% because a single human interaction costs around 4.20 dollars against premiums that rarely reach one, which means manual review destroys the margin on hundreds of policies simultaneously. Settling from a flight feed, delivery scan or device diagnostic costs almost nothing by comparison. Around 58% of claims now settle without any form at all, and the providers that built this capability early are selling something the rest of the market discovered it needed considerably later. Each data source requires separate engineering and none of that work transfers across markets, which makes the accumulated set of integrations considerably more defensible than any single connection ever looks.
CAGR 19.5%
Full segment breakdown across 6 segments available in the complete report.

Regional Architecture and Country Demand Map

This is a region-scoped market and the distribution reflects where the technology and distribution activity actually sits, with modest outward exposure through vendor and investment relationships. The two Asian regions between them together carry almost everything worth describing about this particular market at all here.

North America

Share sits at 6%, far below the standard regional band, because this is a region-scoped market and American activity appears through vendor technology and investment rather than through any operating presence. That justification is definitional rather than analytical. Core policy administration platforms sold into regional insurers originate substantially here, and the venture capital that funded much of the distribution build arrived from American investors who have since become considerably more selective about it. Regional insurers buying those platforms find them configured for markets with entirely different regulatory reporting, product structures and distribution assumptions, which means implementation costs here routinely exceed what the vendor quoted by a considerable margin indeed afterwards.
Share: 6% | CAGR: 13.8% (2026 to 2036)

Western Europe

Share sits at 6%, far below the standard regional band, for the same definitional reason. European core systems vendors hold meaningful positions supplying regional insurers with policy administration and claims platforms, competing against American incumbents rather than against anything built locally. European regulatory concepts around distribution responsibility and product oversight have influenced how several regional supervisors framed their own rules on platform-led selling arrangements. European vendors competing here face the same configuration problem their American counterparts do, since products built for indemnity insurance sold through agents adapt poorly to micro cover settled automatically from data feeds. Regional vendors have taken share on precisely that difference rather than on any price advantage.
Share: 6% | CAGR: 13.4% (2026 to 2036)
Regional intelligence for 5 additional markets available in the complete report: East Asia, South Asia and Pacific, Latin America, Middle East and Africa, Eastern Europe. Contact sales@marketmindsadvisory.com.
asia-pacific-insurtech-market-country-cagr-analysis-1787914676379

Automate Before You Underwrite Anything

Embedded premiums average 0.90 dollars against 4.20 for a manual claim, platforms keep 34% of premium, 58% of claims settle automatically and households pay 44% of health costs directly. Four levers work on claims automation, channel economics, health design and state rails rather than on pricing sophistication, which nobody at this premium size buys.

Build The Claims Robot Before The Pricing Model

A manual claim interaction costs around 4.20 dollars against premiums rarely reaching one, so a single human review destroys the margin on several hundred policies at once and no amount of pricing refinement recovers it. Settling from data feeds costs almost nothing. Providers investing in underwriting sophistication while handling claims by hand are optimising the smaller number entirely, and around 58% of the market has already worked that out. Nobody has ever recovered a claims handling cost through better risk selection alone on any policy priced under one single dollar.
Market Impact: Removes the 4.20 dollar claim handling cost entirely

Win Renewal Contact From The Platform Partner

Channels keep around 34% of premium for owning the customer moment, and that share rises steadily because insurers have no alternative route to customers of this size. Securing the right to contact a policyholder directly at renewal converts a one-off platform sale into a relationship the insurer actually holds. Platforms resist it firmly, which is exactly why it has to be negotiated at the start rather than later. A policyholder the insurer can contact is an asset, and one it cannot contact is somebody else's customer who happened to generate a premium.
Market Impact: Recovers part of that 34% platform take rate

Design Health Products Around Capped Benefits

Households pay roughly 44% of medical costs directly across much of this region, and comprehensive cover priced to the actual risk is unaffordable to precisely the people carrying that burden. Capped benefit products, outpatient packages and provider network arrangements serve it at prices that work. Health integration grows at 16.2% on exactly that design, and insurers insisting on conventional indemnity structures are addressing a market that cannot pay. Around 44% of medical cost already leaves those households directly, which is the clearest demand signal available anywhere in this entire market.
Market Impact: Serves directly into the 44% out-of-pocket health gap

Connect To Public Rails Before Competitors Do

Indian digital insurance infrastructure, composite micro products and a purpose-built distribution force together reach households at costs no private arrangement can match, and the rails belong to nobody commercial. India grows fastest at 17.0% on that foundation. Providers integrated early gain distribution economics competitors cannot buy, and the integration work is unglamorous, standards-driven and considerably slower than any commercial partnership would be. Nobody owns the rails and nobody can be bought out of them, which makes early integration a position that competitors have to build for themselves rather than acquire from anybody.
Market Impact: Follows Indian demand now growing at 17.0% annually

Who Controls the Margin Pool

Measured on disclosed insurtech technology, distribution and services revenue, the five largest providers hold a CR5 of just 27%, reflecting a market where licensed digital insurers, distribution platforms and technology vendors do genuinely different things under one label. ZhongAn Online holds a licensed digital underwriting position at scale, PB Fintech carries substantial Indian distribution, Grab Financial Group and Bolttech hold embedded distribution reach, and Waterdrop retains meaningful health positions. Nobody outside that group holds a licence, an audience and native claims technology together at once.
Three contests define activity. Embedded distribution competes for platform shelf space and take rate. Claims automation competes on integration breadth to data sources. Core systems compete against established international vendors. Each of those three rewards a completely different organisation, and hardly anybody in this market competes convincingly in more than one.

Pressure builds from platforms seeking their own licences rather than continuing to distribute for somebody else. Rankings shift toward whoever holds direct customer contact rather than the largest partner list. Partner counts have stopped explaining anything useful, since every one of those partners is quietly repricing the arrangement at each renewal it conducts.
asia-pacific-insurtech-market-company-positioning-matrix-1787914676899

Competitive Moat and Risk Dimensions

ZHONGAN ONLINE

Moat: Licensed Underwriting With Native Technology

Holding a full insurance licence while operating on technology built for automated claims and embedded distribution from the outset avoids the position most competitors occupy, where either the licence or the technology belongs to somebody else. That combination proved decisive when internet insurance rules required proper licensing. Building both took years and considerable capital.
ZHONGAN ONLINE

Risk: Single Market Regulatory Concentration

A position built overwhelmingly in one national market carries direct exposure to that market's rulemaking, which has already reshaped the sector abruptly once. Internet insurance requirements changed the competitive structure within a single year. International expansion has proved considerably harder than domestic scale suggested it would be for anybody.
BOLTTECH

Moat: Embedded Integration Across Many Markets

Operating embedded distribution across a wide set of markets and partner types produces integration experience and carrier relationships that a single-market competitor cannot assemble quickly, since each market requires separate licensing, separate carriers and separate product construction. That breadth lets the provider serve partners operating regionally rather than in one country. Replicating it means repeating the exercise market by market.
BOLTTECH

Risk: Dependence On Partner Distribution

Revenue arrives through partners who own the customer relationship and can add competitors alongside or seek their own licences entirely. Take rates are set by the party holding the audience rather than the party carrying the risk. Breadth across many partners reduces concentration without changing that underlying bargaining position at all.

Players Tracked

Prominent Players

ZhongAn Online
PB Fintech
Grab Financial Group
Bolttech
Waterdrop

Other Key Players

Acko
Digit Insurance
Turtlemint
InsuranceDekho
Qoala
Igloo
Roojai
PasarPolis
Sunday
Cover Genius
Symbo
OneConnect
Guidewire
Duck Creek Technologies
Sapiens

Recent Developments

MARCH 2025

Superapp raises embedded insurance take rate at partner renewal

A regional superapp increased the share of premium retained on embedded insurance products at contract renewal with its carrier partners. This was a commercial renegotiation rather than any product change, and carriers accepted it because no comparable route to those customers existed anywhere else at all.
Signal: The party that holds the audience sets the price and everybody else simply accepts it afterwards.
JULY 2025

State digital insurance infrastructure completes further onboarding phase

State-backed digital insurance marketplace infrastructure completed a further phase of insurer and intermediary onboarding, extending reach for composite micro products. This was a public infrastructure development rather than any commercial launch, and the distribution economics available through it are unmatched by anything available privately anywhere.
Signal: Public rails here reach households at acquisition costs that no commercial distribution arrangement can ever approach.
OCTOBER 2025

Regulator clarifies limits on distributor product design involvement

A regional supervisor clarified how much product design, pricing and underwriting involvement an unlicensed distributor may have in arrangements where a licensed insurer carries the risk. This was interpretive guidance rather than new legislation, and several platform-led models required considerable restructuring across several markets afterwards.
Signal: Supervisors are now drawing quite firm lines around who actually makes an insurance decision around here.

Take Rates, Claims, Technology

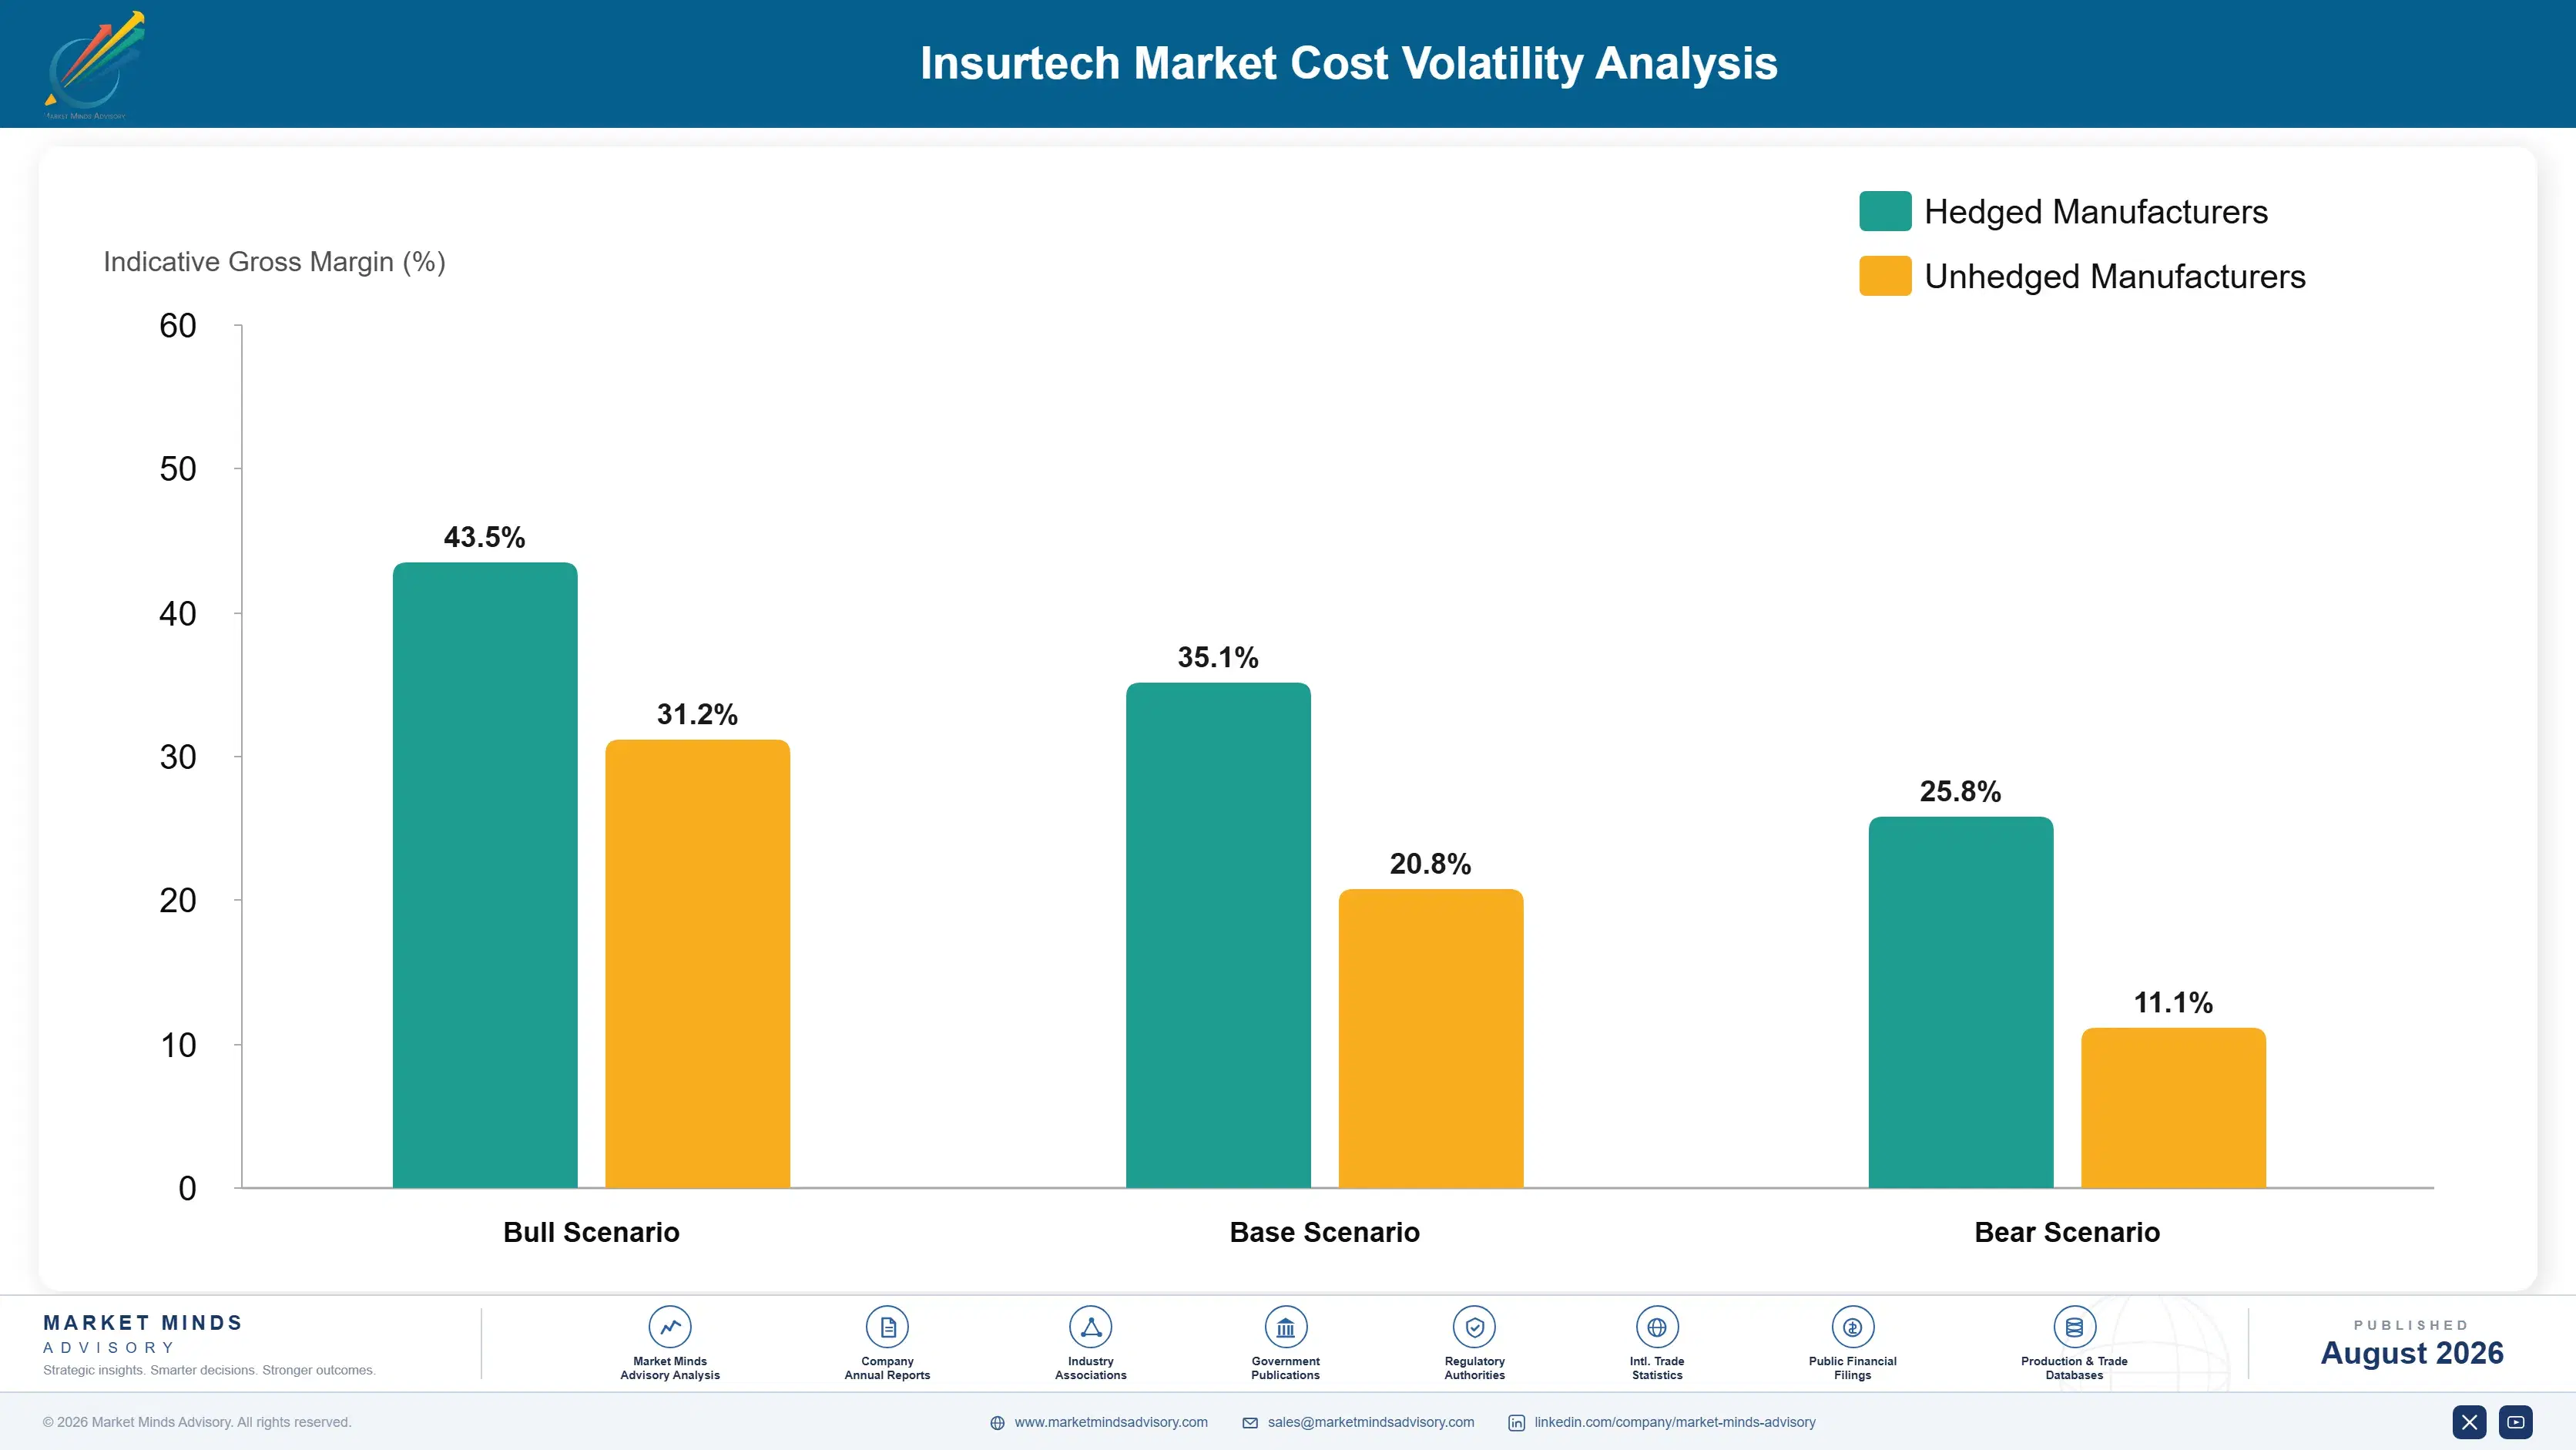
Three costs consume revenue here. Distribution partner take rates, claims handling and settlement, and technology platform with compliance operations together account for 69 to 84% of revenue at a typical provider. Take rates dominate because platforms keep around 34% of premium for supplying the customer moment, and that share has risen steadily as those platforms discovered how little alternative distribution exists for products priced under one dollar.
Two regulatory movements reset the cost base independently. Chinese internet insurance rules from 2021 required proper licensing and restricted platform underwriting involvement, which China MIIT digital economy material records alongside the wider platform adjustment. Indian regulatory reforms then built public distribution infrastructure, and ZhongAn Online Annual Report 2024 and PB Fintech Annual Report 2024 disclosures describe how differently those two approaches affected participant cost structures.

Exposure divides by whether a provider holds a licence, an audience or neither. Licensed insurers with their own technology retain underwriting result and pay no take rate. Platforms holding audiences set their own terms. Providers holding only technology sit between the two, selling to both and negotiating from the weakest position of the three, which is why so many have tried to acquire a licence or a channel.
asia-pacific-insurtech-market-cost-volatility-analysis-1787914677093

Negotiate renewal contact rights at contract inception

Platforms keep around 34% of premium and resist any direct insurer contact with policyholders, because that contact is precisely what would erode their position over time. Securing renewal rights at inception is far easier than requesting them later. It converts a one-off platform sale into a relationship the insurer actually holds and can renew.

Integrate claims to data sources rather than to forms

A manual claim interaction costs around 4.20 dollars against premiums rarely reaching one dollar, which makes human handling economically impossible at this product size. Integrating to flight feeds, delivery scans and device diagnostics requires separate engineering per data source. It is the only construction under which micro cover produces any margin at all anywhere.

Acquire either a licence or an audience deliberately

Providers holding technology alone negotiate against licensed insurers on one side and audience-owning platforms on the other, which is the weakest of the three positions available in this market. Acquiring a licence costs capital and regulatory patience, while building an audience costs marketing spend. Remaining in the middle costs margin permanently and quite continuously.

Portfolio Architecture for Margin Defence

Margin follows position in the chain rather than technical sophistication. Policy administration and core systems earn modestly against established international vendors. Underwriting analytics earn thinly, since buyers rarely pay much for pricing improvement on products this small. Digital agency platforms earn reasonably on commission. Health integration earns well where provider networks exist. Embedded distribution earns better where the provider holds the audience. Claims automation earns best, on capability that makes everything else possible.
The tension is that the fastest growing segment enriches whoever owns the customer, not whoever carries the risk. Embedded distribution grows at 22.5% while platforms keep around 34% of premium, and that share rises at every renewal because insurers have no alternative route to buyers of one dollar policies. Providers celebrating embedded volume growth are frequently describing a channel that is quietly repricing them out of their own product.

High-value pools sit in three places. Claims automation capability, which decides whether micro cover works at all and which competitors keep underinvesting in. Health provider network arrangements, which serve a 44% out-of-pocket gap that nothing else addresses affordably. And direct renewal contact with policyholders, which converts a platform transaction into something the insurer genuinely owns.

Volume / Commodity-Adjacent

Policy administration, core systems and underwriting analytics sold into regional insurers against established international vendors. The 12-point range separates providers with regional regulatory configuration built in from those adapting global products at each deployment.
Gross Margin: 14-26%

Premium / Certified

Digital agency platforms and embedded distribution where the provider carries the technology and the partner carries the audience. The 16-point spread reflects how differently owned and rented distribution perform once platform take rates are deducted.
Gross Margin: 30-46%

Sustainability / Regulatory / Next-Generation

Automated claims processing and health integration built on data source connections and provider networks respectively. The 24-point range is wide because claims automation scales almost without marginal cost while health arrangements require continuous network management.
Gross Margin: 42-66%
asia-pacific-insurtech-market-portfolio-architecture-1787914677592

High-value Sub-segments and Strategic Watch-out

Automated Claims Capability

Highest margin and near-fastest growth at 19.5%, and the capability that decides whether micro cover produces any margin at all anywhere. The risk is that each data source requires separate engineering and none of it transfers across markets. And almost nothing transfers between markets at all.
Gross Margin: 54-66%

Health Provider Networks

Strong economics serving a 44% out-of-pocket gap through capped benefit products that households can genuinely afford to buy. The risk is that provider network building is slow, local and impossible to scale across borders quickly. And that limits how fast anybody here can grow it.
Gross Margin: 40-54%

Embedded Distribution Volume

The volume core growing at 22.5% and reaching households no agent network would ever visit at any price. Providers hold it for reach, not because a 34% take rate leaves attractive economics behind. Reach is really all that it buys them, and not much else.
Gross Margin: 18-30%

Technology-Only Positioning

The strategic watch-out. Holding technology without a licence or an audience means negotiating against both from the weakest position available. The risk is permanent margin compression from two directions simultaneously. Acquiring either a licence or an audience is the only real exit from that position.
Gross Margin: 12-22%

One Tap, No Relationship

Annuity characteristics are weak in exactly the place providers assume they are strong. A micro policy sold inside a transaction lasts for that transaction and generates no renewal, no relationship and frequently no recollection that the customer bought anything at all. What recurs is the platform, which sells to millions repeatedly, and the transaction behaviour underneath it. Neither belongs to the insurer carrying the risk.
Stickiness therefore sits entirely with whoever holds the customer contact. Platforms are extremely sticky to their users through the underlying service rather than the insurance. Health arrangements stick through provider network familiarity and continuing benefit. Embedded micro cover has no stickiness whatsoever, since the customer neither chose the insurer nor remembers which one it was, and would not notice if it changed at the next renewal.

The buying decision has moved almost entirely to the platform rather than the consumer. A user taps accept on cover selected, priced and placed by an application they opened for another purpose completely. The platform decides which insurer appears and on what terms. Supervisors have noticed exactly that, and rules limiting how much of an insurance decision an unlicensed distributor may make follow from it.
asia-pacific-insurtech-market-end-use-penetration-index-1787914678078

The Robot Beats The Model

These are among the four positions where our research anticipates prominent divergence between winners and laggards over the coming forecast period. Each is grounded in the demand model, the regulatory perimeter, and the announced capacity pipeline.
01 / CLAIMS AUTOMATION PRIORITY

One human touch destroys hundreds of policies

A single manual claim interaction here costs around 4.20 dollars against the embedded premiums that average roughly 0.90 dollars, which means that one human review wipes out the margin on several hundred policies simultaneously and no pricing refinement anywhere ever recovers it. Settling instead from flight feeds, delivery scans and device diagnostics costs almost nothing at all by comparison. Providers who invest in underwriting sophistication while still handling their claims by hand are simply optimising entirely the wrong number here.
02 / RENEWAL CONTACT NEGOTIATION

Ask for the customer before you need them

Platforms here keep around 34% of the premium for simply owning the customer moment and that share rises at every single renewal, because insurers have no alternative route at all to buyers of one dollar policies anywhere in this region. Securing the right to contact any policyholder directly converts a one-off platform sale into a relationship that the insurer actually holds. Platforms resist it very firmly, which is exactly why it must be negotiated right at inception rather than afterwards.
03 / HEALTH PRODUCT DESIGN

Comprehensive cover prices out the people needing it

Households across much of this whole region pay roughly 44% of their medical costs directly out of pocket, and indemnity cover priced to the genuine underlying risk is simply unaffordable to precisely the people who are carrying that burden today. Capped benefit products, outpatient packages and provider network arrangements together serve that same gap at prices which do actually work. Insurers who insist on conventional indemnity structures are addressing a market that simply cannot possibly pay for any of them.
04 / PUBLIC RAIL INTEGRATION

State distribution costs less than anybody's channel

Indian digital insurance infrastructure, the composite micro products and a whole purpose-built distribution force together reach these households at acquisition costs that no private commercial arrangement anywhere in this region can come anywhere close to matching. India accordingly grows fastest of anywhere at all here at 17.0% on precisely that same foundation. Integration work is unglamorous, standards-driven and considerably slower than any commercial partnership would be, and the rails themselves belong to nobody commercial at all across this whole market.

Engagement Snapshot From the Field

A live engagement with an industry participant carrying material or product regulatory and market exposure ahead of a defining policy shift, showing how our research translates into a defensible multi-year portfolio strategy.
MARKET MINDS ADVISORY · CLIENT ENGAGEMENT SUMMARY
Asia-Pacific Insurtech Producer Strategic Portfolio Review and Transition Roadmap 2026·Investment Scenario on Asia-Pacific Insurtech Exposure Evaluation 2025-26
CLIENT PROFILE
A regional insurtech provider distributing embedded micro cover across three Southeast Asian markets with reported revenue of 41 million dollars (client-reported, unverified by MMA). Roughly 79% arrived through two platform partners. Claims handling was substantially manual and no direct policyholder contact rights existed under either of the two distribution agreements that were then in place.
STRATEGIC CHALLENGE
Both platform partners had raised take rates at successive renewals while claims handling cost was consuming an increasing share of what remained. Management proposed adding a third platform partner to dilute concentration. That added another counterparty with identical bargaining advantages while leaving both the claims cost and the absence of any customer relationship completely untouched.
MMA APPROACH
MMA rebuilt unit economics by product and channel, separating platform take rate from claims handling cost and retained margin. Twenty-two expert interviews with platform commercial teams, carriers, claims automation vendors and regional supervisors established where value accumulates and where it leaks. The analysis treated claims automation and renewal contact rights as the routes available forward.
KEY FINDINGS
  1. Manual claims handling was consuming more per policy than the retained margin on several product lines, and the internal reporting had never separated the two figures.
  2. Neither distribution agreement granted any right to contact policyholders directly, and neither had been negotiated with that particular question raised at all.
  3. Take rates had risen at every renewal with both partners, and the provider had accepted each increase without presenting any alternative distribution evidence.
  4. Two product lines could be settled entirely from existing partner data feeds, and no engineering work had ever been scoped to attempt it.
CLIENT PROFILE
A regional insurtech provider distributing embedded micro cover across three Southeast Asian markets with reported revenue of 41 million dollars (client-reported, unverified by MMA). Roughly 79% arrived through two platform partners. Claims handling was substantially manual and no direct policyholder contact rights existed under either of the two distribution agreements that were then in place.
STRATEGIC CHALLENGE
Both platform partners had raised take rates at successive renewals while claims handling cost was consuming an increasing share of what remained. Management proposed adding a third platform partner to dilute concentration. That added another counterparty with identical bargaining advantages while leaving both the claims cost and the absence of any customer relationship completely untouched.
MMA APPROACH
MMA rebuilt unit economics by product and channel, separating platform take rate from claims handling cost and retained margin. Twenty-two expert interviews with platform commercial teams, carriers, claims automation vendors and regional supervisors established where value accumulates and where it leaks. The analysis treated claims automation and renewal contact rights as the routes available forward.
KEY FINDINGS
  1. Manual claims handling was consuming more per policy than the retained margin on several product lines, and the internal reporting had never separated the two figures.
  2. Neither distribution agreement granted any right to contact policyholders directly, and neither had been negotiated with that particular question raised at all.
  3. Take rates had risen at every renewal with both partners, and the provider had accepted each increase without presenting any alternative distribution evidence.
  4. Two product lines could be settled entirely from existing partner data feeds, and no engineering work had ever been scoped to attempt it.
RECOMMENDED STRATEGY
Phase 1: Phase one: automate claims on the two product lines where partner data feeds already exist, since that removes cost immediately. Phase 2: Phase two: negotiate renewal contact rights into the next agreement, since asking later has never worked for anybody in this market. Phase 3: Phase three: pause the third partner discussion until the claims cost and contact rights positions have both been actually resolved first.
OUTCOME
Claims automation on two product lines removed manual handling cost within a quarter (client-reported, unverified by MMA). Renewal contact rights were secured in one of the two renegotiated agreements. The third platform discussion was paused. The concentration remedy was set aside, having proposed adding a counterparty with exactly the same bargaining advantages as the existing two.

Frequently Asked Questions

Foundational context covering the market sizes, CAGR, scope, country, region and competition that inform every finding below. This section is provided to cover basics and most often pre-purchase conversations, answered from the MMA Primary Research Dataset.

What is the current size of the Asia-Pacific Insurtech Market?

The market was worth 5.8 billion dollars in provider revenue in 2025, covering distribution, claims automation, health integration, analytics and core systems. It reaches 6.67 billion dollars in 2026.

How large will the Asia-Pacific Insurtech Market be by 2036?

MMA forecasts 26.98 billion dollars by 2036, an increase of 20.31 billion dollars over the 2026 base. That represents an expansion multiple of 4.05 times across the forecast period.

What is the CAGR for the Asia-Pacific Insurtech Market 2026 to 2036?

The base case compounds at 15.0% annually. The bull case reaches 16.2% if state distribution rails reach scale, while the bear case sits at 13.8% on rising platform take rates.

Which segment is growing fastest?

Embedded and platform distribution, at 22.5%, half again the market rate of 15.0%. Cover sold inside an existing transaction requires no acquisition spending at all.

Who are the major companies in the Asia-Pacific Insurtech Market?

ZhongAn Online, PB Fintech, Grab Financial Group, Bolttech and Waterdrop lead on disclosed revenue. Concentration is only 27%, since the participants all do genuinely different things.

Which country is growing fastest?

India at 17.0%, on state-built digital insurance infrastructure and composite micro products that no other market anywhere has attempted at anything like a comparable scale.

Report Segmentation Architecture

The full report scope spans multiple orthogonal segmentation dimensions, with cross-tabulated demand data provided for each dimension pair. Coverage extends further to regional breakdowns, trend trajectories, and the competitive detail needed to support segment-level decision-making.

By Capability Type

  • Embedded and Platform Distribution
  • Automated and Parametric Claims Processing
  • Health Services and Wellness Integration
  • Digital Agency and Broker Platforms
  • Underwriting Analytics and Pricing Tools
  • Policy Administration and Core Systems

By End-Use Industry

  • Ride Hailing and Mobility Platforms
  • E-Commerce and Marketplaces
  • Telecommunications and Device Retail
  • Travel and Hospitality
  • Banking and Payment Providers
  • Healthcare Providers and Clinics

By Commercial Dimension

  • Platform Partnership Agreements
  • Direct Digital Consumer Acquisition
  • Licensed Insurer Technology Contracts
  • Public Distribution Rail Participation
  • Agency and Intermediary Enablement
  • Reinsurer Backed Product Programmes

By Region

  • North America
  • Western Europe
  • East Asia
  • South Asia and Pacific
  • Latin America
  • Middle East and Africa
  • Eastern Europe

Scope, Methodology, and Coverage

Every figure in this report is reproducible from documented input assumptions. The scope below maps the historical period, the forecast horizon, the segmentation dimensions, and the countries covered, alongside the underlying primary and qualitative methodology.
Historical Period
2020 to 2025
Forecast Period
2026 to 2036
Base Year
2025 (USD billions; MMA Primary Research Dataset, August 2026)
Market Definition
Scope covers revenue earned by insurance technology and digital distribution providers operating across Asia-Pacific, spanning embedded and platform distribution of insurance products, automated and parametric claims processing, health services and wellness integration attached to insurance products, digital agency and broker platforms, underwriting analytics and pricing tools, and policy administration and core systems supplied to insurers. Underwriting profit and premium retained by licensed insurers on their own balance sheets, reinsurance premium and commission, traditional face-to-face agency commission on conventional life and general products, healthcare provider treatment revenue, and consumer banking or payment revenue unconnected to insurance distribution are excluded from the market size and all derived figures.
Quantitative Units
USD billions of provider revenue (current prices); policies distributed in millions; average embedded premium in USD; claims handling cost per claim in USD; platform take rate as percentage of premium
Segmentation Dimensions
By Capability Type; By End-Use Industry; By Commercial Dimension; By Region
Regions Covered
North America, Western Europe, East Asia, South Asia and Pacific, Latin America, Middle East and Africa, Eastern Europe
Countries Covered
China, India, Japan, Indonesia, South Korea, Singapore, Vietnam, Thailand, Australia, Malaysia, Philippines, Hong Kong, Taiwan, New Zealand, Bangladesh
Key Companies Profiled
ZhongAn Online, PB Fintech, Grab Financial Group, Bolttech, Waterdrop, Acko, Digit Insurance, Turtlemint, InsuranceDekho, Qoala, Igloo, Roojai, PasarPolis, Sunday, Cover Genius, Symbo, OneConnect, Guidewire, Duck Creek Technologies, Sapiens
Quantitative Methodology
Primary survey, n=3,800 respondents, Q4 2025, six countries; demand-side model with trade association cross-validation
Qualitative Methodology
47 expert interviews, Q4 2025; applied to validate demand model assumptions, identify emerging dynamics, and assess competitive positioning
Report Format
PDF and XLSX data workbook (Word format preview document)
Publisher
Market Minds Advisory
Report Code
MMA-2026-TEC-261
Published
August 2026
Contact
sales@marketmindsadvisory.com | www.marketmindsadvisory.com

Purchase the full Asia-Pacific Insurtech Market Report (2026 to 2036).

The full report runs to 185 pages and covers all six capability types, seven regions and 20 profiled providers in detail. It includes the complete segment CAGR set, unit economics modelled against claims handling cost at micro premium levels, and analysis of platform take rates across partner types and markets. Company profiles carry evaluation on disclosed insurtech technology, distribution and services revenue, with moat and risk assessment for the top five providers. The competitive section extends to 15 tracked regulatory, distribution and product developments across 2024 and 2025. Primary research inputs include a quantitative survey of 3,800 respondents and 47 expert interviews conducted in Q4 2025.
Six capability types with individual CAGR forecasts
Seven regions with domestic activity and outward exposure separated
Twenty provider profiles on consistent revenue evaluation basis
Fifteen tracked regulatory and distribution developments with commercial interpretation
Unit economics modelled against claims handling cost per policy
Platform take rates compared across partner types and markets

Built For The People Who Decide

From boardroom strategy to bench-side execution, this report is read cover-to-cover by leaders shaping the next decade of their industry, turning demand scenarios, market dynamics and valuation benchmarks into decisions.
CXOs/ Presidents/ VPs/ Managers
M&A and Corporate Development
Strategy Teams and R&D Heads
Procurement and Product Directors
Regulatory and Compliance Leaders
Investor Relations and Equity Analysts